
Abstract
Pitch Lake in Trinidad and Tobago is a natural asphalt reservoir nourished by pitch seepage, a form of petroleum that consists of mostly asphaltines, from the surrounding oil-rich region. During upward seepage, pitch mixes with mud and gases under high pressure, and the lighter portion evaporates or is volatilized, which produces a liquid asphalt residue characterized by low water activity, recalcitrant carbon substrates, and noxious chemical compounds. An active microbial community of archaea and bacteria, many of them novel strains (particularly from the new Tar ARC groups), totaling a biomass of up to 107 cells per gram, was found to inhabit the liquid hydrocarbon matrix of Pitch Lake. Geochemical and molecular taxonomic approaches revealed diverse, novel, and deeply branching microbial lineages with the potential to mediate anaerobic hydrocarbon degradation processes in different parts of the asphalt column. In addition, we found markers for archaeal methane metabolism and specific gene sequences affiliated with facultative and obligate anaerobic sulfur- and nitrite-oxidizing bacteria. The microbial diversity at Pitch Lake was found to be unique when compared to microbial communities analyzed at other hydrocarbon-rich environments, which included Rancho Le Brea, a natural asphalt environment in California, USA, and an oil well and a mud volcano in Trinidad and Tobago, among other sites. These results open a window into the microbial ecology and biogeochemistry of recalcitrant hydrocarbon matrices and establish the site as a terrestrial analogue for modeling the biotic potential of hydrocarbon lakes such as those found on Saturn's largest moon Titan. Key Words: Bacteria—Archaea—Hydrocarbons—Asphalt—Methane—Extremophile—Titan. Astrobiology 11, 241–258.
1. Introduction
M
Previous surveys of low- and high-temperature subsurface petroleum reservoirs (Bastin et al., 1926; Orphan et al., 2000; Grabowski et al., 2005; Li et al., 2006, 2007; Dahle et al., 2008; Jones et al., 2008; Gray et al., 2009; Pham et al., 2009), natural asphalts (Kim and Crowley, 2007), oil sands (Voordouw et al., 1996; Kato et al., 2001; Dahle et al., 2008; Pel et al., 2009), and coal-bed seams (Strapoc et al., 2008), in which cultivation methods or cultivation-independent methods were used, have identified physiologically diverse microbial communities (reviewed in Roling et al., 2003, and Magot, 2005). While the presence of facultative or obligate aerobic microorganisms within produced waters from low- and high-temperature subsurface petroleum reservoirs is consistent with anthropogenic disturbance, for example, injection or recycling practices, the widespread identification of novel and deeply branching anaerobic microorganisms is consistent with the existence of autochthonous or indigenous hydrocarbon microbiomes adapted for growth and survival in subsurface environments over geological time (Roling et al., 2003; Magot, 2005). Biochemical innovations arising from this gene pool are likely to include anaerobic pathways for the conversion of alkanes and recalcitrant hydrocarbons into biomass and energy; adaptation to environmental stressors, for example, elevated temperature; decreased water activity and chemical mutagens; and cooperation strategies associated with syntrophic modes of growth within structured assemblages or biofilms. A focus of this study was placed on functional gene markers and gene sequences known to be involved in hydrocarbon degradation (such as toluene dioxygenase and alkane monooxygenase for aerobic pathways), as hydrocarbon degradation was assumed to be the most prevalent metabolic pathway in the asphalt lake.
Indeed, the identification of microorganisms from subsurface petroleum reservoirs has helped fuel the conceptual development of the “deep hot biosphere,” a biotic realm that operates several kilometers beneath the surface of Earth and is uncoupled from photosynthetic biomass conversion (Gold, 1992; Aitken et al., 2004; D'Hondt et al., 2004; Roussel et al., 2008).
Here, we describe the microbial community structure and geochemical properties of naturally occurring liquid asphalt in Pitch Lake, Trinidad and Tobago, to better constrain biogeochemical controls and metabolic processes within recalcitrant hydrocarbon matrices under elevated temperatures and low water activities. We charted the spatial variability of microbial community structure in different asphalt-column compartments and employed multivariate statistical approaches to explore putative linkages between community structure and sample properties. The resulting data sets were placed in a robust phylogenetic context with respect to hydrocarbon-rich environments and used to identify conserved community composition patterns within subsurface petroleum reservoirs extensible to the search for life on other planetary bodies harboring liquid hydrocarbon features, such as those found on Saturn's largest moon Titan (Schulze-Makuch and Grinspoon, 2005; McKay and Smith, 2005; Baross et al., 2007; Shapiro and Schulze-Makuch, 2009).
2. Material and Methods
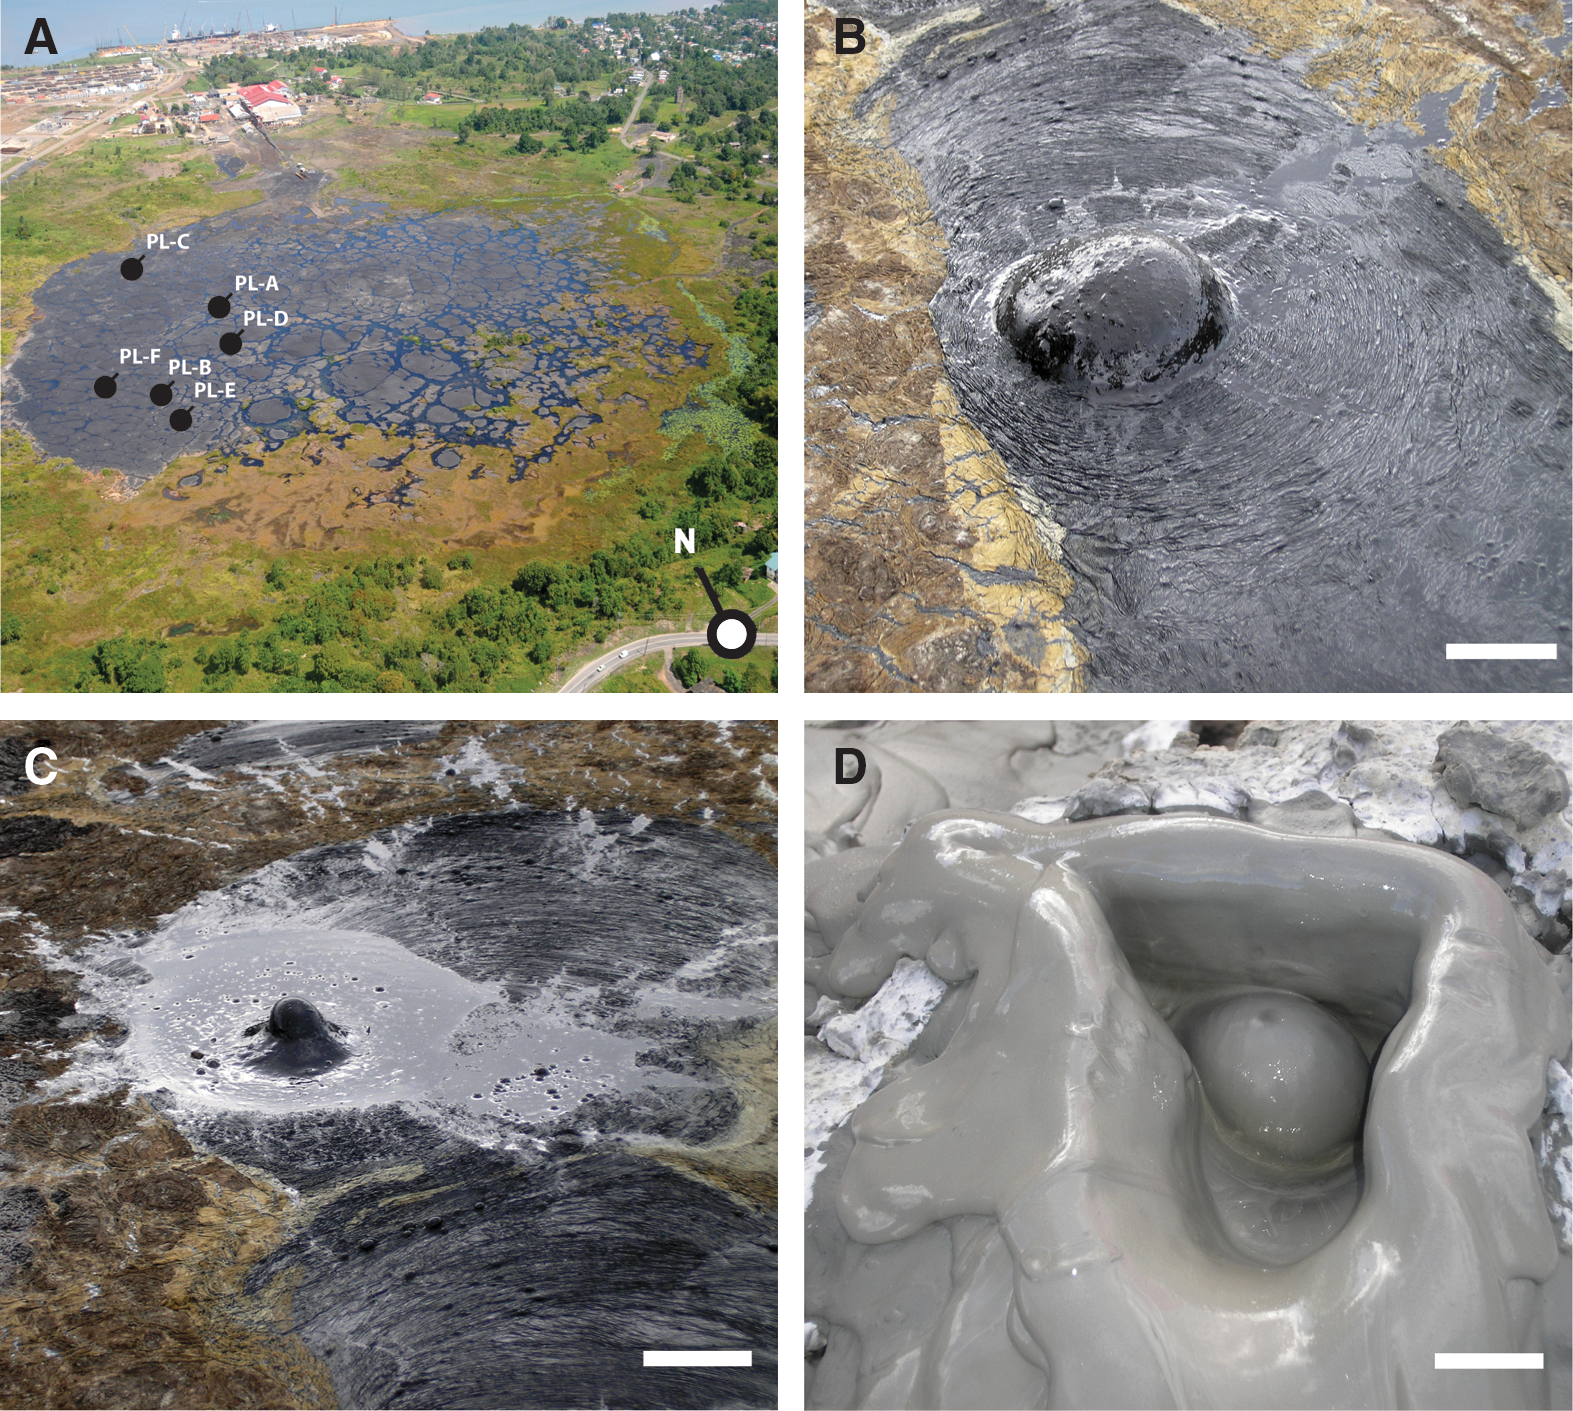
We collected six samples from Pitch Lake (PL-A through PL-F) for geochemical analysis, four of which (PL-A through PL-D) were also used for biological characterization (Fig. 1A and Table 1). Comparative reference samples were also collected from an adjacent oil well (OP) and a nearby terrestrial mud volcano (MV; Fig. 1D) known as Devil's Woodyard.
(
PL, Pitch Lake; OP, oil well; MV, mud volcano.
ND, not determined.
2.1. Field activities
Samples were collected from the asphalt lake with latex sampling gloves in sterile sampling bottles and were described in situ. Water activity measurements were taken in the field with a Decagon paw-kit water activity meter on select samples. Gas bubbles were identified and sampled in the field with a syringe, which was purged of ambient air and flushed with nitrogen prior to sampling. Methane gas emanating from the gas bubbles was also measured in situ with an open-path, hand-held laser system for the detection of methane gas (Van Well et al., 2005).
2.2. Gas analyses
Syringes with gas samples were shipped on ice to Dr. Sherwood Lollar's laboratory at the University of Toronto. The composition of inorganic gases (helium, hydrogen, oxygen, nitrogen, and carbon dioxide) was analyzed by injection of 300 μL of sample in a Varian 3800 gas chromatograph equipped with a micro-thermal conductivity detector. The gases were separated through a 0.32 mm internal diameter, 30 m long molecular sieve column with an argon carrier gas flow of 1 mL/min. The column oven temperature program started at 30°C for 7 min. Then the column was heated to 90°C with a ramp of 10°C/min and then to 200°C at 30°C/min. The column was held at 200°C for 20 min.
The composition of organic gases (hydrocarbons from methane to pentane) was analyzed by injection of 300 μL of sample in a Varian 3400 gas chromatograph equipped with a flame ionization detector. The gases were separated through a 0.52 mm internal diameter, 30 m long GSQ column with a helium carrier gas flow of 7 mL per minute. The column oven temperature program started at 50°C for 5 min. Then the column was heated to 200°C with a ramp of 25°C/min and held at this temperature for 5 min. Standards were run with the samples at known concentrations the same day. All samples were run in duplicate and mean values reported. Uncertainties in reported concentrations are within ± 5%.
Carbon isotope analyses of organic gases were conducted on a GC-C-isotope ratio mass spectrometer (IRMS) system composed of a Varian 3400 capillary gas chromatogram and an oxidation oven at 980°C interfaced directly to a Finnigan 252 gas source mass spectrometer. Carbon dioxide, methane, ethane, propane, butanes, and pentanes were analyzed on a 60 m GSQ column (i.d. 0.32 mm). The temperature program, which started at 35°C, was held for 6 min, ramped up to 110°C at 3°C/min and then to 220°C at 5°C/min, and then held for 5 more minutes. All samples were run in duplicate, and mean values were reported. Total uncertainty, incorporating both accuracy and reproducibility, was ± 0.5‰ with respect to Vienna Pee Dee Belemnite standard.
2.3. Bulk isotope analyses
Bulk isotope results were obtained with an IRMS. Samples for carbon and nitrogen isotopic analysis were converted to CO2 with an elemental analyzer (ECS 4010, Costech Analytical, Valencia, CA). These two gases were separated with a 3 m GC column and analyzed with a continuous flow IRMS (Delta PlusXP, Thermofinnigan, Bremen, Germany) at the Laboratory of Biotechnology and Bioanalysis at Washington State University. In addition, select samples were analyzed at IsoAnalytical in Crewe, UK, also with an elemental analyzer and IRMS. The samples were first converted to pure N2 and CO2 to permit analysis by IRMS. The samples were placed in clean tin capsules and loaded into an automatic sampler. They were then dropped into a combustion furnace held at 1000°C where they were combusted in the presence of an excess of oxygen. The tin capsules flash combust, which causes the temperature in the vicinity of the sample to rise to ca. 1700°C. The gaseous products of combustion were swept in a helium stream over a Cr2O3 combustion catalyst, CuO wires to oxidize hydrocarbons, and silver wool to remove sulfur and halides. The resultant gases (N2, NOx, H2O, O2, and CO2) were then swept through a reduction stage of pure copper wires held at 600°C. This removed any remaining oxygen and converted NOx gases to N2. Water was removed with a magnesium perchlorate trap, while removal of CO2 was accomplished by using a selectable Carbosorb trap. Nitrogen and carbon dioxide were separated by a packed column gas chromatograph held at an isothermal temperature. The resultant chromatographic peaks sequentially entered the ion source of the IRMS, where they were ionized and accelerated. Gas species of different mass were separated in a magnetic field and simultaneously measured by a Faraday cup universal collector array. For N2, masses 28, 29, and 30 were monitored, and for CO2, masses 44, 45, and 46 were monitored. The results for carbon-13 that run at both labs were statistically the same.
For the determination of sulfur-34, the samples were first converted to pure SO2 to permit analysis by IRMS. Samples were placed in clean tin capsules and loaded into an automatic sampler. They were then dropped into a combustion furnace held at 1080°C, where they were combusted in the presence of an excess of oxygen. The tin capsules flash combust, causing the temperature in the vicinity of the sample to rise to ca. 1700°C. The gaseous products of combustion were then swept in a helium stream through tungstic oxide and zirconium oxide combustion catalysts and then reduced over high-purity copper wires. Water was removed with a Nafion membrane, which is permeable to only water. Sulfur dioxide was separated by a packed column gas chromatograph held at an isothermal temperature. The resultant SO2 chromatographic peak entered the ion source of the IRMS, where it was ionized and accelerated. Gas species of different mass were separated in a magnetic field and simultaneously measured by a Faraday cup universal collector array. For SO2, masses 64, 65, and 66 were monitored.
2.4. Amino acid analyses
The samples for amino acid analysis were dissolved with dimethyl sulfoxide and analyzed with the Mars Organic Analyzer, which is housed at the University of Berkeley, CA. The Mars Organic Analyzer is a microfabricated capillary electrophoresis instrument for sensitive amino acid analysis (Skelley et al., 2005). The microdevice consists of a four-wafer sandwich that combines glass capillary electrophoresis separation channels, microfabricated pneumatic membrane valves and pumps, and a nanoliter fluidic network.
2.5. Phospholipid fatty-acid analysis
Phospholipid fatty-acid (PLFA) analysis was conducted by using a modified Bligh and Dyer method (White et al., 1979). A one-phase chloroform-methanol buffer was used as an extractant. Lipids were recovered, dissolved in chloroform, and fractionated on silicic acid columns into polar-, neutral-, and glycol-lipid fractions. The PLFA was recovered as methyl esters in hexane by transesterfying the polar fraction with mild alkali solution. PLFA were then analyzed by gas chromatography with peaks being confirmed via electron impact mass spectrometry.
2.6. DNA extraction
Samples were ground to a fine powder under liquid nitrogen with a porcelain mortar and pestle. Genomic DNA was extracted from ∼10 g of powdered asphalt per sample with the PowerMax Soil DNA isolation kit according to the manufacturer's instructions (Mo Bio, Carlsbad, CA). Dilute samples were washed three times in 2 mL Tris-EDTA buffer (pH 8.0) and concentrated down to ∼200 μL by using Amicon Ultra centrifugal filter devices (Millipore, Bellerica, MA). The resulting concentrated samples were quantified with the Quant-iTTM PicoGreen dsDNA reagent (Molecular Probes, Eugene, OR) according to the manufacturer's instructions. Sample concentrations varied between 0.1 and 1.0 ng/μL, which corresponds to ∼10–20 ng DNA per gram asphalt. Sample color varied between clear translucent to brown or yellow tinged, which is consistent with the persistent presence of humic acid or hydrocarbon residues.
2.7. Quantitative polymerase chain reaction of small subunit ribosomal RNA genes
Total bacterial and archaeal small subunit ribosomal RNA (SSU rRNA) gene copy number was determined by quantitative polymerase chain reaction (qPCR) with either bacterial-specific (27F, 5′-AGAGTTTGATCCTGGCTCAG) or archaeal-specific (20F, 5′-TTCCGGTTGATCCYGCCRG) forward primers coupled to a universal reverse primer (DW519R, 5′-GNTTTACCGCGGCKGCTG) in SYBR Green Supermix (Bio-Rad, Hercules, CA). Reactions were carried out in low tube strips or 96-well white qPCR plates and run on an Opticon 2 DNA engine real-time PCR detection system (Bio-Rad, Hercules, CA) as described previously (Zaikova et al., 2010). Following the sample run, a melting curve from 55°C to 95°C, held at each 0.5°C increment for 1 s, was performed to check for reaction specificity. Only sample runs that exhibited melting curve profiles indicative of single amplicon reactions were used in data analysis. Real-time data was analyzed with the MJ Opticon Monitor Analysis Software version 3.1 (Bio-Rad, Hercules, CA).
Standards used for bacterial and archaeal qPCR quantification were prepared with the Qiagen Plasmid Midi kit (Qiagen, Mississauga, ON) followed by plasmid-safe DNase treatment (Epicenter Biotechnologies, Madison, WI) to remove residual E. coli genomic DNA according to manufacturer's instructions. After enzyme treatment and heat inactivation, standards were extracted with phenol-chloroform-isoamyl alcohol (25:24:1) followed by three rounds of buffer exchange with Tris-EDTA pH 8.0, using an Amicon Ultra 4 10K filter (Millipore, Carrigtwohill, County Cork). The resulting concentrated DNA solution was quantified by using the Quant-iT PicoGreen dsDNA reagent (Molecular Probes, Eugene, OR) according to the manufacturer's instructions. A 10-fold dilution series for each standard, ranging from 101 to 108 copies, was used in real-time analysis. Negative controls were also included to determine background amplification and primer dimer formation in SYBR Green qPCR. For the purposes of this study, the limit of detection of SSU rRNA gene copy number was established based on a comparison of dissociation curves and cycle number thresholds (CT) (Heid et al., 1996) for all sample replicates to be ∼2 × 10² copies/μL DNA.
2.8. qPCR of functional gene markers
Functional markers for toluene dioxygenase (tod) (Baldwin et al., 2003), alkane monooxygenase (alkB) (Whyte et al., 1997), methyl coenzyme M reductase alpha (mcrA) (Hales et al., 1996), and particulate methane monooxygenase alpha (pmoA) (Kolb et al., 2003) were quantified with Bio-Dechlor CENSUS real-time polymerase chain reaction (PCR), which is available through Microbial Insights (
2.9. PCR amplification of SSU rRNA genes
Small subunit rRNA gene sequences were amplified with the primers B27F (see section above) and U1492R (5′-GGTTACCTTAGTTACGACTT) for bacteria and A20F (see section above) and A958R (5′-YCCGGCGTTGAMTCCAATT) for archaea with use of the following PCR profile: 3 min at 94°C followed by 30 cycles of 95°C for 20 s, 55°C for 20 s, 72°C for 1 min, and a final extension of 10 min at 72°C. Each 50 μL reaction contained 1 μL of template DNA, 1.25 μL each 10 μM forward and reverse primer, 2.5 U Hercules II proofreading polymerase (Stratagene, La Jolla, CA), 5 μL 10 mM deoxynucleotides, 41.5 μL 1× buffer containing 2 mM MgCl2.
2.10. PCR amplification of methyl coenzyme M reductase subunit A genes
With the exception of PL-C and PL-D, M reductase subunit A (mcrA) gene sequences were amplified from PL, OP, and MV samples with the primers ME1 (5′-GCMATGCARATHGGWATGTC) and ME2 (5′-TCATKGCRTAGTTDGGRTAGT) (Hales et al., 1996) with use of the PCR profile: 3 min at 94°C followed by 35 cycles of 94°C for 45 s, 50°C for 45 s, 72°C for 1.5 min, and a final extension of 5 min at 72°C. Each 50 μL reaction contained 1 μL of template DNA, 1.25 μL each 10 μM forward and reverse primer, 1 μL Herculase II fusion DNA polymerase (Stratagene, La Jolla, CA), 5 μL 10 mM deoxynucleotides, 10 μL 5× Herculase II reaction buffer, and 30.5 μL of distilled water. In the case of PL-C and PL-D, we used the Epicentre FailSafe PCR PreMix Selection kit according to the manufacturer's specifications. With use of the same profile described above, FailSafe amplification yielded sufficient PL-D product for downstream cloning. However, PL-C remained refractory to mcrA clone library production and was therefore excluded from the study.
2.11. Clone library construction and screening
Amplicons were visualized on 1% agarose gels in 1 × TBE and purified with the Qiaquick Gel Extraction kit (Qiagen, Valencia, CA) according to the manufacturer's instructions. Samples were eluted in 30 μL of sterile filtered water (pH 7.5) and concentrated down to ∼ 6 μL with a SpeedVac system. In preparation for Topo-TA cloning, 3′ A-overhangs were added by incubating the purified DNA sample for 15 min at 72°C in the presence of 1 U of BioShop Taq (Canada) and 2.5 mM dATP in 2 μL 1 × PCR buffer containing 2.5 mM MgCl2. From this reaction, 4 μL was used in a TA cloning reaction [pCR4-TOPO TA cloning kit for sequencing and transformed into chemically competent Mach-1-T1R cells according to the manufacturer's instructions (Invitrogen, Carlsbad, CA)]. Transformants were picked into 96-well plates containing 180 μL Luria broth, supplemented with 50 μg/mL kanamycin and 10% glycerol, and grown overnight at 37°C prior to storage at −80°C. Inserts were amplified directly from glycerol stocks with M13F (5′-GTAAAACGACGGCCAG) and M13R (5′-CAGGAAACAGCTATGAC) primers by using the SSU rRNA gene PCR protocol with an additional 10 min at 94°C added to the very beginning of the PCR profile to ensure adequate cell lysis.
One 96-well plate per sample was selected for restriction fragment length polymorphism (RFLP) analysis, that is, DNA fingerprinting, by using the common 4-base cutter Rsa I (Invitrogen, Carlsbad, CA). Each digestion reaction consisted of 2 μL of 10 × React 1 buffer, 5 μL of M13 amplified PCR product, 13 μL of sterile filtered water, and 5 U of Rsa I. Reactions were incubated for 2 hours at 37°C followed by Rsa I inactivation at 65°C for 10 min. Restriction patterns were visualized by running 5 μL of each Rsa I digestion mixture on a 2% agarose gel (20 cm in width) in 1 × TBE for 90 min at 120 V. SSU rRNA and mcrA gene clones that exhibited unique restriction patterns were selected for Sanger sequencing through the McGill University and Genome Quebec Innovation Centre (Montreal, Quebec, Canada). A total of 492 archaeal and 496 bacterial SSU rRNA gene and 406 mcrA clones were screened, which provided 65, 72, and 74 unique restriction patterns, respectively, for downstream sequencing and taxonomic identification. Sequence data were collected on an ABI Prism 3100 DNA sequencer (Applied Biosystems, Inc., Foster, CA) by using Big Dye chemistry (PE Biosystems, Foster, CA) according to manufacturer's instructions. Plasmids were bidirectionally sequenced with M13F and M13R primers. Sequences were edited manually from traces with Sequencher software V4.1.2 (Gene Codes Corporation, Ann Arbor, MI).
2.12. Phylogenetic analysis of taxonomic and functional gene markers
Prior to phylogenetic analysis, all SSU rRNA gene sequences were screened with Chimera Check (DeSantis et al., 2006) by using the Bellerophon (Huber et al., 2004) server (
Small subunit rRNA gene trees were inferred with PHYML (Guindon and Gascuel, 2003; Guindon et al., 2005) by using an HKY + 4Γ + I model of nucleotide evolution where the α parameter of the Γ distribution, the proportion of invariable sites, and the transition/transversion ratio were estimated for each data set [Euryarchaea = 4.14, Crenarchaea = 4.35, Bacteria (proteobacteria) = 2.98 and Bacteria (non-proteobacteria) = 3.14]. The conceptually translated mcrA tree was inferred with PHYML by using a JTT + 4Γ + I model of amino acid substitution. In all cases, the confidence of each node was determined by assembling a consensus tree of 100 bootstrap replicates. PHYML trees were imported into the interactive Tree of Life server (
2.13. UniFrac analysis
UniFrac (
2.14. Hierarchical cluster analysis
Small subunit rRNA gene sequences from PL, OP, MV, and environmental reference studies were queried against the Greengenes database. The output from the nucleotide BLAST search and a modified table of the Greengenes taxonomy hierarchy were used as input files for a custom Perl script (tax_sum.pl) to generate a taxonomy abundance table. The values in all the entries were corrected by using the following formula: A(i,k) = ln[a(i,k) + 1], where each i
th row represents a different taxonomic group, while each k
th column represents a different environment. The corrected values were imported into the R statistics software package (
3. Results
Located on the southwest peninsula of Trinidad near the town of La Brea and covering an area of approximately 46 hectares, Pitch Lake is recharged by pitch seepage, a form of petroleum that consists of mostly asphaltenes. During upward seepage, hydrocarbons mix with mud and gases under high pressure, and the lighter portion evaporates or is volatilized, which produces liquid asphalt. Pitch Lake has both active liquid areas and inactive areas that have solidified due to surface cooling analogous to undersea pillow lavas. Long a source of asphalt for road paving projects (Peckham, 1895), the liquid hydrocarbon environment at Pitch Lake provides a unique vantage point for studying the convergence of subsurface microbiomes that may originate in petroleum reservoirs in the surrounding oil-rich region. Sample temperatures collected from active areas ranged between 32°C and 56°C, significantly above ambient air temperatures (Table 1), which ranged between 20°C and 25°C. Gases diffusing through the liquid asphalt form large bubbles that burst upon reaching a critical size or pressure (Fig. 1B, 1C). Direct measurement of such bubbles revealed gas content dominated by 72.9 ± 3.8% methane, 1.7 ± 0.9% ethane, 1.0 ± 0.2% propane, and trace amounts of butane, with 25.8 ± 5.9% carbon dioxide and 1.3 ± 0.8% nitrogen gas. Helium, hydrogen, and oxygen concentrations were below detection limits (<0.01%).
Mean stable carbon, nitrogen, and sulfur isotope ratios of Pitch Lake (PL) and OP samples were more similar to one another than to the MV sample, which is consistent with common or related source points (Table 2). While the carbon-13 isotope fractionation for bulk carbon in PL samples was −28.1 ± 0.4‰, carbon stable-isotope ratios for the lighter alkanes methane, ethane, propane, and butane were −49.0 ± 1.4 ‰, −34.1 ± 0.2 ‰, −30.9 ± 1.8 ‰, and −29.8 ± 0.8 ‰, respectively, which indicates potential microbial fractionation effects characterized by a preference for isotopically lighter carbon compounds. However, water activity in these samples ranged between 0.49 and 0.65, at or below the reported threshold of life on Earth (Grant, 2004; Tosca et al., 2008). To resolve this seeming contradiction, we quantified the presence of amino acids such as valine (3.7 ± 0.8 nM), alanine/serine (13 ± 6 nM), glycine (3 ± 2 nM), glutamic acid (1.3 ± 0.6 nM), and aspartic acid (2.3 ± 0.7 nM) and confirmed biological activity on the basis of PLFA, and taxonomic and functional gene markers. It remains to be determined whether microbial life is constrained to water- or brine-filled inclusions manifesting higher moisture content than the surrounding asphalt matrix, as seen in the permanent ice covers of frozen lakes and glaciers in McMurdo Dry Valleys, Antarctica (Priscu et al., 1998; Mikucki et al., 2009).
Bulk carbon and nitrogen isotopic results reported in per mill relative to Vienna Pee Dee Belemnite and air; and sulfur isotope values are in per mill relative to the Vienna–Canyon Diablo Troilite isotope ratio standard using NBS-127 (barium sulfate) as the calibration material. Error limit denotes one standard deviation.
Phospholipid fatty acid analysis was used to determine viable microbial biomass. Monoenoic and normal saturated PLFA were recovered, which indicates active microbial populations ranging between 106 to 107 cells/g in PL-A through PL-D (Table 3). Monoenoic PLFA occur in Gram-negative bacteria, typically Proteobacteria, while normal saturated PLFA are more widely distributed in bacteria and eukaryotes. No terminally branched saturated, branched monoenoic, midchain branched saturated, or diagnostic eukaryotic PLFA were recovered. However, in samples PL-A through PL-C several common biomarkers for Gram-negative bacteria, including cy17:0 and cy19:0, were identified (Table 3).
Listed mono-biomarkers and normal saturated biomarkers (Nsats) are characteristic for monoenoic and normal saturated PLFA, respectively. Nomenclature used indicates number and positions of carbon atoms. For example, the designation “16:1” in the biomarker 16:1w7c indicates that the compound has 16 carbons and 1 double bond. The “w7c” notation refers to the 7th carbon from the “omega” or “w” end of the chain; the carboxyl group is located at the “alpha” end. PLFA concentrations were measured in picomoles and multiplied by a factor of 20,000 to convert them into cells per gram.
Microbial community structure was evaluated on the basis of bacterial and archaeal small SSU rRNA gene profiles recovered from samples PL-A through PL-D, OP, and MV. Multivariate statistical approaches were used to compare profile relationships between samples. Common patterns were observed for both bacterial (Fig. 2A) and archaeal (Fig. 2B) domains. PL-B and OP were more similar to one another than to other PL samples consistent with stable isotope analysis (Table 2). The deeper active PL-A and PL-D clustered together, whereas PL-C and MV showed more variation in taxonomic structure. Consistent with PLFA results described above, qPCR assays for total bacterial SSU rRNA gene copy numbers identified between 106 to 107 copies/g in PL samples (Fig. 2A and Table 4). Similar assays for archaeal SSU rRNA copy numbers in PL samples yielded copy numbers that were several orders of magnitude lower than those of bacteria, ranging between 104 and 105 copies/g (Fig. 2B and Table 4).
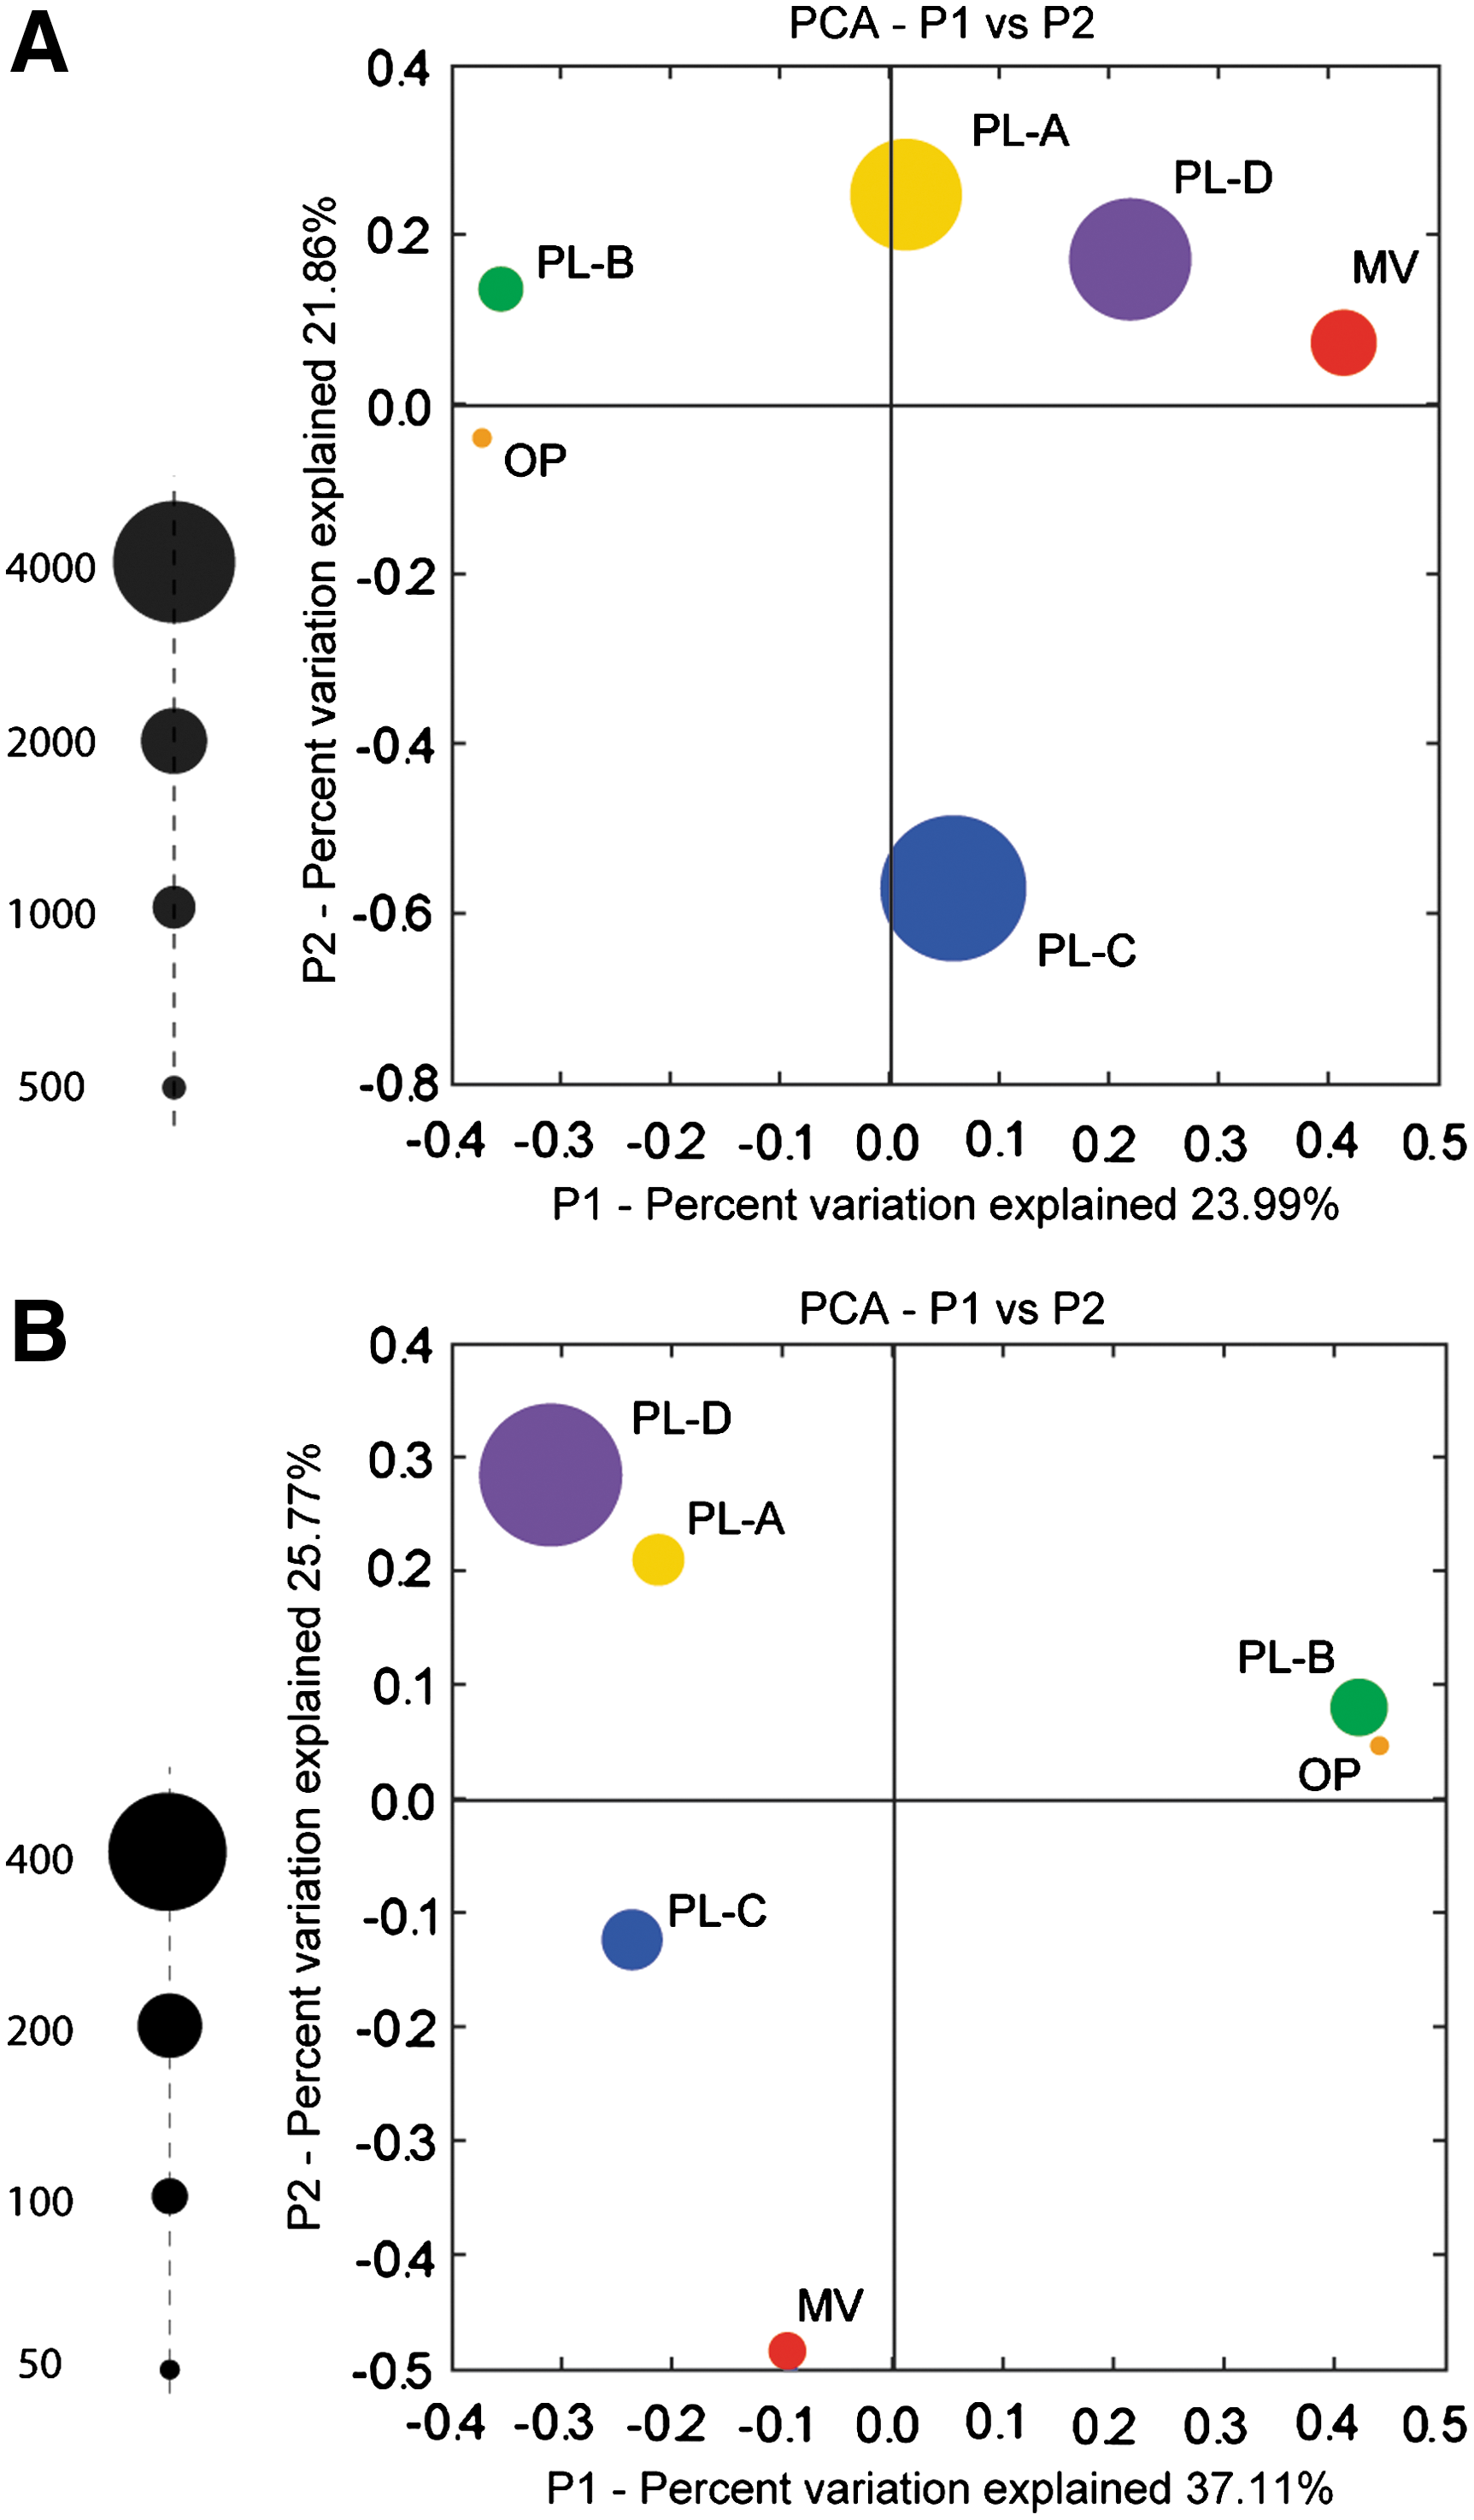
Principle coordinate analysis of (
To further explore functional aspects of active PL samples (PL-A and PL-D), a subset of bacterial genes mediating aerobic hydrocarbon degradation was quantified from environmental DNA extracts (see Methods). The bacterial genes included (i) toluene dioxygenase (tod), which is involved in aromatic ring cleavage (Baldwin et al., 2003); (ii) alkane monooxygenase (alkB), involved in medium or long-chain alkane metabolism (Whyte et al., 1997); particulate methane monooxygenase alpha (pmoA), involved in aerobic methane oxidation (Kolb et al., 2003); and methyl coenzyme M reductase alpha (mcrA) (Hales et al., 1996), involved in archaeal methane metabolism. The PL-A sample contained 5.82 × 10⁶ copies/g of tod and 3.69 × 10⁴ copies/g of alkB. In contrast, tod and alkB copy numbers in the deeper PL-D sample were below detection limits. The abundance of mcrA and pmoA subunit copy numbers did not vary considerably between sampling intervals, reaching 8.51 × 10⁵ and 1.78 × 10³ copies/g, and 3.69 × 10⁵ and 4.99 × 10² copies/g in PL-A and PL-D, respectively.
To identify numerically abundant taxa, we analyzed bacterial and archaeal SSU rRNA gene clone libraries generated from different PL, OP, and MV samples. Within the archaeal domain, numerous SSU rRNA gene sequences affiliated with

Distance tree of euryarchaeal SSU rRNA gene sequences recovered from PL, OP, and MV samples. Bootstrap values (%) are based on 100 replicates using the maximum likelihood method and are shown for branches with greater than 50% support. The scale bar represents 0.1 substitutions per site. Sequence distribution across samples is represented by a series of closed circles whose circumference indicates the percentage of identified RFLP patterns falling within a particular taxonomic group. The number of SSU rRNA clones screened per samples is PL-A = 56(14), PL-B = 84(7), PL-C = 92(19), PL-D = 89(15), OP = 93(10), MV = 78(16). Numbers in parenthesis indicate unique RFLP patterns associated with each sample library. Sequences that belong to a specific subgroup were highlighted as shown on the legend. Enlargements of this figure may be viewed on
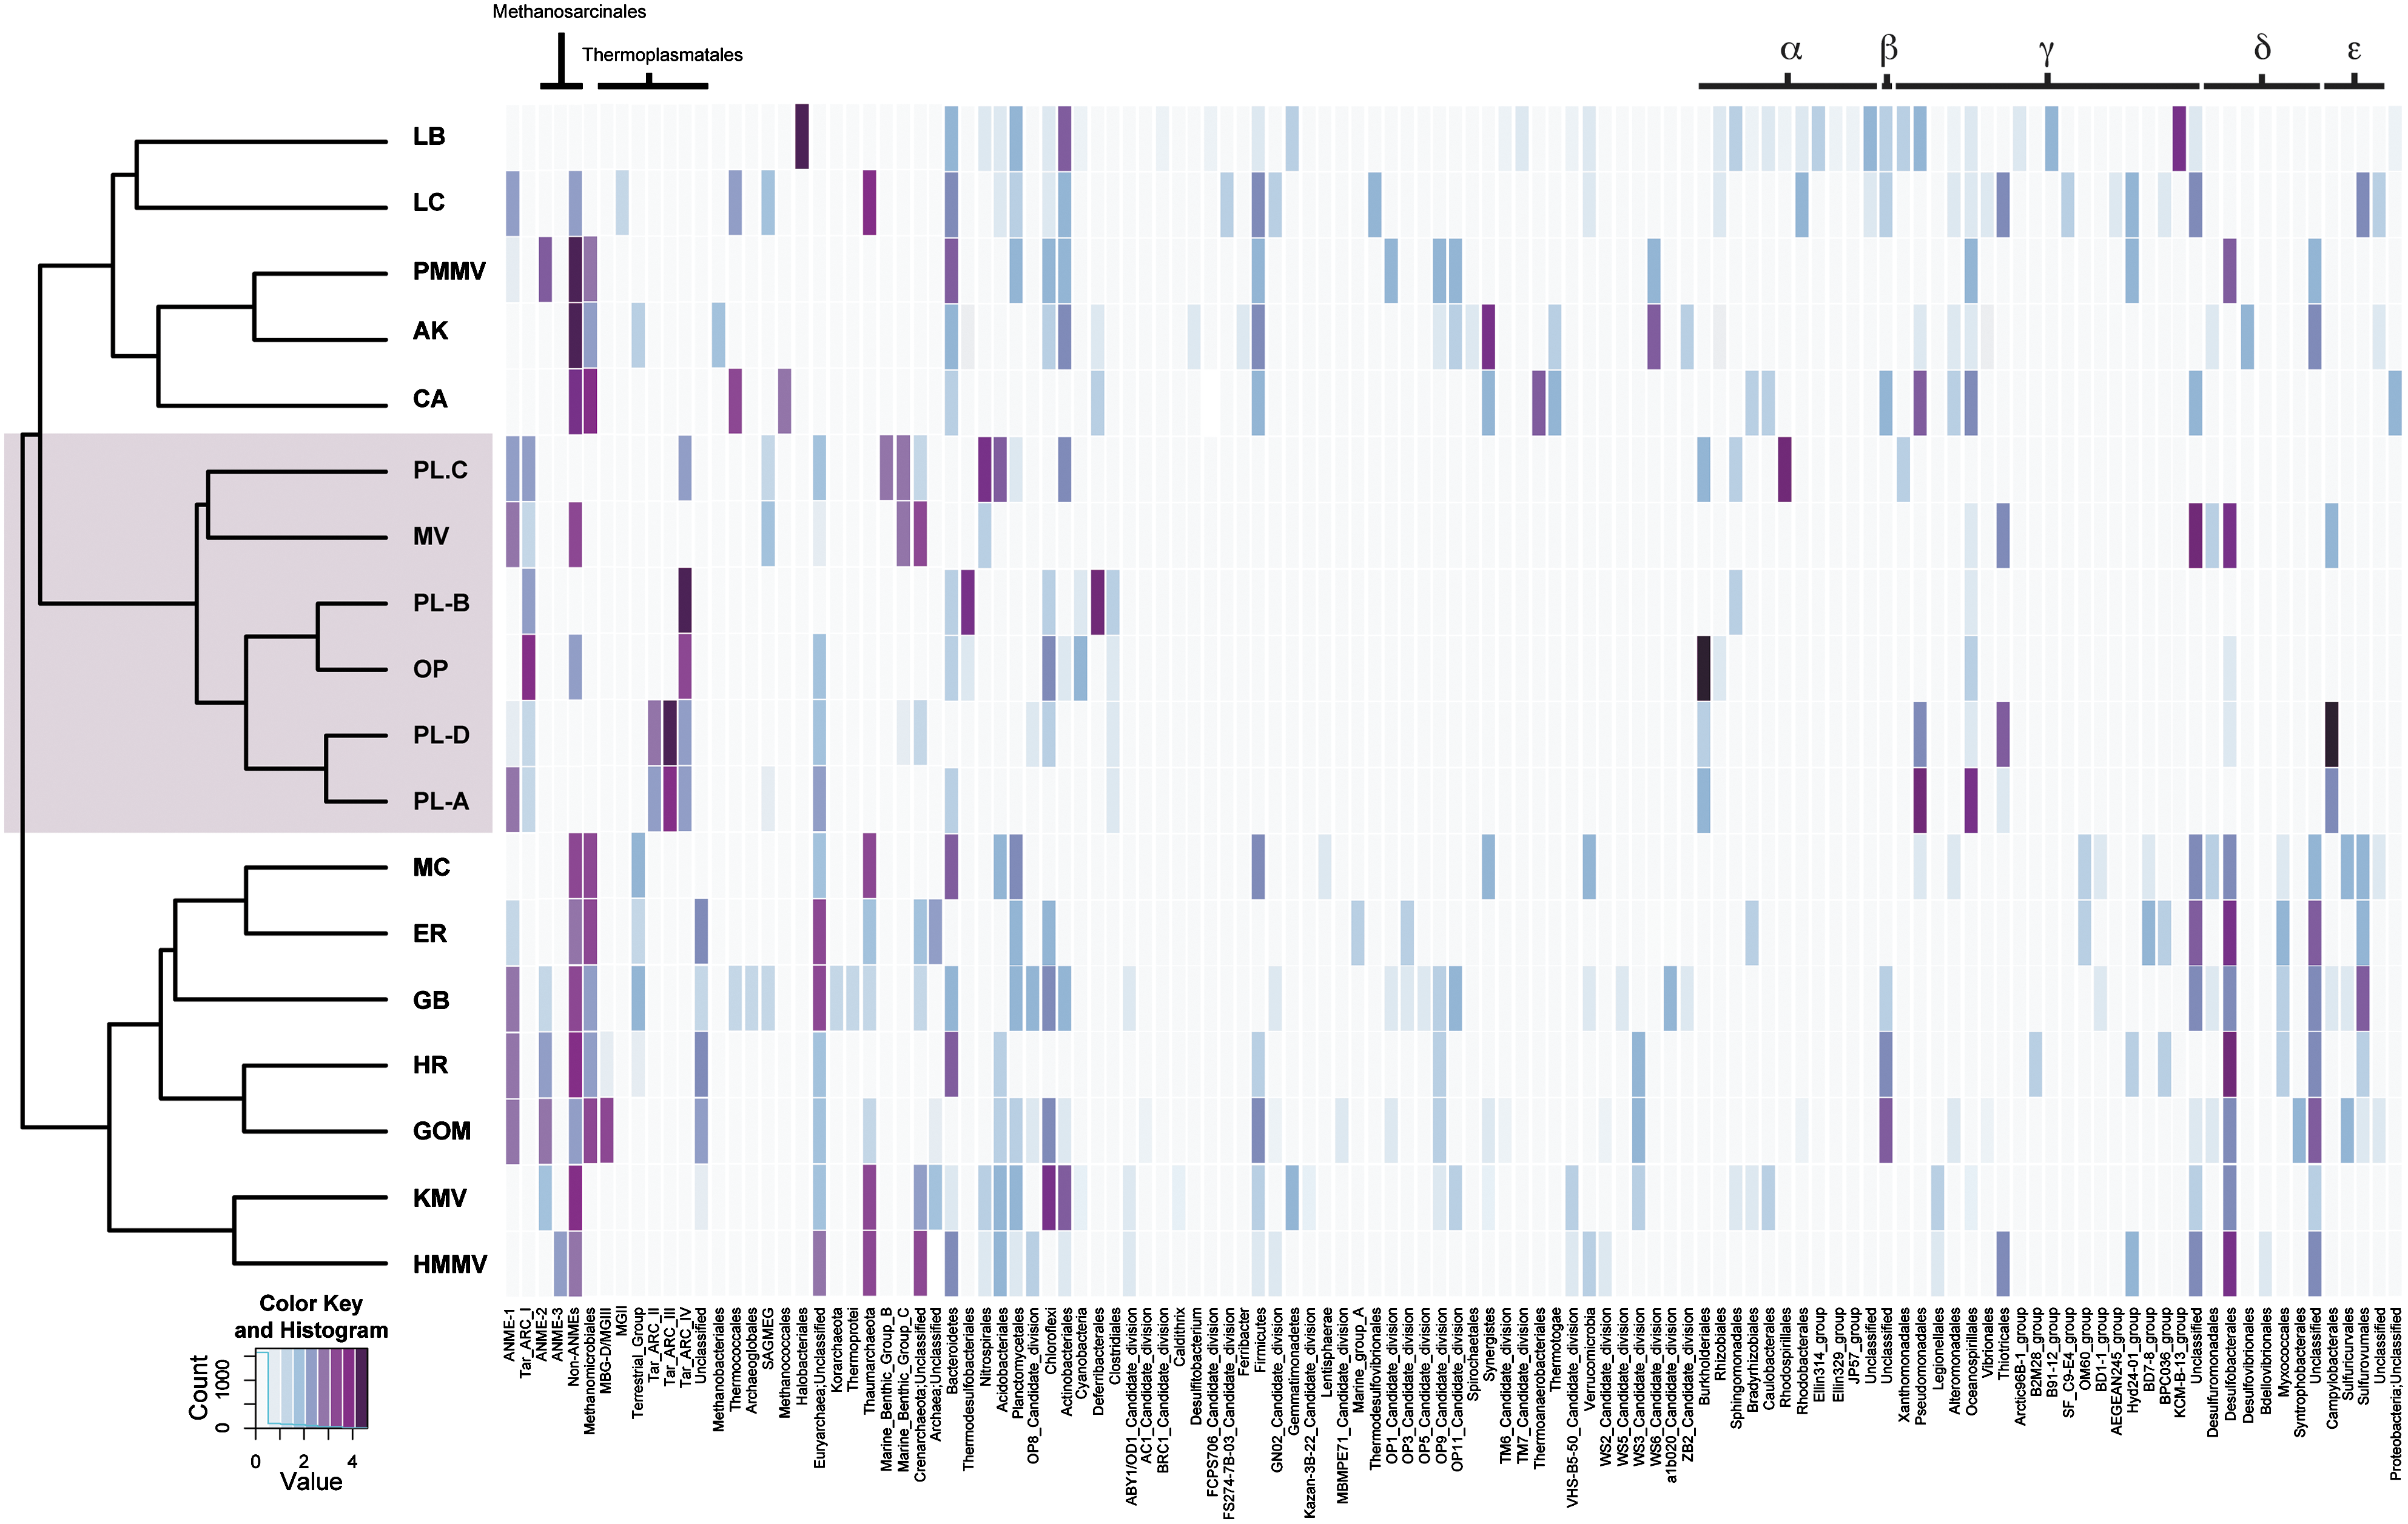
Heat map visualization of archaeal and bacterial composition profiles based on SSU rRNA gene sequences recovered from PL, OP, and MV samples and related hydrocarbon environments including Rancho La Brea Tar Pit (LB); petroleum reservoirs in Alaska (AK) and the California coast (CA); whale fall in Monterey Canyon (MC); methane seeps including Gulf of Mexico (GOM), Eel River Basin (ER), and Hydrate Ridge (HR); hydrothermal vents including Lost City (LC) and Guaymas Basin (GB); the terrestrial mud volcano Paclele Mici (PMMV); and the marine mud volcanoes Haakon Mosby (HMMV) and Kazan (KMV). Color intensity in each box corresponds to the natural logarithm of total SSU rRNA gene sequences affiliated with identified taxonomic groups. Heat map rows are organized according to the topology of the maximum likelihood tree. The histogram depicts the number of boxes representing the corrected values. Color version and enlargements of this figure may be viewed on

Distance tree of mcrA amino acid sequences recovered from PL, OP, and MV samples rooted with Methanopyrus kandleri. Bootstrap values (%) are based on 100 replicates using the maximum likelihood method and are shown for branches with greater than 50% support. The scale bar represents 0.1 substitutions per site. Sequence distribution across samples is represented by a series of closed circles whose circumference indicates the percentage of identified RFLP patterns falling within a particular mcrA lineage. The number of mcrA clones screened per samples is PL-A = 81(15), PL-B = 82(14), PL-D = 79(17), OP = 85(11), and MV = 79(17). Numbers in parenthesis indicate unique RFLP patterns associated with each sample library. Sequences that belong to specific mcrA subgroup were highlighted as shown on the legend. ANME subgroup designations are based on the following references: Hallam et al. (2003), Lloyd et al. (2006), Lösekann et al. (2007). Enlargements of this figure may be viewed on
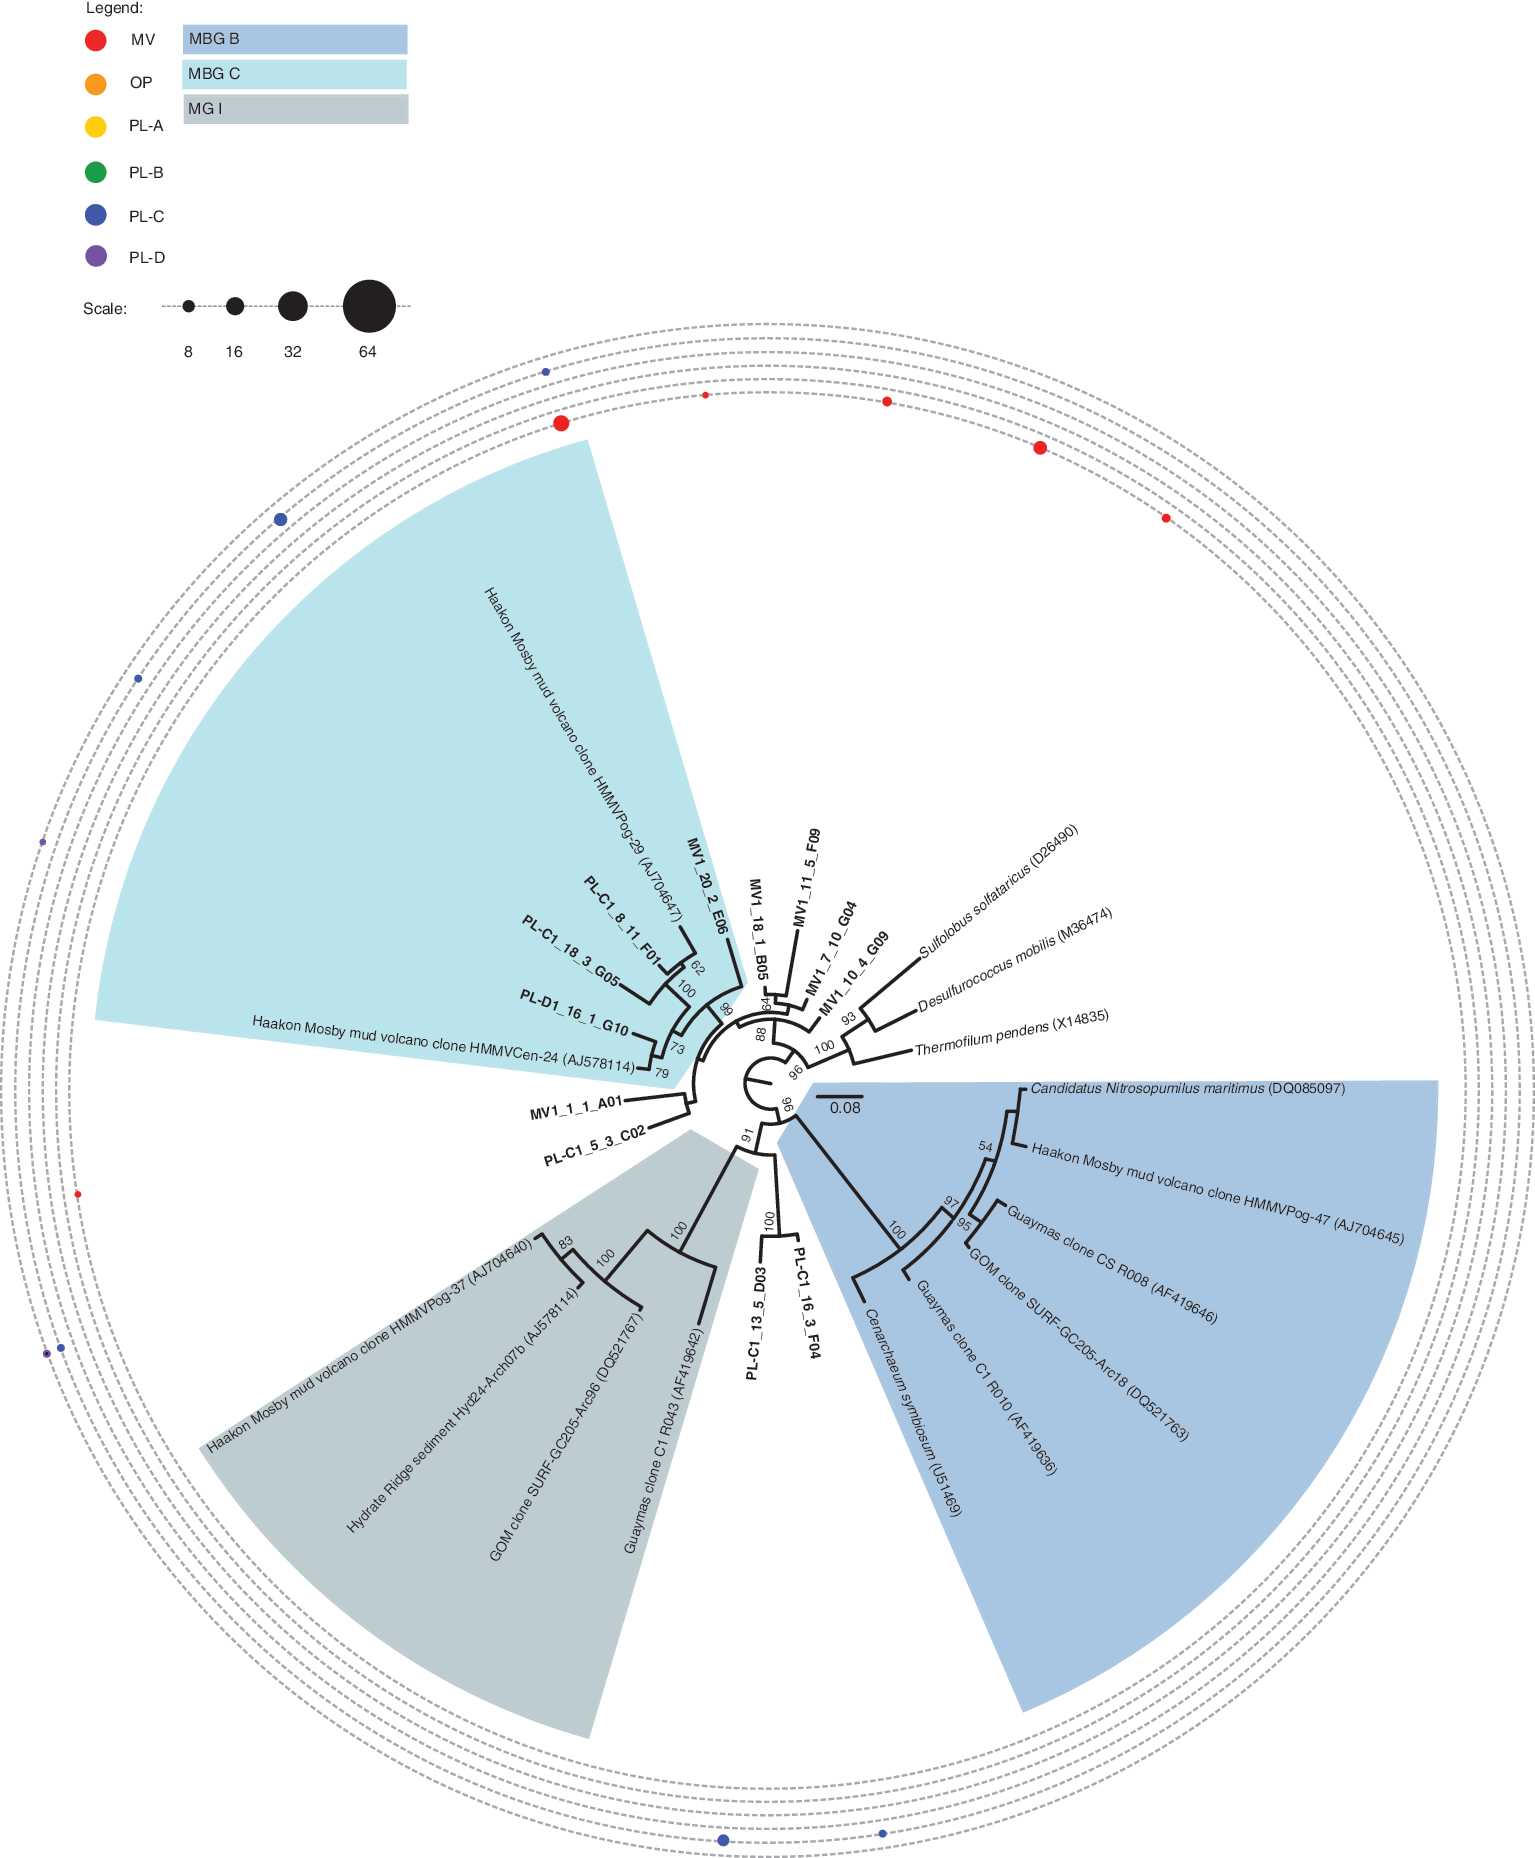
Distance tree of crenarchaeal SSU rRNA gene sequences recovered from PL, OP, and MV samples. Bootstrap values (%) are based on 100 replicates using the maximum likelihood method and are shown for branches with greater than 50% support. The scale bar represents 0.08 substitutions per site. Sequence distribution across samples is represented by a series of closed circles whose circumference indicates the percentage of identified RFLP patterns falling within a particular taxonomic group. The number of SSU rRNA clones screened per samples is PL-A = 56(14), PL-B = 84(7), PL-C = 92(19), PL-D = 89(15), OP = 93(10), MV = 78(16). Numbers in parenthesis indicate unique RFLP patterns associated with each sample library. Sequences that belong to specific subgroups of interest are highlighted in the legend. Enlargements of this figure may be viewed on
Within the bacterial domain, we identified a number of SSU rRNA gene sequences closely affiliated with chemolithoautotrophic sulfur-oxidizing Thiotricales and Campylobacteriales (Figs. 4 and A3). Additional sequences affiliated with sulfur-reducing Defferibacterales recovered exclusively from PL-B, and sulfate-reducing Thermodesulfobacteriales, Nitrospirales, Desulfurimonadales, and Desulfobacterales, were also identified, which is consistent with an active sulfur cycle (Figs. 4, A3, and A4). Sulfur, mostly being available as sulfide in this strongly reducing environment, was measured at concentrations of 31,000 and 37,000 ppm in a previous sampling round. Iron was measured at concentrations of 3000 and 7600 ppm, and concentrations of 2.36–7.43 mg/L of nitrate were measured in the ponded water above the asphalt lake, most if not all of it leached from the underlying hydrocarbon matrix. Additional geochemical data would be needed to further substantiate the cycling of these elements. Distribution patterns of sulfur-metabolizing bacteria were extremely variable with minimal overlap between PL, OP, and MV samples. More compositional similarity was observed for sequences affiliated with higher alkane, aromatic, and heavy oil degradation, including Pseudomonadales, Oceanospirillales, and Burkholderiales (Figs. 4 and A3). Additional sequences affiliated with desiccation resistant Acidobacteriales and Rhodospirillales were recovered exclusively from inactive PL-C (Figs. 4 and A4).

Distance tree of proteobacterial SSU rRNA gene sequences recovered from PL, OP, and MV samples. Bootstrap values (%) are based on 100 replicates using the maximum likelihood method and are shown for branches with greater than 50% support. The scale bar represents 0.2 substitutions per site. Sequence distribution across samples is represented by a series of closed circles whose circumference indicates the percentage of identified RFLP patterns falling within a particular taxonomic group. The number of SSU rRNA clones screened per samples is PL-A = 89(13), PL-B = 86(12), PL-C = 84(12), PL-D = 79(10), OP = 79(16), MV = 79(14). Numbers in parenthesis indicate unique RFLP patterns associated with each sample library. Sequences that belong to specific subgroups of interest are highlighted in the legend. Enlargements of this figure may be viewed on
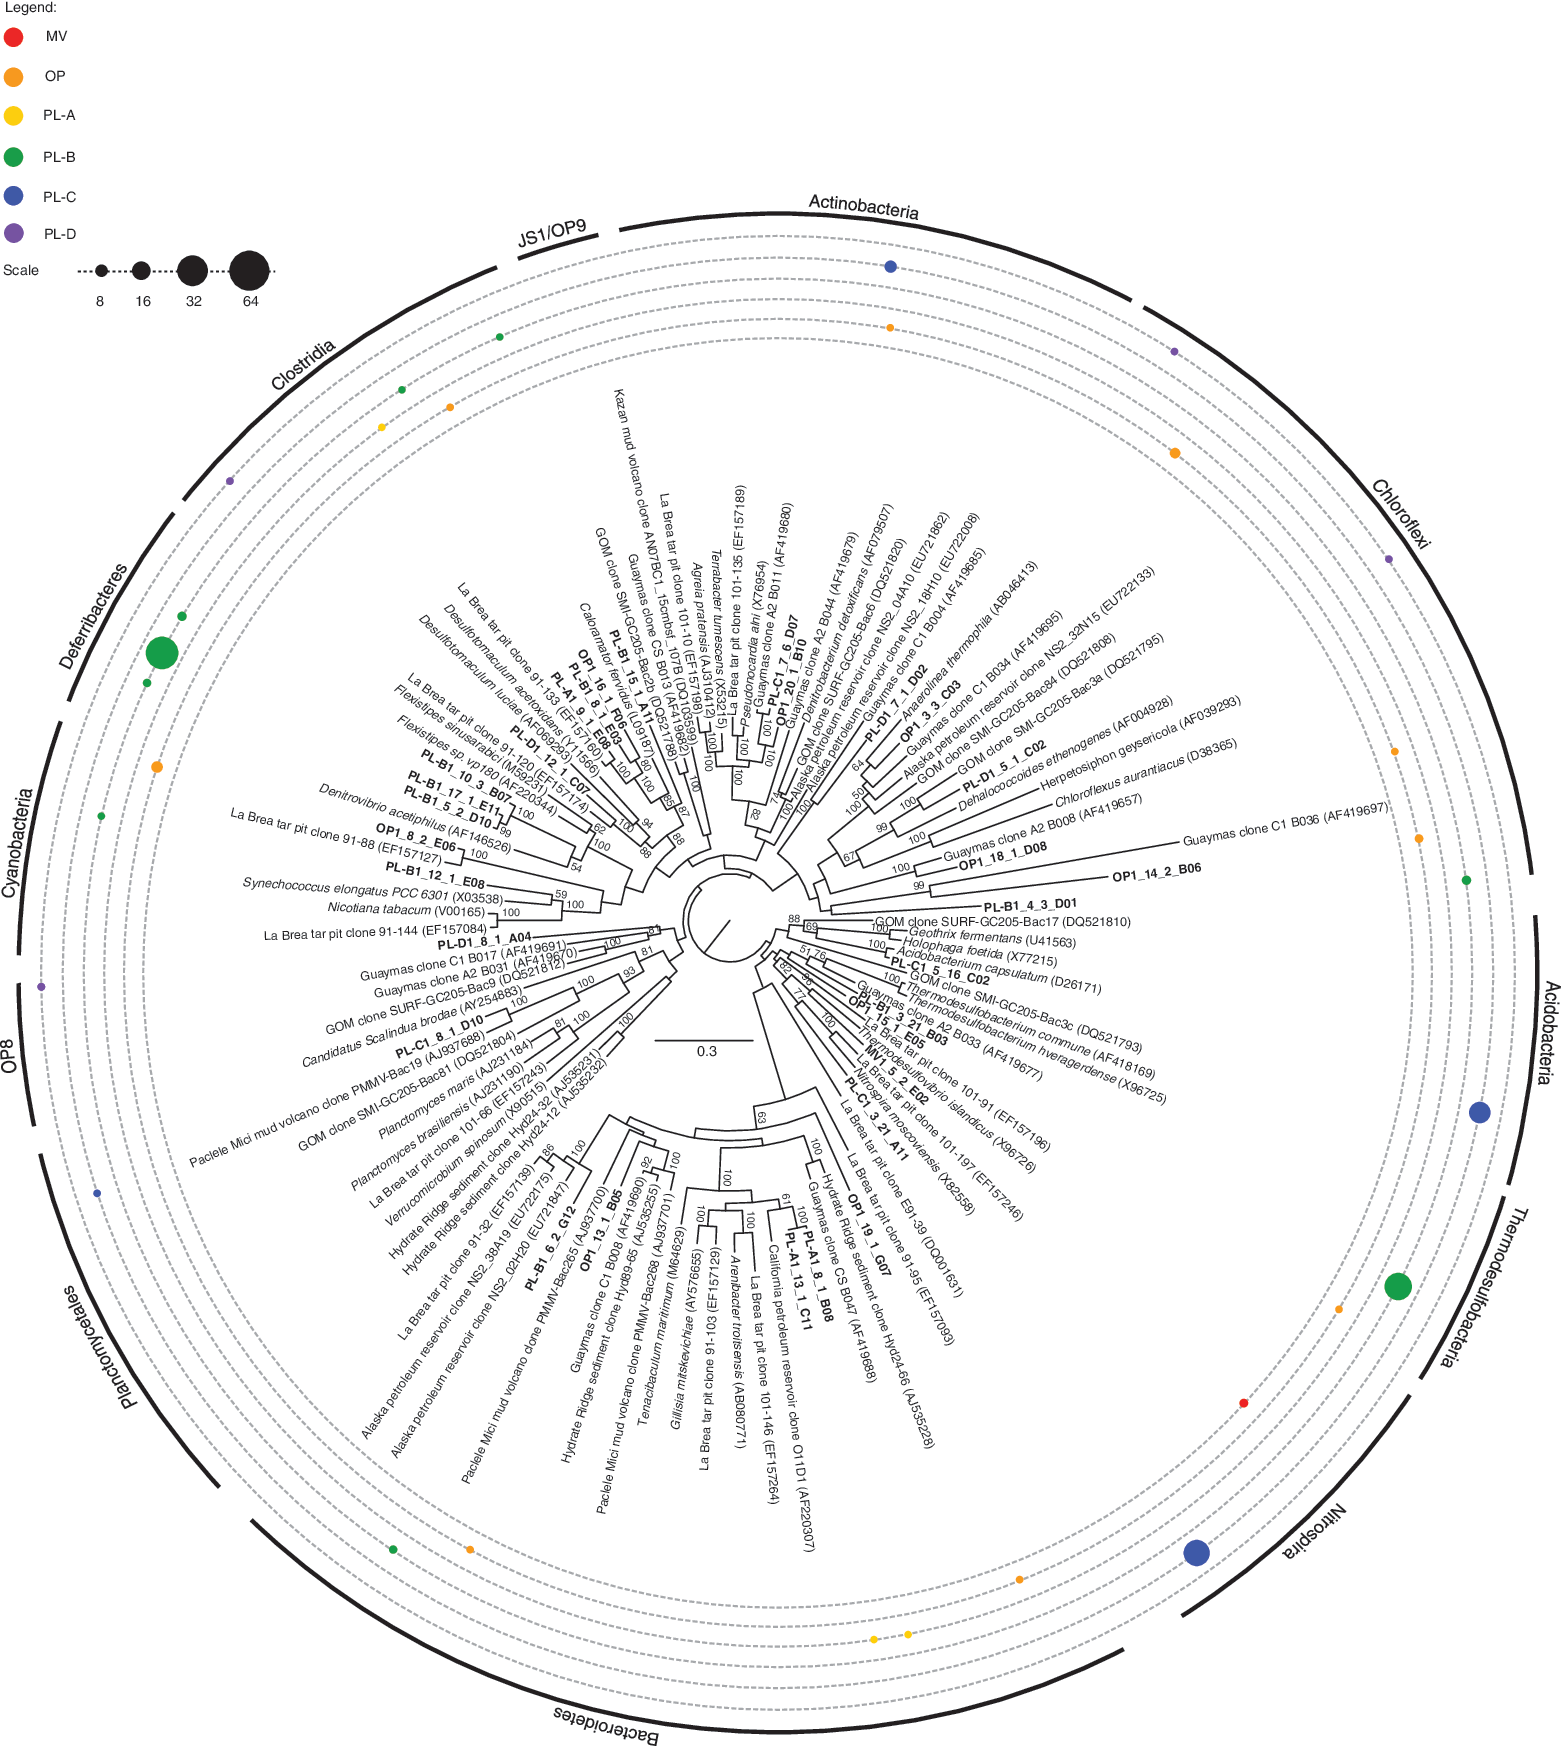
Distance tree of nonproteobacterial SSU rRNA gene sequences recovered from PL, OP, and MV samples. Bootstrap values (%) are based on 100 replicates using the maximum likelihood method and are shown for branches with greater than 50% support. The scale bar represents 0.3 substitutions per site. Sequence distribution across samples is represented by a series of closed circles whose circumference indicates the percentage of identified RFLP patterns falling within a particular taxonomic group. The number of SSU rRNA clones screened per samples is PL-A = 89(13), PL-B = 86(12), PL-C = 84(12), PL-D = 79(10), OP = 79(16), MV = 79(14). Numbers in parenthesis indicate unique RFLP patterns associated with each sample library. Enlargements of this figure may be viewed on
To place PL, OP, and MV microbiomes into a broader ecological and biogeochemical context, we compared microbial compositional profiles between hydrocarbon environments, including natural asphalts (Kim and Crowley, 2007), methane seeps (Orphan et al., 2001; Knittel et al., 2005; Lloyd et al., 2006), hydrothermal vents (Teske et al., 2002; Brazelton et al., 2006), mud volcanoes (Alain et al., 2006; Lösekann et al., 2007; Kormas et al., 2008), and petroleum reservoirs (Orphan et al., 2000; Pham et al., 2009; Fig. 4). PL, OP, and MV clustered together to the exclusion of other environments (Fig. 4). The archaeal component of PL was extremely divergent, dominated by novel and deeply branching ANME-1 and Tar ARC lineages and reduced representation or absence of previously described methanogens, halophiles, or marine Group I crenarchaea. The bacterial component of PL profiles was intermediate to biodegraded oil systems, methane seeps, and marine mud volcanoes with reduced representation of sulfate-reducing Deltaproteobacteria and conspicuous absence of most candidate divisions (Fig. 4).
4. Discussion
Pitch Lake provides a contemporary terrestrial example of active microbial communities adapted for persistence and growth within a recalcitrant hydrocarbon matrix. Our taxonomic survey of this matrix revealed patterns of endemism and niche partitioning that differentiated PL samples from previously described hydrocarbon-rich environments. In the following sections, we explore potential biogeochemical and ecological drivers for this differentiation relevant to the study of subsurface hydrocarbon biodegradation processes and consider how PL might serve as a useful environment for modeling the biotic potential of liquid hydrocarbon features found on other planetary bodies.
4.1. Niche partitioning patterns
Multivariate analysis identified shifts in microbial community structure between PL, OP, and MV concordant with environmental gradients. For instance, low viscosity samples of intermediate temperature, PL-A and PL-D, collected at 24 and 84 cm depths within the asphalt column, respectively, were more similar to one another than more superficial samples, PL-B and PL-C, collected at 10 cm depth. PL-B and PL-C samples were further differentiated from one another on the basis of viscosity and temperature. Along these lines, bacterial markers for aerobic hydrocarbon degradation (tod and alkB) decreased by several orders of magnitude to below the limit of detection with increasing depth. Concomitant with this trend, SSU rRNA sequences affiliated with Pseudomonadales, known to harbor both functional genes (reviewed in Palleroni et al., 2010), comprised more than 40% of clones recovered from PL-A and less than 8% of clones recovered from PL-D. The bacterial marker for aerobic methane oxidation (pmoA) was detected at low levels in PL-A and PL-D samples, decreasing by ∼3-fold as a function of depth. SSU rRNA gene sequences affiliated with bacterial lineages known to harbor pmoA were not recovered in PL-A or PL-D samples consistent with qPCR detection levels. In contrast, the marker for archaeal methane metabolism (mcrA) was several orders of magnitude higher than pmoA in both PL-A and PL-D samples, decreasing by ∼2-fold as a function of depth. Concomitant with mcrA detection, SSU rRNA gene sequences affiliated with putative methane metabolizing archaea, ANME-1 and Tar ARC I, comprised up to 20% of archaeal clones recovered from PL-A and PL-D.
The diversity of bacterial and archaeal SSU rRNA gene sequences recovered from PL, OP, and MV samples revealed contrasting patterns of micro- and macrodiversity between domains. For example, SSU rRNA gene sequences affiliated with the Thermoplasmatales within the Euryarchaeota formed sample-specific clades associated with Tar ARC II, III, and IV, which is indicative of ecotype selection. In contrast, bacterial SSU rRNA gene sequences affiliated with alternative and unique phyla dominated individual samples. For example, SSU rRNA sequences affiliated with Defferibacteres and Thermodesulfobacteria were found almost exclusively in PL-B, whereas Nitrospina and Acidobacteria were found almost exclusively in PL-C. Within active PL-A and PL-D samples, proteobacterial lineages were most prevalent, with Gammaproteobacteria affiliated with hydrocarbon-degrading Pseudomonadales dominating PL-A, and Epsilon- and Gammaproteobacteria affiliated with chemolithoautotrophic sulfur-oxidizing bacteria dominating PL-D.
Taken together, these observations are consistent with the existence of island-like populations adapted to different and potentially dynamic niches within the hydrocarbon matrix. It will be of interest to determine the stability of these populations over time in relation to matrix properties to better constrain observed patterns of inter- and intradomain diversity. Understanding the phenotypic consequences of this diversity with respect to nutritional, energetic, and detoxification services could also have important technological implications for recovery and remediation efforts in biodegraded hydrocarbon reservoirs, including heavy oil, natural bitumen, and oil shale deposits (Head et al., 2003; Aitken et al., 2004).
4.2. Metabolic considerations
Physical mixing processes could influence the formation and transport of fluid-filled inclusions, that is, emulsions, capable of supporting active but spatially segregated microbial populations within the hydrocarbon matrix. Bulk water activity measurements are likely to underestimate the biotic potential of such inclusions. While direct rate measurements associated with hydrocarbon conversion processes mediated by tod, alkB, and pmoA were not undertaken, the identification of intact polar lipids is consistent with the presence of metabolically active bacterial cells with the potential to harbor these genes. In addition to aerobic hydrocarbon degradation processes, SSU rRNA gene sequences affiliated with facultative or obligate anaerobic sulfur- or nitrite-oxidizing bacteria with the potential to respire sulfur, sulfate, nitrate, or iron—including Sulfurimonas, Thiomicrospira, and Nitrospira—were also recovered from PL samples. In general, many of the bacterial taxa identified in PL, OP, and MV were affiliated with reference strains capable of utilizing nitrate as terminal electron acceptor, which suggests widespread selection for this respiratory mode.
Markers for archaeal methane metabolism were also prevalent in PL samples. While anaerobic hydrocarbon degradation under methanogenic conditions has been reported in formation waters of deep subsurface petroleum reservoirs (Dolfing et al., 2008; Jones et al., 2008), microbial community structure, carbon isotope ratios, and water activity measurements of PL samples suggest variations on this theme. Indeed, the recovery of SSU rRNA gene sequences affiliated with ANME-1 and Tar ARC I is consistent with an active methane cycle. However, measurement of PL bulk methane carbon isotope ratios could not resolve biological fractionation effects associated with methanogenic or reverse methanogenic phenotypes.
While it is tempting to speculate that ANME lineages identified in PL are capable of methanogenesis, a general discrepancy between archaeal SSU rRNA gene copy numbers and mcrA copy numbers in PL-A and PL-D samples is also consistent with primer bias, which results in skewed reporting of methanogenic potential. Indeed, the use of functional gene primers designed from disparate locales has the potential to dramatically underestimate in vivo copy numbers due to limited target specificity or allelic variation, for example, in the case of total archaeal SSU rRNA gene copy number or recovery of methanogen sequences. Conversely, gene duplication or nonspecific target amplification could lead to overestimation of in vivo copy numbers, for example, in the case of total mcrA.
The absence of rate measurements or archaeal lipid analysis further confounded physiological linkages between archaeal lineages identified in PL and the process of anaerobic oxidation of methane (AOM). Although SSU rRNA sequences affiliated with sulfate-reducing bacteria within the Deltaproteobacteria typically associated with AOM environments (Orphan et al., 2001) were not recovered from PL samples, the identification of SSU rRNA gene sequences affiliated with Defferibacteres, Clostridia, and Thermodesulfobacteria could indicate previously unrecognized sulfate-reducing partners in AOM. Moreover, recent studies have reported the potential for AOM coupled to nitrate (Raghoebarsing et al., 2006), iron, or manganese reduction (Beal et al., 2009). Thus, the co-occurrence of Tar ARC II, III, and IV affiliated with putative iron-reducing Thermoplasmatales could reflect the presence of structured archaeal assemblages supporting AOM. It will be of interest to explore the physical and biochemical relationships among and between bacterial and archaeal cells within the hydrocarbon matrix.
4.3. Relationship to other hydrocarbon-rich environments
Hierarchical clustering of PL, OP, and MV compositional profiles in relation to other hydrocarbon-rich environments resolved two major clusters. With the exception of SSU rRNA gene sequences from a serpentine-hosted hydrothermal vent ecosystem (Brazelton et al., 2006), terrestrial hydrocarbon environments clustered together to the exclusion of marine mud volcanoes and methane seeps. Curiously, the clustering of LC with terrestrial hydrocarbon reservoirs could in part be explained by long-branch attraction between locations based on shared ANME-1 SSU rRNA gene sequence similarity and abundance. Within the terrestrial cluster, PL, OP, and MV were more similar to one another than to other hydrocarbon reservoirs, and relational patterns among and between PL, OP, and MV samples mirrored the results of multivariate analysis described above. Surprisingly, compositional profiles from PL were distinct from previously described microbial communities at Rancho Le Brea, a natural asphalt environment in California (Kim and Crowley, 2007). These distinctions were primarily driven by the archaeal domain, in which no overlap was observed between the two locations. Within the bacterial domain, PL shared many phyla in common with Rancho Le Brea, including Alpha-, Beta-, and Gammaproteobacteria, Nitrospira, Bacteroidetes, Planctomycetes, Cyanobacteria, Clostridia, and Actinobacteria. Putative sulfur-cycling groups identified in PL, including Sulfurimonas, Thiomicrospira, Deltaproteobacteria, Defferibacteres, and Thermodesulfobacteria were conspicuously absent from Rancho Le Brea, which indicates unconstrained differences in the physical or chemical properties of the asphalt columns between environments. Future studies of deep subsurface hydrocarbon reservoirs, including coal-bed methane and oil sands, will likely provide a more robust comparative framework for constraining the extent and degree of endemism ascribed to Pitch Lake microbiomes.
4.4. Astrobiological implications
The liquid asphalt environment of Pitch Lake provides a unique opportunity to evaluate the critical limits for life in the Universe (Schulze-Makuch and Irwin, 2006; Shapiro and Schulze-Makuch, 2009). In particular, Pitch Lake may serve as a useful analogue for evaluating the potential for life in liquid hydrocarbon lakes discovered by the Cassini Titan Radar Mapper on Saturn's largest moon, Titan (Elachi et al., 2006; Stofan et al., 2007). Spectroscopic results also indicate the presence of methane rain on Titan (Lunine et al., 1983, Lorenz, 2000) and imply a methane cycle on Titan analogous to the hydrological cycle on Earth. A hydrocarbon solvent such as a mixture of methane and ethane on Titan's surface may improve the chances for the origin of life on Titan, based on extensive experiences with organic synthesis reactions that have shown that the presence of water greatly diminishes the chance of constructing nucleic acids (Schulze-Makuch and Irwin, 2008). Organic reactivity in hydrocarbon solvents is no less versatile than it is in water, and many enzymes derived from microorganisms are believed to catalyze reactions by having an active site that is hydrophobic (Benner et al., 2004). Furthermore, Baross et al. (2007) suggested that the environment of Titan meets the absolute requirements for life, which include thermodynamic disequilibrium, abundant carbon-containing molecules and heteroatoms, and a fluid environment. They further concluded that, if the assumption is correct that life is an intrinsic property of chemical reactivity, then life should exist on Titan. Aside from the very cold surface conditions on Titan, the environmental conditions within Pitch Lake are one of the closest analog environments we can find on our planet, and the discovery of a broad spectrum of microbiota enhances the possibility for life in Titan's hydrocarbon lakes. In fact, cryovolcanism has been inferred to exist on Titan (Sotin et al., 2005; Lopes et al., 2007), and a heating of some of Titan's hydrocarbon reservoirs from below (e.g., Schulze-Makuch and Grinspoon, 2005) is a distinct possibility that further enhances the possibility of at least prebiotic organic reactions.
The absolute requirement of water for life is of much astrobiological interest and should be a topic of further inquiries. In regard to Pitch Lake, further research is encouraged to elucidate the adaptation mechanisms that life in Pitch Lake might employ to thrive in the water-poor hydrocarbon matrix. The recent findings that E. coli cells are able to generate up to 70% of their intracellular water during metabolism (Kreuzer-Martin et al., 2005) and that the fungus Fusarium alkanophilum is capable of thriving in a hydrocarbon environment by extracting water from light hydrocarbons (Marcano et al., 2002), may point to exciting new directions for how life-forms can exist in hydrocarbon matrices with little or no liquid water.
5. Conclusions
We described a unique, endemic microbial community in Pitch Lake, a natural asphalt lake in Trinidad. The microbial organisms detected are archaea and bacteria, and thrive in a hydrocarbon matrix with low water activity and toxic compounds. The environment is in many aspects analogous to the surface of Titan, on which hydrocarbon lakes have been detected under a thick atmosphere dominated by nitrogen and methane. Our research as described above is a starting point for investigating what life's principle constraints are in a hydrocarbon matrix and whether the hydrocarbon lakes on Titan could possibly contain life.
Footnotes
Acknowledgments
This work was supported by a grant from the Government of the Republic of Trinidad and Tobago (GROTT), the Natural Sciences and Engineering Research Council (NSERC) of Canada (328256-07 and STPSC 356988), Canada Foundation for Innovation (CFI 17444), and the Canadian Institute for Advanced Research (CIFAR). Support was also received from NSF/RUI grant No. AST-1009903 given to Villanova University. We thank Dr. Tom Kieft for his help in designing the gas sampling procedure, Dr. Barbara Sherwood Lollar for conducting the gas analyses, and Drs. Alison Skelley and Christine Jayarajah for conducting amino acid analyses with the Mars Organic Analyzer (MOA). We also thank Rainer Strzoda from the Siemens AG for letting us test his handheld laser system for the field detection of methane gas. Archaeal and bacterial SSU rRNA and mcrA gene sequences were deposited in GenBank under the accession numbers GU120478–GU120542, GU120543–GU120617, and GU447199–GU447228, respectively. We also acknowledge two anonymous reviewers for improving the clarity and vision of the manuscript.
Disclosure Statement
No competing financial interests exist.
Abbreviations
AOM, anaerobic oxidation of methane; IRMS, isotope ratio mass spectrometer; MV, mud volcano; OP, oil well; PCR, polymerase chain reaction; PL, Pitch Lake; PLFA, phospholipid fatty acid; qPCR, quantitative polymerase chain reaction; RFLP, restriction fragment length polymorphism; rRNA, ribosomal RNA; SSU, small subunit.