
Abstract
Detecting mineral-hosted ecosystems to assess the extent and functioning of the biosphere from the surface to deep Earth requires appropriate techniques that provide, beyond the morphological criteria, indubitable clues of the presence of prokaryotic cells. Here, we evaluate the capability of cathodoluminescence microscopy and spectroscopy, implemented on a scanning electron microscope, to identify prokaryotes on mineral surfaces. For this purpose, we used, as a first step, a simple model of either unstained or stained cultivable cells (Escherichia coli, Deinococcus radiodurans) deposited on minerals that are common in the oceanic crust (basaltic glass, amphibole, pyroxene, and magnetite). Our results demonstrate that the detection of cells is possible at the micrometric level on the investigated minerals through the intrinsic fluorescence of their constituting macromolecules (aromatic amino and nucleic acids, coenzymes). This allows us to distinguish biomorph inorganic phases from cells. This easily implemented technique permits an exploration of colonized rock samples. In addition, the range of spectrometric techniques available on a scanning electron microscope can provide additional information on the nature and chemistry of the associated mineral phases, which would lead to a simultaneous characterization of cells, their microhabitats, and a better understanding of their potential relationships. Key Words: Prokaryotic cells—Cathodoluminescence—Intrinsic fluorophores/autofluorescence—Scanning electron microscope—Mineral-hosted ecosystems. Astrobiology 10, 921–932.
1. Introduction
I
The presence of microbial habitats within hard rocks can be demonstrated through molecular ecology, after DNA has been extracted from the host minerals (e.g., Summit and Baross, 2001). Alternatively, it can be inferred from indirect observations. As an example, the discovery of probably biogenic magnetite at a depth of ∼6700 m below the surface has been used as an indirect marker of the activity of dissimilatory iron-reducing bacteria in deep environments (Gold, 1992). Biochemical indicators of enzymatic activities have also been investigated to provide evidence of a sustained microbial activity in rocks (Takano et al., 2005).
Nevertheless, to fully understand how these ecosystems operate and particularly how microbial cells, fluids, and minerals interact, imaging microbes within their habitats at the (sub)micrometric scale is a prerequisite. However, beyond the challenging technical aspects, the detection and the identification of microorganisms within hard rocks is often problematic when relying only on a descriptive approach by optical or electron microscopy. Indeed, it is difficult solely on the basis of morphological criteria to discriminate between real microorganisms and inorganic biomorph structures. As an illustration, the controversial search for small life-forms in terrestrial and extraterrestrial rocks was motivated for a long time by reports on putative bacterial remnants, for example, in the martian meteorite ALH84001, and the morphological description of submicrometer bacteria-like objects in various sedimentary and volcanic rocks. During the last decade, increasing efforts have been devoted to elaborate methodologies that allow for indubitable identification of microbial cells in association with minerals. In particular, such efforts have benefited from recent advances in spectroscopic techniques such as scanning transmission X-ray microscopy or Raman spectroscopy (Benzerara et al., 2005, 2006; see also Geesey et al., 2002, for an exhaustive review), but these latest techniques are generally not phylogenetically specific. Alternatively, confocal laser scanning microscopy, by means of fluorescent in situ hybridization techniques (Amann et al., 1997, 2001), offers the possibility of a direct phylogenetic identification of individual microbial cells in environmental samples but has limitations on providing information on the associated mineral phases. Recently, a combination of scanning X-ray microscopy with a protocol that couples fluorescent in situ hybridization to ultra-small immunogold has been successfully developed to overcome this limitation (Ménez et al., 2007). Nevertheless, the sophistication of these last techniques precludes their routine use in exploratory work. As a consequence, there is still a strong technical need for rapid discrimination of cells from bacteriomorph objects on mineral surfaces.
Here, we propose to use cathodoluminescence (CL) microscopy and spectroscopy obtained with a scanning electron microscope (SEM) in secondary electron mode (SE) to localize the presence of prokaryotic cells directly on mineral surfaces. CL corresponds to light wavelengths ranging from UV to IR that are emitted from a material irradiated by an electron beam. CL displays characteristics similar to photoluminescence (PL) elicited under UV-visible light and more commonly designated as fluorescence, but CL has some intrinsic advantages over PL. First, it can be amplified electronically and thus measured quantitatively. Secondly, its spatial resolution (∼100 nm) is higher than that for confocal laser scanning microscopy or epifluorescent microscopy (∼200 and ∼500 nm, respectively; Nakano et al., 1997; Fisher et al., 2008). Nonetheless, even though this method was exploited very early for biological studies, its use was limited in the last decades owing to the weakness of the signal that emerges from organic products and their fading under high beam current (Barnett et al., 1975; Bröcker, 1976; Hough et al., 1976; Cavellier et al., 1978; Cavellier and Berry, 1985; Ning et al., 1993; Nakano et al., 1997; Kimura et al., 2004). Assuming that CL is equivalent to PL (Hough et al., 1976), it follows that fluorescent molecules of cells (e.g., aromatic amino and nucleic acids, coenzymes) and some dyes used to stain cells (e.g., DNA-binding fluorochromes, fluorescent molecules conjugated with antibodies or oligonucleotide probes) can also produce an intrinsic fluorescence under an electron beam excitation, also known as autofluorescence, and an extrinsic fluorescence, respectively. The resulting CL spectra would be, overall, identical to those collected under UV-visible light, as demonstrated previously for various organic materials (De Mets, 1974; Barnett et al., 1975; Ning et al., 1993; Kimura et al., 2004; Niitsuma et al., 2005; Fisher et al., 2008). Similarly, minerals will emit their own cathodoluminescent signal, whose characteristics and intensity will depend on their chemical composition and crystalline network (i.e., intrinsic fluorescence) or on the presence of impurities in their structure (i.e., extrinsic fluorescence). Overall, CL microscopy and spectroscopy have thus the potential for characterizing both organic and inorganic materials. To evaluate its relevance in geomicrobiological studies aimed at identifying microorganisms within their habitats, that is, on mineral surfaces, we carried out a series of tests based on a set of two cultivable bacteria used in combination with various fluorescent dyes and deposited on different types of minerals, representative of the oceanic crust. This simple model was designed to constrain the physical processes involved in the CL emission.
2. Materials and Methods
2.1. Scanning electron microscopy and cathodoluminescence
Scanning electron microscope experiments were carried out with the JEOL JSM 840 of the “Service Commun de Microscopie Electronique à Balayage” (UPMC, Paris, France). It is a conventional microscope equipped with a tungsten filament for electron production. Secondary and backscattered electron detectors and an energy-dispersive X-ray spectroscopy system (Princeton Gamma Tech., Inc.) allow high-resolution imaging (down to 4 nm) and elemental microanalysis, respectively. A retractable rhodium-coated parabolic mirror (Oxford Instruments) collects the CL emissions once the primary electron beam goes through the mirror and intersects the sample. The fluorescent light collected by the mirror is transferred outside the vacuum chamber through a quartz window. Spectroscopic measurements are permitted when using a Triax 180 compact imaging spectrometer (Jobin Yvon) with a grating of 3 ± 0.3 nm resolution connected with an optical fiber. For image acquisition at a specific wavelength, the CL signal is guided through a lens to a monochromator coupled with a photomultiplier (Blanc-Perray OPEA system, see Fig. 1). CL spectra were recorded in the range of 200–900 nm, over 10 s to prevent irradiation damage to the sample induced by the electron beam. As previously mentioned, we observed during acquisition a decrease of the CL signal intensity (i.e., fading) but no other modifications of the spectra such as shifts in wavelengths. Measurements were carried out under a secondary vacuum of 10−4 mbar, with an accelerating voltage and a discharge current, 25 kV and 10−8 A, respectively.

CL setup installed on the SEM of the “Service Commun de Microscopie Electronique à Balayage” (UPMC, Paris, France). The CL signal emitted from the irradiated specimen is collected by a parabolic mirror and transferred to a Blanc & Perray prototype for imaging and spectroscopic measurements.
2.2. Spectrofluorimetry
To characterize the intrinsic fluorescence of the bacterial cells and highlight eventual differences with CL that result from an electron beam excitation, we acquired in parallel fluorescence emission spectra on the investigated cultivable species, using a Jobin Yvon JY3D spectrofluorimeter equipped with a Xenon white source (Institut J. Monod, Paris, France). We suspended cells in 2 mL of absolute ethanol and then placed them in a quartz cuvette. The fluorescence emission spectra were recorded in the range of 200–600 nm, at excitation wavelengths of 263, 282, 340, and 377 nm, with an incremental step of 3 nm.
2.3. Sample preparation
To evaluate the ability of CL to localize microorganisms on minerals and constrain the associated physical processes, it was first necessary to use a simple model of prokaryotic cells. We thus chose two types of cultivable bacteria, namely, Escherichia coli (small rod, Gammaproteobacteria subdivision) and Deinococcus radiodurans (large cocci, Thermus/Deinococcus group). Both present sizes and distinguishable morphologies that highlighted the use of SEM in SE mode. E. coli cells were grown on solid Luria broth/agar in Petri dishes at 37°C for 24 h. Colonies were then collected and washed subsequently three times with ultrapure water (UPW). Subsequent dilution with UPW allows reaching an appropriate cell density on the mineral surface after deposition of 2 μL (i.e., presence of individualized cells). Samples were then dehydrated for SEM observations by sequential 2 min immersions in UPW mixed with 50, 80, and finally 100% ethanol. To evaluate the anticipated effects of a chemical fixation, generally applied to preserve environmental samples, a fraction of cells was also fixed for 3 h at 4°C by suspension in 10 mL of phosphate-buffered saline (pH 7.2; 130 mM NaCl, 7 mM Na2HPO4, 30 mM NaH2PO4) complemented with 2% (vol/vol) formaldehyde (methanol free, Ultra Pure; Polysciences). Cells were washed subsequently two times with UPW and resuspended in 10 mL of 50% (vol/vol) ethanol/phosphate-buffered saline, following the protocol described in Gérard et al. (2005). Two microliters of the obtained suspension were deposited on minerals and then dehydrated, as previously described. D. radiodurans cells were grown overnight in enriched TGY medium (1% triptone, 0.6% yeast extract, and 0.2% glucose), washed, and chemically fixed with the previously described protocol. Similarly, to reach the appropriate cell density on the mineral surfaces, we diluted an aliquot of cells with UPW. Two microliters of the suspension were then deposited on different minerals and dehydrated, as for E. coli.
The CL signal that emerged solely from the intrinsic fluorescence of unstained bacterial cells (Barnett et al., 1975; Niitsuma et al., 2005) was determined. Signatures of stained microbial cells were also evaluated by using various fluorescent dyes that targeted nucleic acids, which included (with excitation/emission wavelengths in nanometers, respectively): acridine orange (502/525, green), 4′,6-diamidino-2-phenylindole (DAPI; 358/461, blue), Hoechst 33258 (350/461, blue), SYTO-59 (622/645, red), and SYTO-13 (488/509, green). As shown in Fig. 2, the combination of the various stained cells provides a large range of available emission fluorescence (from ∼450 to ∼650 nm), which allowed us to avoid any undesirable overlap with the fluorescence emerging from the underlying mineral. Note that additional tests were also performed with different fluorophore-labeled oligonucleotide probes, that is, the FITC-labeled and Cy3-labeled non-Bact338 for Bacteria (NON-EUB, 5′-ACTCCTACGGGAGGCAGC-3′) and Cy5-labeled UNIV1389C for Archaea (S-D-Univ-1389-c-A-18, 5′-ACGGGCGGTGTGTGCAAG-3′) to increase the scale of fluorescent wavelengths considered. These probes only contain the four nucleobases—adenine, guanine, cytosine, and thymine—each of which produce respectively a fluorescent signal under UV light with the following excitation/emission wavelengths: 260/321, 275/313, 267/313, and 265/325 nm. The associated fluorophores [i.e., FITC for fluorescein isothiocyanate (495/519, green), Cy3 for cyanine 3 (550/570, red), and Cy5 for cyanine 5 (649/670, far-red), with excitation/emission wavelengths in nanometers, respectively] fluoresce under visible light excitation at a much higher wavelength.
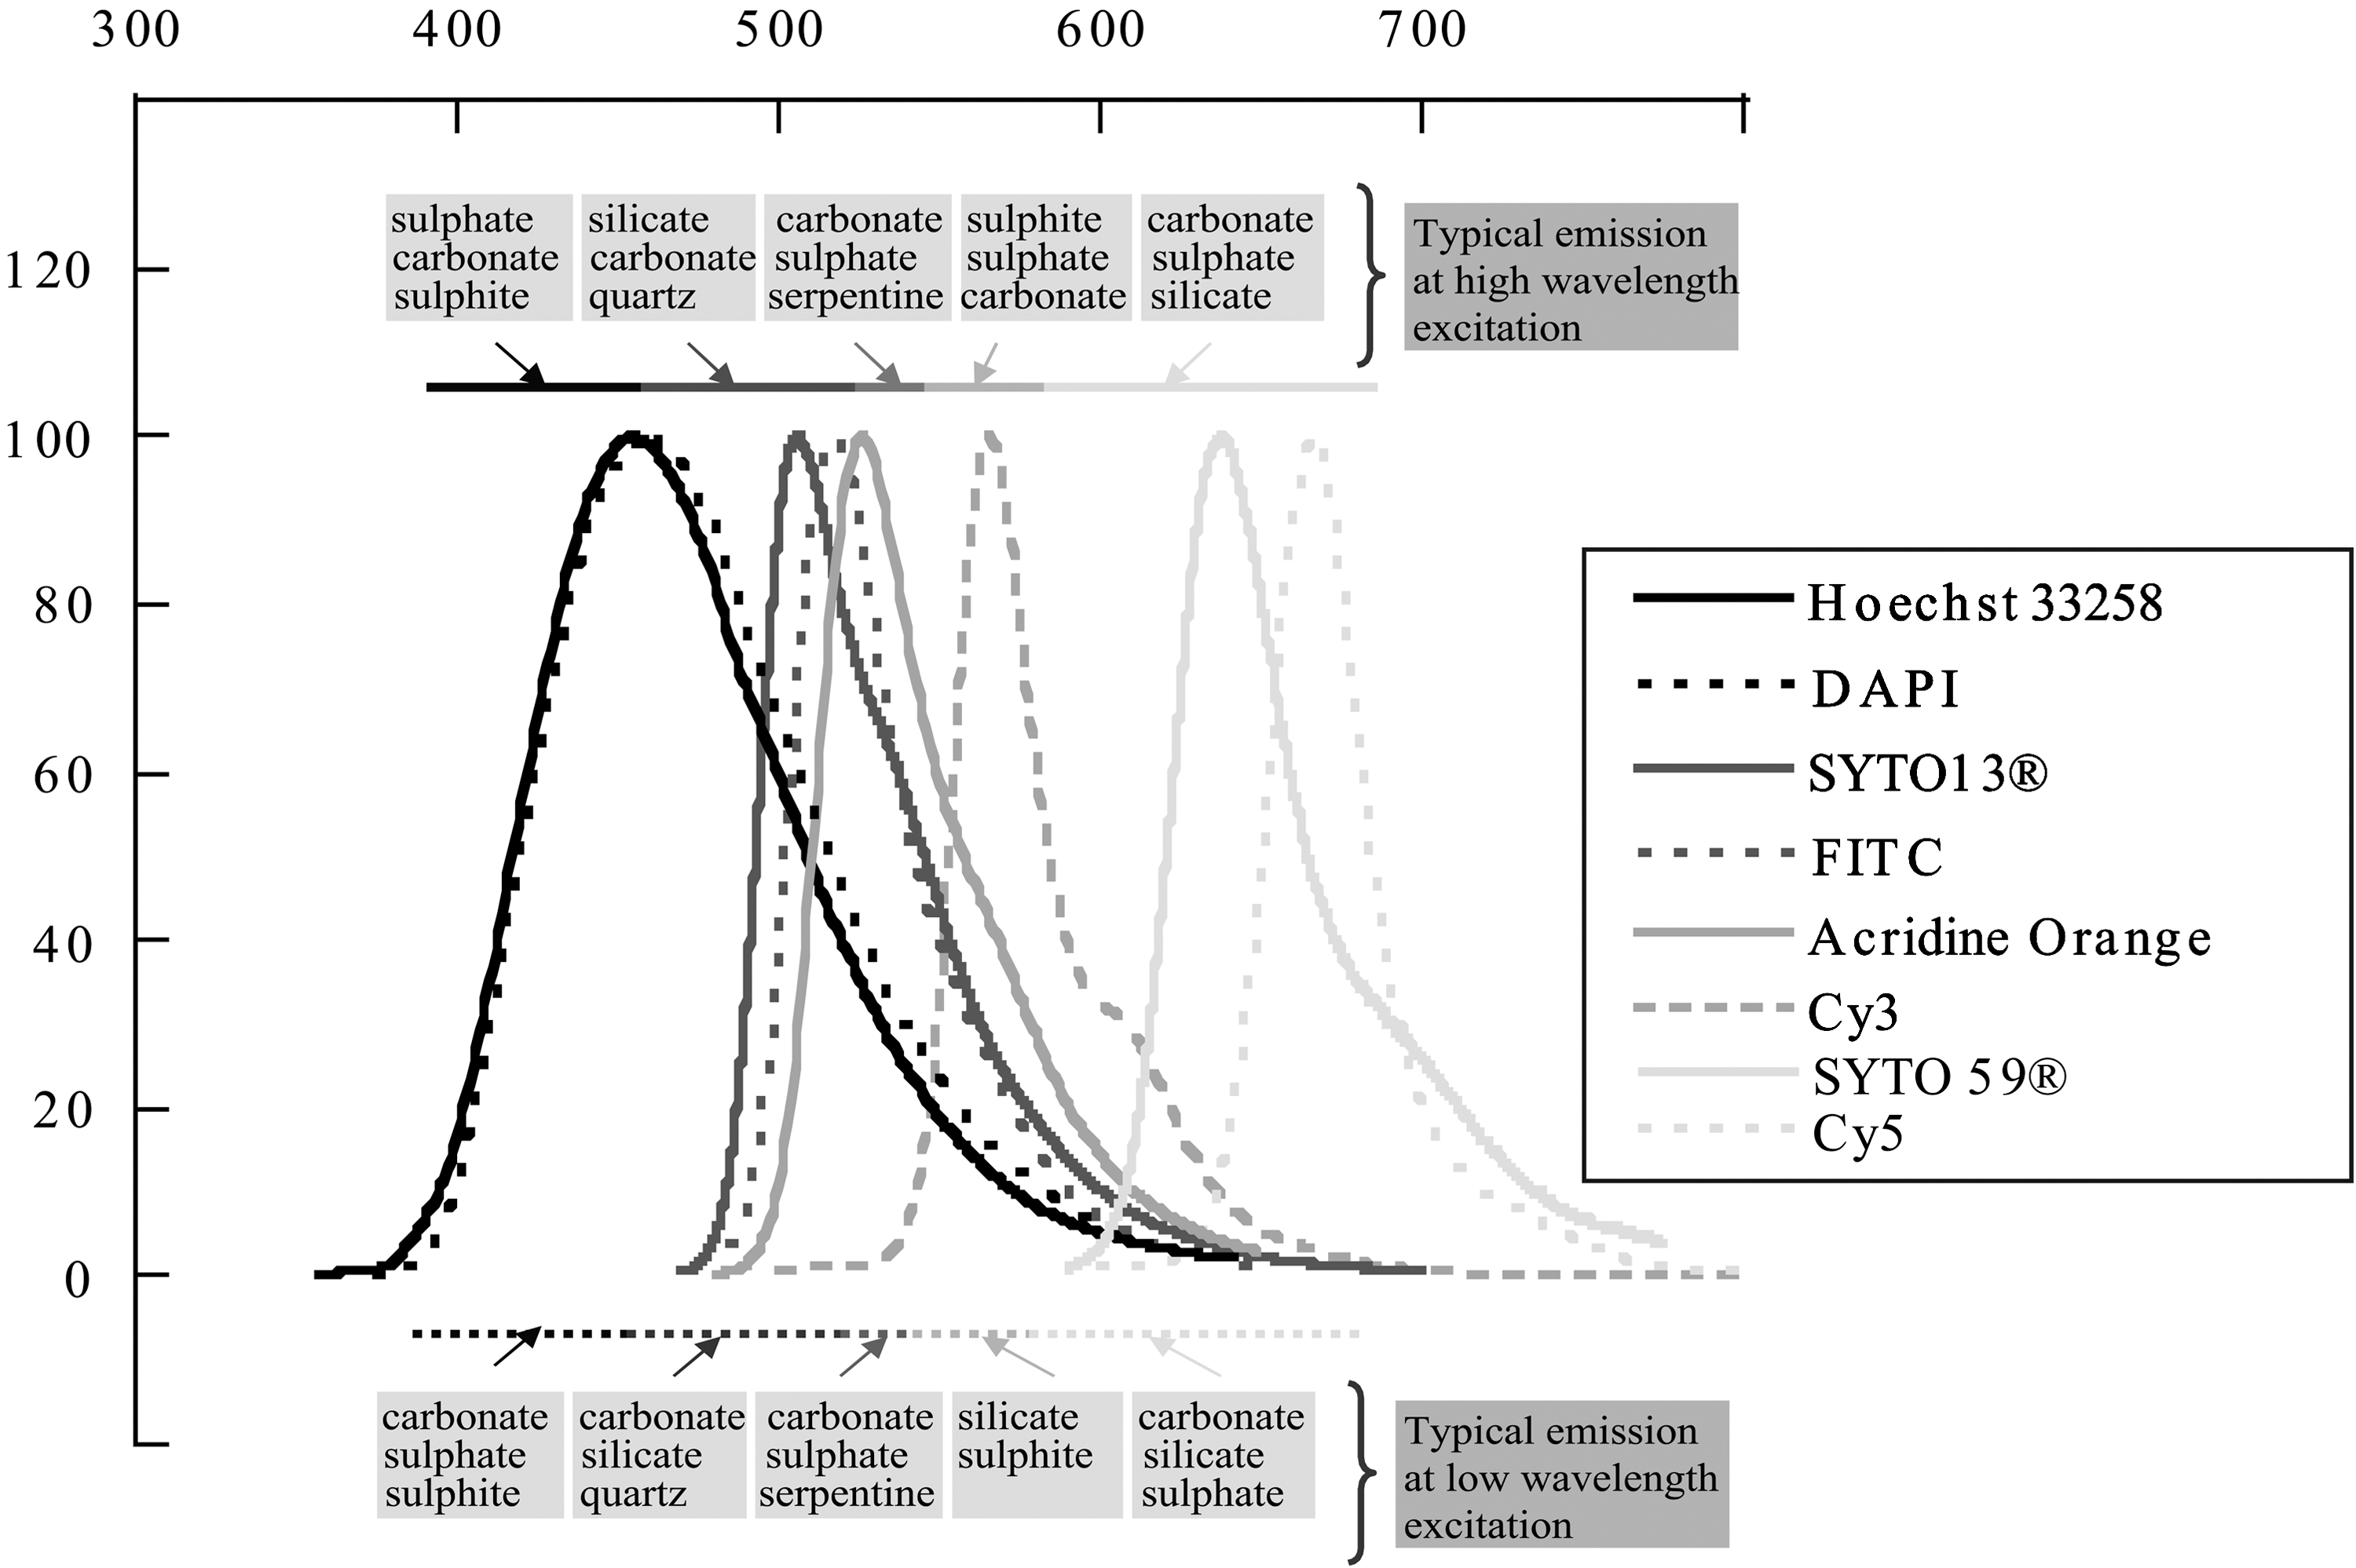
Fluorescence emission spectra of the different nucleic acid dyes and fluorophores labeling oligonucleotide probes used in this study. These emission maxima are reported for UV-visible light excitation at 352, 358, 494, 500, 549, 615, and 650 nm for Hoechst 33258, DAPI, SYTO-13, FITC, acridine orange, Cy3, SYTO-59, and Cy5, respectively. The typical ranges of fluorescence emission of common minerals are also reported for low and high wavelength excitations, respectively (after the “Online Database of Luminescent Minerals” web site:
As a first step, bacterial cells, either unstained or stained, were deposited on small discs of copper owing to the high electrical conductivity of this metal. Indeed, Götze (2000, 2002) showed that conductors display no luminescence, which thus allowed, in the present case, for proper collection of the CL signal emerging solely from the bacterial cells without any interferences arising from the support. Note that similar characteristics can be attributed to Fe2+-rich phases or Fe2+-bearing minerals due to the saturated electronic structure of ferrous iron. In a second step, we used different natural glasses and minerals that are common in the oceanic crust (i.e., basaltic glasses, magnetite, and hypersthene and actinolite as representatives of pyroxenes and amphiboles, respectively). They all contain Fe2+, thus reducing the contribution of the mineral itself in the CL emission spectra. Prior to cell deposition, each solid support was cleaned with absolute ethanol in ultrasonic bath for 10 min. Minerals and cell assemblages were coated with carbon before SEM analysis to prevent the accumulation of static electric charges on the specimens during electron beam irradiation. The carbon is, in this case, the best choice, because this type of coating has minimal effects on the intensity of the CL emission spectra (Reed, 2005).
3. Results
3.1. Unstained and stained microbial cells on copper discs
Owing to the conducting characteristics of copper, which prevents an additional CL emission emerging from the support, copper discs allow an initial investigation of the intrinsic and extrinsic fluorescence associated with unstained and stained bacterial cells. Figure 3A and 3A’ show, respectively, a representative example of SE and CL images of unstained D. radiodurans cells deposited on a copper disc. SE images correspond to the three-dimensional surface topography of a sample; and, accordingly, Fig. 3A highlights well the characteristic cocci shape of the bacteria. The microbial cells form a compact cluster at the striated surface of the copper disc. On the CL image (Fig. 3A’), the cluster geometry is well distinguishable and is brighter than the background that corresponds to the copper disc. Figure 3A’ also illustrates the intrinsic fluorescence of the cell that cumulates and shows that the thicker the cluster, the brighter the signal. Figure 3B and 3B’ represent, respectively, the SE and CL images of D. radiodurans cells that are deposited on a copper disc and stained with DAPI. As in the previous case, a good correspondence can be seen between the location of the cocci-shaped cells, imaged on the SE image, and the associated bright fluorescence signal obtained on the CL image. Nevertheless, no significant difference in terms of signal intensity can be found on both CL images for the two types of cells (i.e., unstained and DAPI stained; Fig. 3A’ and 3B’). The same observations can be made for Fig. 3C and 3C’, which display, respectively, the SE and CL images of E. coli cells that are deposited on a copper disc and stained with DAPI. In this case, however, despite the washing steps prior to cell deposition, residues of the solid Luria broth/agar medium are still present. These produce a significant CL emission, which is underlined by white stars in Fig. 3C’. This CL signal is somewhat more intense than the one produced by the microbial cells, but it is associated with a clearly distinct geometry that cannot be correlated to any relief in the SE image (Fig. 3C). Overall, a good correspondence can be seen, in these three examples, between SE and CL images (i.e., cell morphology and fluorescence emission), and both intrinsic and extrinsic fluorescence emerging from stained or unstained cells appear intense enough to be properly detected. Here, fading under high beam current is not a limiting factor for cell imaging.

SE (
To establish the CL signature of microbial cells and investigate the effect of staining upon it, CL spectra were collected on individual cells that were unstained or stained with various types of fluorescent dyes. Results are compiled in Fig. 4. Figure 4A shows representative examples obtained on unstained microbial cells of E. coli. Both fixed and unfixed cells were used to assess the effect of a chemical fixative that is often used to preserve biological samples for subsequent molecular analysis. Each normalized spectrum represents a mean value of several spectra acquired on the same point under equivalent experimental conditions. The flat CL spectrum that emerged from the nonluminescent copper support is indicated as a reference. Two different types of spectra can be distinguished. The first type was obtained on unfixed E. coli cells and is characterized by two sharp maxima at 320 and 520 nm, each one being associated with secondary peaks at 380 and 550 nm, respectively. The other type was obtained on chemically fixed E. coli cells and is characterized by a single broad maximum centered on 750 nm. Figure 4B presents different spectra obtained on DAPI-stained, unfixed E. coli cells deposited on a copper disc. An evolution of the spectra can be seen, from spectrum with two maxima at 320 and 520 nm, as previously described for the same type of cells that were unstained, to spectrum with two absolute maxima at 380 and 520 nm. The spectra with three absolute maxima at 320, 380, and 520 nm correspond to a combination of the two previous ones, with variations in the relative peak intensities. The peak shoulder at 550 nm is systematically present. Note that, generally, DAPI-stained cells provide, under UV-visible light excitation, a maximum fluorescence emission at 461 nm (see Fig. 2), which is not observed in the CL spectra displayed in Fig. 4B. Figure 4C compiles the mean CL spectra obtained from numerous acquisitions on unfixed E. coli cells that were deposited on copper discs and stained with Hoechst 33258, SYTO-13, acridine orange, and SYTO-59 dyes. The mean spectrum obtained with DAPI is also displayed for comparison. Under a UV-visible light excitation, these dyes are characterized by fluorescence emission maxima positioned at 470, 509, 526, and 644 nm, respectively (see Fig. 2), and should in accordance present the same emission peaks with electron-induced fluorescence. Nevertheless, as previously observed for DAPI, the spectra do not exhibit the characteristic peaks of the nucleic acid dyes but are mainly characterized by the presence of the four previously described peaks at 320, 380, 520, and 550 nm with varying relative intensities.
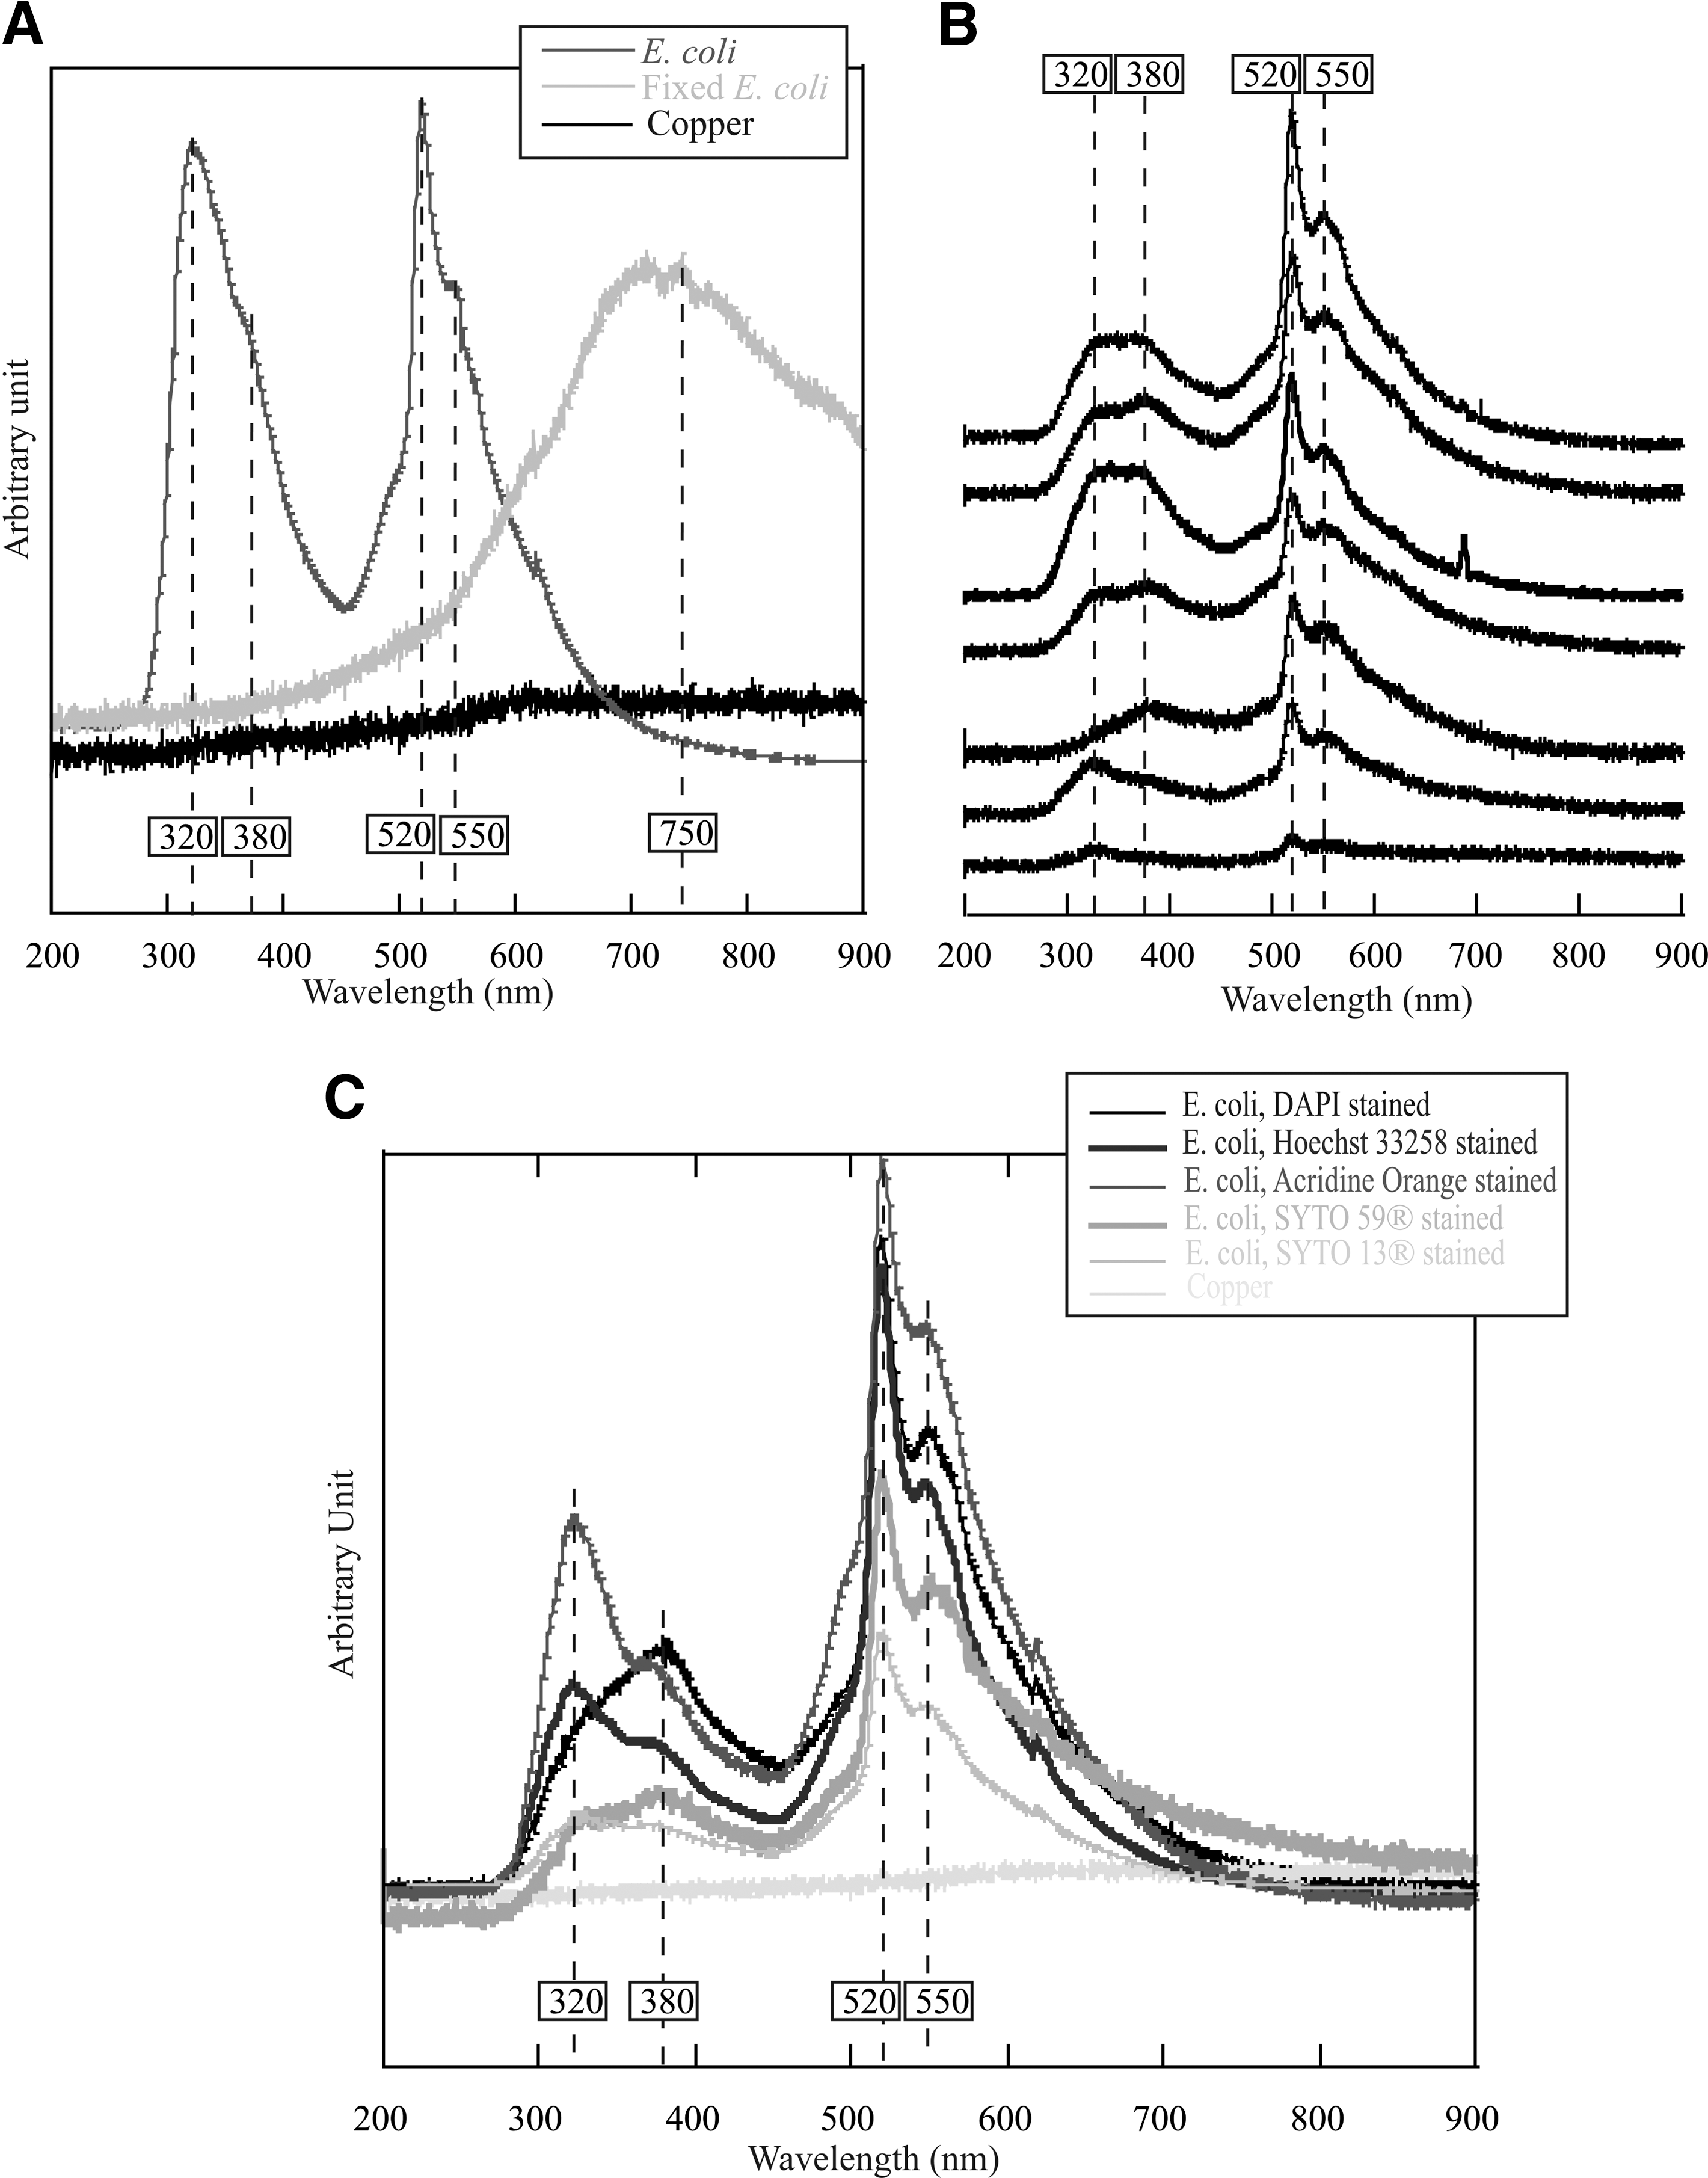
CL spectra of microbial cells deposited on copper discs. (
Bacterial cells represent complex molecular assemblages comprised of DNA/RNA, proteins, lipids, and polysaccharides, which consist of fluorescent molecules such as aromatic amino and nucleic acids, coenzymes that will contribute to the detected CL emission. In accordance, to understand fully the obtained CL spectra, we also investigated the CL signal associated with three different fluorophore-labeled oligonucleotide probes (FITC-labeled and Cy3-labeled non-Bact338 for Bacteria and Cy5-labeled UNIV1389C for Archaea), a simpler model of mixed nucleic acids and fluorophore. Figure 5 presents the CL spectra obtained once these oligonucleotide probes were deposited on copper discs. These spectra are characterized by two sharp maxima at 320 and 520 nm and secondary peaks at 380 and 550 nm, as previously described for unstained and stained bacterial cells (Fig. 4). The Cy5-labeled probe spectrum highlights in addition a very broad peak centered at 750 nm. It is worth noting that the spectrum obtained with the FITC-labeled probe is slightly different from all the previous spectra, including those presented in Fig. 4, with very weak peaks at the lowest wavelengths and a maximum peak appearing at 550 nm, usually less intense than the 520 nm peak.
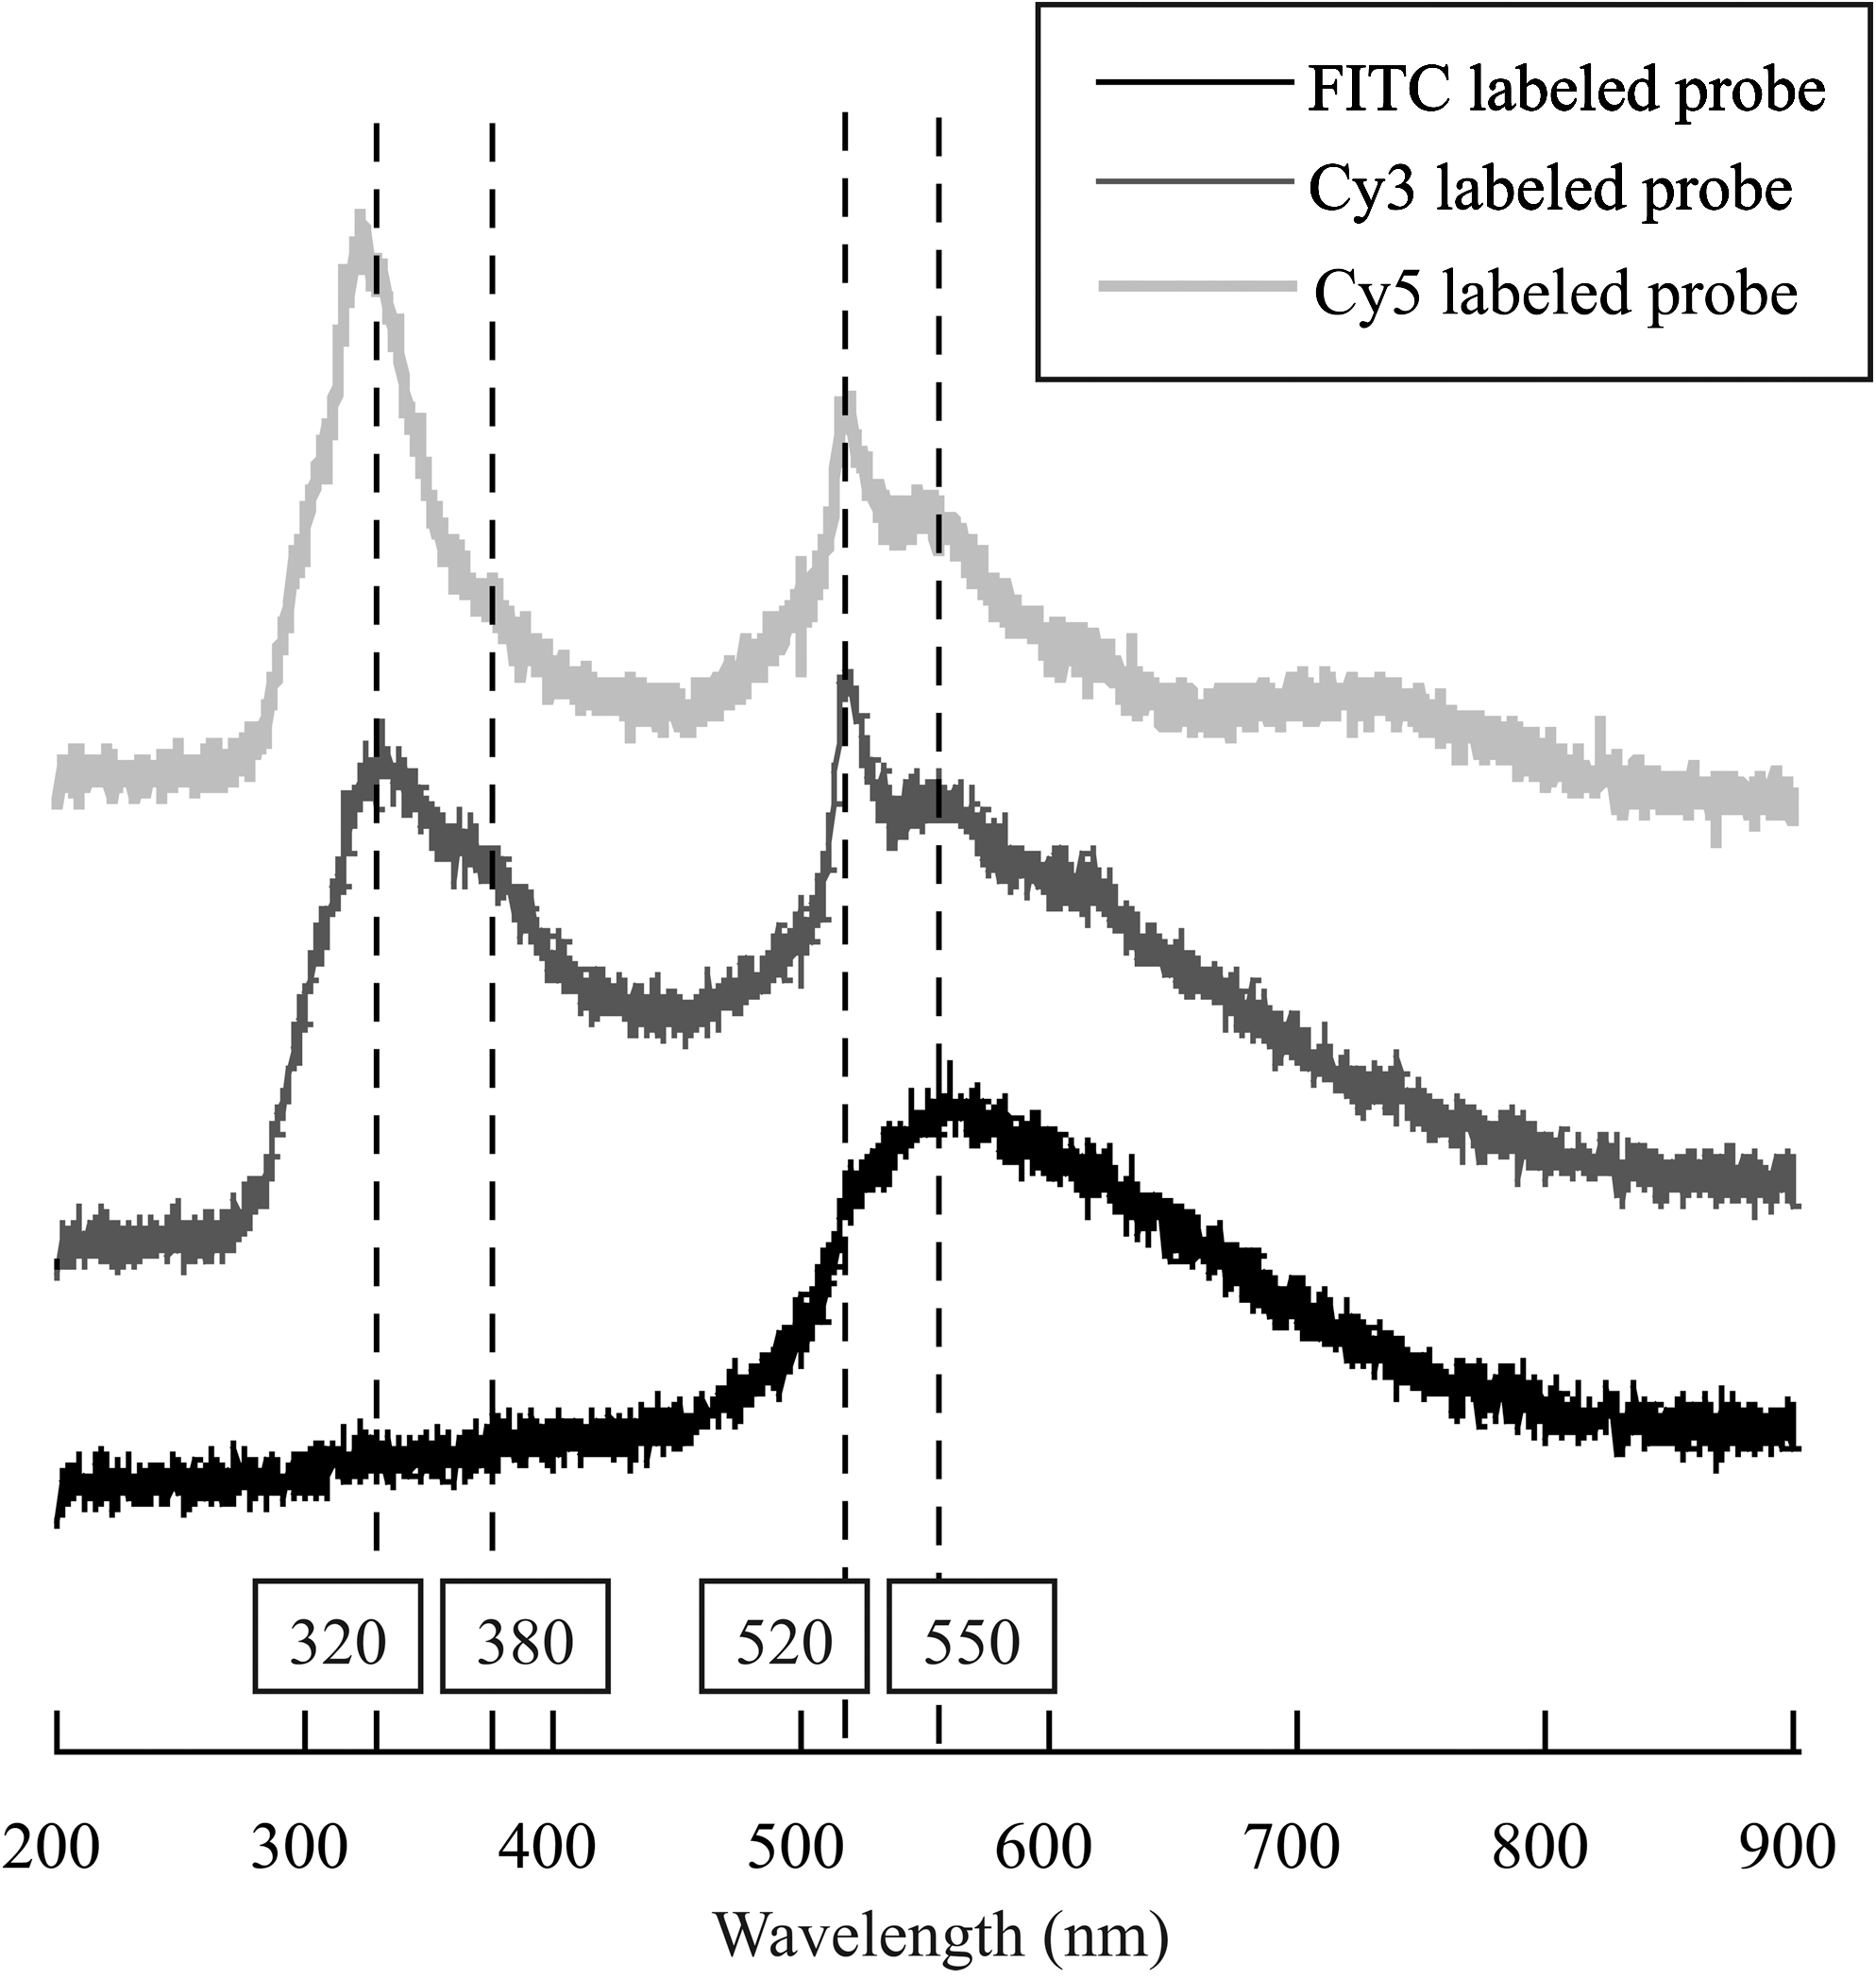
CL spectra of oligonucleotide probes labeled with FITC, Cy3, and Cy5 and deposited on copper discs.
Fluorescence emission spectra were acquired in parallel on suspended D. radiodurans cells with a fluorimeter. This was aimed at characterizing the cellular intrinsic fluorescence and highlighting eventual differences with CL that resulted from an electron beam excitation. We used a large range of incident wavelengths (i.e., 200–600 nm) at which many molecules are excited. This includes, in particular, aromatic amino acids in proteins and nucleic acids in DNA/RNA (Cantor and Schimmel, 1980; Ammor, 2007). The results (Fig. 6) exhibit in accordance two major peaks at 305 and 437 nm. Two smaller emission peaks at 377 and 386 nm can also be observed. Note that, under UV-visible light excitation, it is not possible to record fluorescence emission wavelengths greater than 500 nm.

Fluorescence emission spectra of D. radiodurans cells suspended in absolute ethanol (at excitation wavelengths of 263, 282, 340, and 377 nm).
3.2. Microbial cells on minerals
Once we evaluated the ability of CL to image bacteria on a nonluminescent metal (i.e., copper discs), tests were carried out on microbial cells deposited on natural basaltic glasses and minerals, namely, magnetite, pyroxene, and amphibole. Figure 7A and 7A’ show, respectively, a representative example of SE and CL images of unstained cells of D. radiodurans deposited on magnetite. The SE image well highlights the characteristic cocci shape of the bacteria. On the CL image, individual cells (indicated with arrows on Fig. 7A and 7A’) appear brighter compared to the magnetite. Light small dots are also visible on the CL image (white stars on Fig. 7A’) but do not correspond to any cell's location on the SE image. They probably represent different phases at the surface of the magnetite. This first example proves that CL images, when used in combination with SE images, are relevant in identification of bacterial cells on magnetite. Similarly, Fig. 7B and 7B’ represent, respectively, the SE and CL images of E. coli deposited on natural basaltic glass. We can notice, as indicated previously, the same good correspondence between the cell locations highlighted on the SE image and the bright well-defined dots on the CL image. We are able to distinguish each microbial cell on both types of images, which thus implies that CL is also well suited to basaltic glasses for the identification of microbial cells. When the mineral surface is less regular (e.g., cleavage planes, foliations, striations), as is the case for pyroxene (Fig. 7C and 7C’, for SE and CL images, respectively) and amphibole (Fig. 7D and 7D’, for SE and CL images, respectively), additional luminescence can emerge from the mineral itself and attenuate the CL of the cells themselves. They are still identifiable but consequently more difficult to isolate.
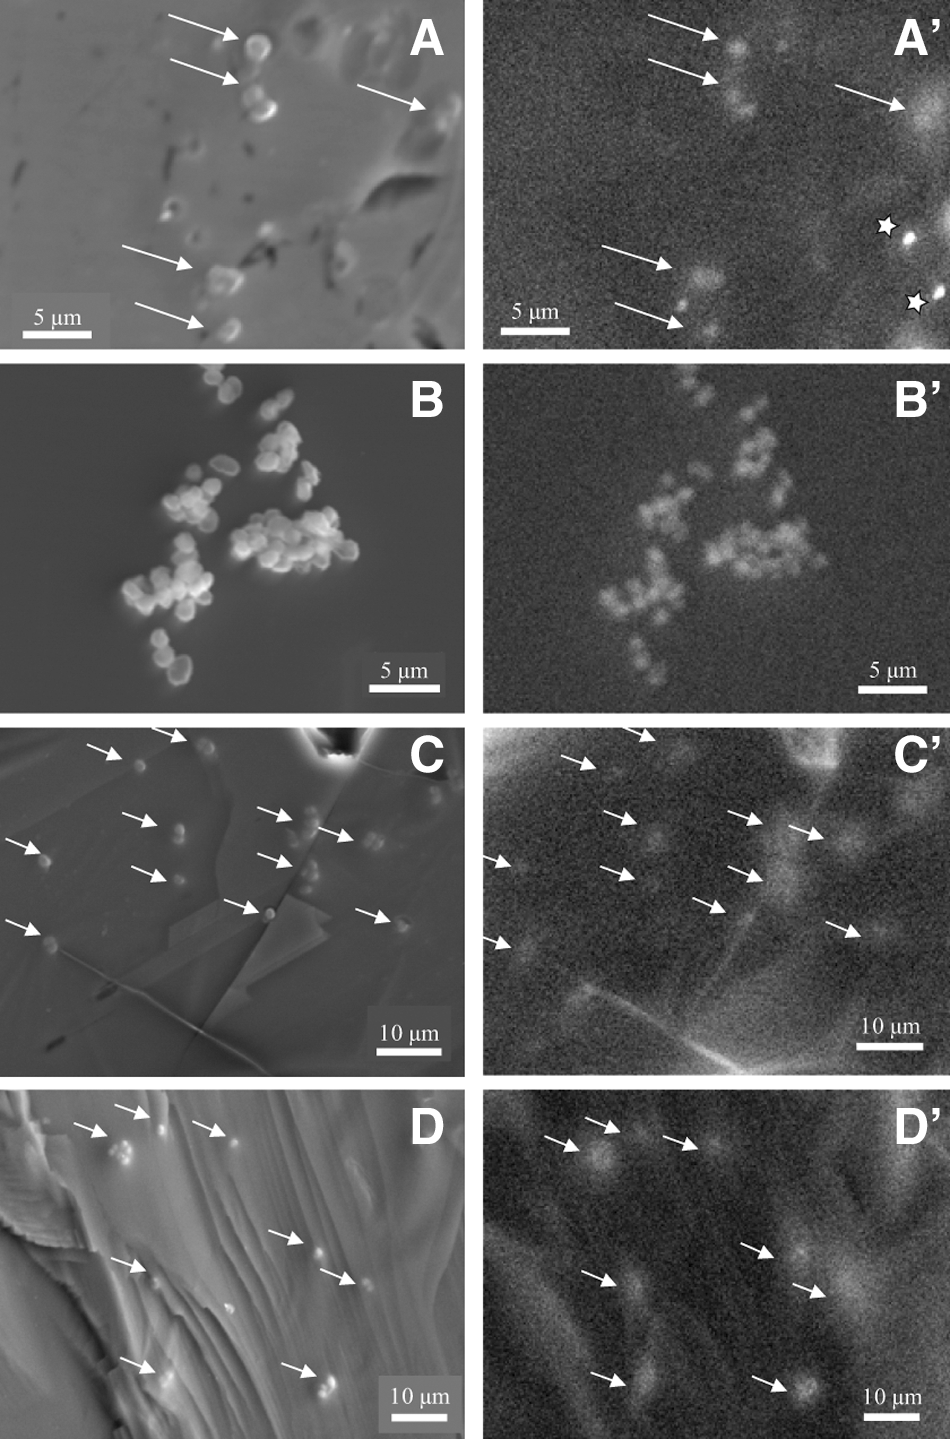
SE (
The CL spectra were collected simultaneously for all mineral-bacteria assemblages. As an illustration, Fig. 8 shows mean CL spectra obtained on unstained microbial cells deposited on magnetite, basaltic glass, and amphibole. Also shown are the corresponding CL spectra of the supports themselves. Note that, due to their high Fe2+ content, the minerals used in this study display only a weak cathodoluminescent signal, the most important one being associated with the basaltic glass. This is likely due to its microlitic texture characterized by the presence of micrometric plagioclase crystals. For the CL signature of bacterial cells, we can distinguish three different kinds of spectra, depending on the nature of the minerals and the deposited bacteria. Both types of cells produce, when deposited on basaltic glass, a spectrum characterized by a weak signal with two small peaks at 320 and 380 nm. On magnetite, the CL spectrum obtained on E. coli exhibits the two characteristic peaks at 320 and 380 nm and a broad one around 500 nm. On amphibole, the CL spectrum of D. radiodurans displays a broad peak around 750 nm as previously described for chemically fixed cells.
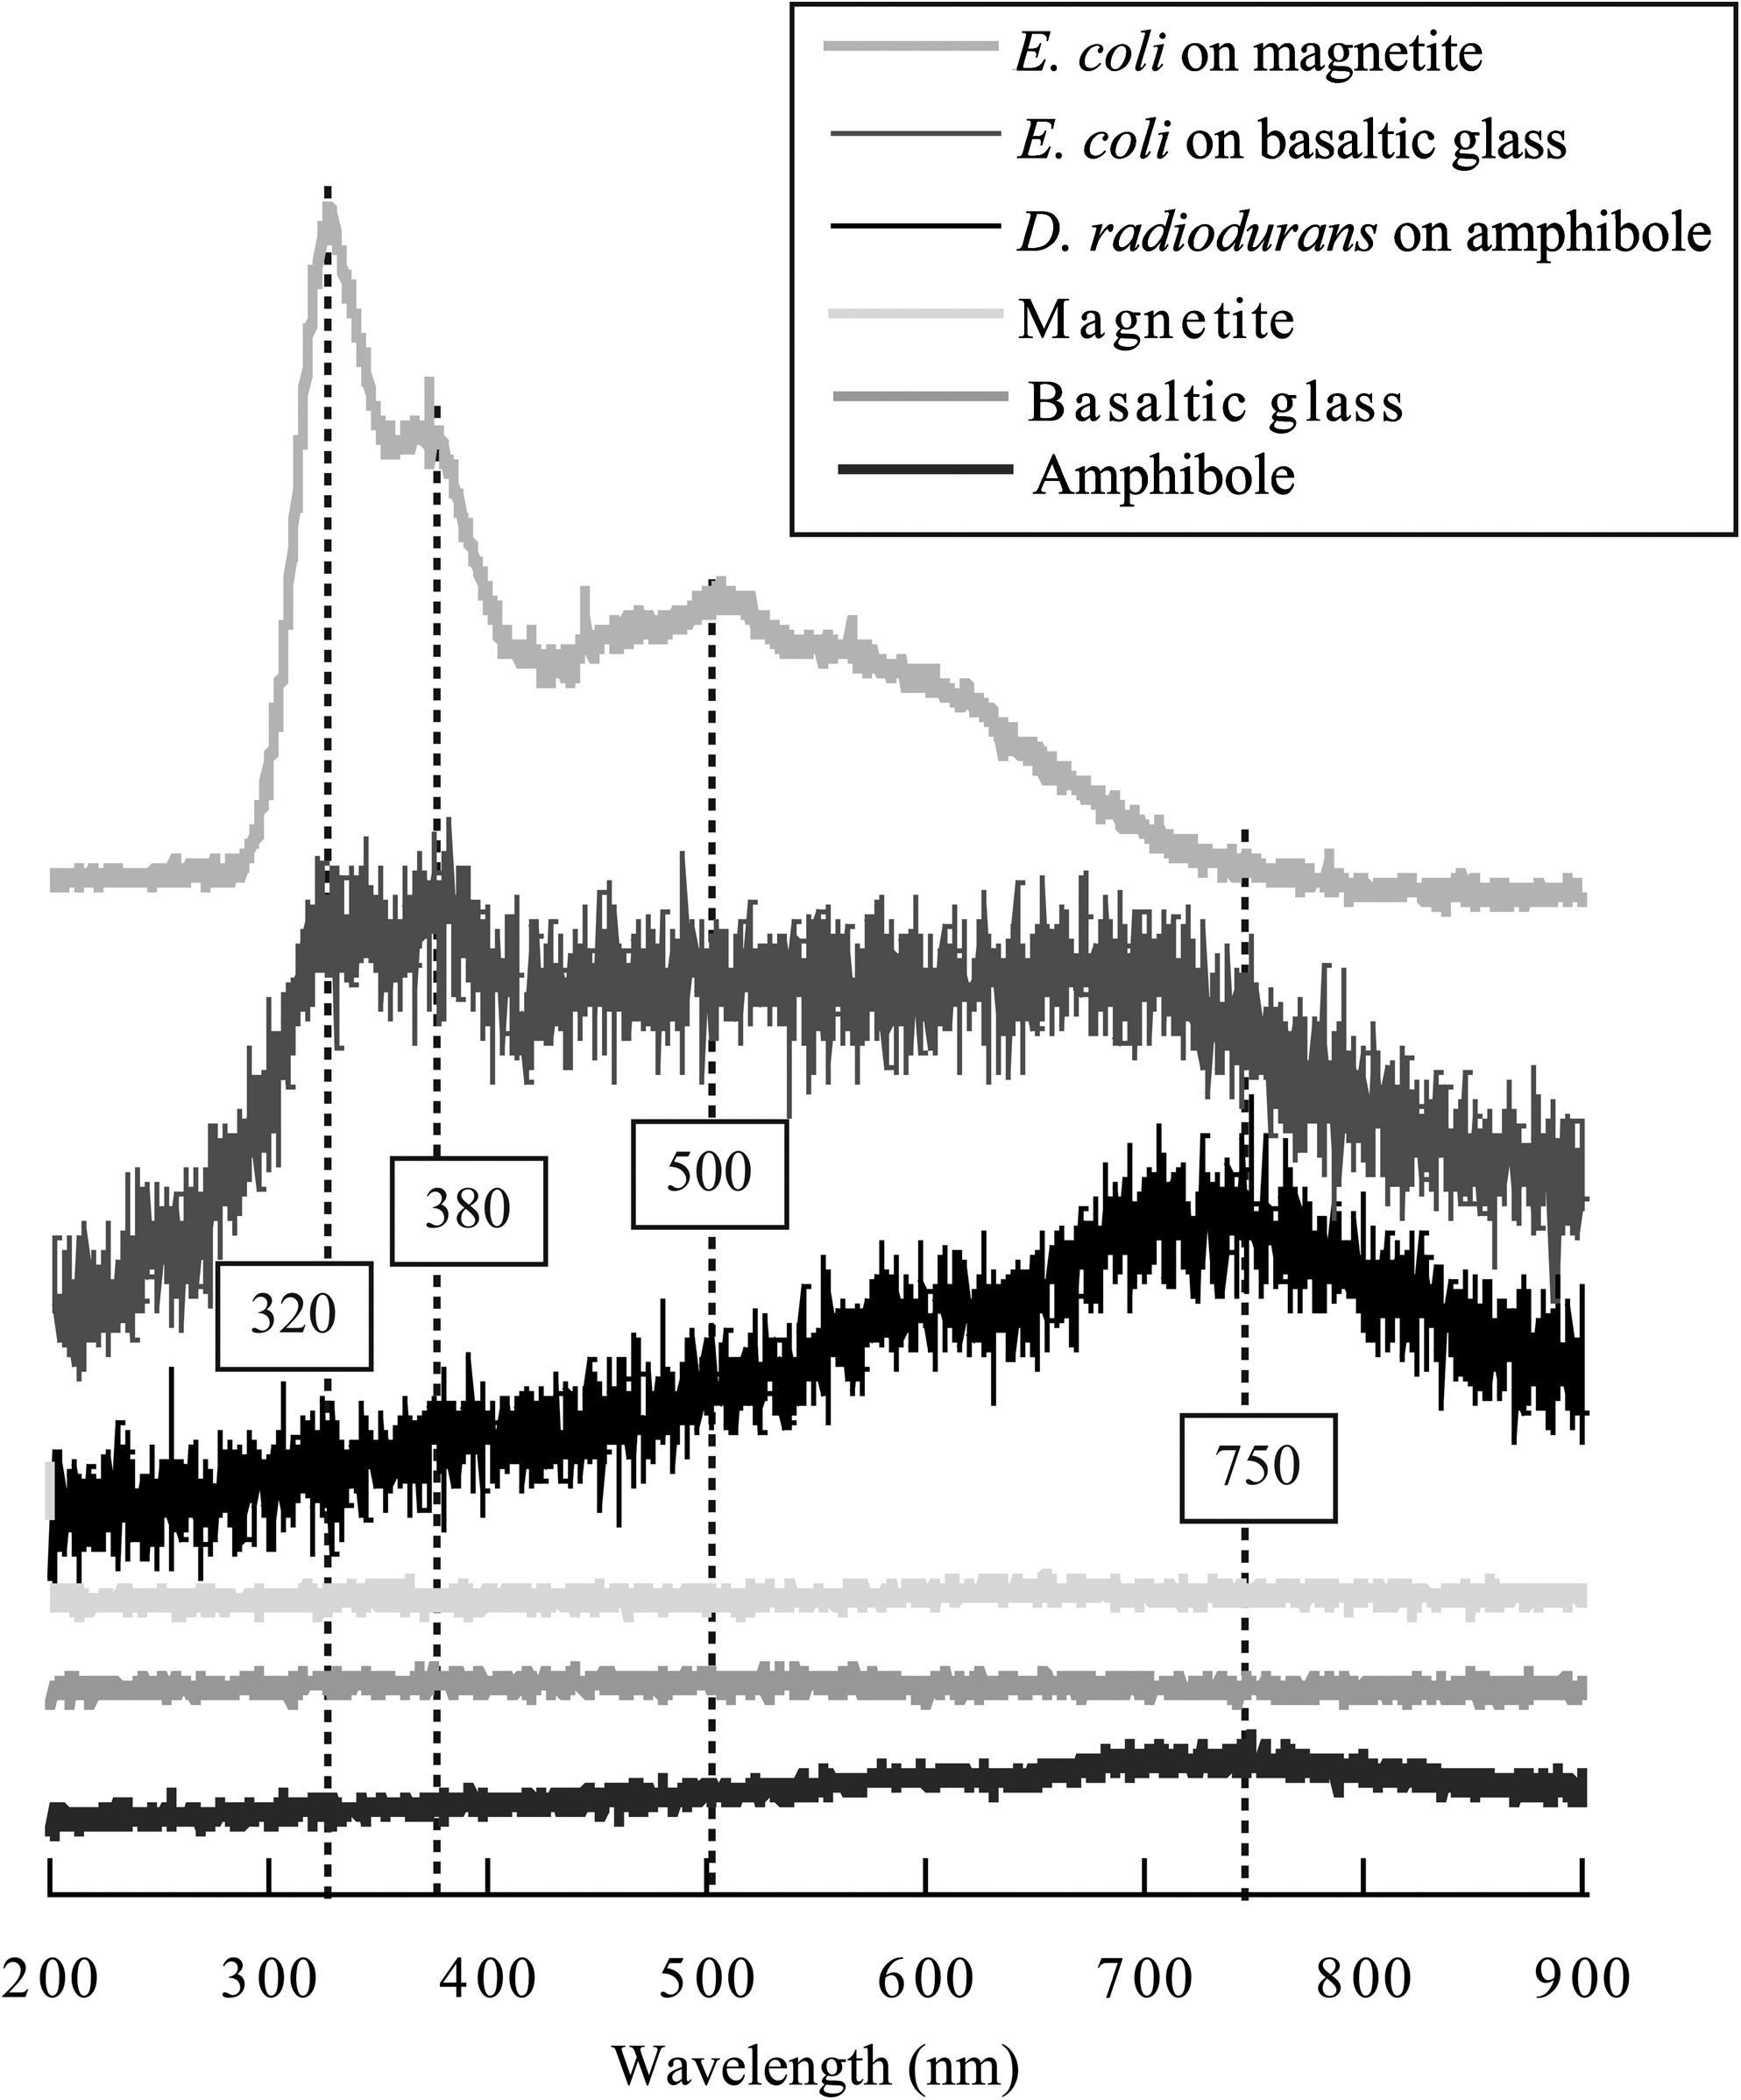
CL spectra of unstained D. radiodurans and E. coli cells deposited on magnetite, basaltic glass, and amphibole, and CL spectra of rock and mineral substrates.
4. Discussion
Although previous studies have already reported the relevance of using CL for biological purposes, its application has until now been limited, mainly because organic molecules produce a weak signal that is easily faded under high beam current (De Mets, 1974; Hough et al., 1976; Cavellier et al., 1978; Cavellier and Berry, 1985). The first successful attempt at observing, through combined SE and CL images, the distribution of injected fluorescent substances in relation to the three-dimensional structure of cells and tissues was only reported recently by Kimura et al. (2004). Kimura et al. (2004), however, dealt with highly fluorescent tracers incorporated in large eukaryotic cells. In accordance, the use of CL to detect smaller prokaryotic cells on mineral surfaces, carrying their own CL signature, constitutes an additional analytical challenge. Nonetheless, the results obtained here with microscopy (see Figs. 3 and 7) demonstrate the suitability of the approach to discriminate real microorganisms from inorganic structures on different types of support.
The similarity of CL emission spectra collected between 200 and 900 nm on unstained and stained prokaryotic cells or oligonucleotide probes leads us to infer that the recovered signal results from the intrinsic fluorescence emitted by the biological macromolecules constituting the cells. Otherwise, we would observe, on the CL spectra associated with cells stained with nucleic acid dyes, variability and specific peaks at wavelengths characteristic of the dye fluorescence emission. Conversely, regardless of the dye used, the collected CL emission is overall identical and characterized by peaks at 320, 380, 520, 550, or 750 nm. None corresponds to the peaks potentially emitted by the nucleic acid dyes used to stain the cells and reported in Fig. 2. Moreover, those fluorescent dyes are known to fade rapidly as a result of the irradiation damages induced by the electron beam (De Mets and Lagasse, 1971; De Mets et al., 1974; Niitsuma et al., 2005). As a first conclusion, bacterial cells are solely detected and imaged with CL on a solid surface, due to their intrinsic fluorescence.
With the exception of pigments not considered here, a variety of cell components exhibit intrinsic fluorescence, following specific excitations in the UV-visible region. The dominant sources correspond to the three aromatic amino acids (tryptophan, tyrosine, and phenylalanine), the nucleic acids (adenine, guanine, cytosine, thymine, and uracil), the reduced form of nicotinamide adenine dinucleotide ±phosphate (NADH and NADPH), and the oxidized form of flavin adenine dinucleotide (FAD), as reported by Cantor and Schimmel (1980). The characteristics of the fluorescence emission of these molecules are considered as a sensitive indicator of the presence of biological materials and have been investigated previously in fluorimetry for their ability to discriminate bacteria at the family, genus, species, and the subspecies level (Leblanc and Dufour, 2002; Estes et al., 2003; Bhatta et al., 2006; Ammor, 2007). Note that the fluorescence intensities of NADH, NADPH, and FAD, as coenzymes, are closely related to cell metabolic state, while those of amino and nucleic acids are less affected until the cellular death, when they are degraded and rarely preserved (Ammor, 2007). Maximum fluorescence emission values of these biological molecules excited at optimized absorption wavelengths ranging from 260 to 450 nm are compiled from literature in Table 1 (Koenig and Schneckenburger, 1994; Ammor, 2007). We can notice that nucleic acids and aromatic amino acids produce fluorescence emission values between 300 and 350 nm, while the enzymes or coenzymes display maxima in the range of 440–550 nm.
The excitation wavelengths of our fluorimetric measurements performed between 260 and 380 nm on suspended cells of D. radiodurans slightly differ from these data. Despite this, Fig. 6 highlights major emission peaks around 305 and 437 nm, which are consistent with the presence of (1) DNA(/RNA), as assemblages of adenine, guanine, cytosine, thymine (or uracil), and (2) coenzymes such as NADH/NADPH. The origin of the weaker emission peaks at 377 and 386 nm cannot be explained consistently with the present references. They could likely correspond to Raman bands, as observed by Leblanc and Dufour (2002), following excitation at 290 nm. Importantly, the significant shifts observed between the maximal emission wavelengths of whole cells (Fig. 6) and isolated molecules (Table 1) show that the intrinsic cellular fluorescence cannot be simply seen as the sum of the fluorescence emitted by their constituting molecules and that the chemical environment of the fluorescent molecule (the cell itself together with its mineral support) is an important parameter to consider. It could indeed be responsible for inter- or intramolecular photophysical processes (e.g., intramolecular charge transfer, electron transfer between molecules) that have the capacity to modify the characteristics of the fluorescence emission. Theoretically, intermolecular interactions such as the formation of excited dimer (or excimer) or excited complex (or exciplex) result in a fluorescent peak at a higher wavelength than that of the monomer (Valeur, 2002). Practically, the fluorescence of tryptophan has been shown to be highly sensitive to its local environment, and spectral shifts in its emission have been observed as a result of diverse phenomena, such as the binding of ligands and protein–protein associations (Lakowicz, 1999). This could explain some of the discrepancies observed in this study.
The interpretation of the CL spectra obtained here from stained and unstained cells is based on the commonly accepted principle that considers that CL, excited via an energized electron beam, is analogous in many respects to conventional fluorescence elicited under UV-visible light (Hough et al., 1976). Consequently, both fluorescence emission wavelengths can be directly compared. The largest difference lies in the energy of the excitation source. CL results in higher energy and power density than photoluminescence. This results in greater penetration depth, sampling volume, and photon emission but also in more important irradiation damages induced by the interactions between the charged incoming electron beam and the specimen. Moreover, while the excitation is monochromatic in conventional molecular fluorescence (through the respective use of dichroic mirrors or lasers in microscopy and of filters or gratings in spectrofluorimetry), the bandwidth is larger for the electron excitation, because different mechanisms of luminescence are simultaneously used. This will impact the resolution of the collected CL spectra, which would display broader peaks compared to conventional fluorescence.
Taking these two last points into account (i.e., the important role of the fluorophore local environment and the lower spectral resolution of CL), the comparison of the obtained CL spectra leads us to interpret differently the peaks at 320 and 380 nm and the ones at 520 and 550 nm. As shown, for example, in Fig. 4B, variations of the relative intensities are frequently observed for the peaks at 320 and 380 nm whereas for 520 and 550 nm the peaks' ratio appears relatively constant. Consequently, the peaks at 320 and 380 nm are likely produced by two different molecular species at different levels within the analyzed cells. Under UV-visible light excitation, the maximal fluorescence emission wavelengths of nucleobases all fall within the range of 308–325 nm (Table 1). Among the amino acids, the indole groups of tryptophan residues are well known to be the dominant source of UV absorbance and fluorescent emission (Hough et al., 1976; Leblanc and Dufour, 2002). Maximal fluorescence emission of proteins is thus found at higher wavelengths (i.e., 350 nm). The CL peaks at 320 and 380 nm could then be attributed to these macromolecules (i.e., nucleic acids and tryptophan, respectively). Coherent shifts in wavelengths can likely be explained by intermolecular processes induced by the local environment (i.e., the cell itself). This is consistent with the results obtained on oligonucleotide probes labeled with Cy3 and Cy5 (Fig. 5). These spectra display an intense peak at 320 nm that results from the excitation of nucleic acids and a weak peak at 380 nm attributed to the organic colorants themselves. Indeed, Cy3 and Cy5 are polymethine dyes that hold two quaternized nitrogens (Ernst et al., 1989). Both nitrogens are part of a heteroaromatic molecule, similar to the indole groups of tryptophan, and could therefore be responsible for the emission at 380 nm. Concerning the oligonucleotide probes labeled with FITC, which show only very weak peaks at 320 and 380 nm and a broad one around 550 nm, it should be noted that this organic fluorophore, when conjugated with oligonucleotide probes, requires a modification of the oligonucleotide chain by an amine functional group. This modification could be responsible for the obtained signal for FITC-labeled oligonucleotide probes.
To identify the origin of the CL peaks emitted at 520 and 550 nm, we can refer to metabolic coenzymes like NADH/NADPH and FAD, which present, under UV-visible light excitation, fluorescence peaks in the range of 440–535 nm (Table 1). The intracellular quantities of these coenzymes, and thus their fluorescence intensity, are directly related to the metabolic state. The investigated cells sustained an exponential growth before deposition on minerals, which thus explains the intense peaks collected at these wavelengths. Note in addition that both types of coenzymes correspond to adenine dinucleotide; and, consistently, these CL peaks are also generated by the oligonucleotide probes labeled with Cy3 and Cy5 (Fig. 5).
Concerning the cells that were chemically fixed, they are characterized by a broad CL emission peak at 750 nm, which is not detected for living cells. This observation could relate to porphyrins that are organic compounds containing four pyrrole rings (C4H5N) and give under UV-visible light excitation a fluorescence emission around 620–700 nm (Schneckenburger et al., 1989). However, it could be linked more probably to the fixation protocol that involves formaldehyde. Formaldehyde creates methylene bridges between nitrogen and carbon atoms from proteins that are very stable and block specifically the reactive sites of indole or its derivatives (Puchtler and Meloan, 1985). These result in new molecules or conformations that generate a different fluorescence signal compared to that of the initial biological molecules, and this could thus explain the CL peak observed at 750 nm.
The convincing results obtained in microscopy on minerals highlight the relevance of using CL for microbial cell identification. Nonetheless, for the glass and the two types of minerals presented in Fig. 8 (i.e., basaltic glass, magnetite, and amphibole), these underlying supports modify slightly the CL fingerprint of bacterial cells. As an illustration, the CL spectra obtained on bacteria deposited on the basaltic glass show only weak peaks at 320 and 380 nm and no signal at higher wavelengths. This pattern is perhaps due to the presence within the basalt of fluorescent annihilators that interact with the fluorescence centers of the metabolic coenzymes and inhibit fluorescence emission. It is noteworthy that on magnetite, in addition to the peaks at 320 and 380 nm, the cells present a third broad peak around 500 nm, which has not been reported before. This 500 nm peak could be related to a modification of the emission peaks at 520/550 nm through excitation energy transfers between the coenzymes and the mineral. This phenomenon occurs when a partial superposition exists between the emission spectrum of the donor and the absorption spectrum of the receptor. Finally, for the amphibole, the CL spectrum is characteristic of the ones obtained for chemically fixed cells, with a weak peak at 750 nm.
5. Conclusions and Implications
Results of the present study demonstrate the ability of cathodoluminescence, when used in conjunction with secondary electron imaging, to localize reliably and identify microbial cells on mineral surfaces, even if the mineral is in itself slightly cathodoluminescent or presents an irregular surface. This technique, while not widely used currently, can thus discriminate between real microorganisms and biomorph inorganic structures within mineralogical assemblages. This first simplified approach was necessary, however, to constrain the physical processes involved before tackling with environmental samples. This allows for establishment and an understanding of the cathodoluminescent signature of microbial cells, which are characterized by specific emission wavelengths at 320, 380, 520, 550 nm, attributed respectively to fluorescence of the nucleic acids, the tryptophan amino acid, the NADH/NADPH coenzymes, and the FAD coenzymes. Cells can also be discriminated after formalin fixation based on the broad specific cathodoluminescent signal centered around 750 nm. Lastly, we have shown that, for cell detection on mineral surfaces, the intrinsic fluorescence of microorganisms, induced by aromatic amino acids and nucleic acids together with coenzymes, prevails upon extrinsic fluorescence through staining. Moreover, due to the versatility of scanning electron microscopy that combines several spectroscopic techniques, the capability of simultaneously collecting complementary information on the nature and chemistry of the associated mineral phases (e.g., through energy-dispersive X-ray analysis or Raman) allows for a thorough characterization of the microhabitat of microbial cells. Cathodoluminescent microscopy and spectroscopy are thus important tools with which to detect life traces in rock samples and characterize mineral-hosted ecosystems.
Footnotes
Acknowledgments
This work was funded by the Centre de Recherches sur le Stockage Géologique du CO2 (IPGP/TOTAL/SCHLUMBERGER) and the ANR Jeune Chercheur Mothseim (Proj. N° NT05-3_42213) to J. Escartín. We thank especially O. Boudouma, in charge of the “Service Commun de Microscopie Electronique à Balayage” (UPMC, Paris, France) for assistance during experiments and J.M. Camadro (Laboratoire d'Ingénierie des Protéines et Contrôle Métabolique, Institut Jacques Monod, Paris) for access to the spectrofluorimeter. A special thanks to Emmanuelle Gérard (GAP/IPGP, Paris) for material and useful discussions and to J. Escartin (LGM/IPGP, Paris) for his critical rereading of the manuscript. We thank J. Götze and anonymous reviewers for their constructive comments and remarks on this manuscript. This is IPGP contribution N° 3038.
Author Disclosure Statement
No competing financial interests exist.
Abbreviations
CL, cathodoluminescence; Cy3, cyanine 3; Cy5, cyanine 5; DAPI, 4′,6-diamidino-2-phenylindole; FAD, flavin adenine dinucleotide; FITC, fluorescein isothiocyanate; NADH, nicotinamide adenine dinucleotide; NADPH, nicotinamide adenine dinucleotide phosphate; PL, photoluminescence; SE, secondary electron; SEM, scanning electron microscope; UPW, ultrapure water.