
Abstract
Exposing flight hardware to dry heat is a NASA-approved sterilization method for reducing microbial bioburden on spacecraft. The existing NASA specification only allows heating the flight hardware between 104°C and 125°C to reduce the number of viable microbes and bacterial spores. Also, the NASA specifications only allow a four log reduction by dry heat microbial reduction because very heat-resistant spores are presumed to exist in a diverse population (0.1%). The goal of this research was to obtain data at higher temperatures than 125°C for one of the most heat-resistant microorganisms discovered in a spacecraft assembly area. These data support expanding the NASA specifications to temperatures higher than 125°C and relaxing the four log reduction specification.
Small stainless steel vessels with spores of the Bacillus strain ATCC 29669 were exposed to constant temperatures between 125°C and 200°C under both dry and ambient room humidity for set time durations. After exposures, the thermal spore exposure vessels were cooled and the remaining spores recovered and plated out. Survivor ratios, lethality rate constants, and D-values were determined at each temperature. The D-values for the spores exposed under dry humidity conditions were always found to be shorter than those under ambient humidity. The temperature dependence of the lethality rate constants was obtained by assuming that they obeyed Arrhenius behavior. The results are compared to those of B. atrophaeus ATCC 9372. In all cases, the D-values of ATCC 29669 are between 20 and 50 times longer than those of B. atrophaeus ATCC 9372. Key Words: Bacillus—Spores—Planetary protection—Dry heat microbial reduction—ATCC 29669—D-value. Astrobiology 11, 213–223.
1. Introduction
S
Hardware manufacturing procedures frequently include heating spacecraft parts above 125°C under ambient humidity conditions long enough to be lethal to microorganisms, but these procedures are outside the current NASA specifications. For example, a variety of structural parts containing epoxies and organic polymers and honeycomb structures are exposed to adequate temperatures and durations at ambient humidity conditions to inactivate spores. Vacuum chambers designed for DHMR are very costly to construct, operate, and maintain. Using nonvacuum ovens for treating flight hardware parts and assemblies that can tolerate the higher temperatures would make the procedure easier and less costly.
Also, the NASA specifications limit bioburden reduction to four log reduction because 0.1% of the spore population is presumed to have a very high heat resistance in comparison to B. atrophaeus spores. Determining the actual D-values and z-values of a very heat-resistant (“hardy”) bacillus could support modifying the specification for long heating-time durations and high temperatures. The D-value is defined as the time required to reduce a microbial population by 10-fold, and the z-value is the change in temperature that will increase the D-value by a factor of 10.
A number of factors can affect the D-value, including temperature, humidity, the organism, and spore preparation. Determining the D-values of the highly dry heat resistant spores is useful to NASA for setting specifications for dry heat reduction processes used for spacecraft hardware.
In this paper, we describe the microbial reduction data that have been collected on these hardy Bacillus sp. ATCC 29669 spores exposed from 125°C to 200°C under both ambient room humidity (40–60%) and vacuum-controlled humidity (<0.01%), as specified by NASA procedures (NASA, 2005). The methods used are identical to those used in a previous study (Kempf et al., 2008). A single batch spore suspension was prepared and used in all the dry heat exposures. In the exposures, spores were deposited and dried in the bottom of stainless steel thermal spore exposure vessels (TSEVs). They were subjected to constant temperatures for precise time durations under either ambient or vacuum-controlled (dry) humidity conditions. The spores were recovered, and the survival fractions were determined by plate counts. Survivor ratio plots for each temperature and humidity condition are presented, from which the lethality rate constants and D-values were calculated. Also, the rate constants are plotted versus reciprocals of the absolute temperature to determine the Arrhenius constants and temperature dependence. The results are compared to those of Bacillus atrophaeus ATCC 9372, a widely used reference strain for dry heat processing (Bond et al., 1970; Peeler et al., 1977).
Bacillus sp. strain CK 4-6 ATCC 29669 was selected for this study because this strain was isolated in 1972 from a Teflon ribbon used as a fallout strip that had been placed in a clean room in the Manned Spaceflight Operation Building at Kennedy Space Center (Puleo et al., 1978), and it was deposited into the American Type Culture Collection (ATCC) in 1977 (Reyes, 1977). Earlier work indicated that it has substantial resistance to dry heat (Reyes et al., 1981). Screening of this strain in our laboratory revealed that it was also amenable to dry heat inactivation studies.
Other heat-resistant spores, such as a Viking mission isolate V5-8 (tentatively identified at the time of isolation by biochemical tests as B. brevis) and B. xerothermodurans ATCC 27380, were found difficult to study because excessive spore clumping or very slow growth rates prevented obtaining reliable survivor ratios. The strains commercially used as bioindicators, such as Geobacillus stearothermophilus, used for both moist heat and vapor hydrogen peroxide sterilization, as well as Bacillus pumilus, used for radiation sterilization, are no more dry heat resistant than B. atrophaeus ATCC 9372, the NASA standard reference species.
Understanding the frequency that ATCC 29669 occurs in the clean rooms and spacecraft assembly areas is important to understanding the relevance of the selected strain. The trimmed 1.2 kilobase sequence of the ATCC 29669 16S rRNA gene has been compared against the following databases: (1) Jet Propulsion Laboratory in-house database (6100 sequences), (2) National Center for Biotechnology Information GenBank, (3) Ribosomal Database, and (4) Greengenes. Assuming a 97.5% sequence homology cutoff for a close match (Wayne et al., 1987), there were 10 close sequences to the in-house database. Two strains with a 100% match that were isolated at the Kennedy Space Center were described as Bacillus canaveralius (Newcombe et al., 2009). One strain that matched a clone at the 99% level and another at the 97.5% level were retrieved from the Johnson Space Center Genesis assembly facility cleanroom floor (Moissl et al., 2007). Six strains with 97.5% sequence homology were isolated from the Kennedy Space Center during the Phoenix spacecraft assembly (Ghosh et al., 2010). Despite the 100% sequence homology, the ATCC 29669 and B. canaveralius are not phylogenetically related because they have low homology with DNA-DNA hybridization and differences in FAME and biochemical profiles (Venkateswaran and Vaishampayan, personal communication, 2010). Also, the B. canaveralius strain has not been tested for dry heat resistance. Of the seven Viking and Viking dry heat resistant isolates tested, two strains were found to be very similar in sequence homology: V3-13 (98.4%) and V33-4 (99.9%). From this limited data, strains with a sequence similar to ATCC 29669 do not appear to be abundant, but they have been isolated in different spacecraft assembly areas years apart. Thus, ATCC 29669 is a relevant model for a very resistant dry heat test organism.
2. Materials and Methods
The materials and methods used in this study are similar to those used in the original study (Kempf et al., 2008). In the following paragraphs, we summarize the method and highlight mainly the differences.
2.1. Bacillus sp. ATCC 29669
Bacillus sp. ATCC 29669 was obtained from the American Type Culture Collection (Manassas, VA). Spore production was carried out on nutrient sporulation medium supplemented with divalent cations. The medium consisted of nutrient broth, 8 g/L (Difco); 1.0 g/L KCl; 0.25 g/L MgSO4 · 7H2O; 16 g/L agar (BD, Difco); 0.5 mM each of CaCl2, MnCl2, and FeSO4 (Schaeffer et al., 1965). Spores were grown in a single large batch on an agar surface in 19 stainless steel pans, which were equivalent in total surface area to 380 standard 100 mm diameter Petri dishes. After 2 weeks of growth, the spores were harvested by scraping the surface of the agar and rinsing it with deionized water. The spores were suspended in deionized water at 4°C and washed by centrifugation three times on the day of harvest and then at least once daily over a 7-day period (Nicholson and Setlow, 1990). Between washes, the spore suspension was incubated at 4°C with gentle rotational shaking at 75 rpm in a DeLong culture flask. Washed pellets were finally suspended in 50 mL of deionized water and then heat shocked at 80°C for 15 min. The final product was stored in individual capped glass serum bottles at 4°C. Upon plating, the colonies appeared to be uniform and uncontaminated. Also, under microscopic examination, the spores appeared to be uniform with minimum amount of cell debris.
2.2. Thermal spore exposure vessel inoculation
The TSEVs are blind-end stainless steel tubes, 1.27 cm internal diameter, 10.16 cm long, machined to a wall thickness of 0.025 cm. TSEVs have been previously described in detail (Kempf et al., 2008). The TSEVs were inoculated by spotting 50 μL of the spore suspension onto the internal bottom surface of each TSEV, and after drying yielded 3 × 10⁶ recoverable colony-forming units. The inoculated TSEVs were loosely capped and dried for a minimum of 2 days in a desiccator containing a silica gel desiccant (EMD Chemicals) prior to use. Five identically inoculated TSEVs and a temperature reference TSEV were exposed in each DHMR run. Three additional TSEVs were inoculated at the same time but were not heat treated, and they served as positive controls to determine the original number of recoverable spores in the TSEVs.
2.3. Silicone oil bath
As in the original work, exposures were carried out in a constant high-temperature bath (model 6330, Hart Scientific, American Fork, UT). However, it was filled with silicone oil, which is capable of being heated to 260°C and above (Hart bath fluid #5617, Dow Corning silicone oil type 710, Hart Scientific, American Fork, UT). The bath temperature was calibrated with a reference thermometer (Hart Scientific model 1521 handheld thermometer readout with a platinum resistance thermometer model 5614). The handheld thermometer and platinum resistance thermometer were calibrated according to National Institute of Standards and Technology procedures in compliance with ISO/IEC 17025 and ANSI/NCSL Z540-1. The bath temperature was held to within ± 0.05°C of the target temperature during the exposures. All thermocouples were calibrated by immersing them in the bath with the reference thermometer at the temperature at which they were used.
2.4. Sample exposures
The five inoculated TSEVs and reference TSEV containing a thermocouple were held in the modified lid of the bath. The thermocouple junction touched the bottom of the reference TSEV and was used to record the actual temperature to which the spores were being exposed. All six TSEVs were immersed in the bath simultaneously, and the time-temperature history of the reference TSEV and the bath were recorded with an Agilent 34970 data logger (Agilent Technologies, Inc., Santa Clara, CA). Unlike the original work, only one exposure was performed at any given time-temperature condition. The temperature profile was recorded with a software program written in LabView (version 6.0, National Instruments, Austin, TX). For most exposures, the temperature was recorded every second. For exposures that lasted 12 h or longer, the temperature was recorded every 60 s to lower the data volume. About 30–45 s was typically required for the TSEVs to reach the set temperature. A typical time-temperature profile for an exposure at 200°C is shown in Fig. 1.

A typical temperature profile for the heating and cooling of the thermal spore exposure vessels at 200°C.
At the conclusion of the nominal exposure time, the modified lid holding the TSEVs was removed from the oil bath and placed into an ice bath to rapidly cool the TSEVs to below 20°C. Cooling from 200°C to below 20°C required less than 13 s. The same exposure temperatures were used for both ambient and vacuum-controlled humidity. The time durations were selected to provide enough survivors to determine survivor ratios. Because the inactivation rates were quite different for exposures at ambient and vacuum-controlled humidity, different nominal exposure times had to be used. In some cases, for practical reasons, the actual exposure times were shorter than the nominal times.
2.4.1. Exposures at ambient humidity
A butyl rubber tube stopper was placed on each of the eight inoculated TSEVs. The loose-fitting stopper permitted air exchange and prevented pressure changes. The laboratory room ambient temperature and humidity were recorded with a hygrometer (model TM121, Dickson, Addison, IL) to document the experimental conditions at the time the TSEVs were prepared and during the exposures. On all days when exposures were taken, the relative humidity was between 36% and 66%. Measuring the temperature and relative humidity established that neither parameter exceeded a range typical for a climate-controlled spacecraft facility.
2.4.2. Exposures at vacuum-controlled humidity
A silicone rubber septum (ST-495, Specialty Silicone Products, Inc., Ballston Spa, NY) sealed the openings of the inoculated TSEVs. Each TSEV was sealed with an aluminum crimp-seal (20 mm, Wheaton Science Products, Millville, NJ). The TSEVs were placed into the modified lid, and a manifold that held six syringe needles was placed over the lid. The needles were inserted into the TSEVs through the septa. The side-hole needles (22 gauge, side-hole, Hamilton Company, Reno, NV) penetrated the septa without coring or clogging, thereby permitting the TSEVs to be reliably evacuated by a vacuum pump (TriScroll 300, Varian Vacuum Technologies, Lexington, MA). Evacuation ensured that the spores were under the specified dry humidity conditions. The TSEVs were evacuated to 147 Pa (1.10 torr) prior to heating. After the vacuum-controlled humidity exposures were completed, the septum and crimp-seal were removed under aseptic conditions, thereby returning the inside of the vessel and spores to ambient pressure and humidity. A sterile rubber tube stopper was placed on each TSEV until the spores were recovered and processed.
2.5. Data collection and processing
The exact time and temperature of each exposure was tracked by the thermocouple data logger and recorded by the LabView program. These data were used to calculate the equivalent time of the exposure discussed below. One exposure with five replicates under both ambient humidity and vacuum-controlled humidity conditions was performed at each temperature setting.
As in the original study, after the vessels had returned to room temperature, the standard NASA spore recovery and pour-plating procedure was used to recover the viable spores from both the five exposed TSEVs and the three unexposed TSEVs that served as positive controls (NASA, 1980; Kempf et al., 2008). Two milliliters of sterile deionized water was added to each TSEV; then they were sonicated for 2 min (25 kHz, minimum of 0.35 W/cm2, Series 8500 Advanced Ultrasonic Generator, Branson Ultrasonics Corp., Danbury, CT). After sonication, the 2 mL volume was aseptically transferred to a sterile glass screw-capped test tube. This operation was repeated three additional times to collect as many spores as possible. The wash volume collected in the test tube was approximately 8 mL. The collected wash volume was brought to 10.0 mL by adding sterile deionized water. Ten-fold serial dilutions of this collected volume were made in sterile deionized water. Four 2.0 mL aliquots from each dilution tube were plated by using the pour-plate method and tryptic soy agar as the growth medium (Difco formulation BD product no. 236950, Becton Dickinson and Co., Franklin Lakes, NJ). Spore recovery was typically done on the day the exposure was terminated. Spores were always plated immediately following the recovery from the TSEVs. The plates were incubated for 5 days at 32°C as opposed to 2 days for B. atrophaeus ATCC 9372. After incubation, the colonies were counted, and the number of colony-forming units for each of the eight exposure vessels was recorded.
2.6. Equivalent time and temperature corrections
Because the TSEVs required about 30–45 s to reach the target temperature, which is approached asymptotically, it was necessary to account for the inactivation of spores during the temperature ramp-up and ramp-down. Corrections were also required for any deviations of the actual bath temperature from the set target temperature. Temperature profile corrections were made for all exposures, and the equivalent time/corrected temperatures were used in the analysis presented here.
The method to correct for variations in temperature was modeled after that of Pflug (Pflug, 1999, 2003). The derivation of the equation has been described in detail in a prior publication (Kempf et al., 2008), and only the final equations are given here. For each one-second interval in the time-temperature profile, an equivalent time was calculated from the Arrhenius equation. The equivalent time, Δt
target, is the time interval at the target temperature that will have the same spore reduction as some time Δt
actual at another temperature. The Arrhenius equation can be written in the following form:
where T represents the target and actual absolute temperatures and k is the lethality rate constants at those absolute temperatures. B is the Arrhenius parameter. On this basis, the equivalent time at target for each one-second time interval becomes
where Δt target becomes the equivalent time interval at T target with the same survivor ratio as the original time interval Δt actual. As T actual approaches T target, the exponent approaches zero and Δt actual equals Δt target.
To find the total equivalent time for all the elements, all the Δt
target elements are added to obtain the total equivalent time at T
target. This approach assumes the temperature increments are small and can be approximated by a differential. In this study, the intervals were one second or one minute for the long exposures. The final equation is
where i is the running index over all the one-second or one-minute time intervals; Δti is the i th one-second time interval, which is always 1 in this study; Ti is the actual absolute temperature during the i th time interval, Δti ; T target is the desired absolute temperature of the run; and B is the Arrhenius constant.
Total Δt equivalent is the total equivalent time that the sample would have been heated at the desired temperature, including corrections for the ramp-up and ramp-down and any bath temperature deviations during the run. Total Δt equivalent is presented as the equivalent time in minutes.
Calculation of the equivalent times required knowing the Arrhenius B constant before the corrections could be made. However, the B parameter could only be determined after the temperature dependence of the lethality rate constant was determined, which required having all the data and analysis completed. Hence, an iterative procedure was followed. A value for this constant was estimated from Arrhenius plots by using the low-temperature data where the temperature profile corrections were small. Then, these estimated B values were used to approximate the equivalent times. As more accurate B values were obtained, the computations were all reiterated with the new B values until they converged within 0.01%. The final values for the equivalent times are given for each exposure along with the survivor ratios. (Dry heat exposure data for ATCC 29669 collected under ambient humidity conditions and dry heat exposure data for ATCC 29669 collected under vacuum-controlled humidity conditions are available in the Supplementary Material at
2.7. Data plots and statistical analysis
Thermal inactivation of microorganisms generally obeys first-order kinetics (Bigelow, 1921; Shull et al., 1963; Stanier et al., 1963). Therefore, for each temperature, the natural logarithm of the survivor ratio was plotted versus the equivalent time durations. The lethality rate constant, k, was determined from the slope by linear regression. The D-values were calculated from k by using the following equation:
Two approaches were compared. In the first, the five replicate data points for each exposure were plotted individually. In the second, the five replicate points for each exposure were first averaged, and the averaged points were plotted. Then, a regression analysis was performed. Both methods gave similar results for the slope (lethality rate constant). But the first method, which used the five points individually in the regression, gave smaller errors and was more representative of the actual error in the analysis. Thus, the first method was selected. The results for the ambient and vacuum-controlled humidity at any given temperature were compared and analyzed statistically by using the Student t test (Zar, 1999). The errors are stated at the 95% confidence limit.
Arrhenius constants were determined by plotting the natural logarithm of the lethality rate constants versus the reciprocal of the absolute temperature. The Arrhenius relationship is described by the following equation:
where A and B are two constants. A is often called the frequency factor because, in gas phase chemistry, it is related to the number of molecular collisions. B is actually E
a/R where R is the gas constant and E
a is the activation energy required to break a bond or to cause a reaction to occur (or, in this case, cause spore death). The following equation can be obtained by taking the natural logarithm of both sides.
Plotting the logarithm of k versus 1/T produces a straight line. Thus, the natural logarithm of the lethality rate constants, k, was plotted versus the reciprocal of the absolute temperature, T. The slope is B, and the intercept at T = ∞ is A. B can be easily determined from the plot by a regression analysis.
3. Results
3.1. Dry heat exposure data
The dry heat exposure data collected under ambient and vacuum-controlled humidity conditions are presented as tables in the Supplementary Material. The survivor ratios were calculated by dividing the number of spores that remained after heating by the average initial population number obtained from the control samples taken for that exposure. Using the controls that were inoculated at the same time as the exposed samples in this way minimized the effect of any handling differences and normalized the spore populations between runs.
The survivor ratio versus time plots for the ambient and vacuum-controlled humidity exposures for each temperature are given in Fig. 2 (125°C), Fig. 3 (150°C), Fig. 4 (170°C), and Fig. 5 (200°C). We considered that the zero time point is a valid data point, and the regression analysis was forced to pass through the N 0 (average initial population number) value. If the intercept is allowed to vary freely, the N 0 value is usually lower, but the variation in the slopes is less than 10% in comparison to the slope with a fixed intercept.
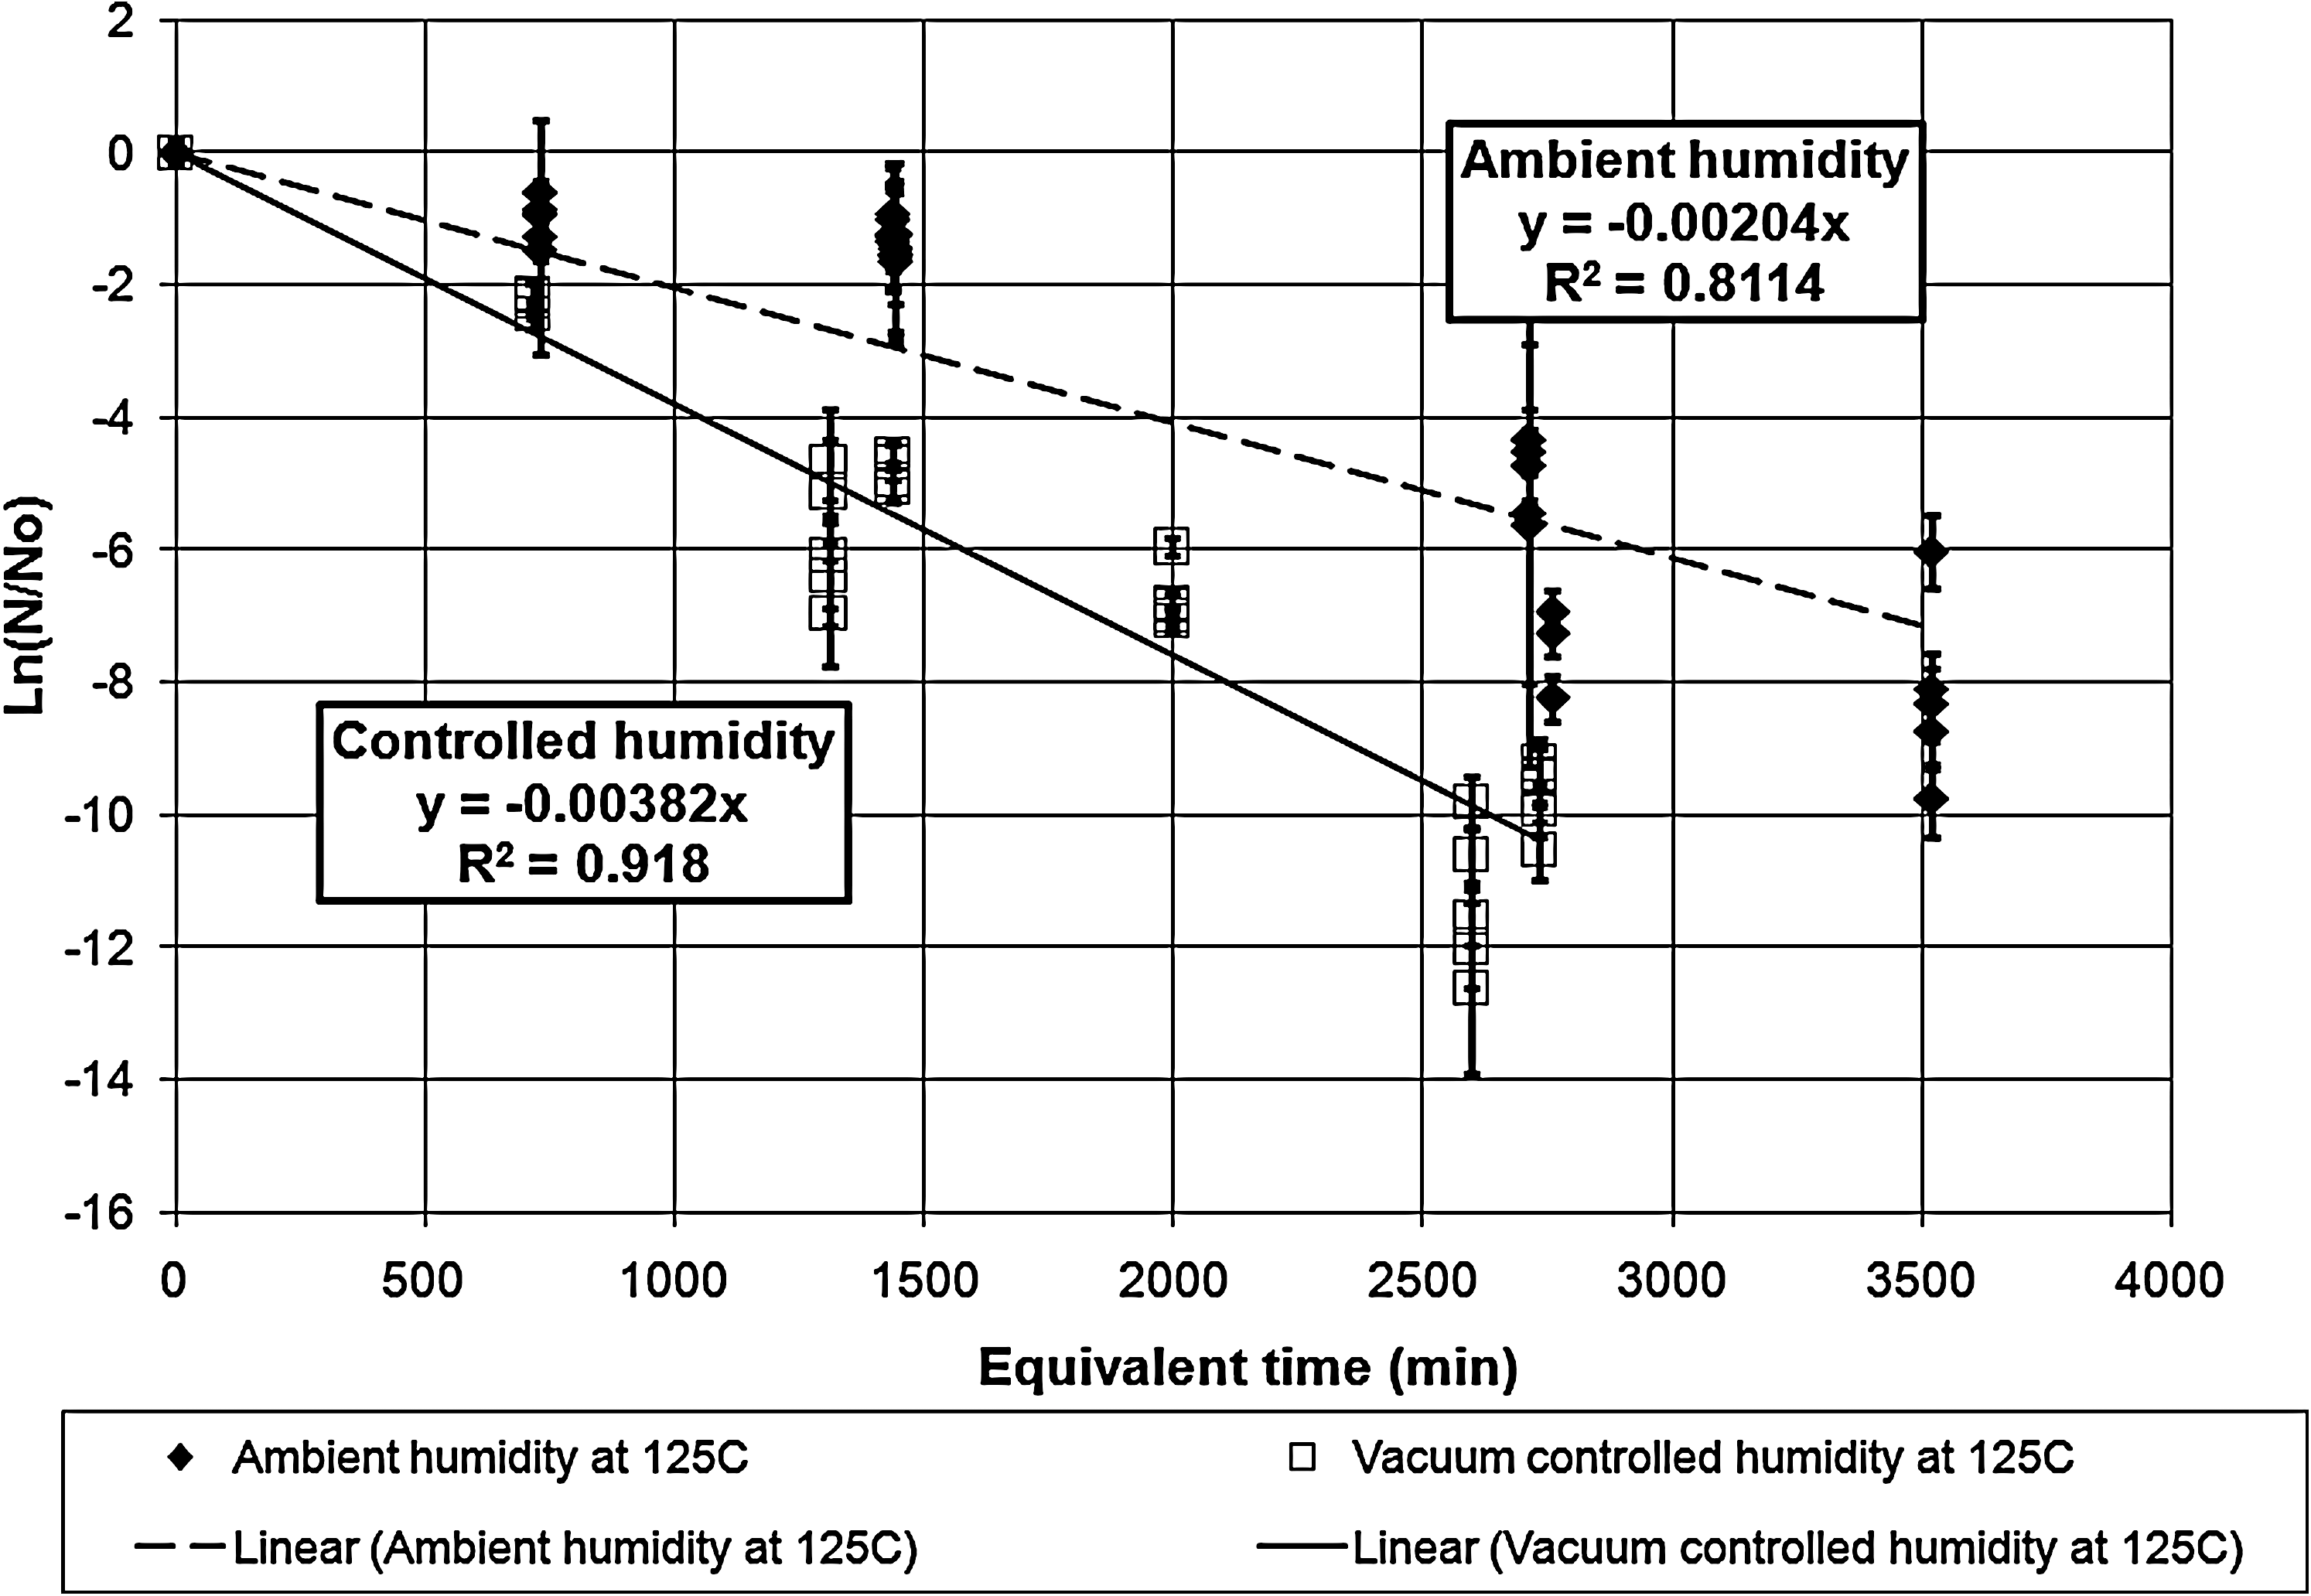
Survivor ratio plot for the exposures at vacuum-controlled and ambient humidity at 125°C. The error bars represent the standard deviations in the survivor ratios. The two lethality rate constants are statistically different even at the 99.99% confidence limit.
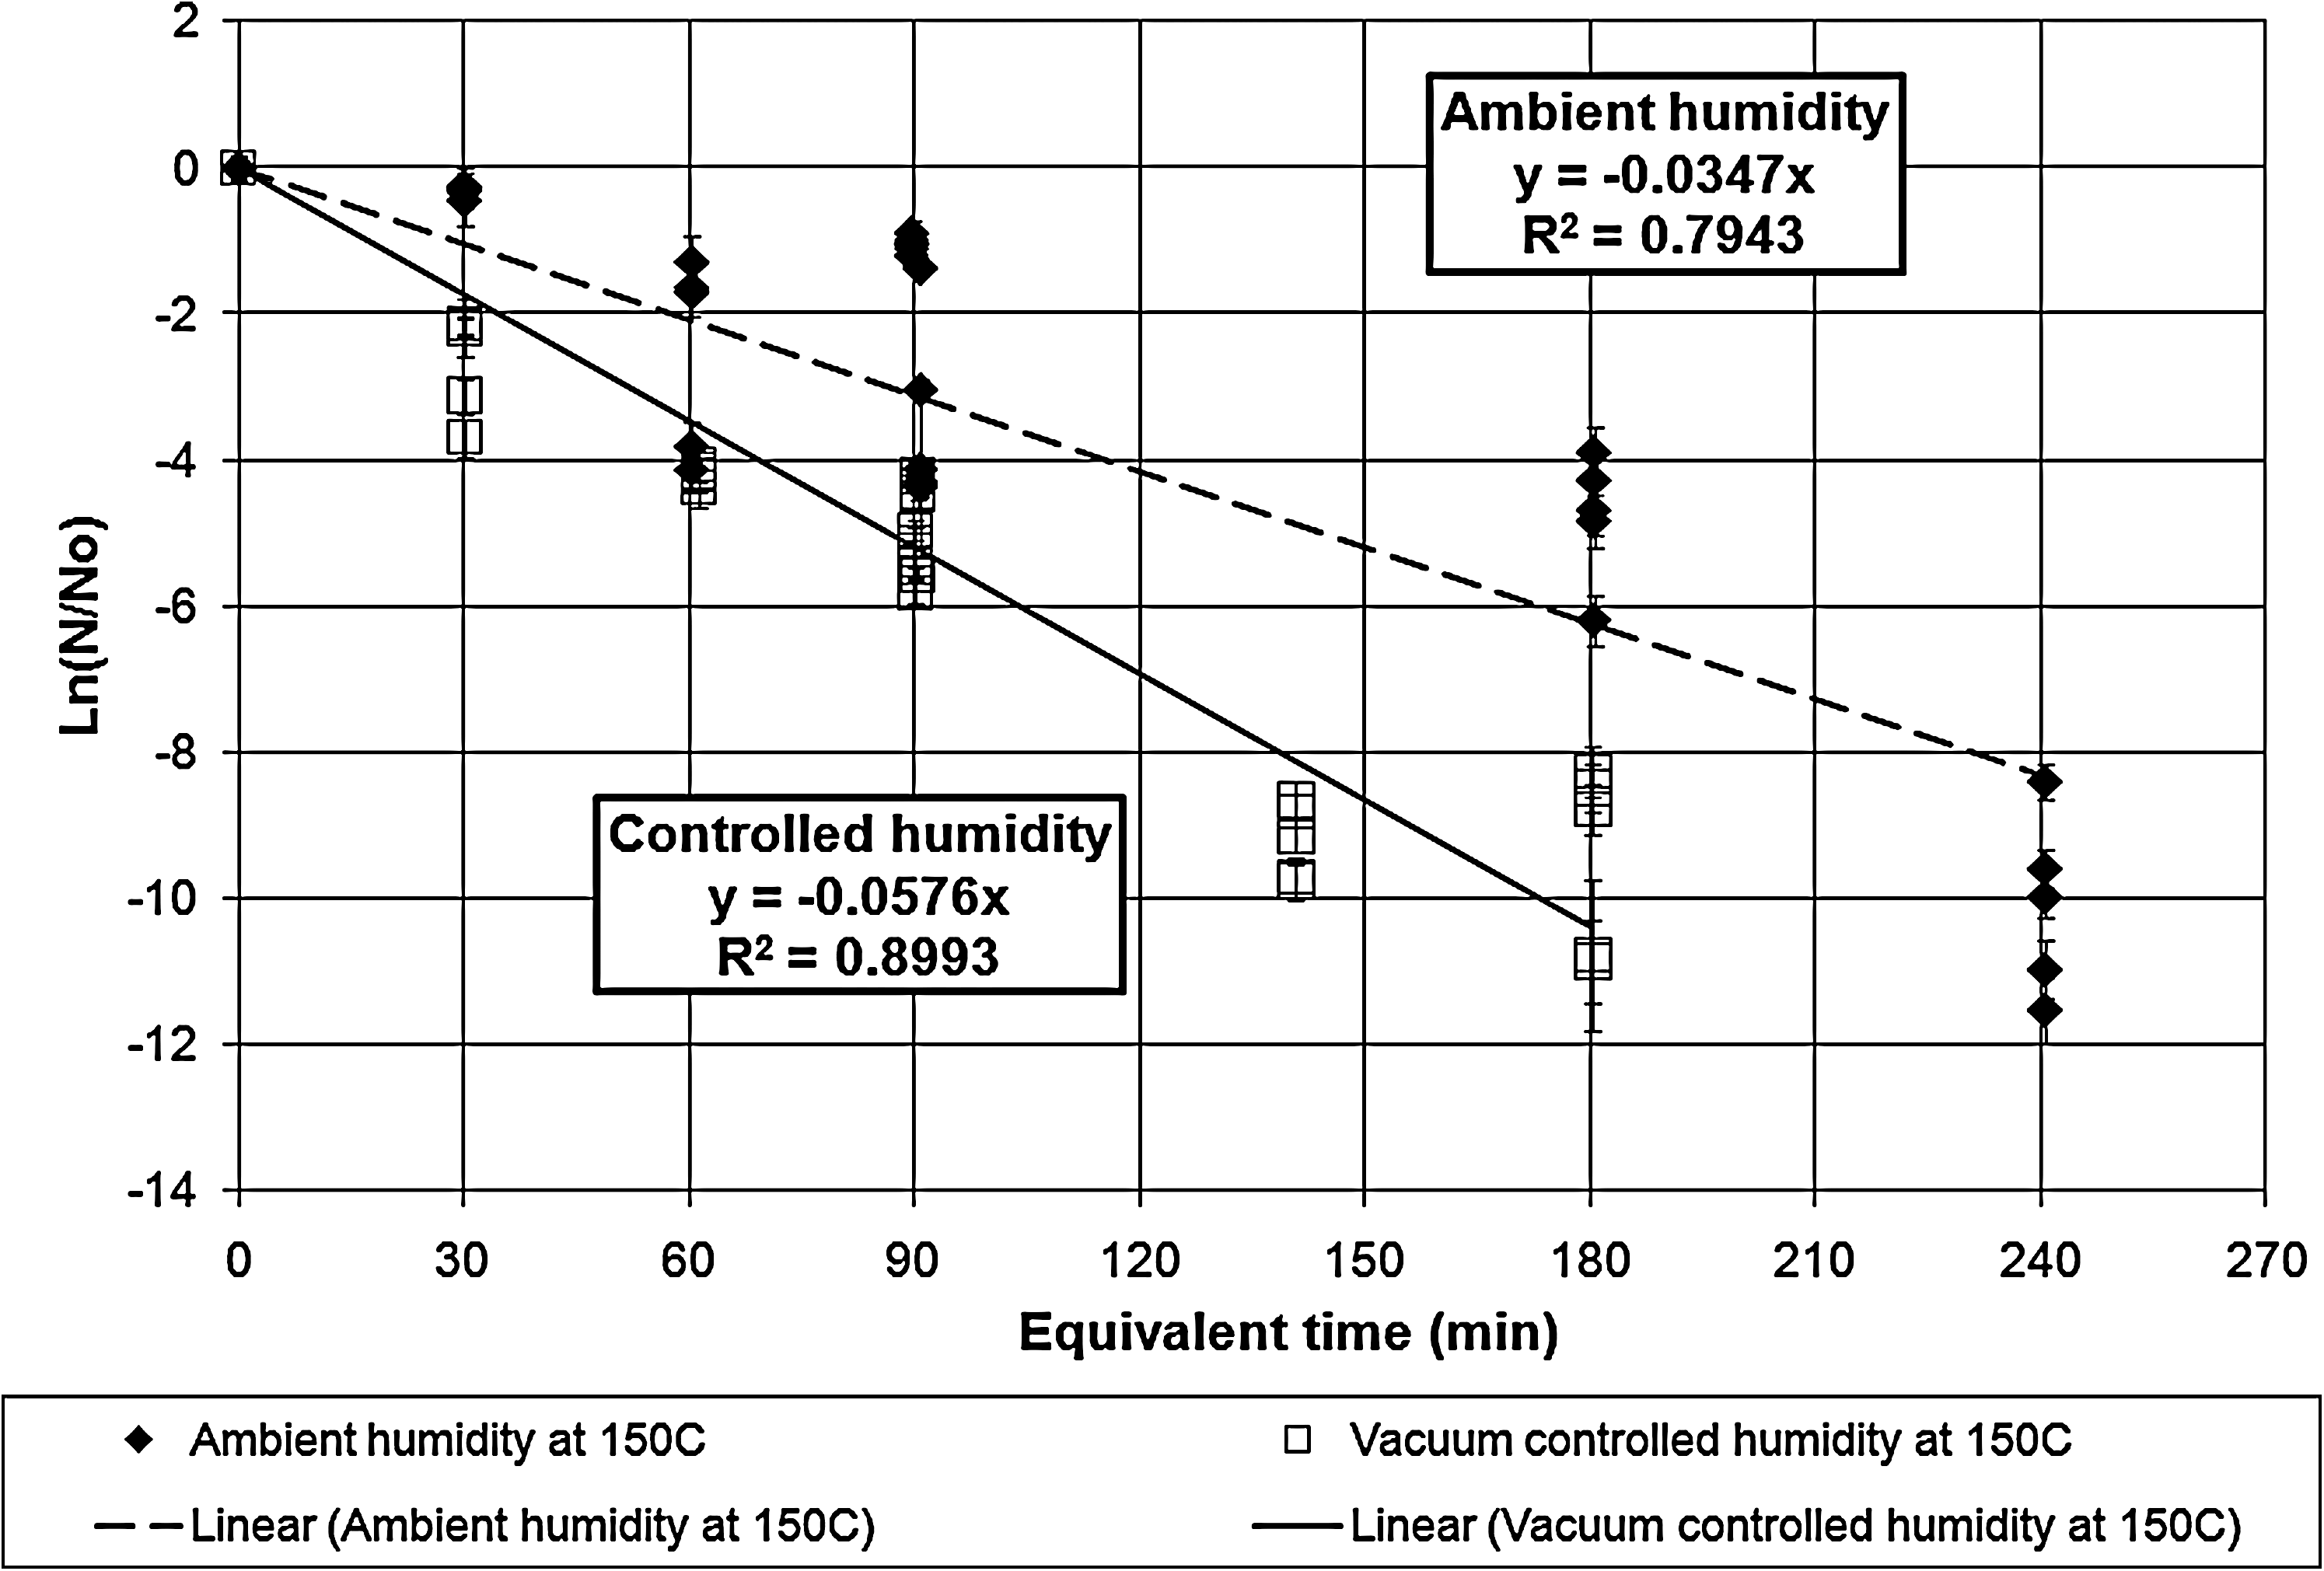
Survivor ratio plot for the exposures at vacuum-controlled and ambient humidity at 150°C. The error bars represent the standard deviations in the survivor ratios. The two lethality rate constants are statistically different even at the 99.99% confidence limit.
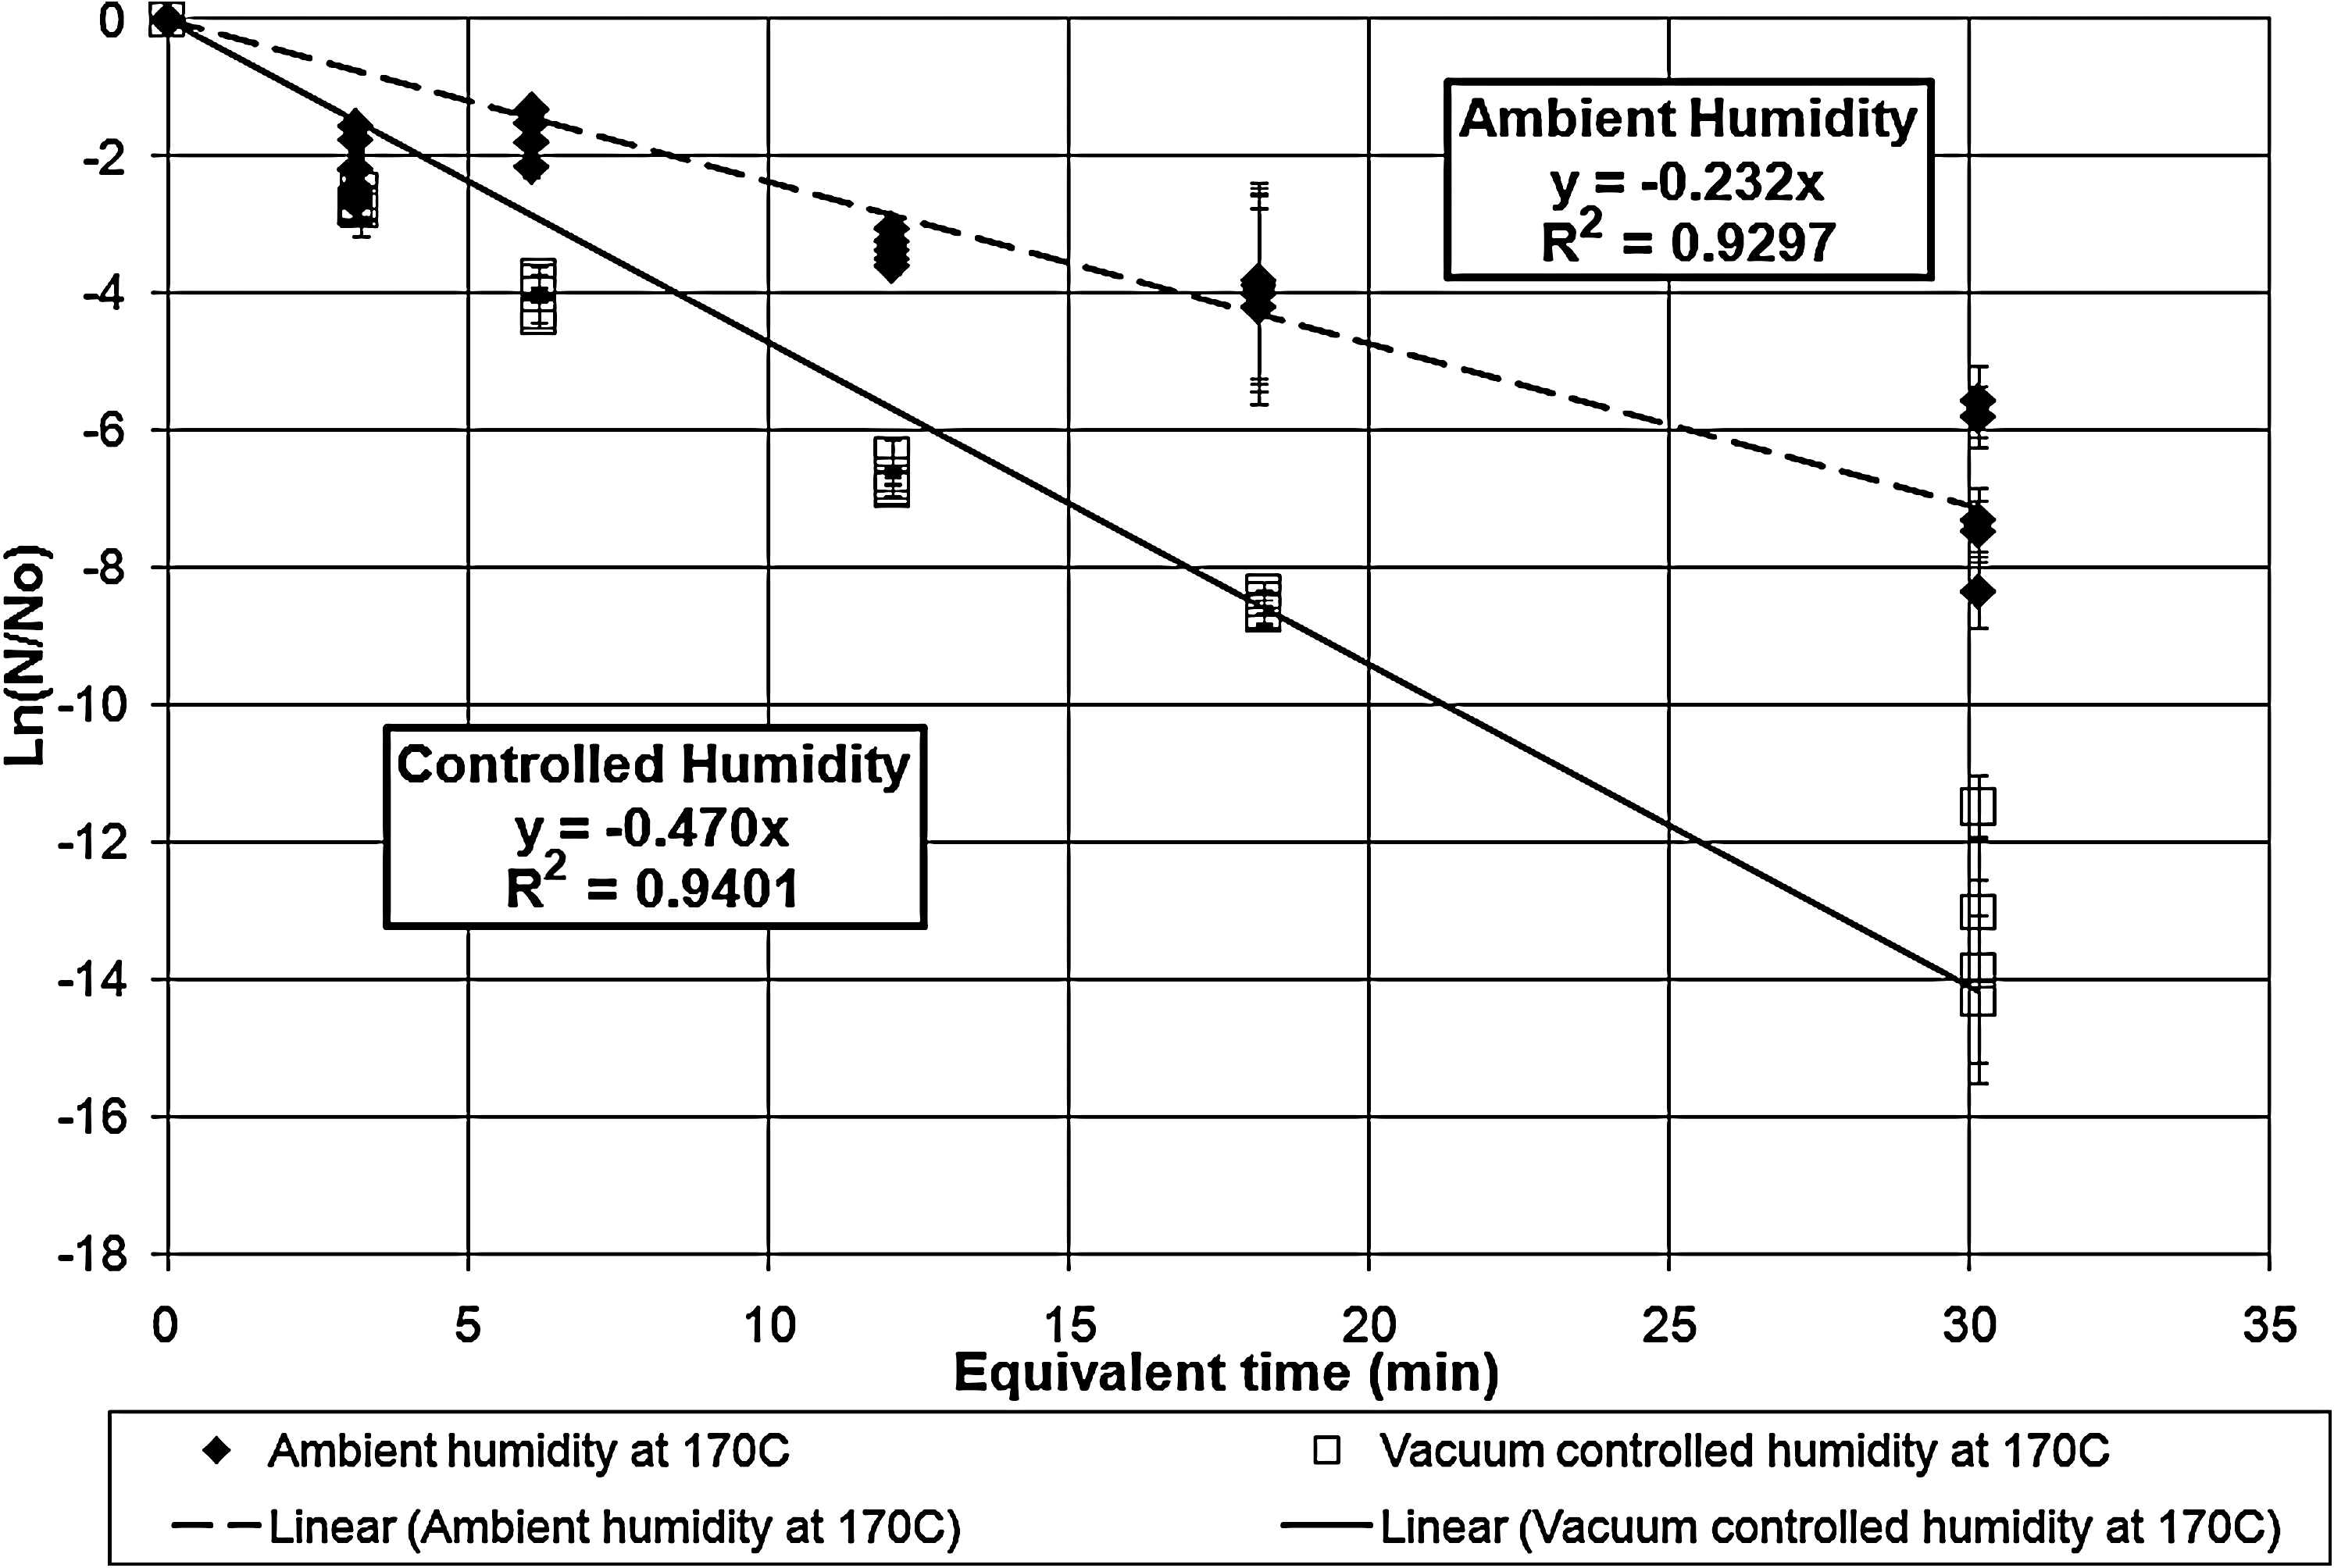
Survivor ratio plot for the exposures at vacuum-controlled and ambient humidity at 170°C. The error bars represent the standard deviations in the survivor ratios. The two lethality rate constants are statistically different even at the 99.99% confidence limit.
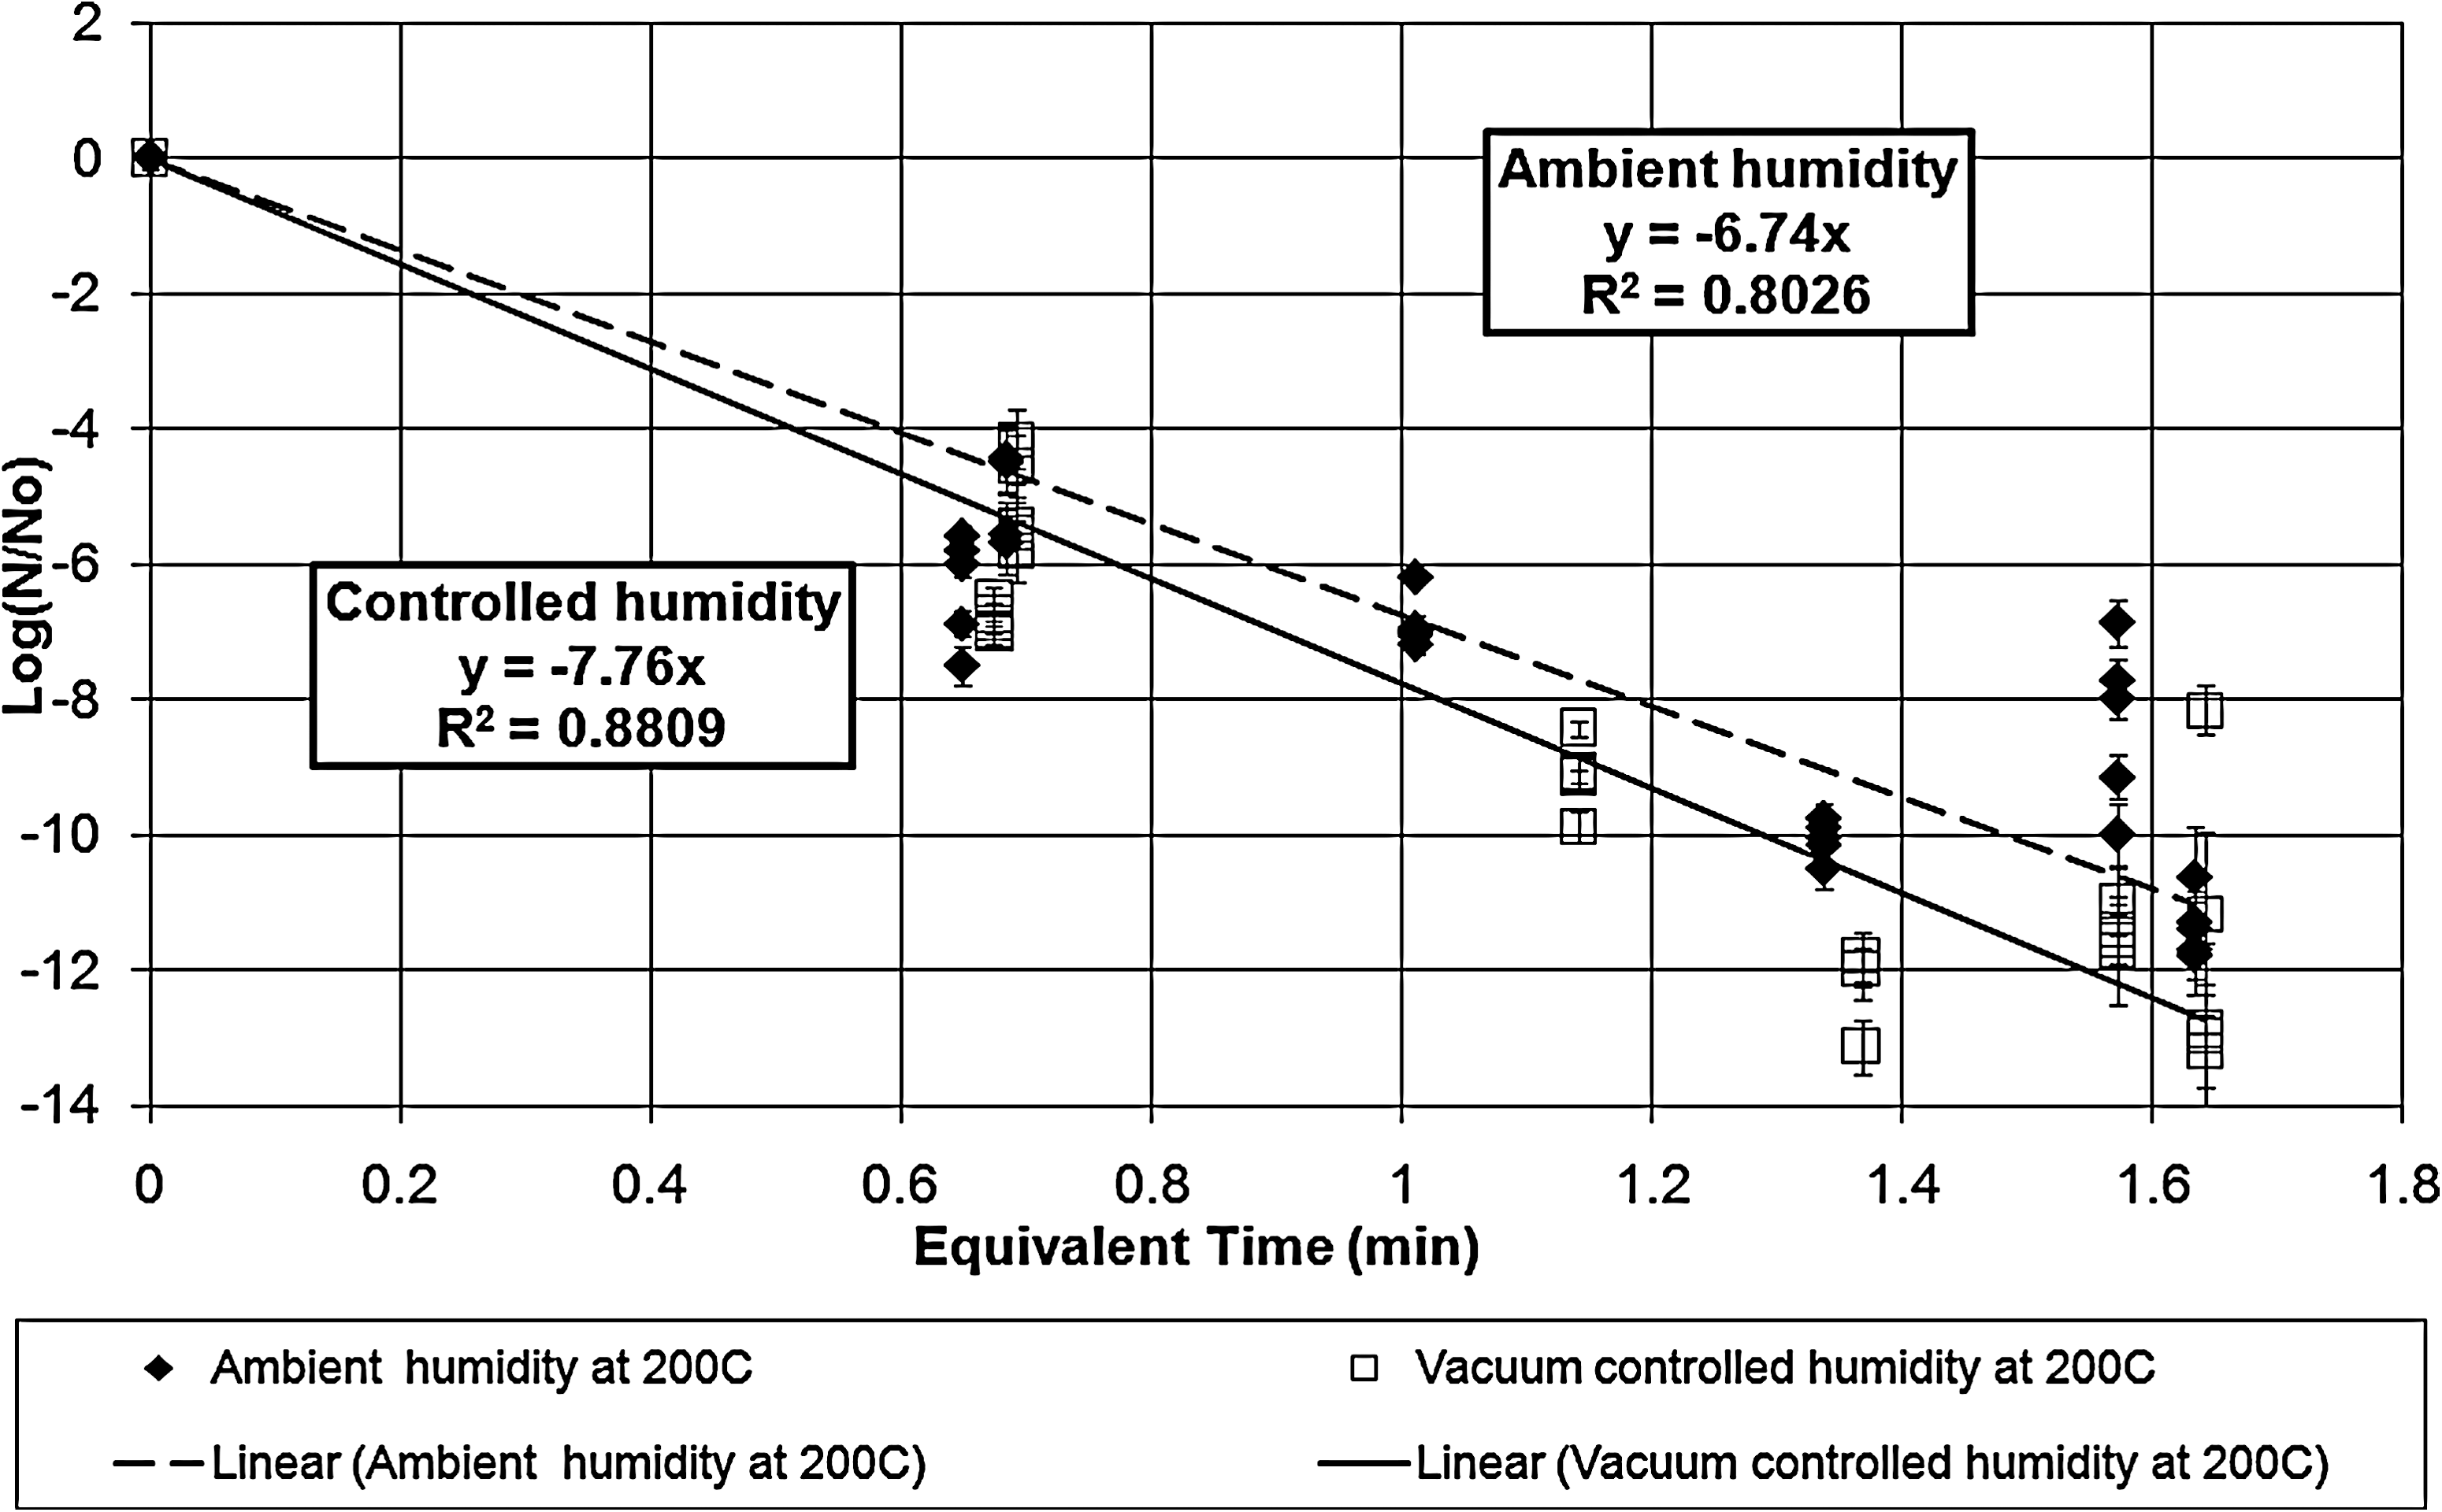
Survivor ratio plot for the exposures at vacuum-controlled and ambient humidity at 200°C. The error bars represent the standard deviations in the survivor ratios. The two lethality rate constants are statistically different even at the 99.0% confidence limit.
Table 1 tabulates the lethality rate constants and D-values for the exposures under both ambient and vacuum-controlled humidity.
Errors are given at the 95% confidence limit. R 2 is the coefficient of determination for a regression analysis.
Ratio of ambient humidity D-value divided by vacuum-controlled humidity D-value.
The percentage in parentheses is the probability that the ambient and the vacuum-controlled humidity exposures are from the same population.
The dry heat exposures of B. atrophaeus ATCC 9372 (Kempf et al., 2008) indicated that the humidity effect on lethality disappeared for the data points above 135°C. Unlike that case, these results indicate that humidity control increases the lethality rates and shortens the D-values even at 200°C. However, the lines do approach each other as the temperature reaches 200°C, which suggests that the two lines could coalesce and the humidity effect could disappear at some temperature above 200°C.
The equivalent time corrects for deviations between calibrated bath temperature and the bath operating temperature as well as for inactivation during the ramp-up times. The correction for ramp-up times for long exposures is not significant, but the correction for planned exposure times of 3 min or less is a significant factor that contributes to the scatter in the data. For long exposures, even small deviations in the bath temperature cause significant corrections to the exposure equivalent time.
3.2. Arrhenius plots
After the lethality rate constants were determined, their temperature dependence was calculated by assuming that they followed Arrhenius behavior. This method has been extensively used in microbiology and sterilization studies to describe and predict the temperature dependence of lethality rate constants and D-values (McKee and Gould, 1988).
Figure 6 shows the Arrhenius plots of both the ambient humidity and the vacuum-controlled humidity exposures. The Arrhenius parameters derived from these plots are given in Table 2. It was found that the Arrhenius parameter, A, is tightly correlated to B and cannot be independently determined. The difference in the lethality rates is accounted for by the difference in the A constants. A Student t test confirms that the B constants are the same at even a 90% confidence level. By using the Arrhenius parameters, the lethality rate constants and D-values can be predicted at any temperature by assuming that dry heat inactivation obeys first-order kinetics (Stanier et al., 1963).

Arrhenius plot of both the B. atrophaeus (ATCC 9372) and ATCC 29669 lethality rate constants. The displacement of the two sets of lines illustrates the large difference in the rate constants.
Errors are given at the 95% confidence limit.
4. Discussion
Previous studies have identified several Bacillus isolates that were more resistant to dry heat than the NASA standard reference Bacillus strain, B. atrophaeus ATCC 9372 (Bond et al., 1970, 1971; Puleo et al., 1975, 1978). The presence of these hardy species led to building conservatism into the NASA dry heat microbial reduction specifications. This conservatism may be problematic in the planetary protection implementation planning for potential future mission concepts. Thus, the goal of this study was to determine the effect of dry heat on a representative heat-resistant hardy spore, Bacillus sp. ATCC 29669, which was isolated from a spacecraft assembly area, and to compare the results to those of B. atrophaeus ATCC 9372, which has been used by NASA as a “standard” indicator spore.
In the present study, the lethality rate constants and D-values for a range of temperatures between 125°C and 200°C with ambient and vacuum-controlled humidity conditions were determined. To achieve high-temperature exposures with short ramp-up times, it was expedient to use the same method developed for studying B. atrophaeus ATCC 9372, (Kempf et al., 2008). Using TSEVs allowed rapid heating to the target temperature, rapid cooling after the exposure, and efficient recovery of the spores. For B. atrophaeus, the ramp times and the survival characteristics of the organism limited the highest temperature to 170°C, but because ATCC 29669 is heat resistant, the inactivation times at 200°C were long enough to be determined.
There is more scatter in the data at the higher temperatures than at the lower temperatures. At the lower target temperatures with long exposure times, the relative number of spores destroyed during the ramp-up time was not significant. However, at short times and high temperatures, the number of spores destroyed during the ramp-up periods was significant and became a dominant fraction of the total heating profile. In addition to the spore killing that occurs on the ramp-up at the high temperatures, clumping of spores after deposition inside the TSEV may explain some of the scattering in the data (Cerf, 1977). No effort was made, nor was it the goal of this study, to obtain a monolayer of spores deposited in the TSEV.
In contrast to the extensive prior study on B. atrophaeus ATCC 9372 (Kempf et al., 2008), only one exposure with five tubes was performed under any given set of conditions. However, the current study produced statistically valid data, with sufficient replicates to use standard statistical approaches with statistically meaningful results up to 200°C.
The D-values for ATCC 29669 are compared to those of B. atrophaeus ATCC 9372 in Table 3. Because not all the same exposure temperatures were used in this study, the values in parentheses were calculated from the Arrhenius constants for direct comparison with B. atrophaeus ATCC 9372. D-values for ATCC 29669 are typically 30-fold longer than those for B. atrophaeus ATCC 9372 at 125°C (Schubert and Beaudet, 2008). The ratio is estimated to be 5-fold at 200°C and 80-fold at the lower 115°C temperature. Unlike B. atrophaeus ATCC 9372, the increased lethality effect from dry vacuum-controlled humidity is not lost at 135°C or even at 200°C. Figure 6, which contains the Arrhenius plots of both strains on the same graph, shows the dramatic difference in the lethality rates.
The numbers in parentheses are estimated from the Arrhenius parameters.
The ratio is the ATCC 29669 D-value divided by the B. atrophaeus D-value.
Based on the experimental data, several conclusions can be drawn. First, D-values for this organism decrease with increasing temperature as expected. It has been previously noted that spore killing is faster at higher temperatures (Mullican et al., 1971; Kempf et al., 2008). Second, as shown in Table 1, the ambient and vacuum-controlled humidity lethality rate constants are statistically different at the 99.9% confidence limit at all temperatures studied from 125°C to 200°C. The lethality rate is nearly twice as fast for the vacuum-controlled humidity exposures as for the ambient humidity exposures at any given temperature. Thus, dryness increases lethality of exposure to heat at all temperatures up to 200°C for ATCC 29669, while in the case of B. atrophaeus ATCC 9372, the humidity effect disappeared above 135°C. However, the trend suggests that they could overlap at an even higher temperature. Because ATCC 29669 is considered to be one of most resistant strains to dry heat, it can be expected that other heat-resistant organisms have lethality rate constants and D-values between those of B. atrophaeus ATCC 9372 and of ATCC 29669. Puleo found that most of the common environmental organisms detected and studied are not even as dry heat–resistant as B. atrophaeus ATCC 9372 (Bond et al., 1971; Puleo et al., 1975).
In conclusion, these Bacillus sp. ATCC 29669 data indicate that controlling humidity, at or below the required relative humidity of 25% referenced to the standard conditions of 0°C and 101.3 kPa (760 torr), has an enhancing effect on spore killing at 125–200°C. The effect is greatest at the lower temperatures tested but did not completely disappear at the highest temperatures. Specifically, these data could be used by NASA when considering modifications of the current dry heat microbial reduction specification. In particular, this work supports the use of uncontrolled humidity ovens, provided the time and temperature are sufficient to match the D-values of exposures under ambient humidity conditions. Also, the temperature range above 125°C with shorter time durations can be used for inactivating microbial spores. The spores of ATCC 29669 have a significant dry heat tolerance and provide a reasonable model for hardy heat-tolerant bacterial spores. However, given exposures at sufficient time durations, they can be inactivated and the four log rule could be relaxed.
Footnotes
Acknowledgments
The research described in this paper was carried out by the Jet Propulsion Laboratory (JPL), California Institute of Technology, under a contract with the National Aeronautics and Space Administration. Funding for this work was provided by the Jet Propulsion Laboratory Mars Program Office, and we thank the Mars Program Planetary Protection Manager Dr. Karen Buxbaum for her support of this task. We thank Dr. Michael J. Kempf for his extensive work on developing the methods used in this study. We also thank Dr. J. Andy Spry from the Biotechnology and Planetary Protection Group at JPL, J. Rudy Puleo at Kennedy Space Center, and Dr. Terry Foster (TVF, Inc., The Woodlands, TX), for their helpful comments and discussions. A new technology report (JPL, NTR-47399) was submitted describing the use of these heat-resistant spores of this bacterial strain.
Author Disclosure Statement
Wayne Schubert: no competing financial interests exist. Robert Beaudet: no competing financial interests exist.
Abbreviations
ATCC, American Type Culture Collection; DHMR, Dry Heat Microbial Reduction; TSEV, thermal spore exposure vessel.
*
The NASA document NPR 8020.12C states “an absolute humidity corresponding to a relative humidity of less than 25 percent referenced to the standard conditions of 0°C and 760 Torr.”
References
Supplementary Material
Please find the following supplemental material available below.
For Open Access articles published under a Creative Commons License, all supplemental material carries the same license as the article it is associated with.
For non-Open Access articles published, all supplemental material carries a non-exclusive license, and permission requests for re-use of supplemental material or any part of supplemental material shall be sent directly to the copyright owner as specified in the copyright notice associated with the article.