
Abstract
The Panoramic Camera (PanCam) instrument will provide visible–near IR multispectral imaging of the ExoMars rover's surroundings to identify regions of interest within the nearby terrain. This multispectral capability is dependant upon the 12 preselected “geological” filters that are integrated into two wide-angle cameras. First devised by the Imager for Mars Pathfinder team to detect iron oxides, this baseline filter set has remained largely unchanged for subsequent missions (Mars Exploration Rovers, Beagle 2, Phoenix) despite the advancing knowledge of the mineralogical diversity on Mars. Therefore, the geological filters for the ExoMars PanCam will be redesigned to accommodate the astrobiology focus of ExoMars, where hydrated mineral terrains (evidence of past liquid water) will be priority targets. Here, we conduct an initial investigation into new filter wavelengths for the ExoMars PanCam and present results from tests performed on Mars analog rocks. Two new filter sets were devised: one with filters spaced every 50 nm (“F1-12”) and another that utilizes a novel filter selection method based upon hydrated mineral reflectance spectra (“F2-12”). These new filter sets, along with the Beagle 2 filter set (currently the baseline for the ExoMars PanCam), were tested on their ability to identify hydrated minerals and biosignatures present in Mars analog rocks. The filter sets, with varying degrees of ability, detected the spectral features of minerals jarosite, opaline silica, alunite, nontronite, and siderite present in these rock samples. None of the filter sets, however, were able to detect fossilized biomat structures and small (<2 mm) mineralogical heterogeneities present in silica sinters. Both new filter sets outperformed the Beagle 2 filters, with F2-12 detecting the most spectral features produced by hydrated minerals and providing the best discrimination between samples. Future work involving more extensive testing on Mars analog samples that exhibit a wider range of mineralogies would be the next step in carefully evaluating the new filter sets. Key Words: Analogue—Biosignatures—Mars—Reflectance spectroscopy—Remote sensing. Astrobiology 10, 933–951.
1. Introduction
1.1. The ExoMars PanCam instrument
T
The ability to detect regions or outcrops of interest remotely is a fundamental aspect of planetary rover exploration. However, while multispectral imaging at optical to near-IR wavelengths (400–1000 nm) can reveal a lot about mineralogy and chemistry, the majority of distinguishing spectral features occur in the IR. As a result, the combination of reflectance spectra with other instrumental analysis can enhance the ability of the PanCam to identify mineralogy and lithology. The MicrOmega instrument can provide additional detailed spectral information in the 0.9–2.6 μm region (Leroi et al., 2009), which will help to confirm many of the mineralogical features identified with the PanCam. Additionally, the Raman instrument will be able to provide mineral identification of target samples (Wiens et al., 2005; Bazalgette Courrèges-Lacoste et al., 2007; Sharma et al., 2007, 2009) and vital data that will complement the PanCam's multispectral capabilities. These instruments are currently envisaged to work on the microscale on drill samples, and as such are not remote surveying tools, which would leave the PanCam as the sole means of remote target selection. In future missions, however, a remote Raman system could provide an excellent way to support PanCam data.
Here, the reflectance spectra from publicly available spectral libraries were used to formulate prospective new geology filter sets for the ExoMars PanCam. These libraries included the United States Geological Survey (USGS) spectral library (Clark et al., 1993, 2007), the Jet Propulsion Laboratory (JPL) spectral library (Baldridge et al., 2009), and the Reflectance Experiment Laboratory (RELAB) library (spectra acquired by Bruce Fegley, Carle Pieters, Edward Cloutis, Jack Mustard, Janice Bishop, Michelle Goryniuk, and Phoebe Hauff, with the NASA RELAB facility at Brown University). Specifically, spectra of hydrated minerals already identified on Mars were used. These alternative filter sets, plus the Beagle 2 (B2) filter set (which is currently the baseline for the PanCam) were tested on their ability to detect hydrated minerals present in untreated Mars analog rocks from Iceland. The benefit of using raw samples instead of homogenized, size-specific particulate fractions was highlighted by Harloff and Arnold (2001). Previous to that, Yon and Pieters (1988) noted that the most appropriate analogue to outcropping rock on a planetary surface is not a powdered sample but a rough bulk sample surface. As such, natural geological samples were used for the present study to best simulate the nature of geological outcrops that may be encountered during the ExoMars mission. Multi-instrument and spectral analysis of analog or astrobiologically relevant material has previously shown the value of ground-truthing studies (e.g., Bishop et al., 2004a, 2004b; Pullan et al., 2008). Contextual information for the samples was also gathered on mineralogy, chemistry, and textural/morphological features with Raman spectroscopy, X-ray diffraction (XRD), scanning electron microscope (SEM), and energy dispersive X-ray spectrometer (EDS) analysis.
1.2. Hydrated minerals
Hydrated mineral terrains on Mars are of particular interest to the ExoMars mission as they are essential in establishing the history of liquid water on the planet, which in turn is directly related to the search for past or present martian life. Minerals with OH or H2O as part of their chemical structure require aqueous conditions to form but do not necessarily need liquid water to remain stable in their current environment after formation (Bishop, 2005). It is this knowledge that has driven the need to explore terrains rich in hydrated minerals, with the aim of identifying evidence for past habitable environments on Mars (Murchie et al., 2009). The results of the hyper-spectrometers Observatoire pour la Minéralogie, l'Eau, les Glaces et l'Activité (OMEGA) and Compact Reconnaissance Imaging Spectrometer for Mars (CRISM) currently orbiting Mars have revealed a large diversity in surface mineralogy and lithology (e.g., Bibring et al., 2005; Poulet et al., 2007, 2009; Mustard et al., 2008; Murchie et al., 2009). Hydrated minerals on Mars have now been identified in distinct hydrated mineral terrains. Oldest are the phyllosilicates, which are found in early Noachian terrains (Poulet et al., 2005; Bibring et al., 2006; Mustard et al., 2008). These are predominantly Fe-, Mg-, and Al-rich phyllosilicates (such as nontronite and montmorillonite) and have been seen to occur as alternating lithologies (Loizeau et al., 2007). These phyllosilicates reveal a complex aqueous history of early Mars that may be indicative of long-term aqueous alteration of basaltic/igneous material in this area (Poulet et al., 2005; Bishop et al., 2008). Sulfates, notably gypsum, jarosite and kieserite, among others, have been identified in layered terrains on Mars (Klingelhofer et al., 2004; Bibring et al., 2005; Gendrin et al., 2005). These have been seen to occur in Late Noachian and early Hesperian terrains, and it has been suggested that they indicate a change from neutral pH conditions to more acidic environments (Bibring et al., 2006). Sulfates are commonly formed through volcanic activity (such as alteration of volcanic rocks by acidic fumaroles) or evaporitic processes (Martinez-Frias and Amaral, 2006).
More recently discovered are deposits of opaline silica on Mars, detected by both CRISM and MER Spirit at Gusev Crater (Milliken et al., 2008; Squyres et al., 2008; Rice et al., 2010). Opaline silica commonly forms in hot spring systems, where the eruption of silica-supersaturated hot spring fluids at the surface gradually produces siliceous sinters over time. Additionally, opaline silica can form via hydrothermal weathering of basaltic rock, which strips the mafic minerals away and leaves behind a silica-rich crust (Kraft et al., 2003). Recently, Grasby et al. (2009) described silica deposits from cold springs believed to be unrelated to hydrothermal systems. Silica sinters are known to be excellent biopreservers on Earth, and it has been noted previously that the discovery of hydrated silica on Mars could have important implications for the detection of martian biosignatures that may be similar to those commonly found in hot spring sinters on Earth (Farmer and Des Marais, 1999; Goryniuk et al., 2004). Likewise, the recent discovery of possible carbonate deposits (Ehlmann et al., 2008; Palomba et al., 2009; Morris et al., 2010) suggests that past environments on Mars were more habitable than previously thought.
The aim of this work was to carry out the preliminary exploration of potential new geological filter wavelengths for the ExoMars PanCam and present initial results from testing these new filters on Mars analog rocks. Reflectance spectra from hydrated minerals, including gypsum, jarosite, alunite, calcite, montmorillonite, nontronite, and opaline silica, were used to formulate alternative filter sets for the ExoMars PanCam, with the aim of detecting these minerals within geological outcrops and deposits within the range of the rover.
2. Materials and Methods
2.1. Hydrated mineral reflectance spectra
Reflectance spectra in the region between 440 and 1000 nm of hydrated minerals from the USGS spectral library splib06a (Clark et al., 2007) and splib04 (Clark et al., 1993), the JPL spectral library (Baldridge et al., 2009), and the RELAB spectral library (Brown University, see above) were used to identify particular wavelengths that would be optimal for detecting the diagnostic spectral features of such minerals at the martian surface. Minerals were chosen based on the identification of hydrated mineral groups on Mars and are shown in Table 1. For filter selection (described below), the mineral spectra were required to have evenly spaced spectral points, and as such the published spectral data were resampled to produce data points every 10 nm. It should be noted that the mineral samples used to generate the library spectra were not always compositionally 100% pure and often have other minor mineral fractions present. As such, we merely take these powdered mineral reflectance spectra as an ideal spectrally pure “end member.” Another important factor is the variation between different sample spectra of the same mineral within the database. For example, the spectra for different samples of jarosite vary. Therefore, multiple sample spectra were utilized in the formulation of the new filter set to eliminate any bias toward one arbitrarily chosen sample. All mineral spectra used in the filter selection are given in Table 1, together with their associated mineral sample attributes, including impurities and grain size.
Data on grain size and minor mineral impurities are given where information is available.
2.2. Mars analog samples
Mars analog samples (Fig. 1) were collected from Iceland. They include subglacial basaltic lavas, hydrothermally altered lavas, and hot spring precipitates. The island of Iceland is a predominantly volcanic country, formed by the surface expression of the Mid-Atlantic Ridge and an underlying mantle plume—the Icelandic hot spot (Sigvaldason et al., 1974; Korenaga, 2004). There are numerous examples of past (mostly Pleistocene) subglacial volcanic activity and later Holocene lava flows, both of which commonly have undergone hydrothermal interaction. Geologically, Iceland bears many similarities to proposed martian volcanism. It is dominated by basaltic volcanism that is a result of fissure eruptions and mantle plume activity. Many volcanic features identified on Mars are also seen in Iceland, notably widespread basaltic flows (Keszthelyi et al., 2004) and shield volcanoes. The terrestrial analogues of some features on Mars, such as pseudocraters (rootless cones), are found predominantly in Iceland (Fagents and Thordarson, 2007), and several comparisons have been made between martian and Icelandic glaciovolcanism (Chapman and Smellie, 2007). Therefore, Iceland is considered here as an ideal analogue for volcanic environments that have existed on Mars in the past. Additionally, as none of the Icelandic samples contained carbonate, a sample of siderite (from University College London Earth Sciences Geology Collections) was also used for testing the new filter wavelengths.

Mars analog samples
2.3. Multispectral imaging and analytical methods
Mars analog samples were imaged multispectrally at the Mullard Space Science Laboratory, UK. Samples were illuminated with a Solex solar lamp at an average distance of 60 cm, although this varied depending on the size of the sample. Still-capture imaging was carried out at a distance of 1 m (the minimum distance at which the PanCam will be used) from the sample by a Foculus FO432SB camera (1.4 megapixles, 8 bits/pixel gray scale, 15° field-of-view lens, exposure time 1 ms to 65 s). As with the ExoMars PanCam, this camera has a 1024 × 1024 pixel CCD that responds to wavelengths between 400 and 1000 nm. The images taken at this distance typically have a spatial resolution of between 100 and 200 μm/pixel. The camera was interfaced with one of two CRI Varispec liquid crystal tunable filters—one covering the visible (wavelength range of 400–730 nm; bandpass of 20 nm) and the other covering the near IR (wavelength range of 650–1100 nm; bandpass of 10 nm). Images were taken with these filters in 10 nm increments. Images were processed with ImageJ software (
Mineralogical identification within the Mars analog samples was achieved by using Raman spectroscopy and XRD to confirm spot mineralogy (within the multispectral target area) and bulk mineralogy, respectively. Raman spectra were gathered by a Renishaw InVia Raman spectrometer coupled with a Leica microscope at University College London and a 785 nm laser, through either a 20 × or 50 × microscope lens. XRD analysis was conducted at Aberystwyth University with a Bruker D8 Advance X-ray diffractometer with a Vantec Super Speed detector. To provide additional context for the interpretation of the observed reflectance spectra from the multispectral imaging data, a SEM combined with a back scatter electron (BSE) detector and an EDS were used to collect submillimeter structural and elemental data from samples. For the SEM study, thin sections were carbon coated and analyzed with a Jeol Scanning Electron Microscope (JSM-6480LV) at University College London. For associated EDS analysis, an accelerating voltage of 15 kV was used.
2.4. Selection of filter wavelengths for two possible new filter sets
Two new alternative filter sets were devised. Reflectance spectra (from spectral databases, see Section 2.1 above) of hydrated minerals nontronite, jarosite, montmorillonite, calcite, gypsum, opaline silica, and alunite were used to devise one of these two new filter sets, based on the need to identify hydrated minerals on Mars. The new filter sets were chosen as follows:
Filter set F1-12
This filter set had 12 evenly spaced filters, which were spaced every 50 nm (with the exception of the first two filters, which have a 60 nm spacing) and were not biased toward any pre-determined set of minerals.
Filter set F2-12
This filter set was generated statistically based upon hydrated mineral spectra. Twelve optimal wavelengths that most accurately reproduced a specific mineral spectrum were calculated for all the 70 selected hydrated minerals collectively (all normalized to the same starting value). This filter selection used a brute force approach to search through all the possible wavelength selections between 440 and 1000 nm, with the use of 10 nm increments. Two of these 12 wavelengths were always fixed at 440 and 1000 nm. The suitability of a wavelength selection was calculated, first, by interpolating the points between the 12 randomly chosen wavelengths to obtain a full set of data (i.e., a complete spectrum) for each individual mineral spectrum. Then we calculated the absolute difference in reflectance (residual) between the actual spectrum of the mineral (R
a), and the spectrum estimated (R
e), using the current wavelength selection at each respective 10 nm spaced point (λ). The summation of these absolute distances is then used as the “error score” for that particular wavelength selection and mineral (σ
m
):
where λ increments in steps of 10 nm. The lower the error score, the better the wavelength selection, which produces the optimal set of 12 wavelength points for each mineral. To find the best wavelength selection for the whole mineral set, the error scores for each mineral were summed into an overall error score (σ) for each combination of wavelengths assessed:
This generated filter set “F2-12.”
These two new filter sets, and the original B2 filter wavelengths, were tested on Mars analog samples to evaluate their suitability in the detection of hydrated minerals on Mars.
2.5. Testing filter sets on Mars analog samples
Multispectral data gathered for the Mars analog samples were resampled to match that of the filter wavelengths in the proposed new filter sets, which produced PanCam-style 12-point spectra. In addition, the data were averaged within the range covered by the bandpass for each filter, of which the B2 filter bandpasses had already been previously assigned (Griffiths et al., 2006). These were used in the re-sampling of rock sample data averaged across the full-width-at-half-maximum (FWHM) values. For the new filter sets, estimated bandpasses were utilized, based on those assigned for the B2 filters. These are shown in Table 2.
The B2 filter set is a duplicate of that from the Beagle 2 PanCam (Griffiths et al., 2006); F1-12 has filters regularly spaced every 50 nm; F2-12 was calculated statistically. All data are in nanometers.
The Mars analog samples contained sulfate, phyllosilicate, and opaline silica minerals, and specific mineral species were confirmed with Raman spectroscopy and XRD (sample details in Table 4 and Fig. 4). A sample of the Fe-carbonate siderite was also used, from which confirmatory Raman data was also acquired (Fig. 4). Six Icelandic geological samples (Fig. 1; plus one siderite sample) were used, and the spectra for each respective filter set for these samples are shown in Fig. 5. Where relevant, spectra for different colored regions (and therefore potentially different mineralogy) on the rock are shown, highlighting the spectral variation across a naturally heterogeneous geological sample.
The filter sets were assessed first on whether they were able to capture spectral features that could potentially lead to the identification of a particular mineral species within the rocks and second on their ability to distinguish between the different rock samples. Spectral parameters, such as those used to identify spectral variability within MER PanCam multispectral images (e.g., Farrand et al., 2006, 2008), were used. They are listed in Table 3. Different filter sets will have different filter wavelengths that cover a particular spectral feature, such as the 440–700 nm absorption edge or a 900 nm absorption band. Where a filter is not centered at the specific band in question, the nearest filter is used and so is representative of how spectral parameter data will appear with the different filter sets. Finally, multivariate analysis was employed to demonstrate the ability of the filter sets to identify and distinguish between clusters of similar mineral targets.
All data are in nm; R denotes reflectance. *Denotes multiplication.
3. Results
3.1. The new geological filter sets
The new filter set F2-12 differs principally from the B2 filters in that it lacks a concentration of filters toward the NIR end of the spectrum, with a broader range of filters within the visible. The spectral region between 440 and 1000 nm is dominated by Fe excitational and charge transfer bands (Bishop, 2005) and therefore is particularly sensitive to iron-bearing mineralogy (Farrand et al., 2008). As a result, distinctive spectral features are particularly evident in iron-bearing hydrated minerals such as jarosite and nontronite, as well as silicates pyroxene and olivine and a range of iron oxides such as hematite and goethite. Ferric absorption bands exist at 480 nm, 650 nm, and 950 nm, while a ferrous absorption band also in the 950 nm region can often obscure that produced by ferric iron (Stewart et al., 2006). While nontronite and jarosite share these similar ferric absorption bands, nontronite has a distinctive kink around 650 nm that is not present in the jarosite spectrum, and it is features such as this that will be crucial in distinguishing PanCam spectral data.
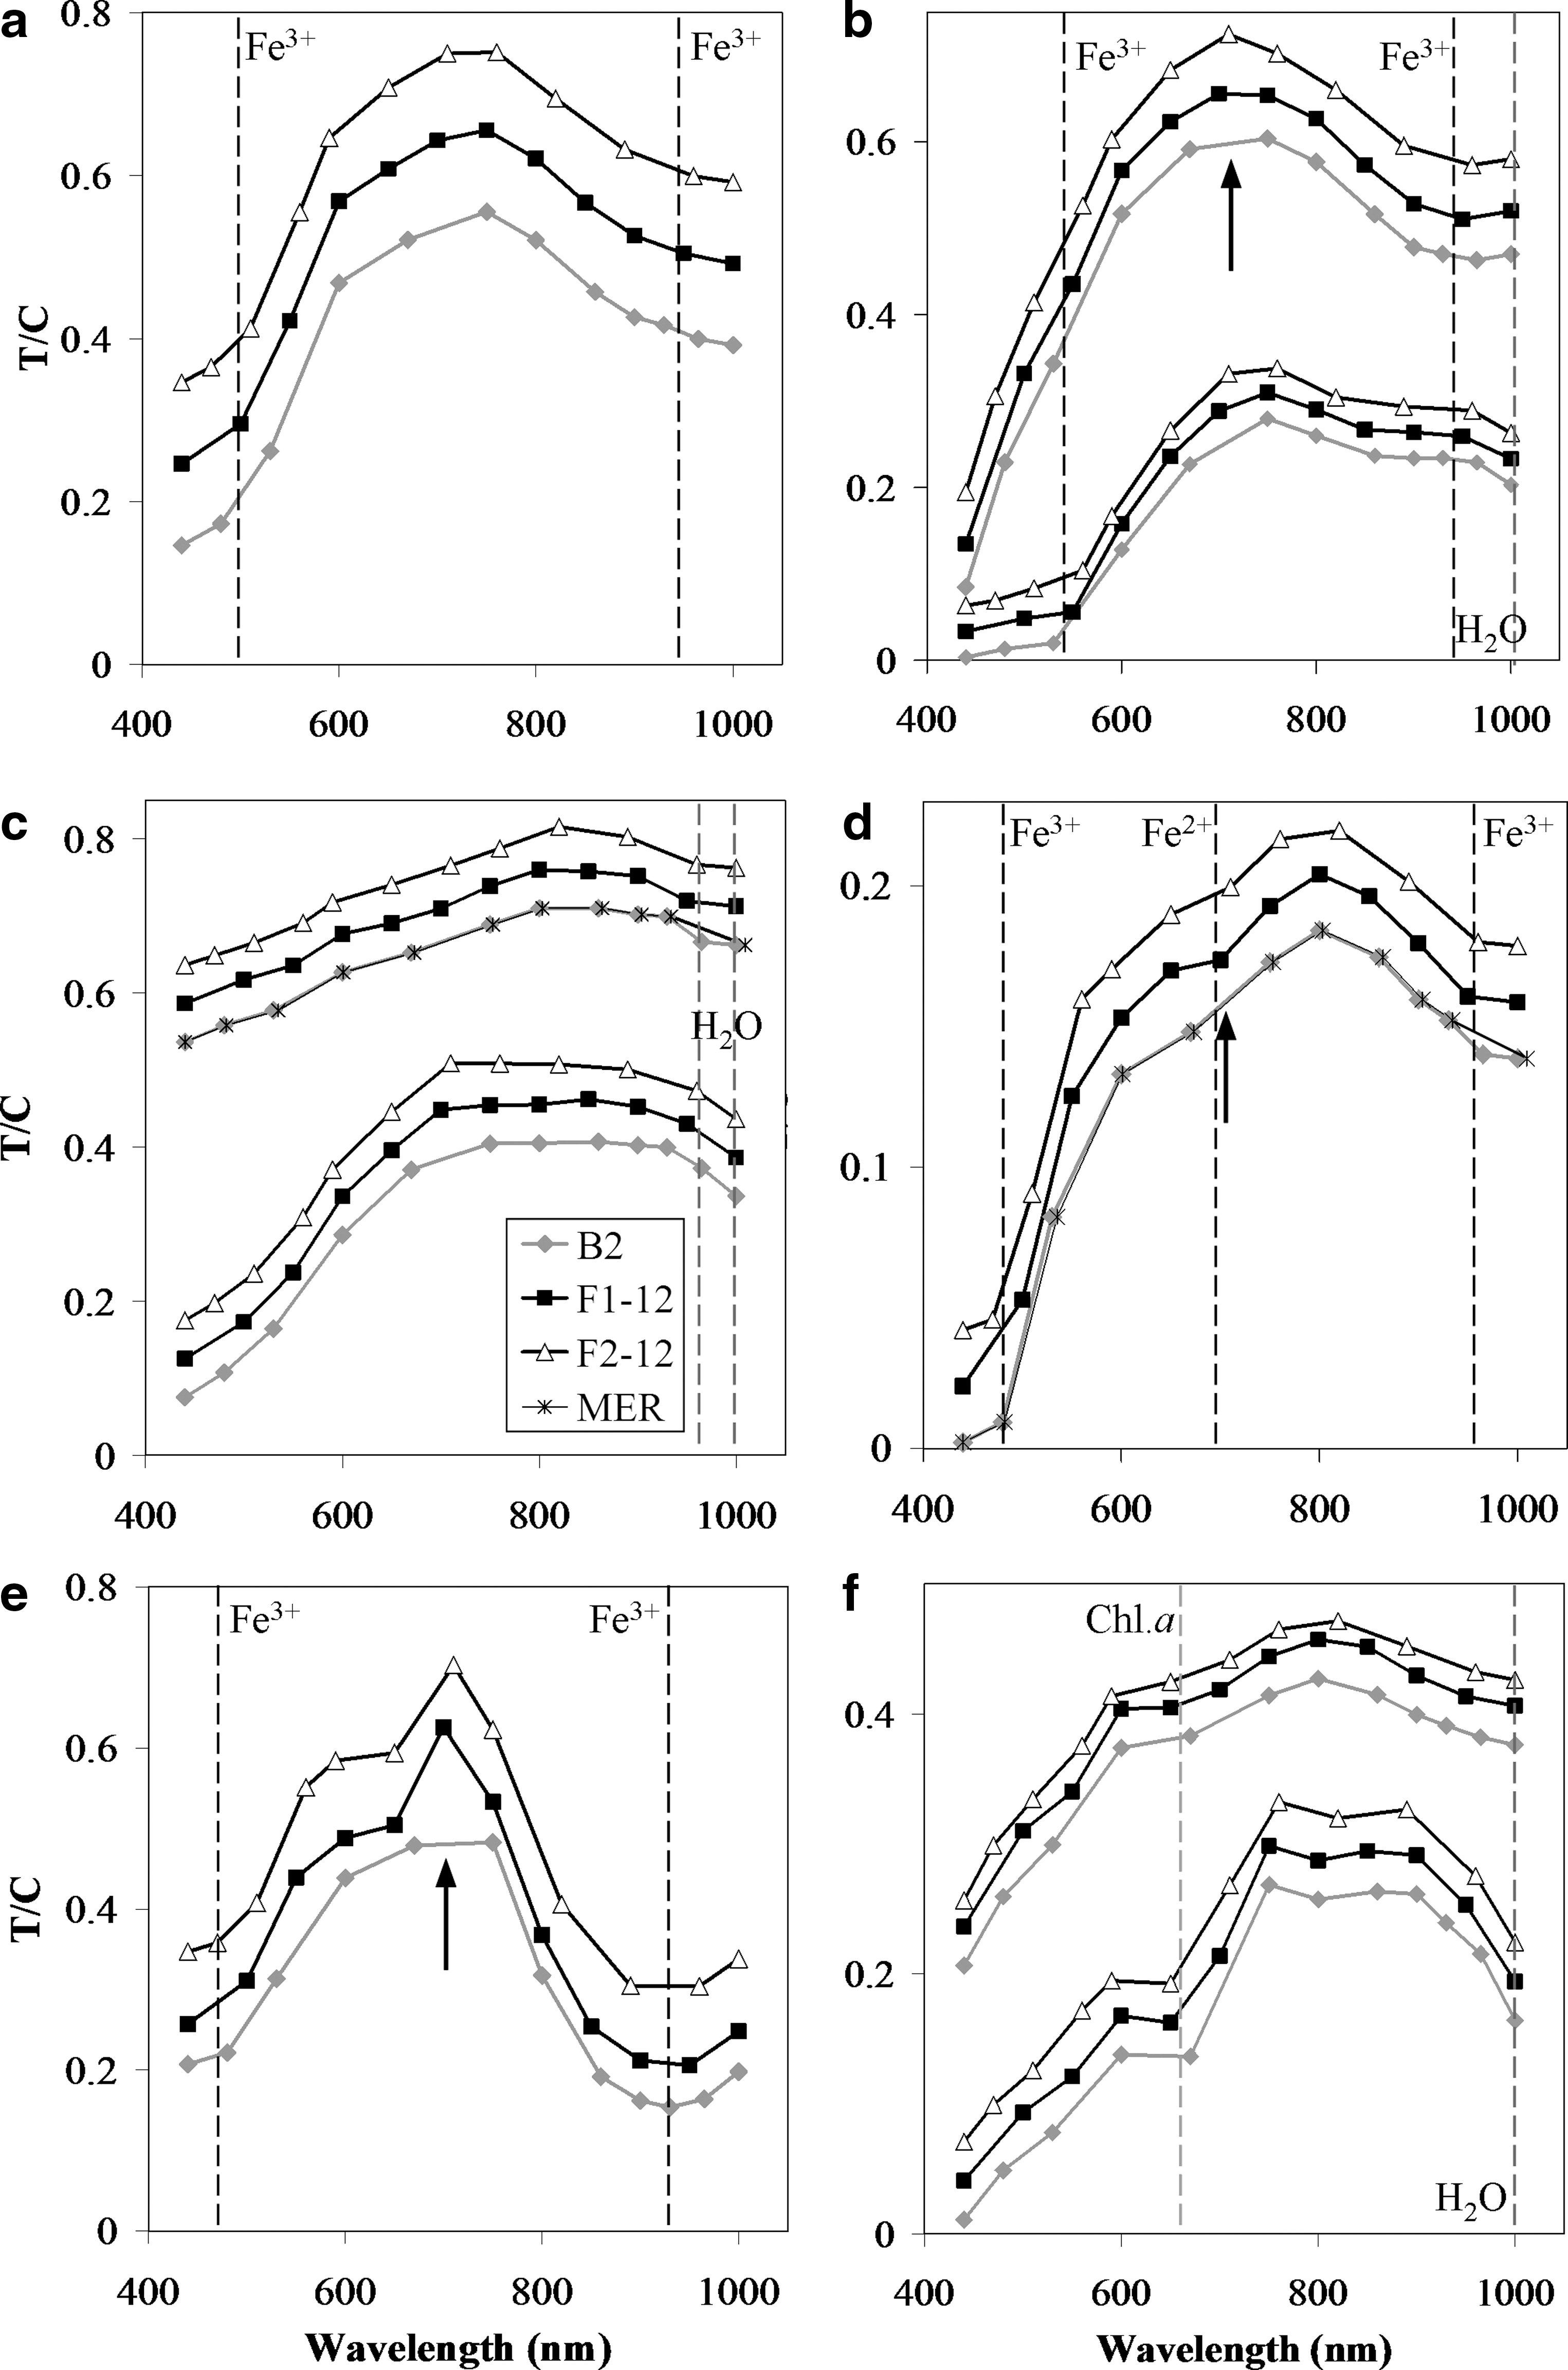
The filter center wavelengths and their estimated bandpasses at FWHM are shown in Fig. 2, together with the position of ferric and ferrous iron, and water/hydroxyl bands that are common to the hydrated minerals used in this study (also shown). It can be seen that the B2 filters miss a Fe3+ absorption band at ∼5400 and 650 nm, and the jarosite and nontronite reflectance bands at 710 nm and 580 nm, respectively. Overall, five of the B2 filters fall directly (their center wavelength, 4 filters) or partially (coverage only by their bandpass, 1 filter) within these spectral bands. Similarly, six of the F1-12 filters cover the spectral bands (five with their center wavelength). In comparison, filter set F2-12 has eight filters falling within the spectral absorption/emission bands (six by their center wavelength). As a simple example, Fig. 3 shows two hydrated mineral spectra (nontronite and jarosite) focused on a particularly variable region, which demonstrates the effect different filter positions have on the observed spectrum. It can be seen that the B2 filter set does not fully recover key diagnostic spectral points for the mineral nontronite, where the Fe3+ absorption feature at 650 nm falls between B2 filters 600 nm and 670 nm. Likewise, the B2 filters do not capture the reflectance peak at 710 nm in jarosite, while filter set F1-12 partially misses it. Filter set F2-12, however, closely follows the spectral features of both nontronite and jarosite within this wavelength region.

Plot of filters and estimated filter bandpasses for B2 and new filter sets, together with vertical spectral bands for Fe (gray, solid line) and water (blue, dashed line) and reflectance peaks for jarosite and nontronite (pink). Also shown are the mean spectra of each mineral species used to statistically calculate new filter selections (only the mean is shown here for clarity). For specific sample numbers, see Table 1. Color images available online at

Reflectance spectra of nontronite and jarosite (SWa-1.a and JR2501, respectively: see Table 1) showing the capability of different filters in identifying diagnostic spectral features. For both minerals, F2-12 provides a better fit to the original spectrum than F1-12. Both F1-12 and F2-12 are better than the B2 filters. Arrows highlight features that are missed by the filters.
3.2. Identification of sulfates in Mars analog samples
Sample NAL is a subaerial basaltic lava covered in extensive sulfur-rich alteration products due to acid-fumarole weathering, which produces distinctive red and yellow color regions on the rock surface (Fig. 1). EDS and BSE data show there to be different mineralogical deposits within lava vesicles, which range from Si-rich to Fe-Al-rich sulfate compositions (Fig. 4, Table 4). Additionally, Raman spectroscopy shows the surface deposits to include natroalunite, natrojarosite, and hematite (Fig. 4). The spectra of the different regions on this rock are consistent with the iron sulfate jarosite (KFe3(SO4)2(OH)6) and the aluminum sulfate alunite (KAl3(SO4)2(OH)6) for “Yellow” and “Red” regions, respectively (Fig. 5b). The Yellow region produces a spectrum that has a steep ferric absorption edge between 440 and 700 nm, followed by a broad absorption centered around 950 nm, which is characteristic of Fe3+. The Red region has spectral features synonymous with those often seen for alunite, including a steep gradient between 440 and 700 nm and particularly an absorption feature at 950–1000 nm, which can be attributed to OH stretching vibrations that exist further into the NIR, the first band existing at 1010 nm (Hunt et al., 1971). Pure alunite is typically white (Hunt et al., 1971), but in this case it exists as red deposits on the surface of the lava. This red coloration is due to the partial replacement of Al3+ with Fe3+ (Hunt et al., 1971), which is represented by the broad absorption feature between 800 and 900 nm. Although jarosite is also a hydrated sulfate, it doesn't exhibit any OH bands until further into the IR spectrum (Clark et al., 1990). All these spectral features for both the Yellow and Red regions were best captured with the filter set F2-12, while both the B2 and F1-12 filter sets miss the peak at 710 nm in the Yellow spectrum (Fig. 5b).
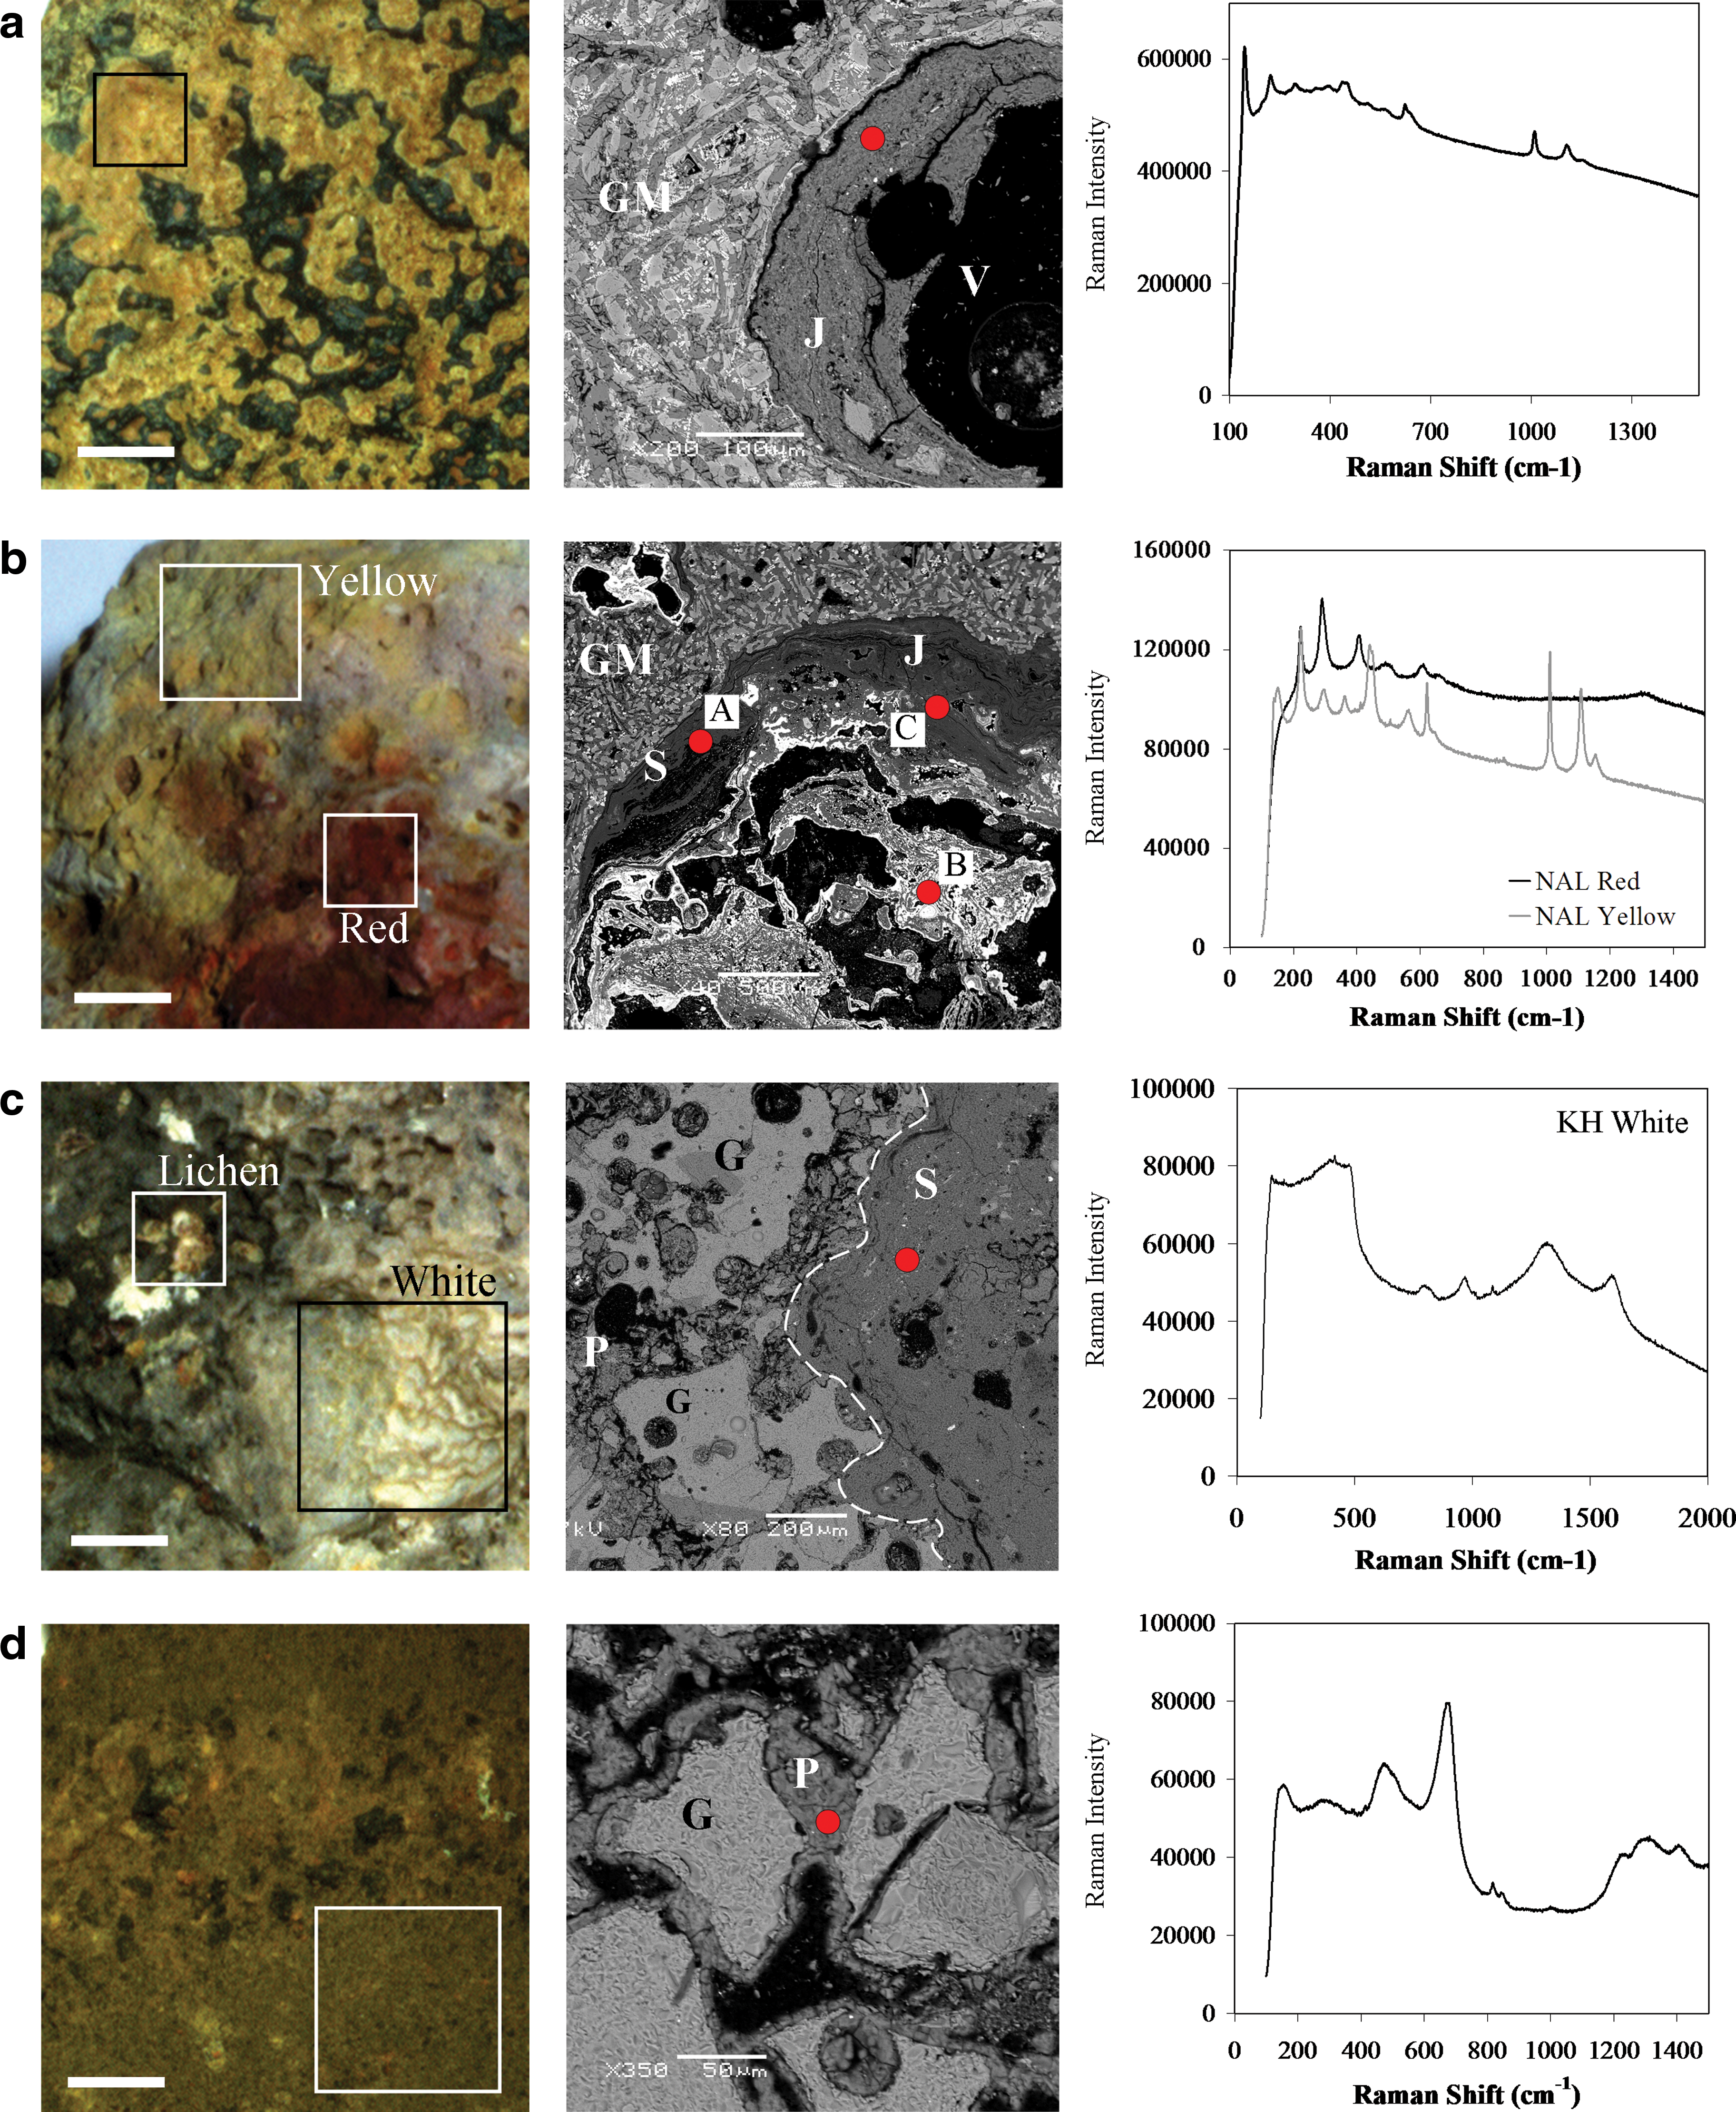
Multispectral RGB composite image (scale bar = 1 cm), BSE image, and Raman spectroscopic data for Mars analog samples. Boxes in the RGB composites represent multispectral targets used to acquire PanCam spectra; red dots in the BSE images indicate where EDS measurements (given in Table 4) were made. (
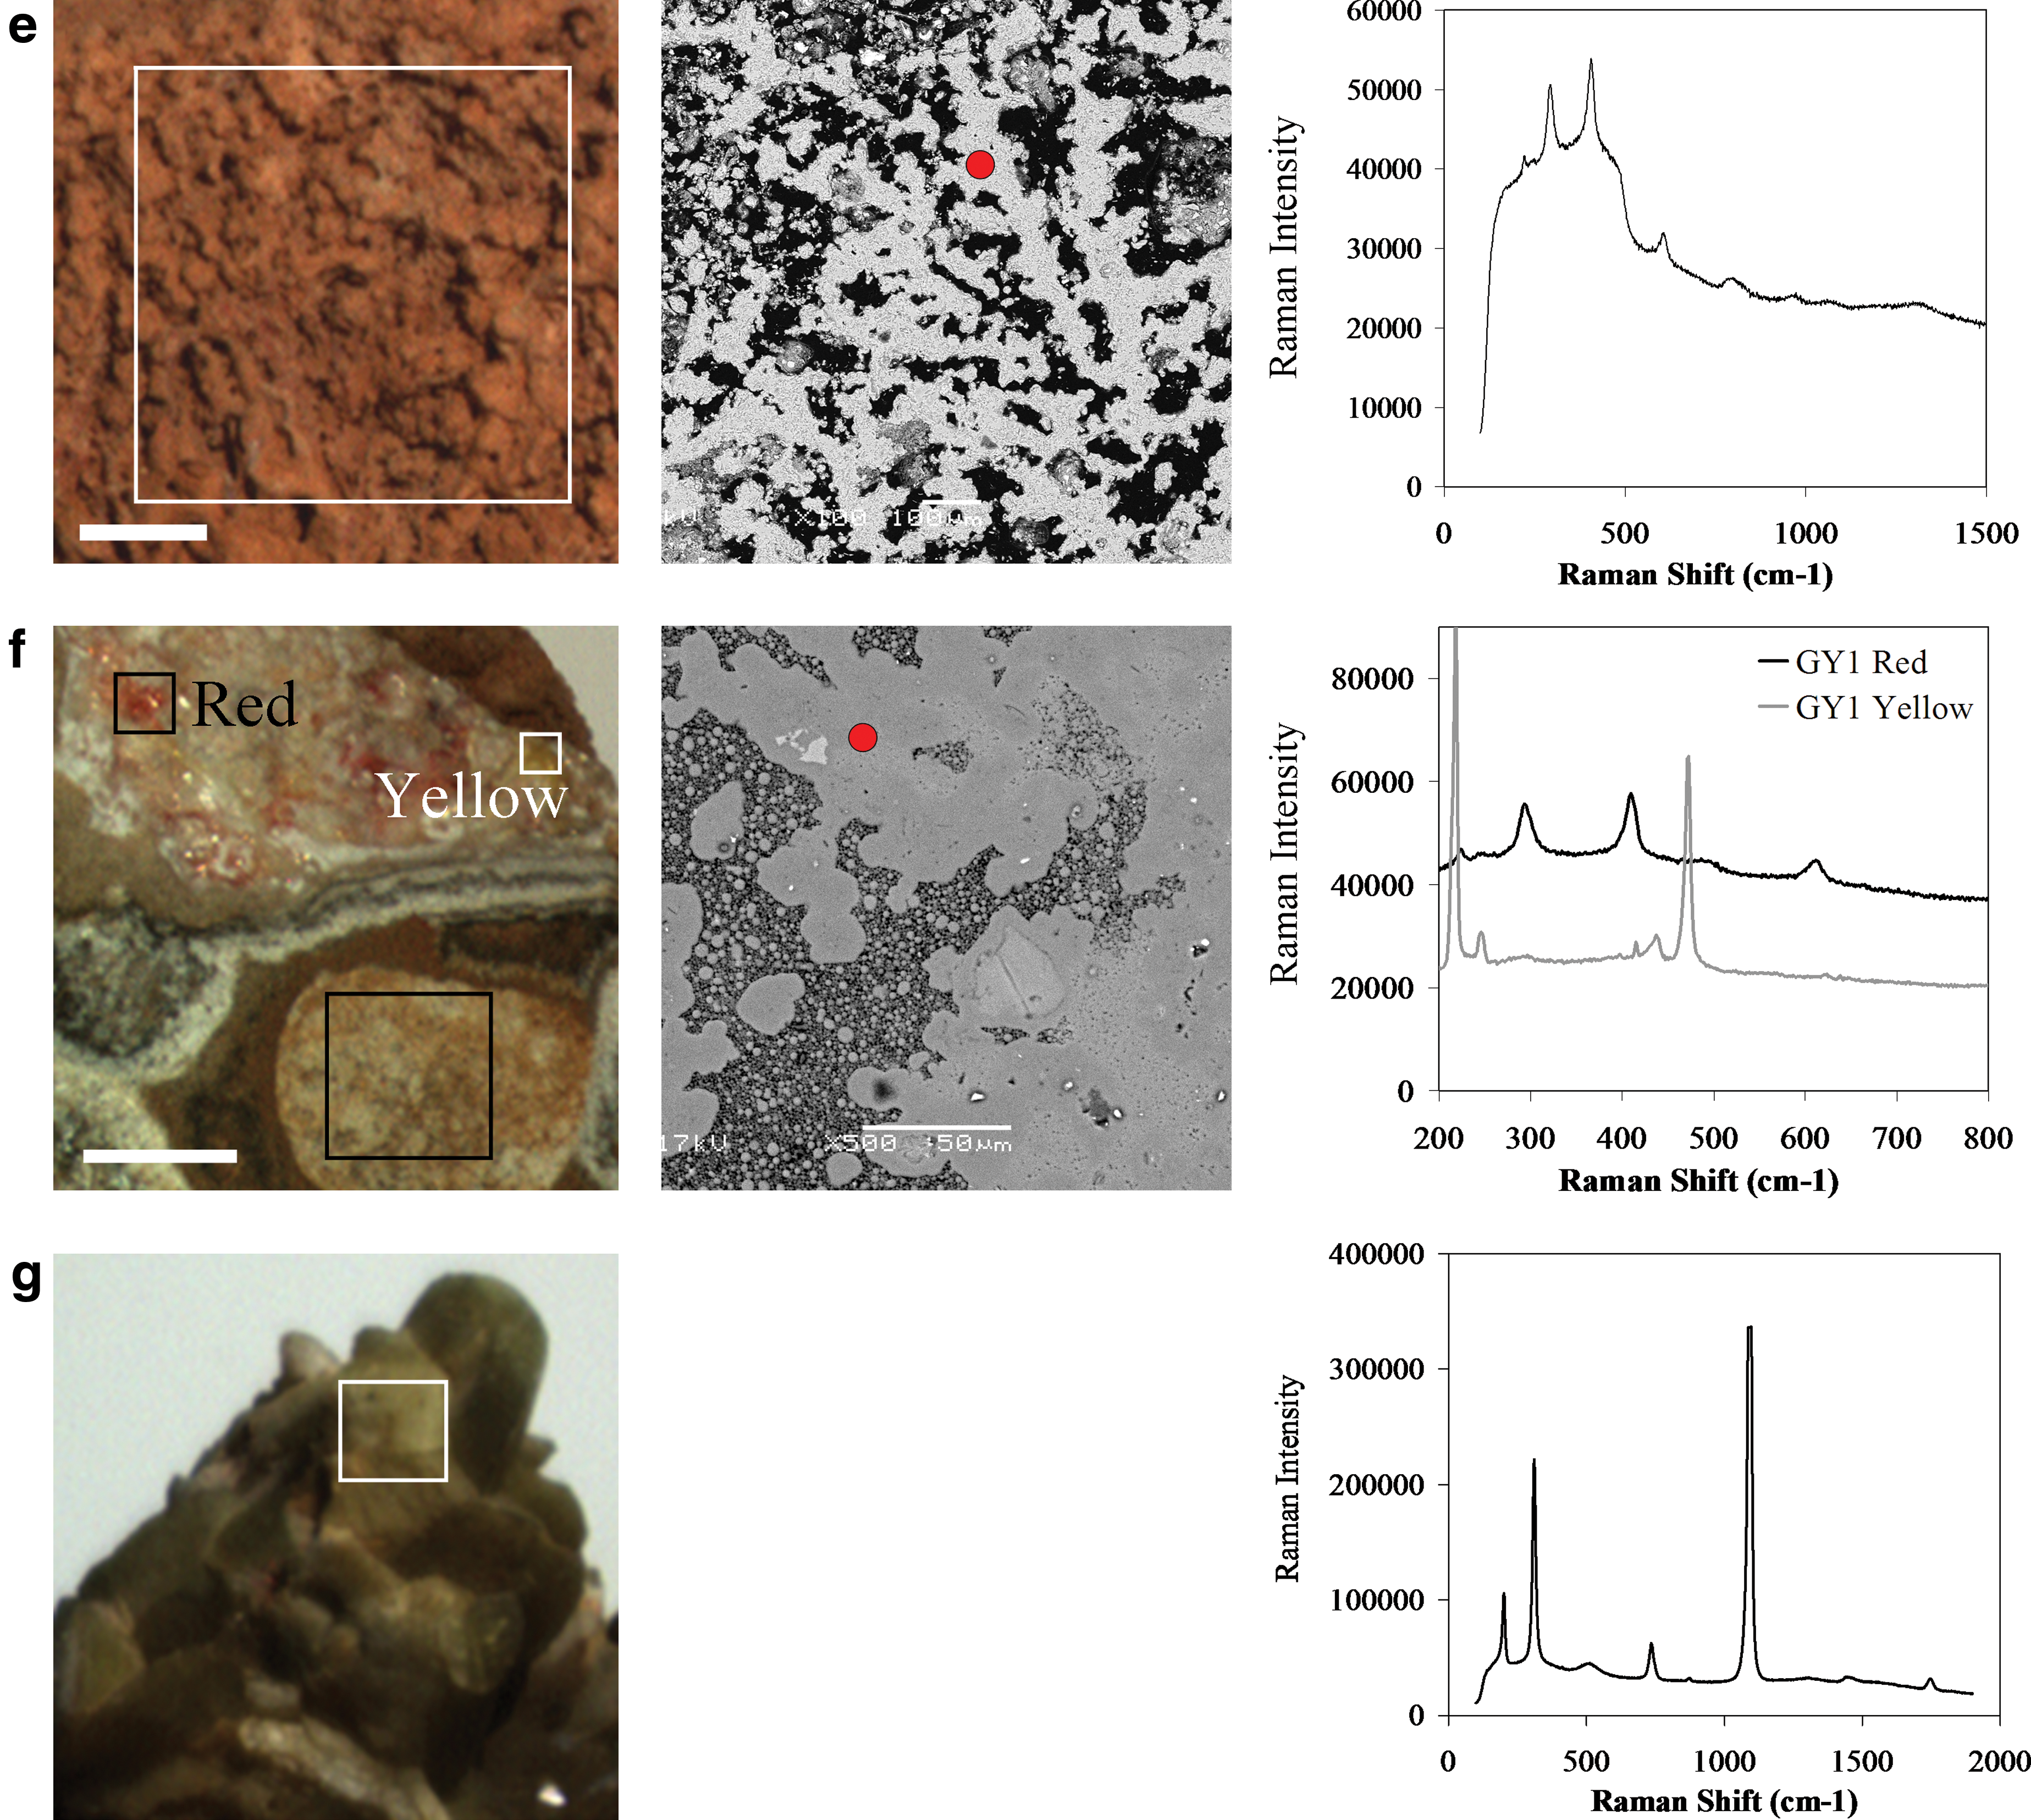
Mars analog sample spectra modeled for the B2 and two new filter sets, “F1-12” and “F2-12.”
Associated data and images are given in Fig. 4, also showing where EDS spot measurements were taken. EDS composition details the main elements only (quantified as compound wt %, normalized to 100%)—trace elements are not given. Error values represent one standard deviation (n = 10).
Sample NBO, like sample NAL, is an acid-weathered basaltic lava, with orange colored deposits filling the vesicles that are surrounded by unaltered basalt. The spectrum of these Orange deposits is similar to that of the Yellow mineral deposit in sample NAL, in that it exhibits a main peak at 720 nm and absorption features at 480 and 950 nm (Fig. 5a). As with the NAL deposits, these features suggest the presence of jarosite, which is entirely consistent with the geological setting of this lava. This was confirmed with Raman analysis (Fig. 4). Unlike the deposits in sample NAL, all filter sets are able to reproduce this spectrum correctly, although the B2 and F1-12 filter sets only partially capture the 710 nm peak, which lies either between the 670 and 750 nm filters (B2), or 650 and 700 nm filters (F1-12).
3.3. Identification of phyllosilicates in Mars analog samples
Hyaloclastite sample HH is rich in palagonite, which exists as alteration rinds around basaltic glass clasts, as seen under BSE detector (Fig. 4). The smectite composition of hyaloclastite is represented by the elemental composition of the palagonite matrix that surrounds the basaltic glass fragments (Table 4). XRD data reveal that the sample consists largely of amorphous, noncrystalline material, typical of palagonite (Stroncik and Schmincke, 2002). Despite the lack of crystalline material detected with XRD, the PanCam spectral features for this rock suggest a nontronite component, with characteristic ferric or ferrous iron absorption features at 470, 680, and 950 nm. The absorption features observed at ∼460 nm and ∼950 nm can be attributed to the presence of Fe3+, while the shifting of the absorption from 650 nm (more typical for nontronite) to 680 nm is indicative of a change from Fe3+ to Fe2+ (Stewart et al., 2006). Of the three filter sets, this spectrum is best reproduced by sets B2 and F1-12, in terms of the number of spectral features covered (Table 5). The new filter set F2-12 misses absorption features at 680 and 800 nm. However, while the B2 filters only miss one spectral feature (the kink at 680 nm), this absorption is a key diagnostic feature of the nontronite spectrum (Fig. 5d).
Detection is classed as either positive (+) or negative (−).
3.4. Identification of opal and carbonate in Mars analog samples
Silica-rich hot spring deposits are more ambiguous regarding the multispectral detection of mineral species present. Sample KH is a hyaloclastite with an opaline silica crust (1–4 mm thick) on the surface, as confirmed by Raman spectroscopy and energy dispersive X-ray spectrometry (Table 4, Fig. 4). XRD analysis showed this crust to be largely amorphous with minor amounts of calcite. Additionally, this surface crust is inhabited by chasmolithic lichen communities. The spectrum of this white crust is consistent with that of opal-A, in that it exhibits a smooth arcing spectrum, although the hydration feature at 950 nm is not present here (Fig. 5f). The additional presence of the lichens has the effect of creating a shallow, broad absorption feature at 670 nm, which is indicative of chlorophyll a. As would be expected, this 670 nm feature is prominent in the “Lichen” spectrum, along with a steep H2O absorption between 900 and 1000 nm. All the filter sets recovered these spectral features, from both the White and Lichen regions (Fig. 5f).
Samples GY1 and GY2 are both hot spring silica sinters, again dominated by opaline silica. GY1 is characterized by several different colored layered regions that range from black to red to yellow to white (Fig. 1b, Fig. 4f), with these components ranging from 1 to 10 mm in size. The spectrum of the White region has a generally flat morphology, with a small absorption at 950 nm, comparable to the spectral features of opal-CT, where the 950 nm absorption feature can be attributed to OH−. This 950 nm absorption is captured by all the filter sets (Fig. 5c). The spectra of the other colored regions of sample GY1, however, are less indicative of its true mineralogy. Raman analysis of the Red and Yellow sinter components identified these regions as hematite and sulfur (Fig. 4), respectively, yet this is not revealed by the multispectral imaging. These mineral components are 1–2 mm in size and are therefore well within the limits of the test camera resolution (100–200 μm/pixel). Figure 6 shows the 12-point spectra for these two colored regions with the use of filter set F2-12. It can be seen that the features are more consistent with those for the sulfate alunite, as seen in sample NAL (Fig. 5b). These two spectra exhibit differences in features that suggest perhaps a minor influence of their true mineralogy, such as the flatter profile of GY1 Yellow between 600 and 830 nm (sulfur has a flat profile between 500 and 1000 nm) and the absorption between 440 and 560 nm, which is a feature typically seen for hematite. However, these features are by no means diagnostic and highlight potential problems of remotely identifying small mineralogical targets within a heterogeneous rock sample. Like GY1, sample GY2 also formed as part of a silica sinter, but it exhibits a different spectral profile to that of GY1. GY2 is a silicified biomat with a dominantly Si composition (Table 4) and opal-A mineralogy (Fig. 4), yet this is not represented within the spectral features (Fig. 5c). As with the small sulfur and hematite mineral deposits in GY1, these spectral features are suggestive of alunite, despite the silica-rich composition of the rock. This alunite component can be seen to exist as a fine particulate coating on the surface of the sinter deposit (discernable from hand specimen), which therefore prevents the silica mineralogy from influencing the observed spectrum. Likewise, the biological origin of this deposit appears to have no impact on the observed spectra, even though morphological microfossils can be easily identified as a significant structural component (Fig. 7). As with sample KH, all filter sets captured the key spectral features of the GY2 spectrum (Table 5).
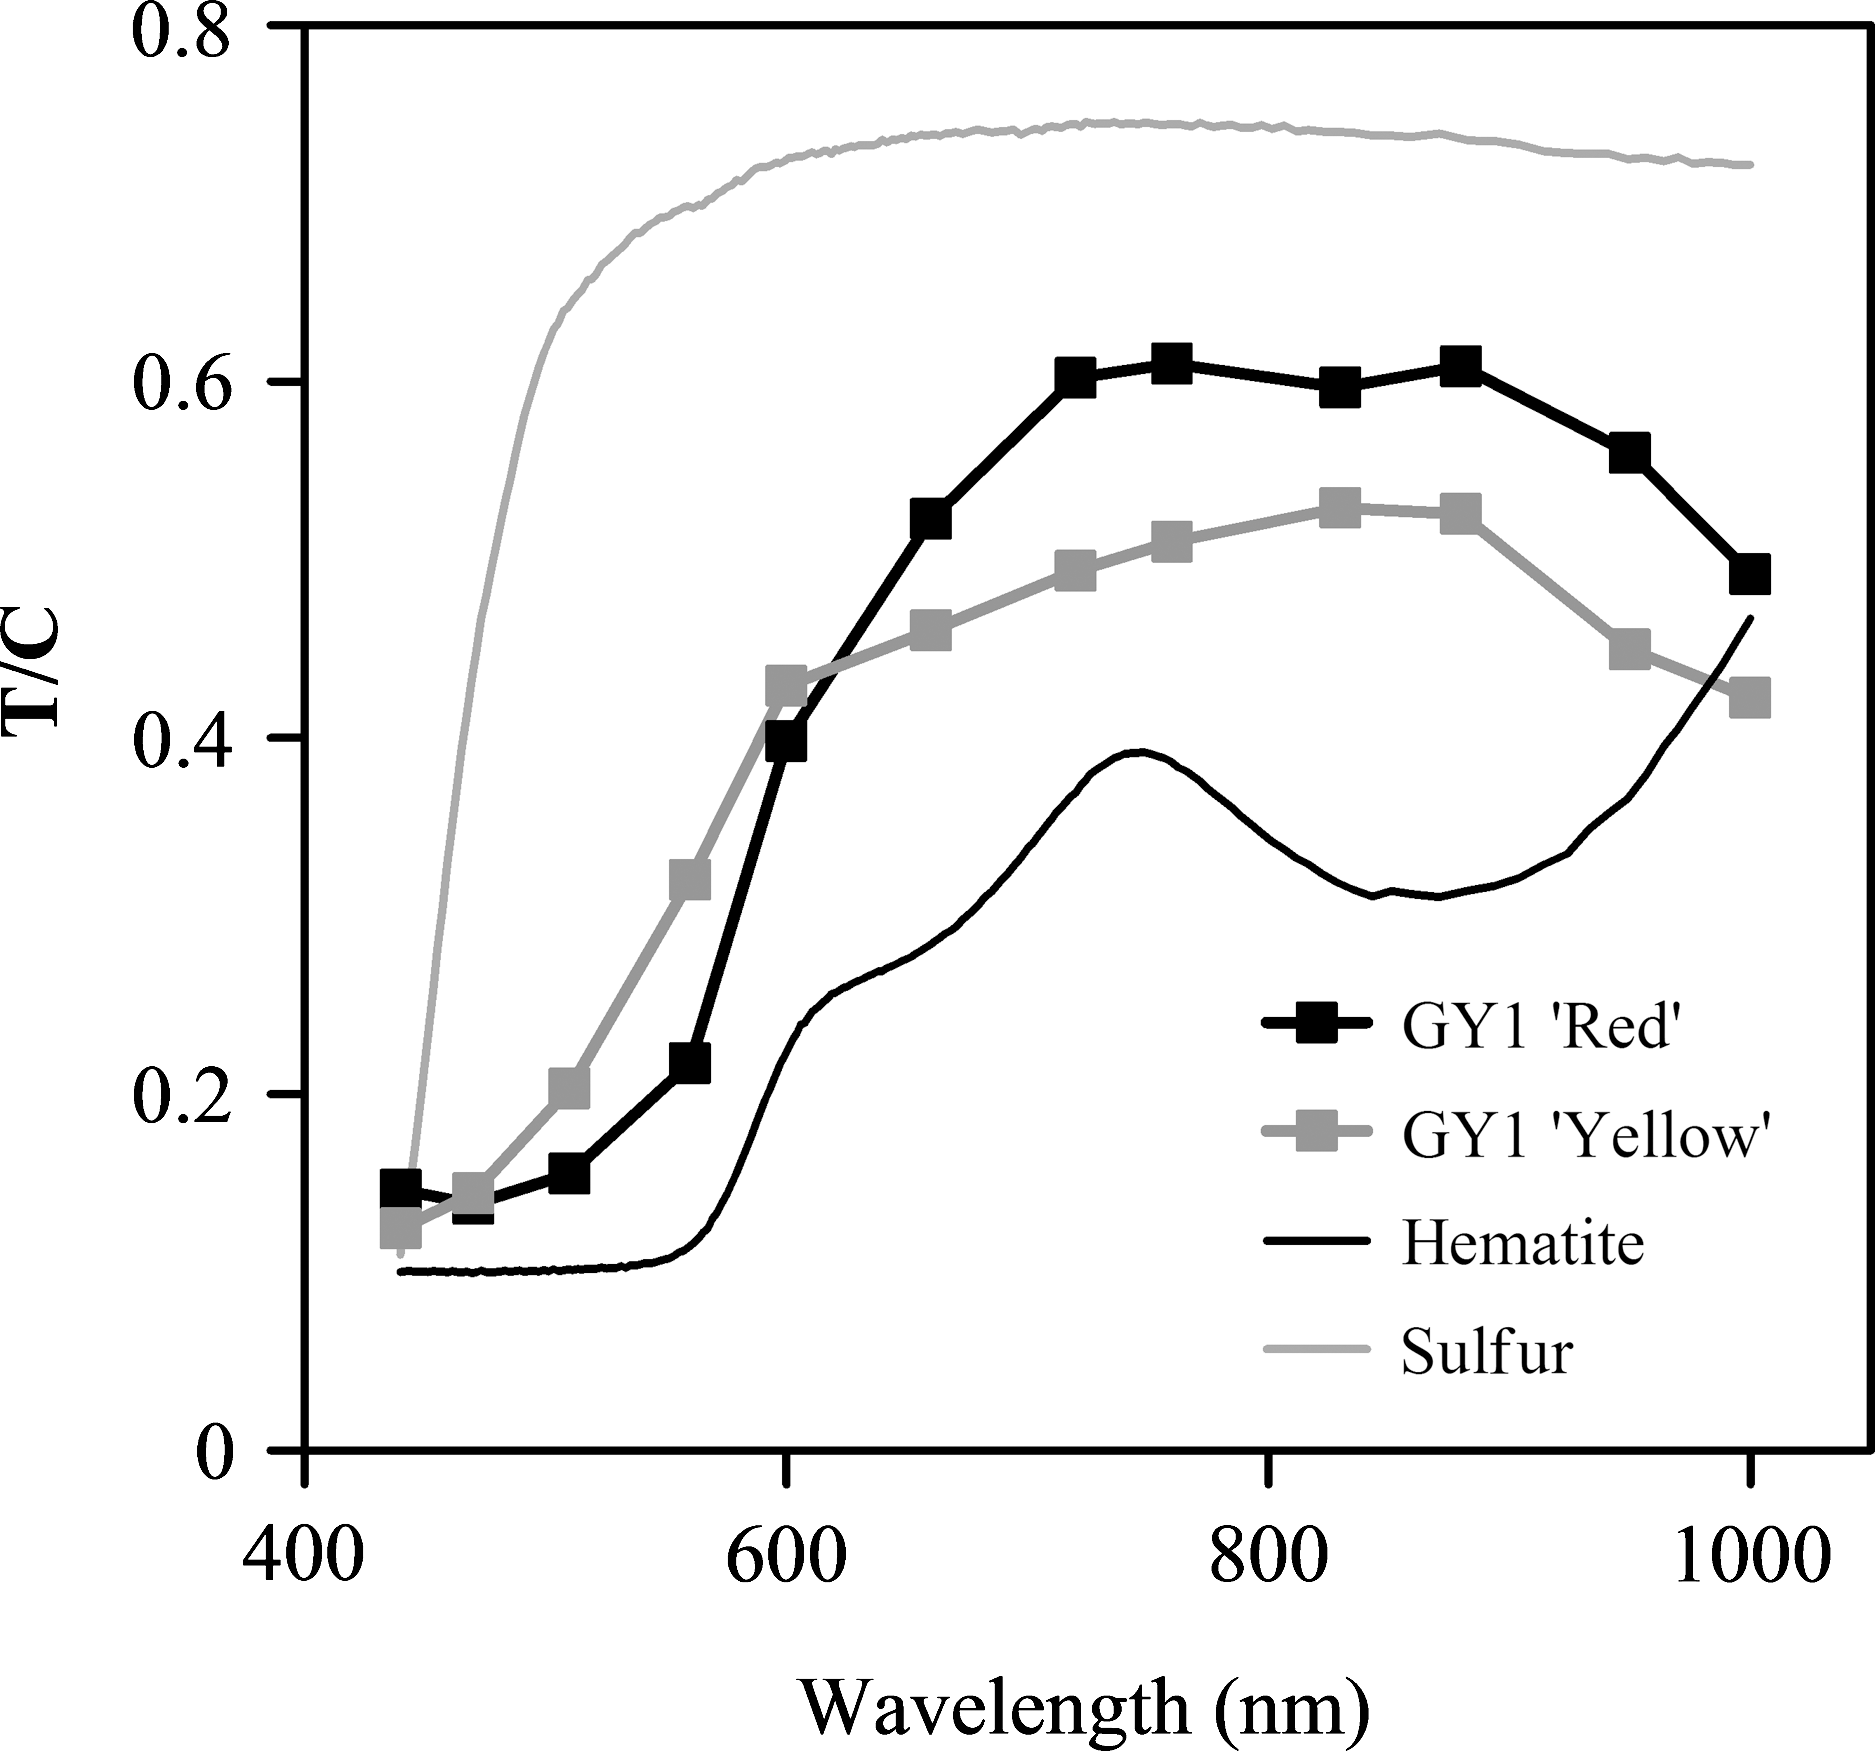
GY1 Red and Yellow PanCam spectra using the F2-12 filters, and reflectance spectra for hematite and sulfur (USGS spectral library reference WS161 and GDS94, respectively), all normalized to a starting point of ∼0.1.
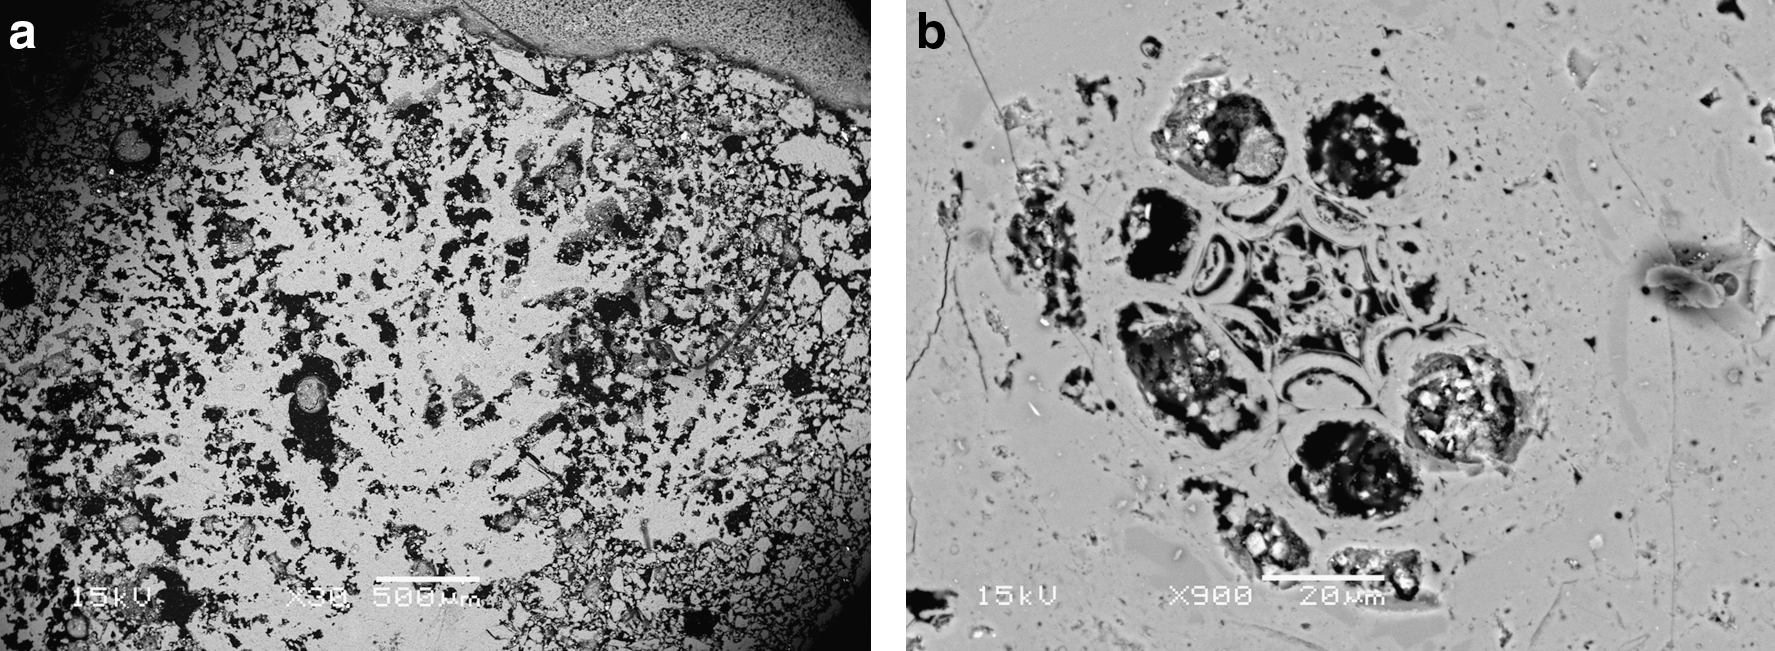
BSE images of the GY2 silica sinter with preserved biological structures within the silica matrix, showing branching dendritic structures that extend up from the base of the sinter
Finally, iron-rich carbonate siderite (FeCO3) shows clear differences between the three filter sets. In particular, the B2 filters miss a significant peak at ∼720 nm (Fig. 5e), a feature that is captured with both F1-12 and F2-12 filter sets. Siderite, along with magnesite, is one of the carbonates believed to exist on Mars (Bridges et al., 2001; Morris et al., 2010) and indeed is one of the phases found in some martian meteorites (Romanek et al., 1994; Bridges and Grady, 2000). Considering the importance of carbonate minerals to astrobiology (e.g., Murchie et al., 2009), it is imperative that the PanCam have the capacity to identify them correctly.
3.5. Spectral parameter representation of Mars analog samples
In addition to PanCam spectral data being used to identify putative mineral assemblages, it must also allow for clear distinction between different targets. For this, spectral parameter plots were used to group Mars analog spectra into spectral groups based on particular spectral features, such as the steepness of an absorption slope or the depth of an absorption band (listed in Table 3). These plots are often used to define spectral variability within martian rocks and, therefore, potential lithological variability (Farrand et al., 2006, 2008). Likewise, such parameters can be used to identify the distribution of a particular mineralogical feature across a martian scene (Rice et al., 2010). Therefore, the selection of particular filter wavelengths may affect the ability of the PanCam to distinguish different lithologies/mineral species.
Figure 8 plots ferric iron content (steepness of the 440–700 nm slope) against water content (920–1000 nm slope). The mineral spectral data used for the selection of filter set F2-12 (Table 1) are also plotted for comparison, and it can be clearly seen that a decrease in the ferric iron absorption slope corresponds with an increasing water absorption slope (Fig. 8a). This trend is also seen in the sulfate-containing rock samples, with jarosite-rich samples NAL Yellow and NBO following this trend down to alunite-containing samples NAL Red and GY2 (Fig. 8b). There is little difference between samples KH White, GY1 White, and HH, all of which cluster in a similar region to opaline silica (Fig. 8d). This is consistent with the mineralogies of KH White and GY1 White; the presence of HH, however, is most likely explained by its amorphous composition. Iron-rich carbonate siderite plots with a much steeper 440–700 nm ferric absorption slope, which is distinct from the rest of the samples within this plot.

Spectral parameter plot of 920–1000 nm slope vs. 440–700 nm slope for all hydrated mineral data from Table 1, showing the relationship between the two parameters depicted by the dashed linear trend line
Lastly, these four spectral parameters (Table 3) were used together to distinguish, with the use of discriminant analysis, between these samples, and to cluster the rock sample targets with unsupervised hierarchical cluster analysis. The discriminant analysis (Fig. 9a) demonstrated the ability of the three filter sets to distinguish between the samples. Filter set F2-12 provided by far the best discrimination between the groups, while the B2 filter set performed worst, with all three groups clustering close together. Likewise, for both B2 and F1-12 filter sets, Group 1 and Group 2 overlap, which demonstrates poor discrimination between the rock targets within these groups. Conversely, F2-12 filters clearly discriminated well between all three groups, which demonstrates the benefit of optimizing filter wavelengths to putative mineral targets.

Discriminant analysis
Overall, the filter testing on untreated, heterogeneous rock samples showed some variation between the filter sets in terms of the ability to detect potentially diagnostic spectral features and clearly discriminate between rock targets with the use of spectral parameter values. Of the three filter sets tested, both F1-12 and F2-12 performed better than the baseline B2 filters, with filter set F2-12 detecting the most spectral features (Table 5) and discriminating most clearly between rock samples (Fig. 9). For comparison, this filter set is given alongside the “Geology” filter wavelengths for other past and present Mars rovers/landers, including those for MER and those currently proposed for the Mars Science Laboratory (MSL; Table 6). In particular, the MSL Mastcam filter set has significantly fewer filters within the visible (<750 nm). Where this wavelength range is covered by eight filters by filter set F2-12, it is covered by only four filters in the Mastcam. More extensive testing on Mars analog samples that exhibit a significantly wider range of mineralogies would be the next step in identifying the value in specific wavelength selections or whether an entirely evenly spaced filter set would suffice. Indeed, such work not only has relevance to the ExoMars mission but also to other astrobiologically focused missions, such as MSL.
4. Discussion and Conclusions
This study was conducted with two aims: first, to produce and test alternative geological filter sets to replace the B2 filters currently assigned to ExoMars and, second, to present initial results from the testing of these possible filter sets on Mars analog rock samples. It is apparent that a concentration of filters toward the near-IR end of the spectrum, as with the B2 filter set, is not optimal for the ability of the PanCam to detect hydrated minerals as a component of heterogeneous rock samples. The first new filter set also explored—“F1-12”—has filters spaced at regular intervals every 50 nm. The benefit of this filter set is that the even spread of spectral points is not biased toward any particular group of minerals and so, theoretically, makes the PanCam equally suited to detecting any given mineral or lithology it encounters. However, while much is still unknown in regard to the lithology and mineralogy of the martian surface, ExoMars will be focused particularly on regions where hydrated minerals are likely to predominate. The aim of positioning these points so that they favor certain mineral groups is to enhance the detection of these specific minerals in keeping with the mission objectives. The effectiveness of this can be seen in Fig. 3.
The filter set that was generated statistically (F2-12) based on a set of seven different hydrated minerals proved most effective at identifying hydrated minerals in the Mars analog rocks, which suggests that this particular method of filter wavelength assignment is successful at selecting a suitable set of geological filters. As such, there is the potential to utilize this method with the use of a much wider set of mineral spectral data before the PanCam filter wavelengths are finalized. Our knowledge of the mineralogical diversity of the martian surface is increasing, and future PanCam geological filter selection and testing will need to incorporate a much wider range of minerals and analog samples. Another factor is the mineralogy of the selected ExoMars landing site (still to be finalized). The availability of CRISM and OMEGA data allows for the characterization of the bulk mineralogy of a potential landing site, and this could be used to heavily influence the ExoMars PanCam filter wavelengths. For example, if such orbital spectrometer data were to indicate extensive and rover-accessible clay-bearing geological units, the PanCam filters could potentially be more useful if optimized to detect phyllosilicate minerals only. Such focused target selection would benefit from potentially more diagnostic PanCam spectra but may significantly reduce the ability of the PanCam to undertake more opportunistic science and produce any subsequent unexpected discoveries.
The need to expand on spectral ground-truthing data sets was recently highlighted by Poulet et al. (2009). As with natural outcrops that are likely to be encountered on Mars, these rock samples display large- and small-scale heterogeneities, only some of which were clearly distinguished with PanCam-style 12-point spectra, as in sample NBO where the spectral data were clearly able to detect the “Orange” jarosite component within the surrounding basalt lava (Fig. 5a). Likewise, the lichens in sample KH were spectrally distinct from the surrounding silica crust. However, detecting heterogeneity was a problem with regard to the silica sinter samples—deposits that would have a particular astrobiological relevance. Opaline silica deposits have the potential to provide information on past life on Mars, especially if such deposits formed through hot spring sinter development—a process commonly seen in volcanically active regions on Earth. There is a possibility for the discovery of morphological, mineralogical, and chemical biosignatures within these precipitates (e.g., Goryniuk et al., 2004; Schulze-Makuch et al., 2007; Preston et al., 2008), but the reflectance spectra of the silica sinter samples from Geysir provide little evidence of their hot spring origin and, therefore, astrobiological potential. A similar example is provided by the small mineralogical variations within sample GY1, the spectra of which do not identify the presence of hematite or sulfur detected by Raman spectroscopy. Hematite has been previously documented to be an effective inorganic barrier to UV radiation (Clark, 1998) and has also been shown to be present at the martian surface by the MER Opportunity (Klingelhofer et al., 2004). Thus, hematite is one of the many minerals that could be detected around the ExoMars landing site.
In conclusion, much work still needs to be done with regard to choosing and testing an optimized geological filter set for the ExoMars PanCam instrument and providing essential ground-truthing with the use of Mars analog samples. Quantifying the limits of PanCam multispectral imaging in the remote detection of mineral targets is especially important, as is the effect of dust coverage on an already heterogeneous rock sample. Although the multispectral data acquired by the PanCam are fairly crude in comparison to those generated from other planetary instrumentation, the PanCam plays a crucial role in the selection of specific targets for more detailed investigation, and as such should be developed to its full potential.
Footnotes
Acknowledgments
This work was jointly funded by an EPSRC studentship award obtained through a UCL strategic, interdisciplinary research initiative, the UK Science and Technology Facilities Council (STFC), who are the lead funding agency for the development of the ExoMars Panoramic Camera, and the Leverhulme Trust. Claire Cousins would also like to thank James Davy for assistance with SEM/EDS analysis and Dr. Steve Firth for assistance with Raman analysis. Finally, we would especially like to thank Ed Cloutis and two anonymous reviewers for their comments and suggestions, which led to considerable improvements to the manuscript.
Abbreviations
B2, Beagle 2; BSE, back scatter electron; CRISM, Compact Reconnaissance Imaging Spectrometer for Mars; EDS, energy dispersive X-ray spectrometer; FWHM, full width at half maximum; JPL, Jet Propulsion Laboratory; MER, Mars Exploration Rover; MSL, Mars Science Laboratory; OMEGA, Observatoire pour la Minéralogie, l'Eau, les Glaces et l'Activité; PanCam, Panoramic Camera; RELAB, Reflectance Experiment Laboratory; SEM, scanning electron microscope; USGS, United States Geological Survey; XRD, X-ray diffraction.