
Abstract
This study investigates the effects of microgravity on colony growth and the morphological transition from single cells to short invasive filaments in the model eukaryotic organism Saccharomyces cerevisiae. Two-dimensional spreading of the yeast colonies grown on semi-solid agar medium was reduced under microgravity in the Σ1278b laboratory strain but not in the CMBSESA1 industrial strain. This was supported by the Σ1278b proteome map under microgravity conditions, which revealed upregulation of proteins linked to anaerobic conditions. The Σ1278b strain showed a reduced invasive growth in the center of the yeast colony. Bud scar distribution was slightly affected, with a switch toward more random budding. Together, microgravity conditions disturb spatially programmed budding patterns and generate strain-dependent growth differences in yeast colonies on semi-solid medium. Key Words: Microgravity—Saccharomyces cerevisiae—Adhesion—Invasive growth—Budding—Proteomics. Astrobiology 11, 45–55.
1. Introduction
Most microbial microgravity studies have focused on a single-cell level, both on semi-solid media and in liquid cultures under ideal laboratory conditions. In nature, yeasts frequently switch over between a unicellular and a more complex differentiated multicellullar lifestyle (Palková and Vachová, 2006; Granek and Magwene, 2010). The budding yeast Saccharomyces cerevisiae, for example, may adopt various multicellular structures such as complex colonies, flocs, filaments, mats, and biofilms (Verstrepen and Klis, 2006). In a process called flocculation, yeast flocs are formed, which consist of thousands of cells in a very dense organization and offer cells inside the floc protection from multiple stresses such as ethanol and antimicrobials (Smukalla et al., 2008). On agar surfaces, starvation for carbon sources causes a developmental switch in haploid cells that elongates the cell shape and changes polarization and budding from an axial to a unipolar orientation (Cullen and Sprague, 2000). Cells remain physically attached to each other, are delayed in G2/M period [i.e., the post-synthetic gap (G2) and mitosis (M) phases during the yeast cell cycle], and stick strongly to the agar (Kron et al., 1994), which allows them to form filaments that help to forage for nutrients by the invasion of agar medium. This process is called invasive growth (Roberts and Fink, 1994; Cullen and Sprague, 2000; Braus et al., 2003).
Adherence and invasion of a foreign substrate are the first indispensable steps for yeasts to colonizing host sites (Blankenship and Mitchell, 2006). In otherwise harmless S. cerevisiae cells, these mechanisms are gaining interest, considering the increasing numbers of reports of infections in immunocompromised patients (Goldstein and McCusker, 2001; Graf and Gavazzi, 2007). Two virulence traits similar to those identified in other pathogenic fungi were reported: the ability to grow at elevated temperatures and filament formation (McCusker et al., 1994a, 1994b). Candida albicans, a related fungus, is more frequently reported to be responsible for a range of infections, from those that are harmless, simple mucosal in nature to systemic infections with a high mortality rate (Gullo, 2009; Evans, 2010). The strong adhesion of C. albicans to surfaces such as on pacemakers and prosthetic heart valves or joints explains the high number of medical implant–related fungal infections (Kojic and Darouiche, 2004; Ramage et al., 2006). The yeast-to-filament transition further enhances tissue invasion of Candida cells and promotes survival and immune evasion (Hube, 2004; Kumamoto and Vinces, 2005). Both fungi rely on very similar cell surface proteins to initiate adherence, which are generally called adhesins (Dranginis et al., 2007; Klis et al., 2009). For S. cerevisiae, these lectin-like proteins are encoded by the FLO (“flocculation”) genes (Teunissen and Steensma, 1995; Van Mulders et al., 2009). One of these adhesins is Flo11p, which is required for filament formation and surface adhesion (Lambrechts et al., 1996; Lo and Dranginis, 1996; Reynolds and Fink, 2001). Another important adhesin is Flo1p, which strongly binds to mannan targets in the yeast cell wall and collects numerous cells into a macroscopic floc (Bony et al., 1997; Kobayashi et al., 1998). Depending on the yeast strain, these adhesins may fulfill different roles in these morphogenic events (Guo et al., 2000). Yeast strains were observed in which Flo11p was involved in flocculation or Flo1p in a strong adhesion to surfaces (Reynolds and Fink, 2001; Bayly et al., 2005; Douglas et al., 2007; Fichtner et al., 2007; Van Mulders et al., 2009).
In microgravity, the budding pattern of haploid and diploid S. cerevisiae cells grown in liquid culture medium was found to be disturbed, indicated by an increased proportion of randomly distributed bud scars (Walther et al., 1996; Johanson et al., 2007). A disturbed budding pattern, and gene expression changes related to budding, were also observed during experiments with simulated or low-shear modeled microgravity (LSMMG) (Purevdorj-Gage et al., 2006; Sheehan et al., 2007). Moreover, an increased tendency of cells to form aggregates containing five or more cells, together with a downregulation of cell separation genes (DSE1, DSE2, and EGT2), was noticed in simulated microgravity (Purevdorj-Gage et al., 2006). Changes in gene expression were found under microgravity conditions regarding the stress response element genes SSA4, YIL052C, and YST2 with transcription regulation involving Sfp1p and Msn4p (Coleman et al., 2008). Spaceflight also induces significant changes in cell wall thickness for different S. cerevisiae strains (Liu et al., 2008). Nevertheless, little is known about how microgravity affects adhesin-dependent multicellular organization and how this contributes to possible health implications for human spaceflight, for example, by the increased pathogenicity of microscopic organisms. Indeed, C. albicans cells were shown to be more intensely organized in filaments in simulated microgravity, which is consistent with enhanced pathogenicity (Altenburg et al., 2008).
In the framework of microbial safety during spaceflights, insights into the microbial multicellular organization level in microgravity should complement the current knowledge at a single-cell level. The tractable and harmless microorganism, S. cerevisiae, offers important advantages for microbial multicellular structure research in microgravity, such as its GRAS (Generally Recognized as Safe) classification and powerful genetic tools. In this study, a laboratory and an industrial S. cerevisiae strain, Σ1278b and CMBSESA1, were grown on a semi-solid culture medium during 12 days at the International Space Station (ISS). The haploid laboratory Σ1278b strain grows invasively and is defective in the induction of stress-responsive genes (Stanhill et al., 1999). The industrial CMBSESA1 strain, however, originates from a brewery environment in which cells are adapted to stress conditions, such as high osmotic and ethanol concentrations, and does not grow invasively. During this mission, the two-dimensional spreading of the colonies was monitored by image analysis. Postflight analysis included the assessment of invasive growth, bud scar distribution, and proteome changes compared to normal gravity ground controls.
2. Materials and Methods
2.1. Yeast strains and prelaunch culture conditions
Saccharomyces cerevisiae Σ1278b MATα leu2 was kindly obtained from the Laboratory of Molecular Cell Biology (Katholieke Universiteit Leuven). An industrial yeast strain (CMBSESA1) with an unknown genotype was kindly obtained from a Belgian brewery. Prelaunch preparation of the experiment, assembly, and safety control were performed within 24 h prior to launch in a laboratory at the launch site (Baikonur, Kazakhstan). Yeast cells were suspended in isotonic saline [0.9% (w v−1) NaCl] at a concentration of 1 × 10⁶ cells mL−1. Cells were inoculated in 4-fold onto the surface of 2.5 mL YPD agar [1% (w v−1) yeast extract, 2% (w v−1) peptone, 2% (w v−1) glucose, and 0.8% or 2% (w v−1) agar] in 12-well culture plates (CellStar, Greiner Bio-One, Belgium) with a sterile wooden rod. Two culture plates were sealed hermetically in one polycarbonate Biocontainer (PedeoTechniek, Oudenaarde, Belgium) and vacuum sealed in a highly transparent Minigrip polyethylene bag (60 μm thick). From that point on, the same procedures as for the BASE-A experiment were followed as described previously (Leys et al., 2009). Temperature and radiation were logged as described previously (Goossens et al., 2006; Vanhavere et al., 2008).
A control experiment, parallel to the flight experiment, was set up at the launch site and remained at approximately 22°C, because no real-time temperature data from the ISS was available. Therefore, a postflight ground experiment was set up in a programmable incubator with use of the logged temperature data (Fig. 1). The samples from this second ground experiment were used to compare directly with the spaceflight samples.
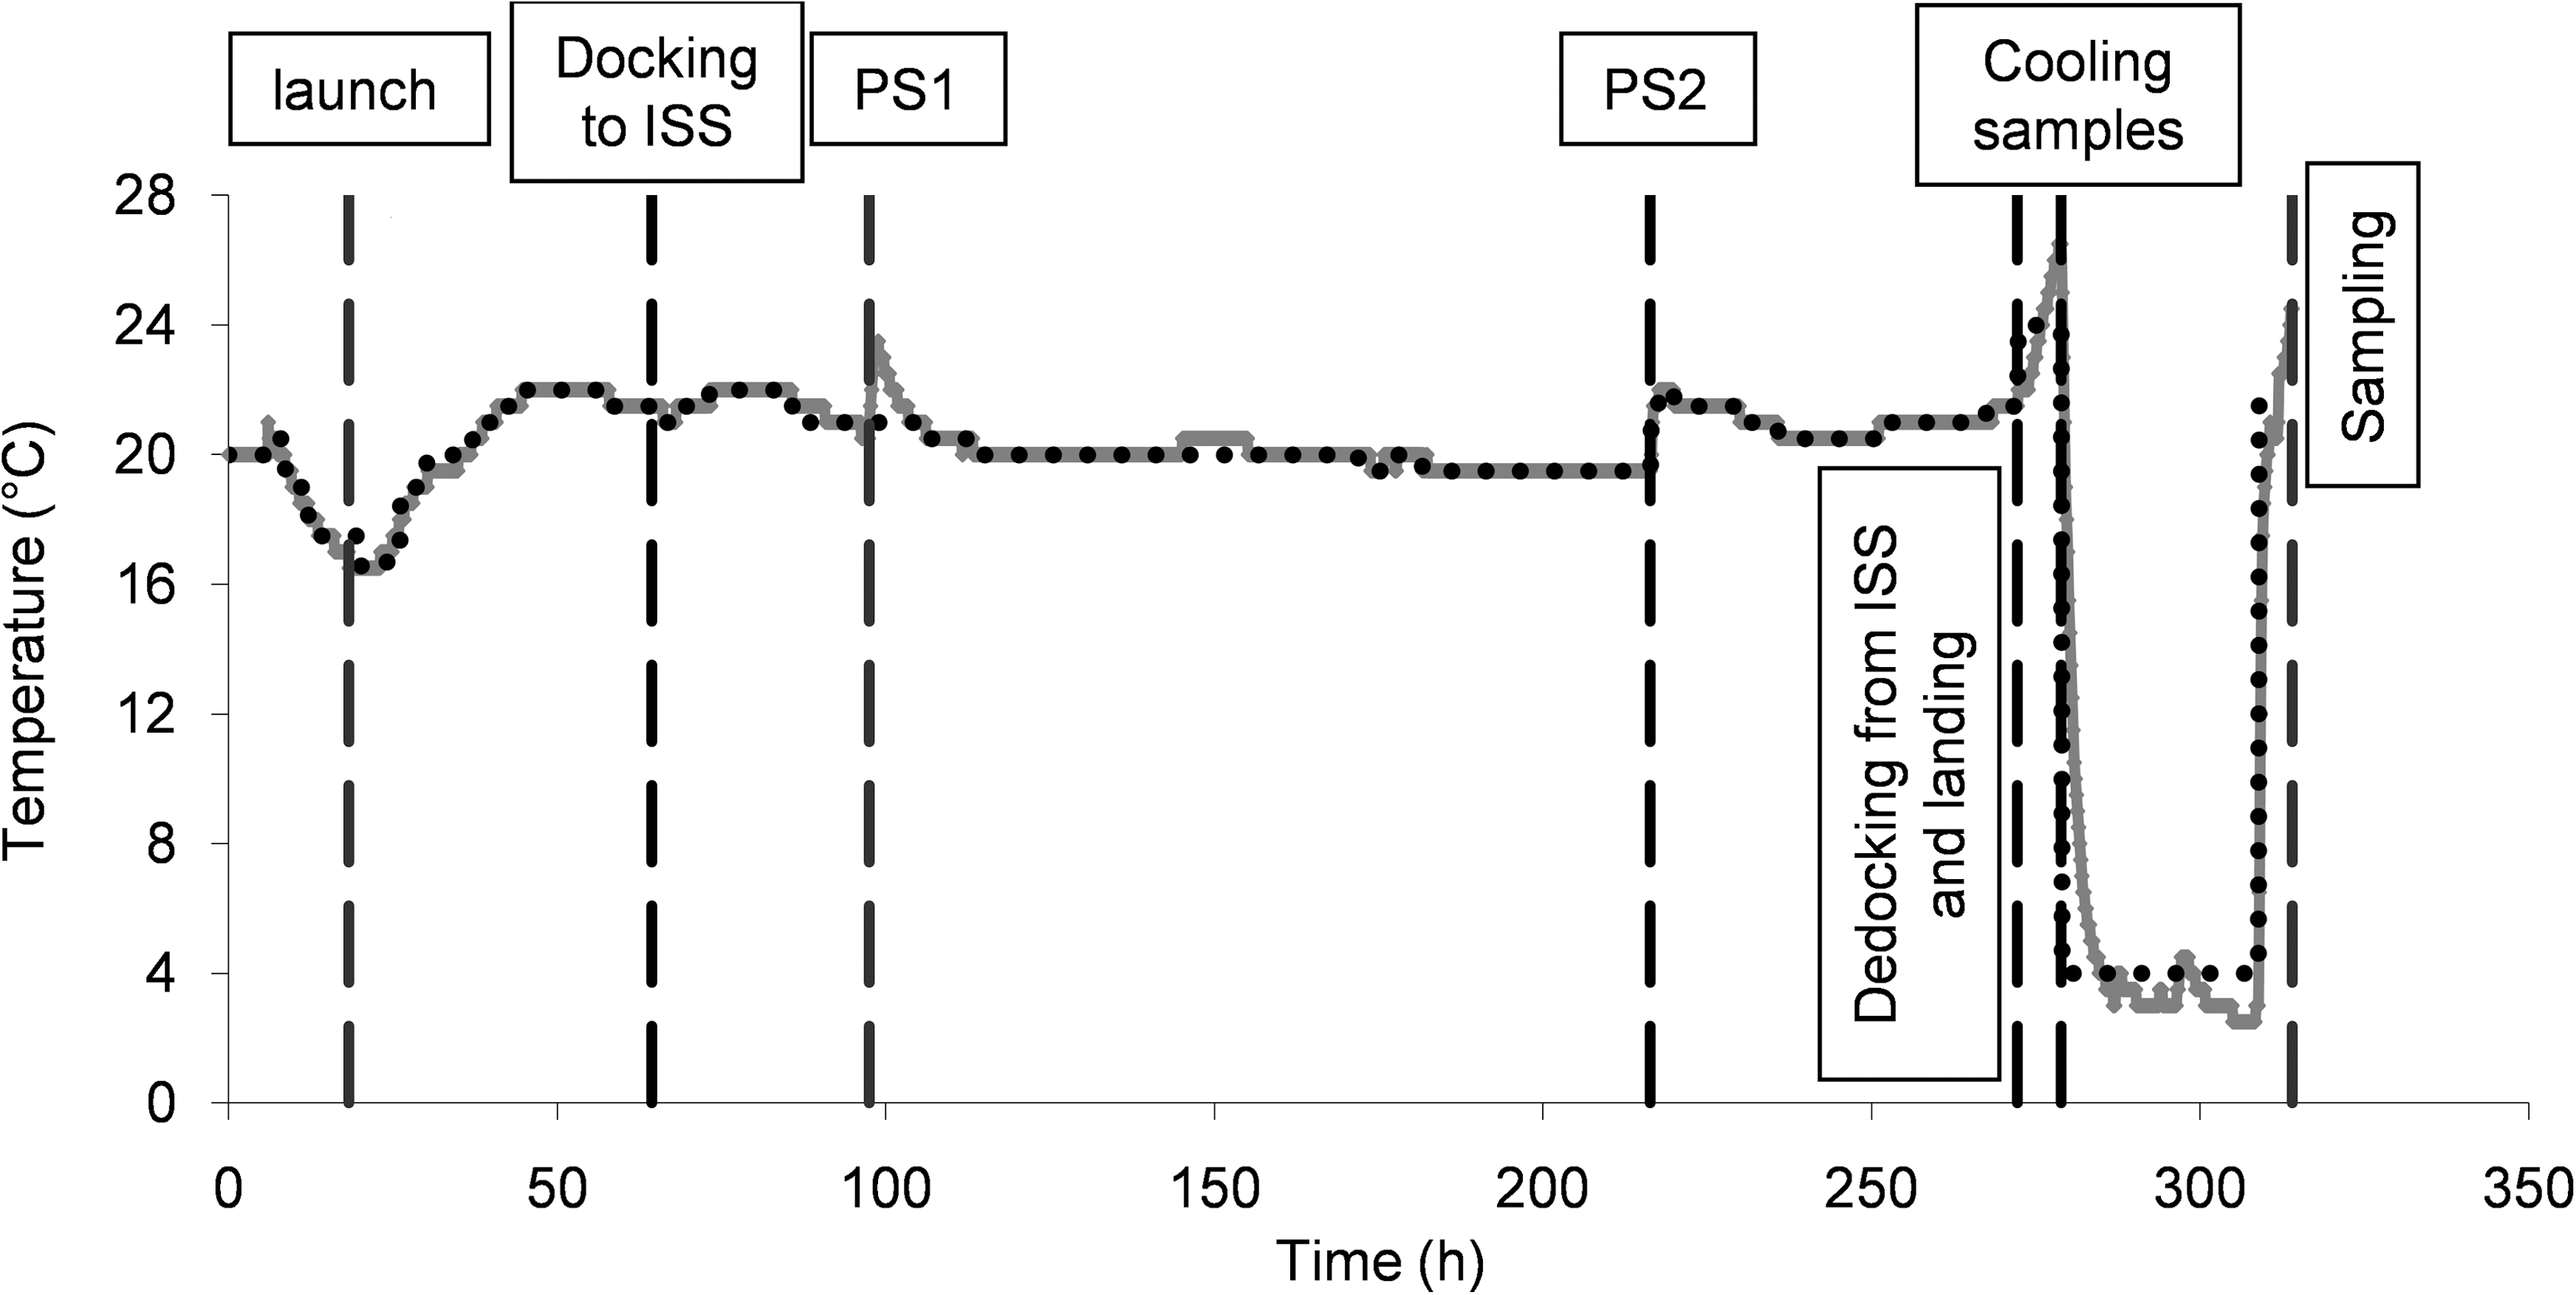
Time-temperature schedule of the microgravity experiment (full gray line) and the postflight ground experiment (black dotted line), in which the microgravity sample temperature at the ISS was simulated. At 0 h, the inoculation of the yeast samples on the agar plates took place. The first indicated time point at 18.3 h shows the launch time. The second time point is the docking from Soyuz TMA-9 to the ISS. The first and second photo sessions (PS1 and PS2) are indicated at 97.5 h and 216.3 h. Dedocking and landing were initiated at 272 h. Samples were cooled at 278 h, and sampling took place approximately at 314 h.
2.2. Microgravity conditions
During the two-day trip in the Soyuz TMA-9 vehicle to the ISS, the pouches were kept at 22 ± 1°C. The experimental packages were returned unopened from the ISS with the Soyuz TMA-8 vehicle after a total of 12 flight days. The experimental packages were transported at about 4°C in an active controlled thermal container without exposure to airport X-ray scanning from the landing area to the Katholieke Universiteit Leuven (Leuven, Belgium) within 40 h after landing. The analysis of the samples was started immediately.
2.3. In-flight analyses
Colony morphology was assessed by photographing the plates at two time points in orbit, after 97.5 h and 216.3 h (Fig. 1). For the ground reference experiments, photographs were taken every day. With ImageJ image analysis software (Abramoff et al., 2004), an estimation of the two-dimensional spreading was performed by measuring the surface area of the yeast colonies. To standardize each measurement, we used the well surface area as a reference. A linear radial growth model was used to fit the experimental data during the linear growth phase and to determine the radial growth rate constant Cr: S = Crt + S 0 (where S is the relative colony surface area at time t, and S 0 the surface area at an initial radius) (Pirt, 1967).
2.4. Invasive growth
Cells were collected from the agar surfaces with a sterile cell scraper, without damaging the agar surface. The amount of invasively growing cells in the agar are a measure for invasive growth (Roberts and Fink, 1994; Braus et al., 2003; Van Mulders et al., 2009); the cells were documented by photographing the agar with a Nikon SMZ800 stereomicroscope equipped with a DN100 camera.
2.5. Analysis of budding pattern
Cell samples were subdivided and used for microscopic analysis. Staining of bud scars was carried out according to the method described by Lord et al. (2002). Briefly, cells were fixed by formaldehyde (3.7%) and washed twice with water. Chitin, which is concentrated in the bud scars, was visualized after treating the cells with Calcofluor White (1 mg mL−1) (Sigma, Belgium) (Pringle, 1991). The cells were subsequently resuspended in 20 mM CaCl2 and 20 mM MnSO4 buffer solution. To immobilize the cells, the microscope slides were immersed in Concanavalin A (Sigma, Belgium)-PBS solution (0.1 mg mL−1 Con A) at room temperature for 15 min. Next, the slide was washed briefly with 95% ethanol and dried. A 5 μL volume of sample was mounted onto the slide, and the stained cells were observed by epifluorescence microscopy with a 100 × oil objective lens and DAPI filter cube or by confocal microscopy on a Nikon T2000-Eclipse C1 microscope equipped with a Violet Diode UV laser (408 nm). A UV filter cube with a 420 nm long-pass barrier filter was used in the PMT detector box of the confocal system. For each sample, at least 150 cells with three or more bud scars were analyzed. The percentage of axial, unipolar, and random budding was determined for each sample. The data presenting the budding patterns were calculated from three replicate samples.
2.6. Proteomics
2.6.1. Protein extraction
Yeast cells were harvested as described above and proteins extracted as follows: Yeast cells were washed with GTE buffer [50 mM Tris pH 7.4, 10% glycerol, 1 mM EDTA] and centrifuged (13,000 rpm, 20 min). After resuspension of the pellet in 500 μL lysis buffer [7 M urea, 2 M thiourea, 2% (w v−1) CHAPS, 1% (w v−1) DTT, 0.8% (v v−1) amopholites, protease inhibitor cocktail (Roche)], acid-washed glass beads [450–600 μm (Sigma)] were added, and cells were lysed by vortexing 5 times for 30 s and centrifuged (10,000g for 20 min). The supernatant containing the soluble proteins was desalted and concentrated by using 5K Vivaspin (Sartorius). Subsequently, the protein concentration was determined with the Bradford assay (Pierce Biotechnology, Thermo Scientific).
2.6.2. Differential proteomics using two-dimensional polyacrylamide gel electrophoresis (2D-PAGE)
During 10 h, 150 μg of protein was actively rehydrated (50 V) on 17 cm ReadyStrip IPG strips (immobilized pH gradient 3–10) (Biorad). Subsequently, isoelectric focusing was performed on the Protean IEF cell (Biorad). Parameters were set to 150 V (10 min), 150 V (2 h), 300 V (10 min), 300 V (1 h), 1 kV (2 h), 10 kV (1 h), 10 kV (30 kVh), 500 V (10 min), and 500 V.
Prior to sodium dodecyl sulfate polyacrylamide gel electrophoresis (SDS-PAGE), the IPG strips were equilibrated for 10 min with reducing buffer [6 M urea, 2% (w v−1) sodium dodecyl sulfate (SDS), 1% (w v−1) dithiotreitol], 10 min with alkylation buffer [6 M urea, 2% (w v−1) SDS, 5% (w v−1) iodoacetamide], and finally 5 min in the electrophoresis buffer [192 mM Glycine, 25 mM Tris, 0.1% (w v−1) SDS]. The equilibrated IPG strips were placed on top of 12% polyacryl amide gels and covered with 0.5% melted agarose containing a trace of bromophenolblue. A voltage of 200 V was applied to the gels until the bromophenolblue front migrated off the gels. Proteins were visualized with the fluorescent stain Krypton (Pierce Biotechnology, Thermo Scientific). Afterward, the gels were stained with colloidal Coomassie G250. The fluorescent-stained gel images were analyzed with Proteomweaver software (Biorad). Parameters for detection of differential proteins were set to a regulation factor of 2, a coefficient of variation lower than 60%, and a presence of the spot in 2 out of 3 gel replicas.
2.6.3. Protein identification
After detection of differential proteins, the spots were excised manually from the 2D-gel, and in-gel tryptic digestion was performed. First, the gel spots were washed twice with 50% acetonitrile (ACN)/200 mM NH4HCO3 for 20 min at 30°C. Subsequently, the spots were dried, a 1/50 dilution of 0.1 μg μL−1 trypsin (Promega) was added, and after 45 min on ice 50 mM NH4HCO3 was added until the spots were completely submerged. Digestion was performed by overnight incubation at 37°C. Extraction of the peptides from the gel pieces was achieved by adding twice 60% ACN/0.1% HCOOH to the gel spots. The final volume of extraction buffer was dried in a Speedvac, and finally the peptides were dissolved in 8 μL 0.1% HCOOH. Five-tenths microliter of peptide mixture was spotted on a stainless steel MALDI target plate and covered with 0.5 μL alpha-cyano-4-hydroxy cinnamic acid matrix (7 mg mL−1 in 50% ACN, 0.1% TFA, 1 mM ammonium citrate). Identification of the proteins was obtained by measuring the peptide mass fingerprint on a MALDI-TOF/TOF MS system (4700 Proteomics Analyzer, Applied Biosystems) in MS mode. On selected peptides, tandem mass spectrometry (MS/MS) was performed for verification of the sequence. The obtained spectra were searched against a S. cerevisiae database, downloaded from NCBI, with an “in-house” Mascot platform. The spectra were searched by using 100 ppm peptide mass and 0.5 Da MS/MS tolerance with carbamidomethylation (Cys) and oxidation (Met) as variable modification parameters. Proteins were positively identified when at least 2 MS/MS fragmentation spectra were significantly identified according the Mascot algorithm (Matrixscience, London, UK) or when the peptide sequence was manually interpreted.
3. Results
3.1. Yeast colony growth
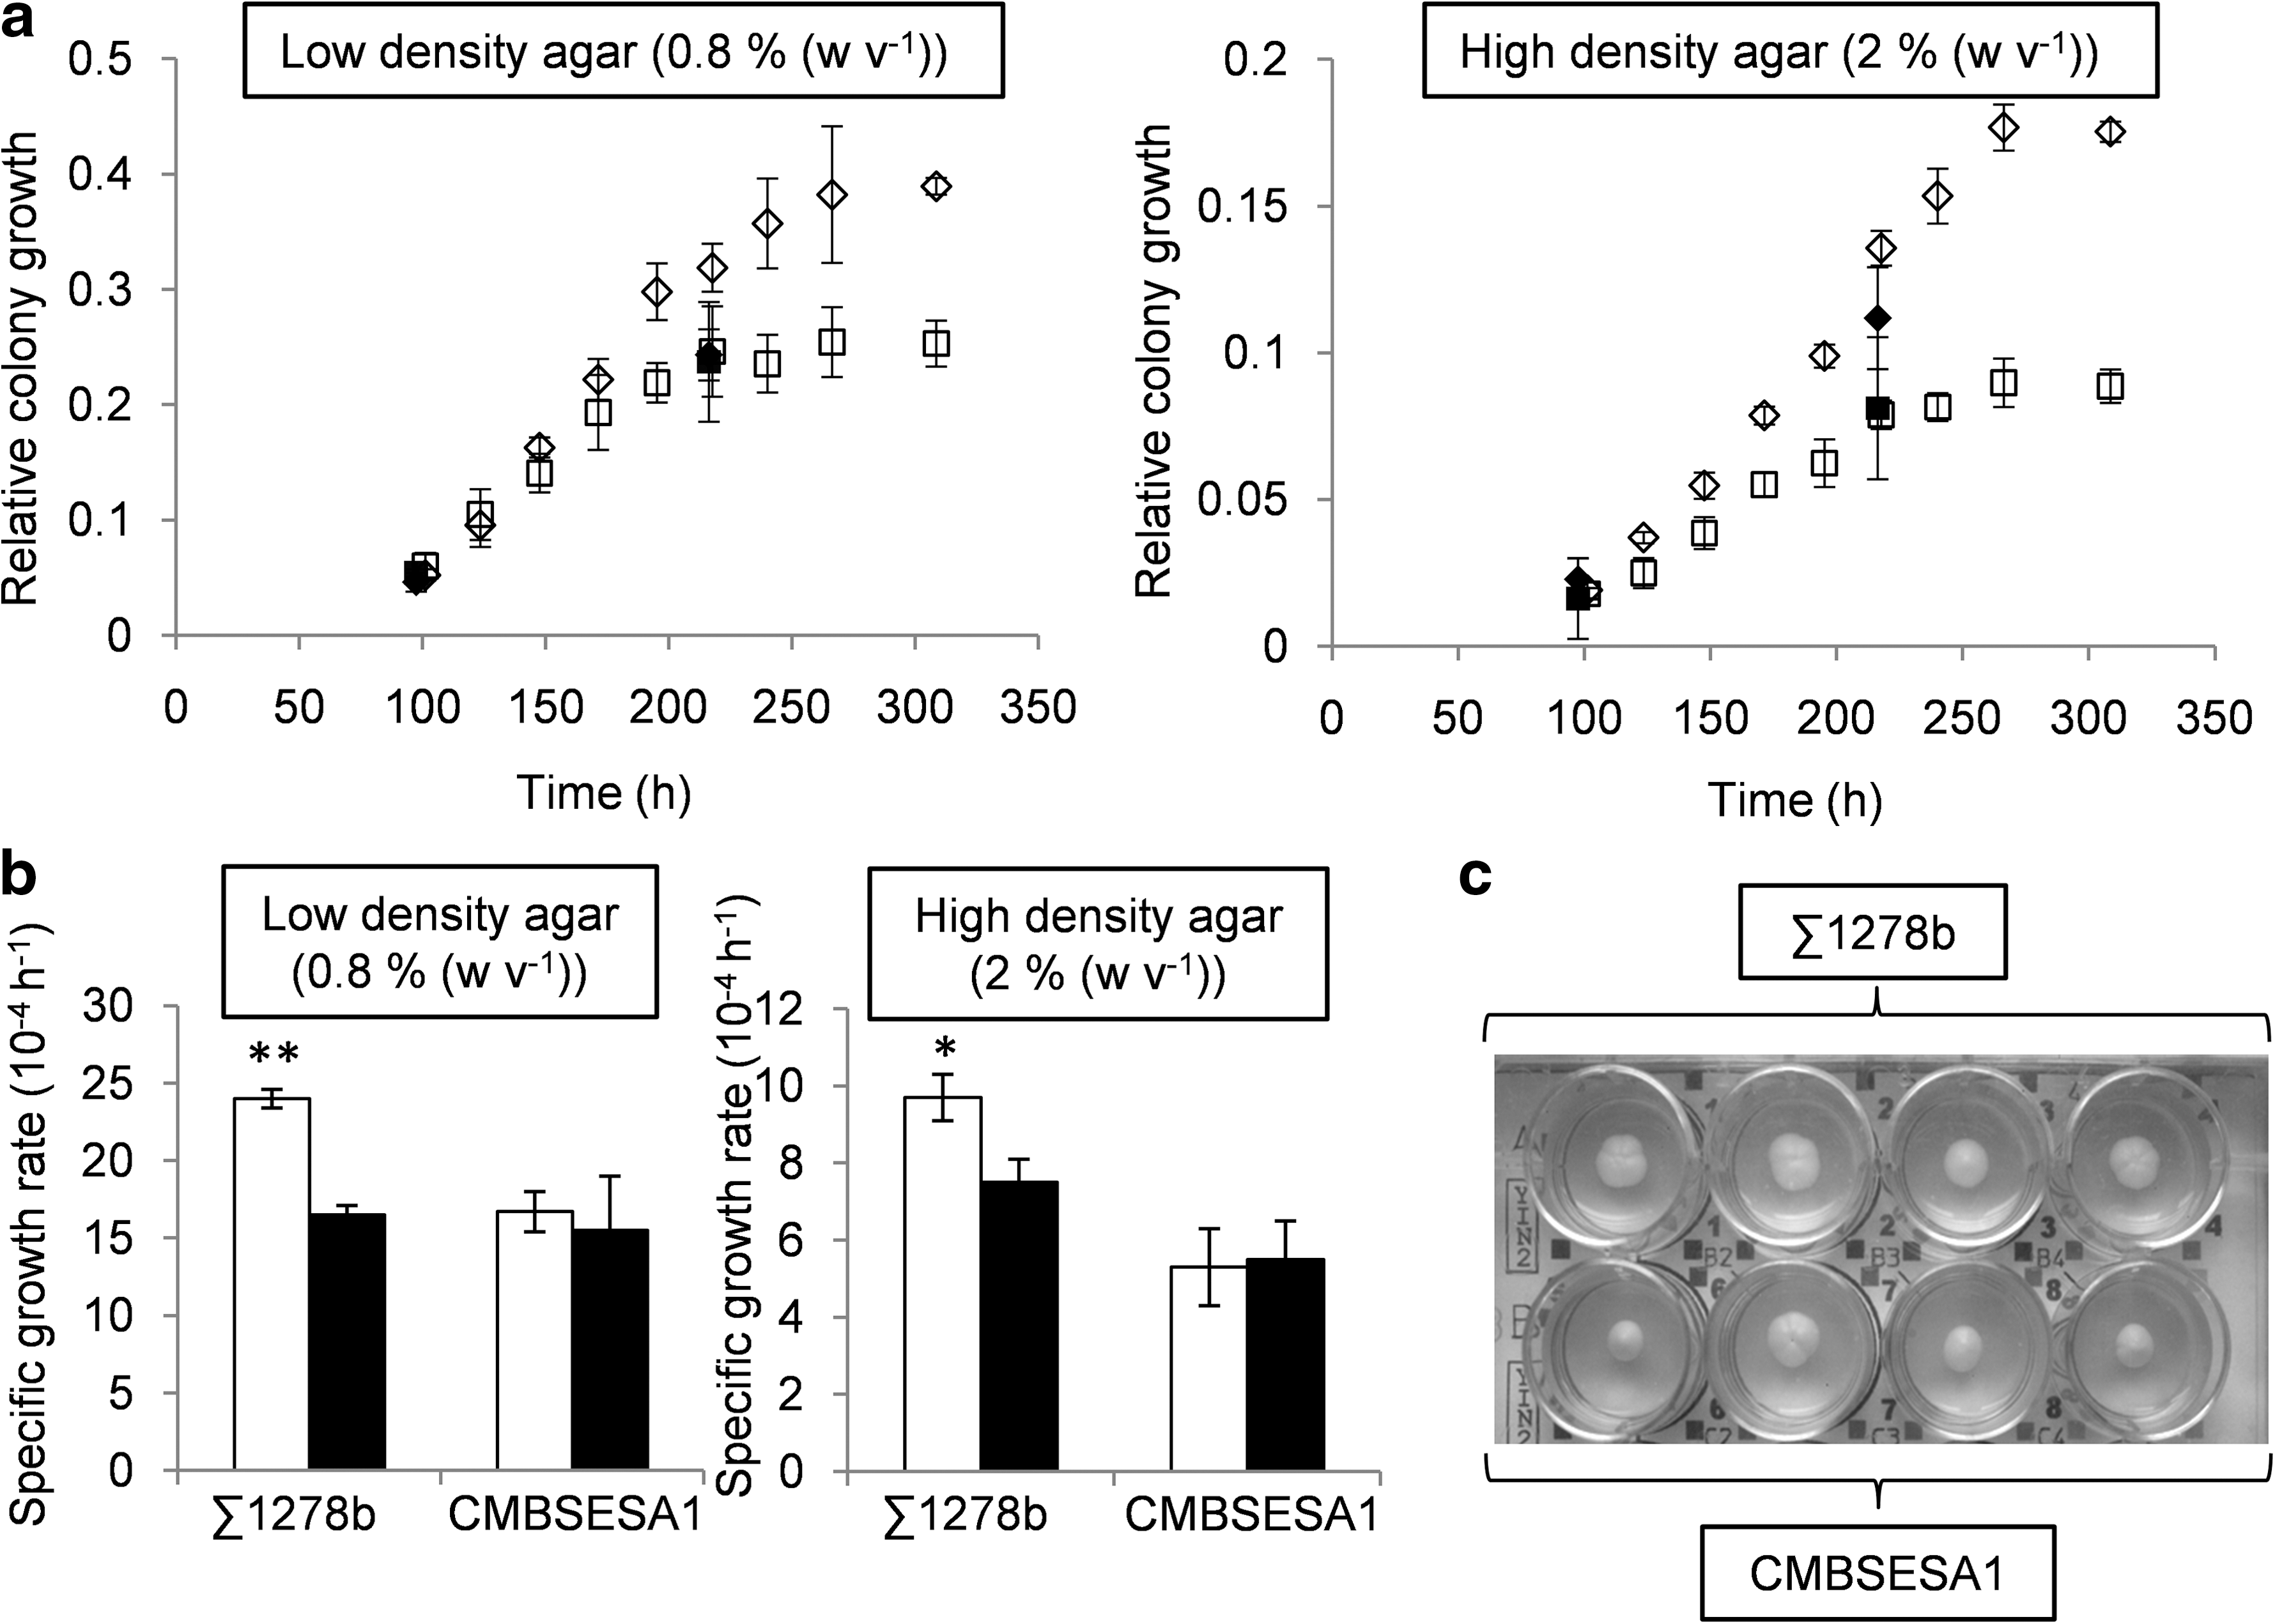
Yeast cells were grown on YPD agar plates during 300 h at an average temperature of 19.2°C (Fig. 1). Colony morphology was assessed by photographing the plates at two time points in orbit, after 97.5 h and 216.3 h (Fig. 2C). For the ground reference experiments, photographs were taken every day. Both the CMBSESA1 and Σ1278b yeast colonies covered a larger surface on 0.8% agar than 2% agar throughout the experiment (Fig. 2A), which is in accordance with previous studies in which low-density agar surfaces generate the most intensive colony spreading (Reynolds and Fink, 2001). The two-dimensional spreading of the CMBSESA1 colonies at two time points, 97.5 h and 216.3 h, and the relative colony growth rate in microgravity were comparable with the measurements in normal gravity on 2% and 0.8% agar (Fig. 2A, 2B). In contrast, the Σ1278b yeast strain had a significantly larger colony surface under normal gravity conditions than under microgravity conditions at both agar concentrations at 216.3 h (Fig. 2A). The differences in spreading were more pronounced on the lower density 0.8% agar. Moreover, the relative colony growth rate of the Σ1278b strain was significantly decreased under microgravity conditions at both agar concentrations (Fig. 2A). Total cell count in this experiment was not assessed because a significant portion of the cells were growing invasively into the agar.
(
3.2. Invasive growth
Postflight handling of the samples included the collection of yeast cells by scraping them off the agar plates. Afterward, the remaining cells in the agar were photographed to assess invasive growth (Fig. 3). Σ1278b strain showed more invasive growth on 2% agar than on 0.8% agar (data not shown). This is a Flo11p-associated phenotype, since no invasive growth was observed in a preliminary experiment when using a Σ1278b flo11Δ strain (results not shown). Interestingly, under microgravity, the Σ1278b samples showed reduced invasive growth in the middle of the colony on 2% agar. The industrial strain CMBSESA1 showed no invasive growth for any condition tested.
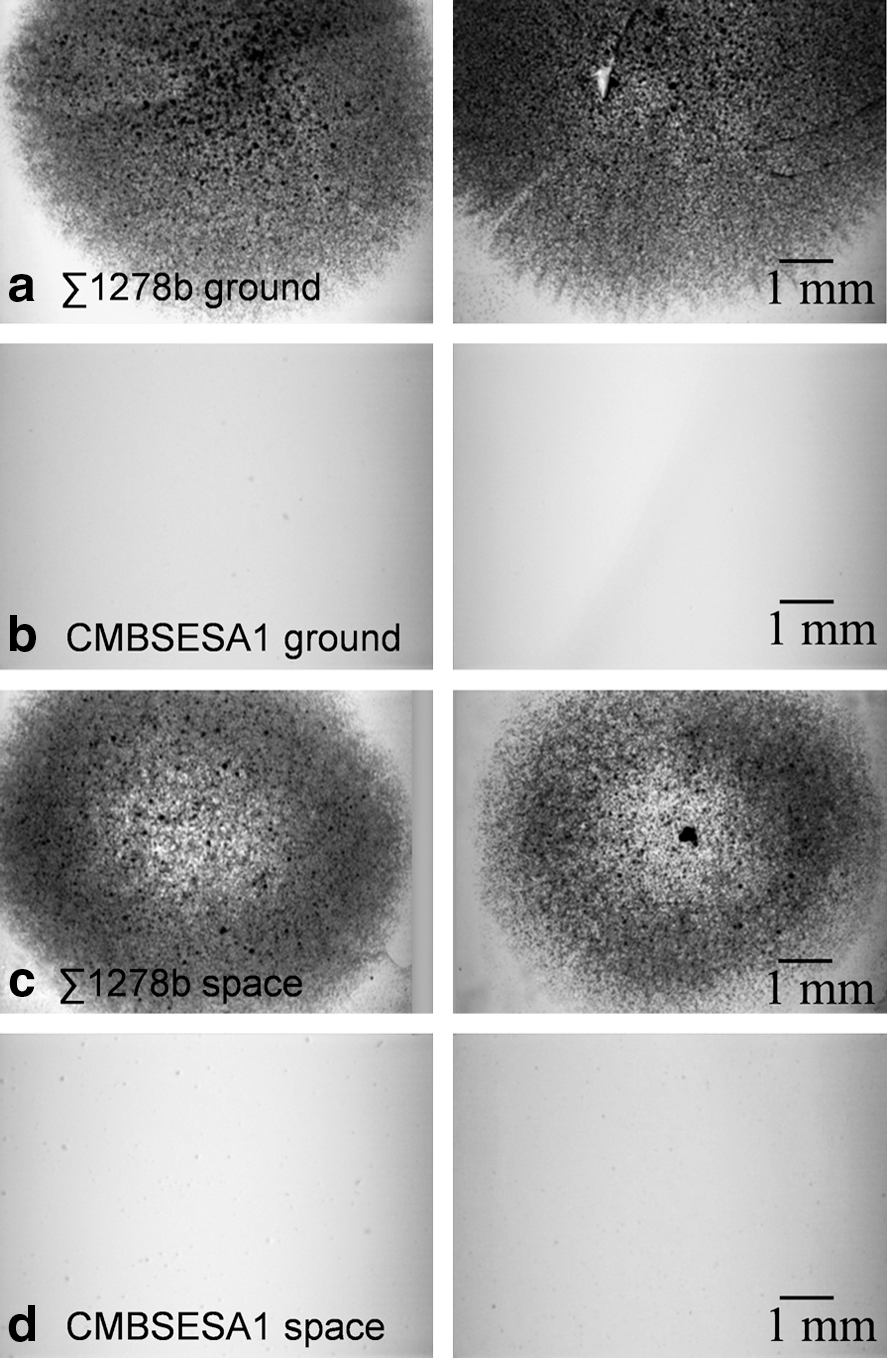
Invasive growth assessment. Photographs of the agar surface after removal of the yeast colony with a cell scraper. (
3.3. Yeast budding pattern
The influence of microgravity on the bud scar pattern of the Σ1278b strain and the industrial brewer's CMBSESA1 strain was examined. The bud scar patterns were classified into random, unipolar, and axial. Figure 4 shows the general distribution of bud scar patterns of (A) Σ1278b cells and (B) CMBSESA1 cells, grown on 2% YPD agar in normal gravity and microgravity. For Σ1278b, the majority of cells showed an axial budding pattern, which is expected for this haploid laboratory strain. A minor part showed a unipolar and random budding pattern. In microgravity, the percentage of random budding pattern was increased by 5.2% (±2.6%). The majority of the industrial brewer's strain cells showed a random budding pattern. In microgravity, the percentage of random budding pattern was increased by 6.0% (±3.3%).
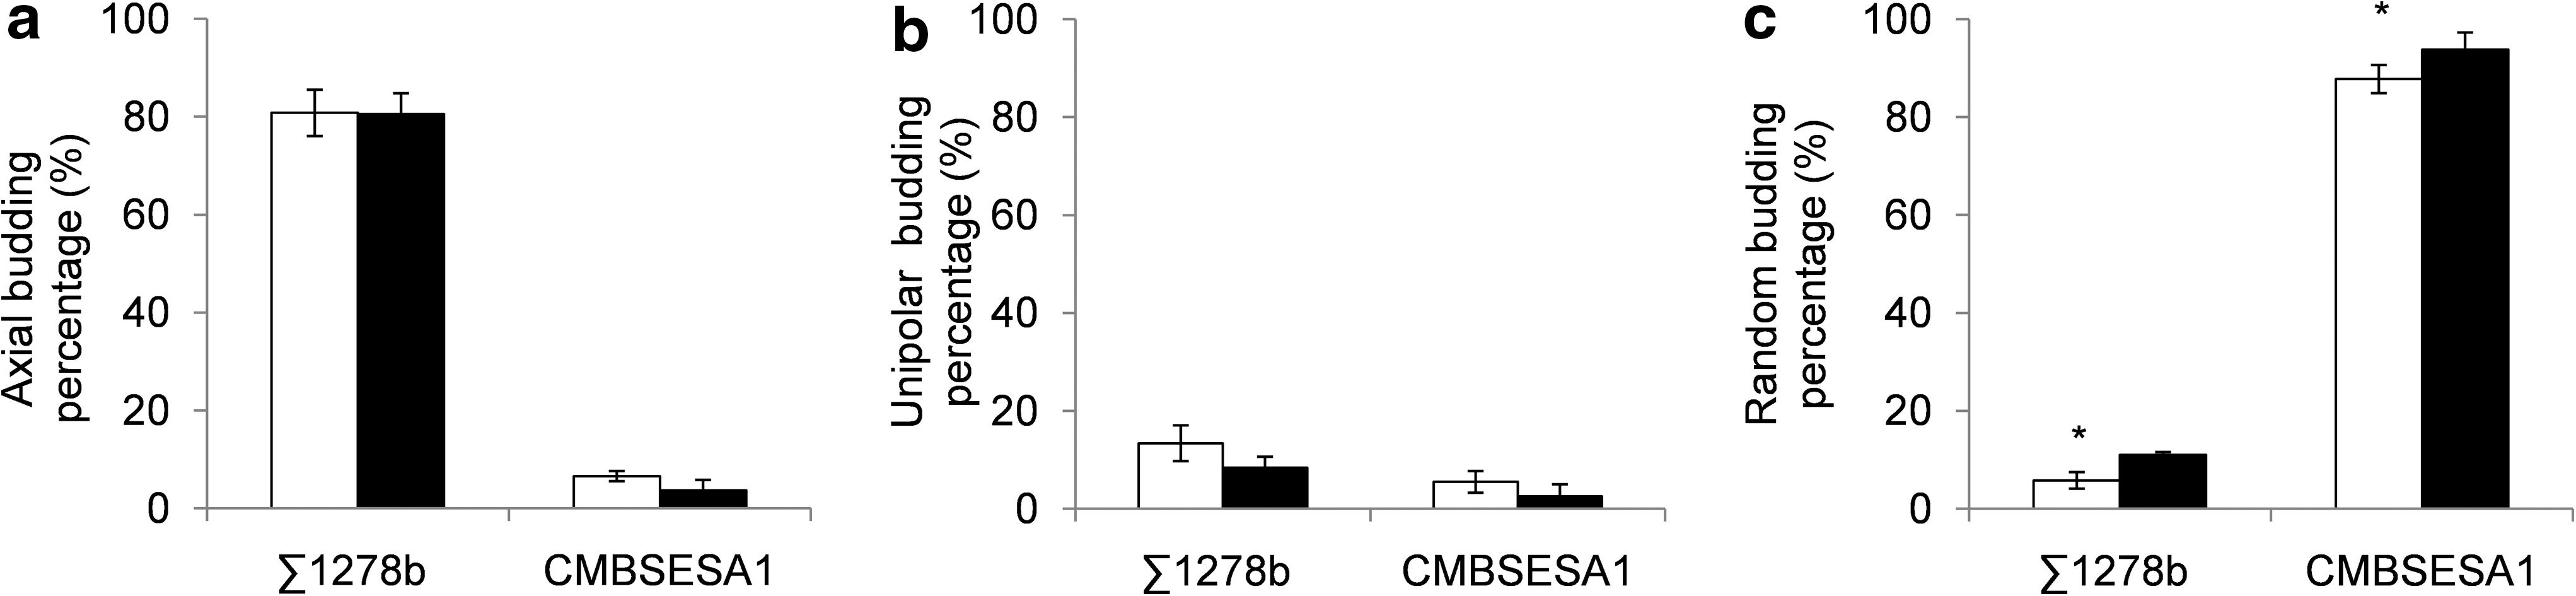
Bud scar pattern analysis of Σ1278b and CMBSESA1 grown on 2% YPD agar under normal gravity (white bars) and microgravity (black bars). Axial (
3.4. Proteomics
Soluble proteins were extracted from yeast colonies grown in normal gravity and microgravity, and subsequently separated with the 2D-PAGE technique as described above. Figure 5 shows an example of the 2D-PAGE maps of S. cerevisiae Σ1278b soluble proteins. In total, 1407 spots were matched over all the different gels. For quantitative analysis, 557 spots were selected, which were present in two out of the three gels of both control and microgravity proteome maps. With use of a filter with a maximum coefficient of variation of 60% and a regulation factor of 2, 32 spots were found to be upregulated in microgravity, and 37 spots were downregulated. An additional filter was set up, of which the focus was to filter out the spots present in either group and have a coefficient of variation of 60% or less. In the microgravity group, 45 such spots were found, and 38 spots were found in the control group. The mass spectrometric identification rate of proteins with an altered spot intensity was 65%; for the proteins present in either group the rate was 31%. This lower percentage of proteins present in one group could be explained by the fact that these protein spots in general have a lower intensity. An overview of all the identified proteins can be found in Table 1. Details on the protein identifications are provided in Supplementary Table S1 (Supplementary Data are available online at

2D-PAGE images of the complete proteome of the Σ1278b strain grown in (
All proteins were identified with at least two peptides in MS/MS fragmentation. When protein score is defined as N.A. no significant protein identification could be obtained, but protein identification criteria (see Materials and Methods) were met. Regulation factor is the fold change of protein under microgravity: when a protein was solely present in microgravity, it is depicted as present; when only present in normal gravity, it is depicted as absent.
It can be noted that on the proteome map of the microgravity-grown yeast samples (A), less proteins are visible in the high-mass range in comparison to the proteome map of normal gravity-grown colonies (Fig. 5). This could indicate increased protein degradation in microgravity. This was confirmed by the mass spectrometric analysis, which revealed a partial protein coverage by peptide map fingerprinting and by the fact that some protein spots are displayed in a pI/Mr range, which deviates from the theoretical values based on the protein sequence. These proteins are marked in Table 1 with an asterisk. Markedly, we found a spot that corresponds to ubiquitin in the microgravity samples that was absent in the control samples and indicates enhanced degradosome activity rather than a random protein degradation process.
The last column in Table 1 indicates the biological process in which the identified proteins are involved. It is clear that we mainly detected changes in abundance for proteins involved in energy metabolism and in stress response (oxidative stress proteins and chaperones). Indeed, of the 47 identified proteins, 25 were involved in energy metabolism and 11 in stress and protein folding.
4. Discussion
Under specific environmental conditions, the baker's yeast Saccharomyces cerevisiae can undergo a transition from its characteristic single cell growth form to short filaments that consist of elongated cells. In haploid cells, this process is called invasive growth and occurs on rich semi-solid media after glucose depletion (Cullen and Sprague, 2000; Prusty et al., 2004). Invasive growth is considered as a means for otherwise non-motile cells to forage for nutrients or to colonize hosts, for instance, plants or humans (Hube, 2004; Prusty et al., 2004; Kumamoto and Vinces, 2005). Such transitions may represent a considerable risk during spaceflight; therefore, the impact of microgravity conditions was assessed.
In this study, a highly invasive S. cerevisiae Σ1278b strain and a non-invasive industrial brewer's CMBSESA1 strain were grown as colonies on a semi-solid medium in normal gravity and microgravity in the ISS. First, a remarkable decrease in two-dimensional spreading for Σ1278b was observed under microgravity conditions, which was not observed for the industrial brewer's yeast. On the other hand, Johanson et al. (2007) remarked more pronounced growth of yeast cells stored in distilled water in microgravity compared to normal gravity. Liu et al. (2008) found faster growth rate, shorter lag phase periods, and higher final biomass in normal gravity, using yeast samples returned from spaceflight.
The discrepancy in this study suggests a strain-dependent microgravity response. A first hypothesis for the two-dimensional spreading differences between the two strains observed in this work is that the colony growth morphology is affected, resulting, for example, in a more-pronounced growth in the z direction under microgravity conditions, which was not measurable by photographing the plates. Analogously, under LSMMG conditions, it has also been demonstrated that Escherichia coli biofilms are thicker than those observed under normal gravity conditions (Lynch et al., 2006). A second hypothesis could be that cellular metabolism and cell growth were affected, for instance, because of stress or another disadvantageous or harmful microgravity response, with a smaller colony size as a result.
Two mechanisms for the first hypothesis are proposed. First, the absence of gravity could make it physically easier for the colony to grow in the z direction. Secondly, the Flo11 adhesin sketches characteristic complex colony morphology and mat patterns as well as colony size in S. cerevisiae (Reynolds and Fink, 2001; Reynolds et al., 2008; Granek and Magwene, 2010). It could be that the expression of the only FLO gene expressed in Σ1278b, FLO11, is altered under microgravity conditions, which resulted in a smaller colony size. Accordingly, the polyploid CMBSESA1 spreading may stay unaffected because higher ploidy correlates with lower FLO11 expression (Galitski et al., 1999; Reynolds and Fink, 2001; Granek and Magwene, 2010). Under microgravity, invasive growth, which is Flo11p-dependent, was reduced in the center of the Σ1278b colonies. Possibly, reduced FLO11 expression at the center of the colony decreased the likeliness of the cells to grow into the agar, which resulted in an enhanced colony growth in the z direction. On the other hand, a previous study showed that FLO11 expression was shown to be uniform at different positions in a yeast mat, a differentiated layer of cells on very low-density 0.3% agar (Reynolds et al., 2008).
There are also some indications for the second hypothesis. Σ1278b is characterized by a hyperactive cAMP/PKA pathway, which causes the strong agar-invasive growth but also the defectiveness of stress-responsive gene induction (Stanhill et al., 1999). Possibly, microgravity is a stress condition for yeast cells, and because of the absence of an appropriate stress response, this led to reduced growth in the Σ1278b strain. Indeed, global proteome changes were observed for the Σ1278b strain with a remarkable upregulation of proteins linked to anaerobiosis, which may be responsible for slower growth (cf. infra). Alternatively, the stress could be caused by the high total absorbed dose of ionizing radiation recorded during the flight experiment, which was about 70 times higher than that on Earth for the same period (Goossens et al., 2006; Vanhavere et al., 2008). CMBSESA1 is an industrial brewer's strain adapted to stress conditions and has a polyploid genome, which is correlated to an increased fitness and may result in an increased stress resistance (Sliwa et al., 2004).
There is a clear upregulation of key glycolytic enzymes glyceraldehyde-3-phosphate dehydrogenase, pyruvate kinase, and a subunit from pyruvate decarboxylase, while the tricarboxylic acid cycle and some oxidative phosphorylation enzymes are less abundant in microgravity conditions. We also observed a reduced production of gluconeogenic enzymes such as fructose 1,6 biphosphate aldolase, and of acetyl-CoA hydrolase in microgravity, which is proven to be involved in oxidative metabolism during propagation (Kobi et al., 2004). The shift to anaerobiosis is further supported by the observation that oxidative stress proteins such as superoxide dismutase and peroxiredoxin were downregulated. Our data provide a significant correspondence with previous proteomic analysis of anaerobic versus aerobically grown S. cerevisiae (Bruckmann et al., 2009). This also includes a reduced abundance of several heat shock proteins involved in protein folding or protein translocation into mitochondria, the mitochondrial outer membrane protein OM45. Remarkably, no gas exchange could occur as the culture plates were sealed hermetically in the hardware used for the normal gravity and microgravity samples.
Microgravity influenced the budding pattern of the yeast cells grown on a solid agar medium. An increase of randomly distributed bud scars in microgravity of 5.2% was found for the haploid Σ1278b cells and of 6.0% for the polyploid cells of the industrial brewer's strain. This increase is smaller than the ± 12% increase (Walther et al., 1996) or ± 11.7% (Purevdorj-Gage et al., 2006) observed previously with diploid cells grown in liquid culture under, respectively, microgravity and LSMMG conditions. This difference may be due to growth on semi-solid instead of liquid media or due to the different ploidy of the strains used in our study, which would lead to less susceptibility for disturbance in the budding pattern. Walther et al. (1996) hypothesized that this disturbance may possibly be the result of the influence of microgravity on the cytoskeleton, which would influence the position of the bud scars. Purevdorj-Gage et al. (2006), however, postulated that the altered random budding pattern in LSMMG conditions was probably not due to a change in the cytoskeleton organization but rather due to a changed expression of genes with an upstream role in budding processes, such as bud site selection and polarity establishment.
Only a few studies have focused on yeast growth under microgravity conditions (cf. supra). However, spaceflight has been shown to affect various bacterial growth parameters (Klaus, 2002; Nickerson et al., 2004; Horneck et al., 2010), including increased final cell numbers compared to normal gravity controls for non-motile microbes grown in liquid suspension cultures (Kacena et al., 1999; Benoit and Klaus, 2007; Rosenzweig et al., 2010), and shortened lag phases (Kacena and Todd, 1997; Klaus, 1998; Kacena et al., 1999). It is proposed that weightlessness allows the cells to remain evenly distributed in the liquid medium, which consequently alters the chemical makeup of their surrounding fluid and, indirectly, their physiological behavior (Benoit and Klaus, 2005). Microbial growth on semi-solid agar medium is not characterized by these specific liquid fluid mechanics effects and thus reduces the unknowns associated with spaceflight microorganism cultures in suspension (Kacena and Todd, 1997; Kacena et al., 1999; Benoit and Klaus, 2007). Oxygen and carbon dioxide transport modeling around S. cerevisiae colonies further revealed that the concentration gradients surrounding the colonies in normal and microgravity conditions are practically the same (results not shown). It thus appears that the two-dimensional spreading differences on semi-solid agar and the observed changes in physiology in this study can be indicated as a direct microgravity effect that may be sensed by yeast cells as a stress condition. Expression changes were previously observed in the stress response element genes SSA4, YIL052C, and YST2 with transcription regulation involving Sfp1p and Msn4p (Coleman et al., 2008). Altered stress resistance in liquid cultivation of E. coli and Salmonella typhimurium has also been described for simulated space conditions (Nickerson et al., 2000; Gao et al., 2001; Wilson et al., 2002, 2007).
In our future microgravity experiments, we will search for interesting insights for the elucidation of gravity-sensor mechanisms in yeast cells. The effect of microgravity conditions on S. cerevisiae liquid and on semi-solid agar cultivation will be investigated more deeply with a systems biology approach (transcriptomics, proteomics, and fluxomics). Therefore, yeast strains (BY4742 for liquid cultivation and Σ1278b for semi-solid agar cultivation) overexpressing one specific FLO gene will be grown in microgravity, as well as the BY4742 strain containing a functional Flo8p.
Footnotes
Acknowledgments
This work was supported by the Belgian Federal Science Policy Office, Danish Agency for Space and Technology, and the European Space Agency PRODEX program. Geert Toye is acknowledged for his help with setting up the microgravity experiment at Baikonur (Kazakhstan). Natalie Leys, Max Mergeay, and Annik Dams from SCK (Mol, Belgium) are acknowledged for their help during the experiment preflight preparation in Baikonur (Kazakhstan). The authors are grateful to all people involved in the preparation and performance of the microgravity experiment (ESA/ESTEC, EADS, DLR MUSC, BIOTESC).
Author Disclosure Statement
No competing financial interests exist.
Abbreviations
2D-PAGE, two-dimensional polyacrylamide gel electrophoresis; ACN, acetonitrile; IPG, immobilized pH gradient; ISS, International Space Station; LSMMG, low-shear modeled microgravity; MS/MS, tandem mass spectrometry; SDS, sodium dodecyl sulfate; SDS-PAGE, sodium dodecyl sulfate polyacrylamide gel electrophoresis.
References
Supplementary Material
Please find the following supplemental material available below.
For Open Access articles published under a Creative Commons License, all supplemental material carries the same license as the article it is associated with.
For non-Open Access articles published, all supplemental material carries a non-exclusive license, and permission requests for re-use of supplemental material or any part of supplemental material shall be sent directly to the copyright owner as specified in the copyright notice associated with the article.