
Abstract
The aim of this work was to analyze the possible alteration of thyrotropin (TSH) receptors in microgravity, which could explain the absence of thyroid cell proliferation in the space environment. Several forms of the TSH receptor are localized on the plasma membrane associated with caveolae and lipid rafts. The TSH regulates the fluidity of the cell membrane and the presence of its receptors in microdomains that are rich in sphingomyelin and cholesterol. TSH also stimulates cyclic adenosine monophosphate (cAMP) accumulation and cell proliferation. Reported here are the results of an experiment in which the FRTL-5 thyroid cell line was exposed to microgravity during the Texus-44 mission (launched February 7, 2008, from Kiruna, Sweden). When the parabolic flight brought the sounding rocket to an altitude of 264 km, the culture media were injected with or without TSH in the different samples, and weightlessness prevailed on board for 6 minutes and 19 seconds. Control experiments were performed, in parallel, in an onboard 1g centrifuge and on the ground in Kiruna laboratory. Cell morphology and function were analyzed. Results show that in microgravity conditions the cells do not respond to TSH treatment and present an irregular shape with condensed chromatin, a modification of the cell membrane with shedding of the TSH receptor in the culture medium, and an increase of sphingomyelin-synthase and Bax proteins. It is possible that real microgravity induces a rearrangement of specific sections of the cell membrane, which act as platforms for molecular receptors, thus influencing thyroid cell function in astronauts during space missions. Key Words: Cell membrane—Cholesterol—Microgravity—Sphingomyelin—Thyroid. Astrobiology 11, 57–64.
1. Introduction
In the last ten years, extensive research on biological membranes has led to the modification of the Singer-Nicolson fluid-mosaic model and has indicated that certain classes of lipids and proteins are not randomly distributed over the membrane but form distinct microdomains (Lichtenberg et al., 2005). These microdomains are distinguished in lipid rafts, domains rich in CHO and sphingomyelin (SM), and in caveolae, a subset of lipid rafts enriched in caveolin protein (Barnett-Norris et al., 2005). The microdomains were thought to act as platforms for specific proteins (Edidin, 2003) and to be involved in cell signaling (Simons and Toomre, 2000). Noticeably among membrane proteins, the G protein coupled receptors are compartmentalized in caveolae and rafts (Patel et al., 2008), and the receptor protein for TSH (TSHR) is a G protein–coupled receptor (Graves et al., 1996). Costa et al. (2004) described an apical localization of caveolae and caveolin in normal thyroid cells. The authors indicated that caveolae do not contain the TSHRs but are present in the basolateral membrane rich in lipid rafts (Costa et al., 2004). In contrast, Latif et al. (2007) demonstrated that monomeric and multimeric TSHRs are present in the cell surface, either in no-raft or in raft fractions, and that the multimerization is actually regulated within the lipid rafts. In addition, the raft-TSHR complexes are regulated by TSH (Latif et al., 2003). After TSH exposure with consequent signal transduction initiation and cell activation, the raft-TSHR complexes disappear from the cell surface, probably because TSH stimulates the formation of monomers, which allows the monomers' rapid exit (Latif et al., 2003).
It has been demonstrated that plasma membranes derived from rat thyroid tumors are unresponsive to TSH because of the deficit of gangliosides related to TSHR (Fishman et al., 1976). In addition, hyperfunctioning TSHR mutants characterize differentiated thyroid cancers in contrast to undifferentiated cancers that often lead to silent TSHR (García-Jiménez and Santisteban, 2007). Therefore, the normal structure and the basal activity of TSHR are very important for the correct thyroid cell proliferation.
In a study of cultures of human lymphocytes exposed to the mitogen concanavalin A in microgravity conditions, Cogoli et al. (1984) observed that cell proliferation can be inhibited during spaceflight. It is known that FRTL-5 cells, normally induced to proliferate in the presence of TSH (Ambesi-Impiombato et al., 1980), accumulate in G0/G1 cell cycle phase after TSH starvation (Degrassi et al., 1988). To date, no indication has been given on the possible alteration of TSHRs in microgravity, which could explain the modified response to the TSH treatment of thyroid cells in space.
The aim of this study was to investigate changes to the cell membrane, TSHR, and cyclic adenosine monophosphate (cAMP) production in response to TSH treatment in real microgravity conditions. Results of this study could explain the absence of cell proliferation in space.
We recently observed that FTRL-5 cells cultured in the presence or absence of TSH in the International Space Station during the Eneide and Esperia missions presented a similar cell growth pattern, which indicates an absence of response to TSH in space (Albi et al., 2010). It is difficult to establish whether the modification that occurs in space is due to cosmic radiation or microgravity.
2. Materials and Methods
2.1. Reagents
Sphingomyelin, cholesterol, polyclonal anti-protein kinase C zeta (anti-PKCζ) antibody were obtained from Sigma Chemical Co. (St. Louis, Missouri, USA); polyclonal anti-Bax, anti–signal transducer and activator of transcription-3 (anti-STAT3), anti-sphingomyelinase (anti-SMase), anti–sphingomyelin synthase 1 (anti-SM-synthase 1), anti-peroxisome proliferator-activated receptor gamma (anti-PPARγ), anti-TSHR, anti-caveolin 1, and anti-actin were obtained from Santa Cruz Biotechnology, Inc. (California, USA); thin-layer chromatography (TLC) plates (silica Gel G60) were from Merck (Darmstadt, Germany); cyclic AMP EIA kit was from Cayman Chemical Company (Ann Arbor, Michigan, USA).
2.2. Cell cultures
FRTL-5 cells were prepared and characterized in the Ambesi-Impiombato laboratory as previously reported (Ambesi-Impiombato et al., 1980). Cells were grown in Coon's modified Ham F-12 medium added with 5% calf serum and six hormones: 10 ng/mL glycil-L-histidyl-L-lysine acetate (Sigma), 10−8 M hydrocortisone (Sigma), 10 μg/mL insulin (Sigma), 10 μg/mL somatostatin (Sigma), 5 μg/mL transferrin (Sigma), and 10 mU/mL TSH (Sigma). FRTL-5 cells were maintained at 37°C in 5% of CO2, 95% humidity incubator. The cells cultured in the presence of TSH (TSH+) were stimulated to proliferate, whereas those cultured without TSH (TSH−) remained in a quiescent state (Ambesi-Impiombato et al., 1980).
2.3. Texus-44 mission
The Texus-44 was launched on February 7, 2008, at 11:30 (UT) from Kiruna, in northern Sweden. The parabolic flight brought the sounding rocket to an altitude of 264 km. For the Texus-44 mission, the FRTL-5 cells were seeded at a density of 1 × 10⁶ cells/1.0 cm2 chamber; each one of the latter were placed inside 27 spaceflight-approved incubator boxes suitable for cultivation, where the temperature was set at 37°C. The cells were cultured in the medium described above but without TSH. After one day, the media were changed with the addition of 0.5% calf serum. The TSH starvation was continued for 11 days before the launch.
The experiment involved three sets of samples: nine samples were prepared to be maintained in microgravity conditions, whereas, as controls, two groups of samples were prepared in normal gravity conditions; nine samples were maintained at 1g in an onboard centrifuge; nine samples were maintained on the ground in the Kiruna laboratory.
The effect of the microgravity was evaluated by comparing unstimulated cells with TSH stimulated cells. Out of the nine samples in each condition, three were immediately fixed with absolute ethanol before the launch and were used as microscopy controls. Then, when weightlessness was reached, three samples were injected with medium that contained TSH and three with medium without TSH. After 6 minutes and 19 seconds, at the end of the microgravity period, the culture medium was recovered from each sample, and the cells were fixed with absolute ethanol. The fixative was recovered upon reentry from space and centrifuged at 3000g for 20 min. For this experiment, the chambers containing the cells were linked to a distributor equipped with a system of syringes in parallel (a syringe containing TSH, another containing culture medium, and a third containing fixation material). The control of the activation of the syringes, depending on different events (before launch, start of microgravity, and end of microgravity) was performed by a computer-controlled pneumatic activation system. The effect of microgravity was studied in the culture media, to analyze its lipid modification and the possible presence of TSHR; the fixed cells, to analyze their nuclear morphology; the supernatants obtained after centrifugation, to measure the cAMP levels; the pellets obtained after centrifugation, to perform protein and immunoblotting analyses.
2.4. Nuclear morphology
The TSH+ and TSH− fixed cells were stained with propidium iodide to reveal nuclear morphology according to Yeh et al. (1981) The cells were examined under a fluorescence microscope (OLYMPUS IX 51) equipped with an OLYMPUS DP 50 camera system and analyzed at 20 × magnification.
2.5. cAMP assay
The cAMP was assayed by using Cayman's cAMP assay kit, a competitive enzyme immunoassay that uses the standard curve range of 0.08–10 pmol/mL as reference.
2.6. Biochemical analysis
Proteins and lipids were analyzed as previously reported (Albi and Magni, 2002). Lipids were extracted with 20 volumes of chloroform/methanol (2:1 v/v) for 2 hours, and the organic phase was washed with 0.2 volumes of 0.5% NaCl. The CHO was separated on TLC plates by using hexane/diethyl ether/formic acid, 80:20:2 by volume, as solvent (Christie, 1973). The spot of CHO was localized by iodine vapor by using the standards as reference, and its quantification was made according to Rudel and Morris (1973). SM was separated on TLC plates by using chloroform/methanol/ammonia, 65:25:4, as solvent. The spot of SM was localized by iodine vapor by using the standards as reference and was evaluated by measuring the inorganic phosphorus. Protein content was determined with folin phenol reagent (Lowry et al., 1951).
2.7. Western blot analysis
About 30 μg of culture medium proteins, precipitated with acetonitrile containing 0.1% trifluoroacetic acid (Jansson et al., 2009) or pellet proteins were submitted to SDS-PAGE electrophoresis in 10% polyacrylamide slab gel for STAT3, PKCζ, PPARγ, TSHR, SM-synthase 1, SMase and 12% slab gel for caveolin-1 and Bax detection. Electrophoresis image analysis was performed on gels stained with Coomassie blue. Proteins were transferred into nitrocellulose for 90 min as previously described (Cascianelli et al., 2008). The membranes were blocked for 30 min with 0.5% nonfat dry milk in phosphate-buffered saline, pH 7.5, and incubated overnight at 4°C with the specific antibody. The blots were treated with horseradish-conjugated secondary antibodies for 90 min. Visualization was performed with the enhanced chemiluminescence kit from Amersham (Rainham, Essex, UK). The first immunoblot of proteins was re-probed after stripping four times for STAT3, TSHR, Smase, and actin detection (Fig. 3a); the second immunoblot was re-probed four times for PKCζ, PPARγ, SM-synthase 1, and actin detection (Fig. 3b); the third immunoblot was re-probed three times for caveolin-1, Bax, and actin detection (Fig. 3c); and the fourth immunoblot was re-probed two times for TSHR and SMase detection (Fig. 4). The apparent molecular weight of the proteins was calculated according to the migration of molecular size standards. The area density of the bands was evaluated by densitometry scanning and analyzed with Scion Image.
2.8. Statistical analysis
Means ± standard deviation (SD) are given. The significance of the differences between the data was checked by analysis of variance.
3. Results
3.1. Effect of microgravity on FRTL-5 cell morphology
During the Texus-44 mission, the FTRL-5 cells were cultured in chambers linked to a distributor equipped with syringes and a computer-controlled pneumatic activation system, as reported in the Materials and Methods section, and were maintained for 6 min and 19 s in microgravity conditions. As controls, we used the same cells cultured in the same chambers linked to the same instrumentation and maintained in (a) an onboard centrifuge at 1g, simulating in this way Earth's gravity; (b) a laboratory in Kiruna.
The cells were fixed in absolute ethanol, which ensures the maintenance of cell shape and preserves chromatin condensation (Poulin et al., 1994). After 6 min and 19 s, the cells maintained in microgravity appeared as multicellular aggregates and irregular spheroids. No detached cells were present in both microgravity and control samples. The cells stained by propidium iodide revealed nuclei that exhibited chromatin condensation and precipitation either in TSH− or in TSH+ cells (Fig. 1). The control samples did not exhibit morphological alterations.
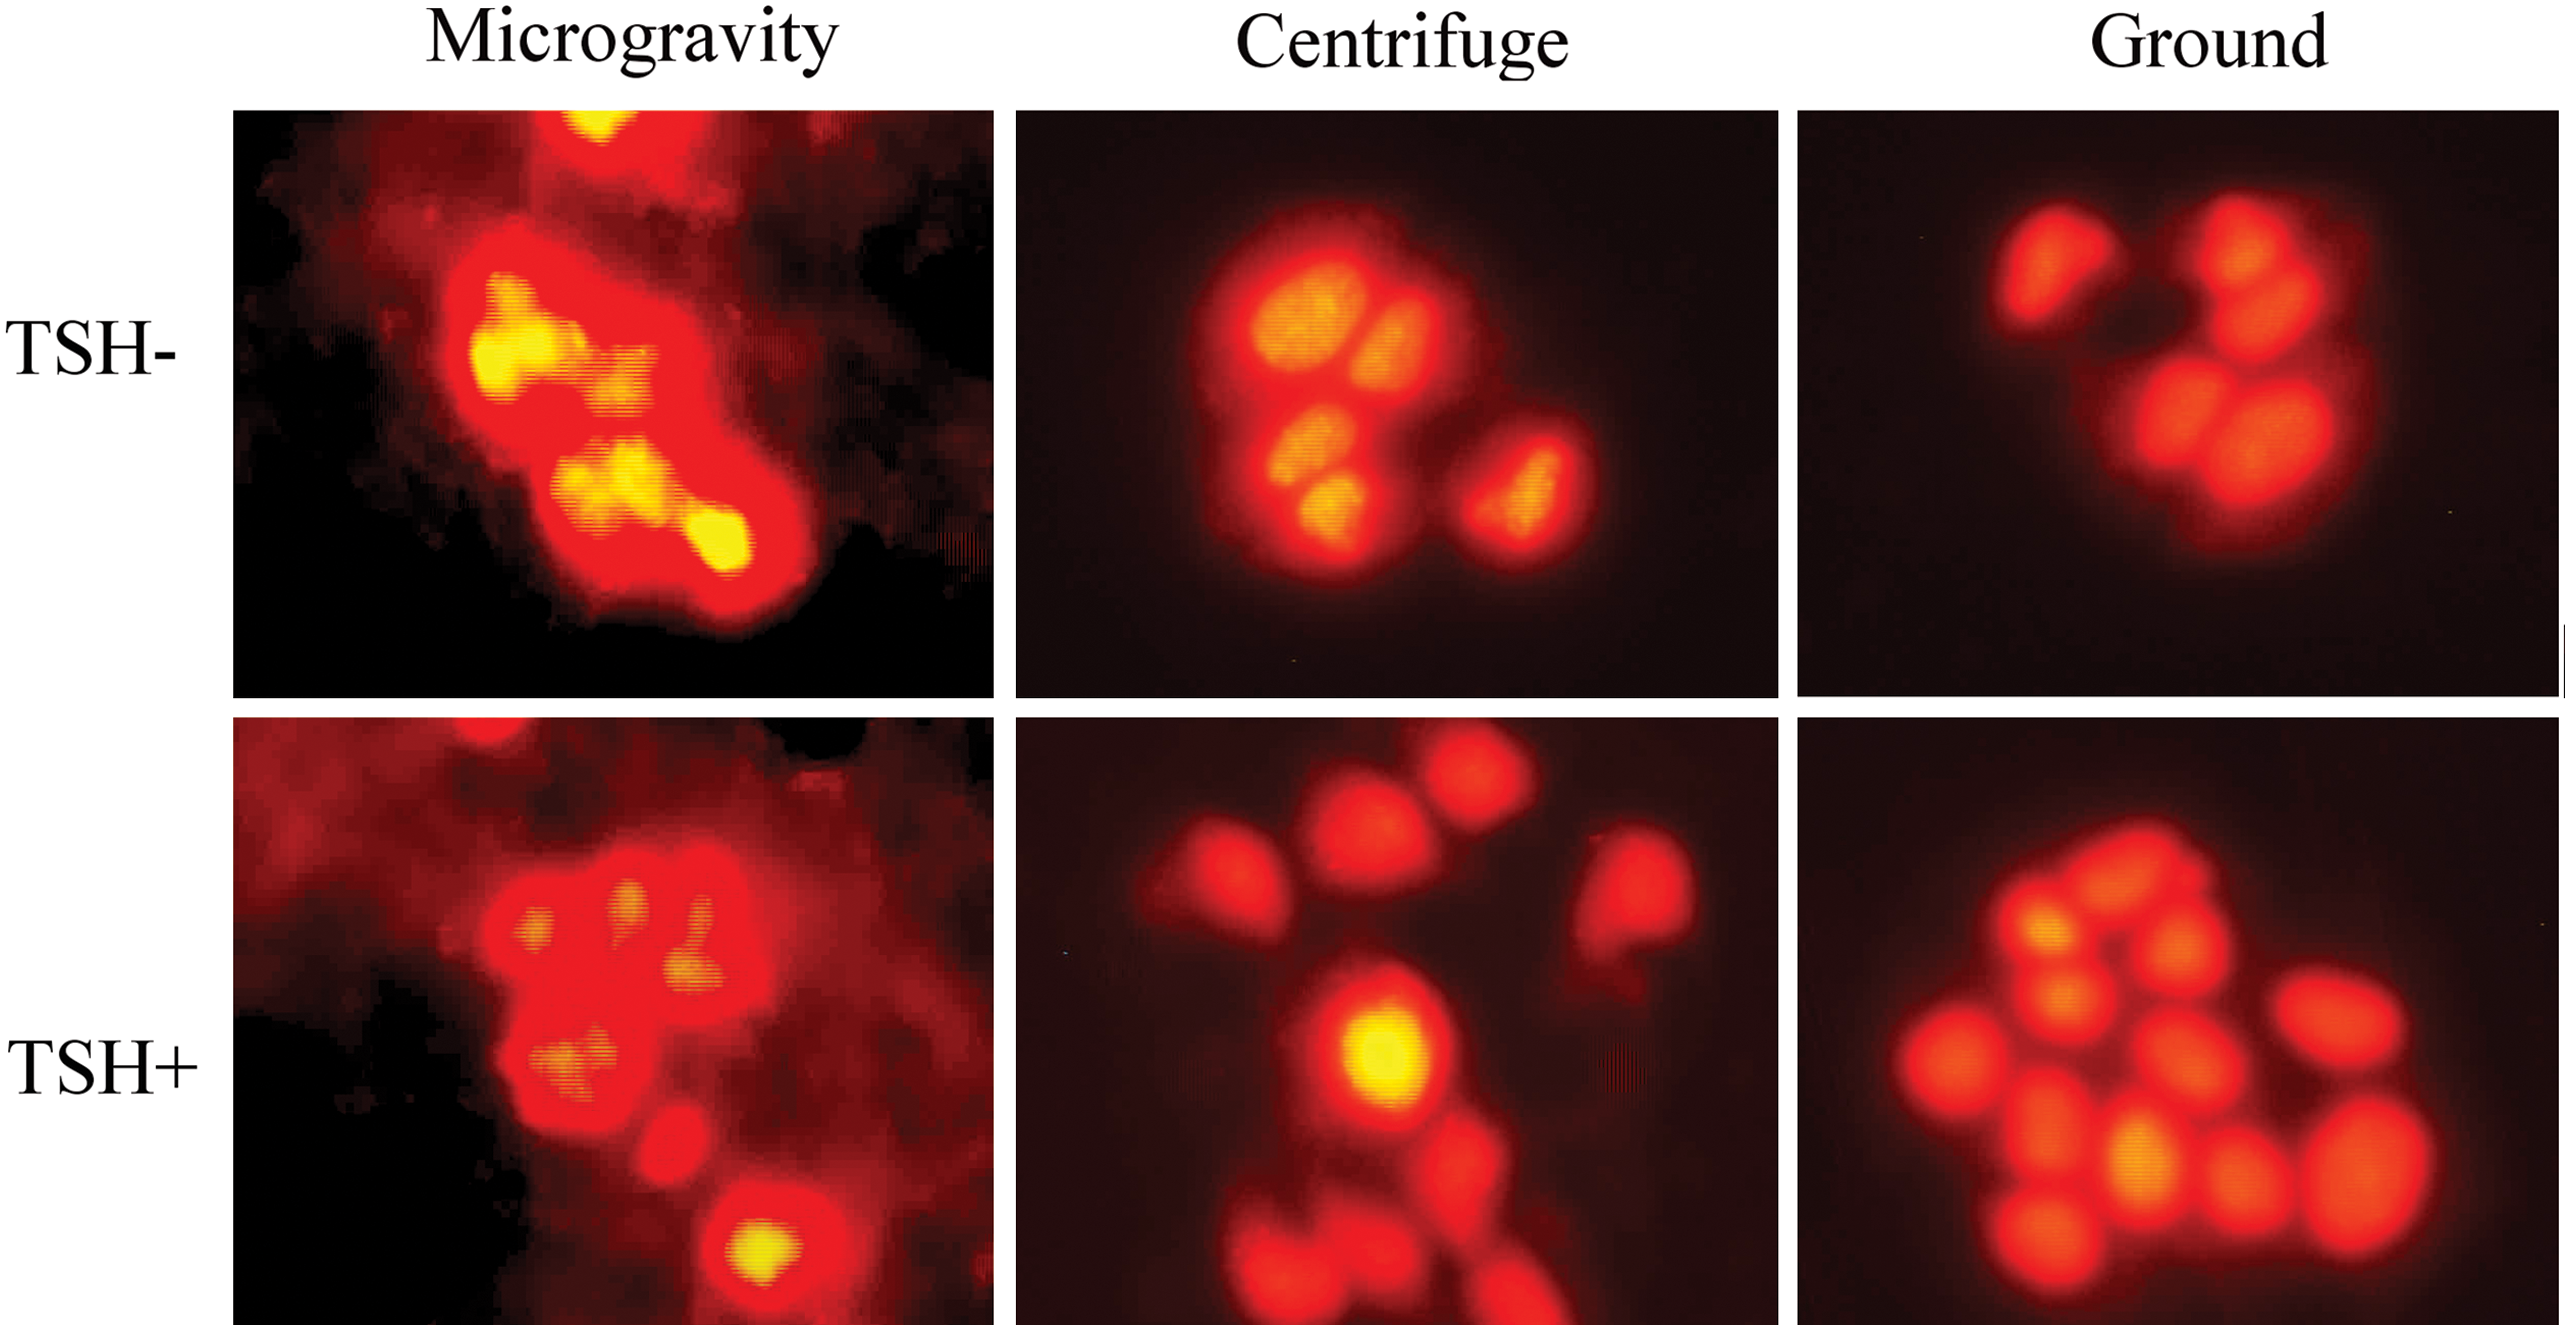
Propidium iodide staining of nuclei of FRTL-5 cells in microgravity. The cells were cultured in the absence of TSH (TSH−) or stimulated with TSH (TSH+) when the sounding rocket reached an altitude of 264 km and the weightlessness started. They were fixed after 6 min and 19 s of microgravity. As controls, the samples maintained in an onboard 1g centrifuge and on the ground were fixed after the same amount of time. Color images available online at
3.2. cAMP release from FTRL-5 cells in microgravity
To test the response to TSH of thyroid cells in microgravity, we determined the levels of cAMP released after fixation. The basal cAMP level was very similar in quiescent cells (TSH−) of both control (1g centrifuge and ground) and microgravity samples (Fig. 2).

cAMP level after TSH stimulation in microgravity. The results were compared with those obtained in an onboard 1g centrifuge or on the ground (controls). The data were expressed as pmol/mg protein and represent the mean ± SD of three independent experiments. Significance, **P < 0.001 versus controls.
After 6 min and 19 s of treatment with TSH (TSH+), the level of cAMP increased 59-fold and 50-fold in the 1g centrifuge and ground samples, respectively, in comparison with the basal level. In microgravity conditions, the TSH-induced cAMP was reduced 45% and 51% in comparison with the 1g centrifuge and ground control samples, respectively (Fig. 2).
3.3. Microgravity modifies the protein component released by the fixative
It was previously reported that simulated weightlessness changed the cytoskeleton of normal thyroid cells (Infanger et al., 2004), increased the extracellular matrix proteins (Infanger et al., 2006), reduced thyroglobulin, FT3, and FT4 secretion (Grimm et al., 2002a), and induced apoptosis (Grimm et al., 2002b; Kossmehl et al., 2002) of thyroid carcinoma cells. These data were supported by exposing mitochondria-rich thyroid carcinoma cells and normal thyroid cells to simulated microgravity conditions and obtaining apoptotic cells (Kossmehl et al., 2003). We reported for the first time the modifications of thyroid cells under real microgravity conditions. Our results show that the content of proteins in the fixative that was collected after reentry from the control boxes in the 1g centrifuge was 197 ± 31 and 180 ± 9 μg (n = 3 samples) in the TSH− and TSH+ samples, respectively. Similarly, the protein values of the control samples maintained on the ground were 157 ± 22 and 174 ± 6 μg (n = 3 samples) in the TSH− and TSH+ samples, respectively. Differently, the protein value in microgravity conditions was 456 ± 18 and 439 ± 21 μg (n = 3 samples) in the TSH− and TSH+ samples, respectively. Given the very short time of the experiment (6 min and 19 s), it is unlikely that the difference of protein content between microgravity samples and control samples was due to cell growth variation. Given that the quantitative variation of protein in microgravity samples suggests qualitative changes in protein composition, we sought to investigate this relationship further.
An immunoblotting analysis was performed with specific antibodies against TSHR, caveolin-1, and proteins involved in cell signaling, such as STAT3, PKCζ, PPARγ, Smase, and SM-synthase 1. The results highlight that the band density of all proteins analyzed in the control samples maintained in the 1g centrifuge and in the ground laboratory were very similar (Fig. 3). The low variability of the actin band density in all samples is an index of the experimental accuracy. The fact that the bands of actin in Fig. 3a were paler than those in Fig. 3b and Fig. 3c could be due to the lower slab impregnation. Considering the possible variations of the immunoblotting technique due to experimental error, only the more significant differences observed in microgravity were considered. In fact, it was evident that in microgravity the TSHR band, which corresponds to 50 kDa apparent molecular weight, was significantly lower than that present in both the 1g centrifuge and the ground control samples (Fig. 3a). In contrast, SM-synthase 1 [corresponding to 49 kDa apparent molecular weight (Fig. 3b)], Bax (corresponding to 23 kDa apparent molecular weight), and caveolin 1 [corresponding to 22 kDa apparent molecular weight (Fig. 3c)], showed a higher immunopositivity than the same proteins present in the 1g centrifuge and ground control samples.
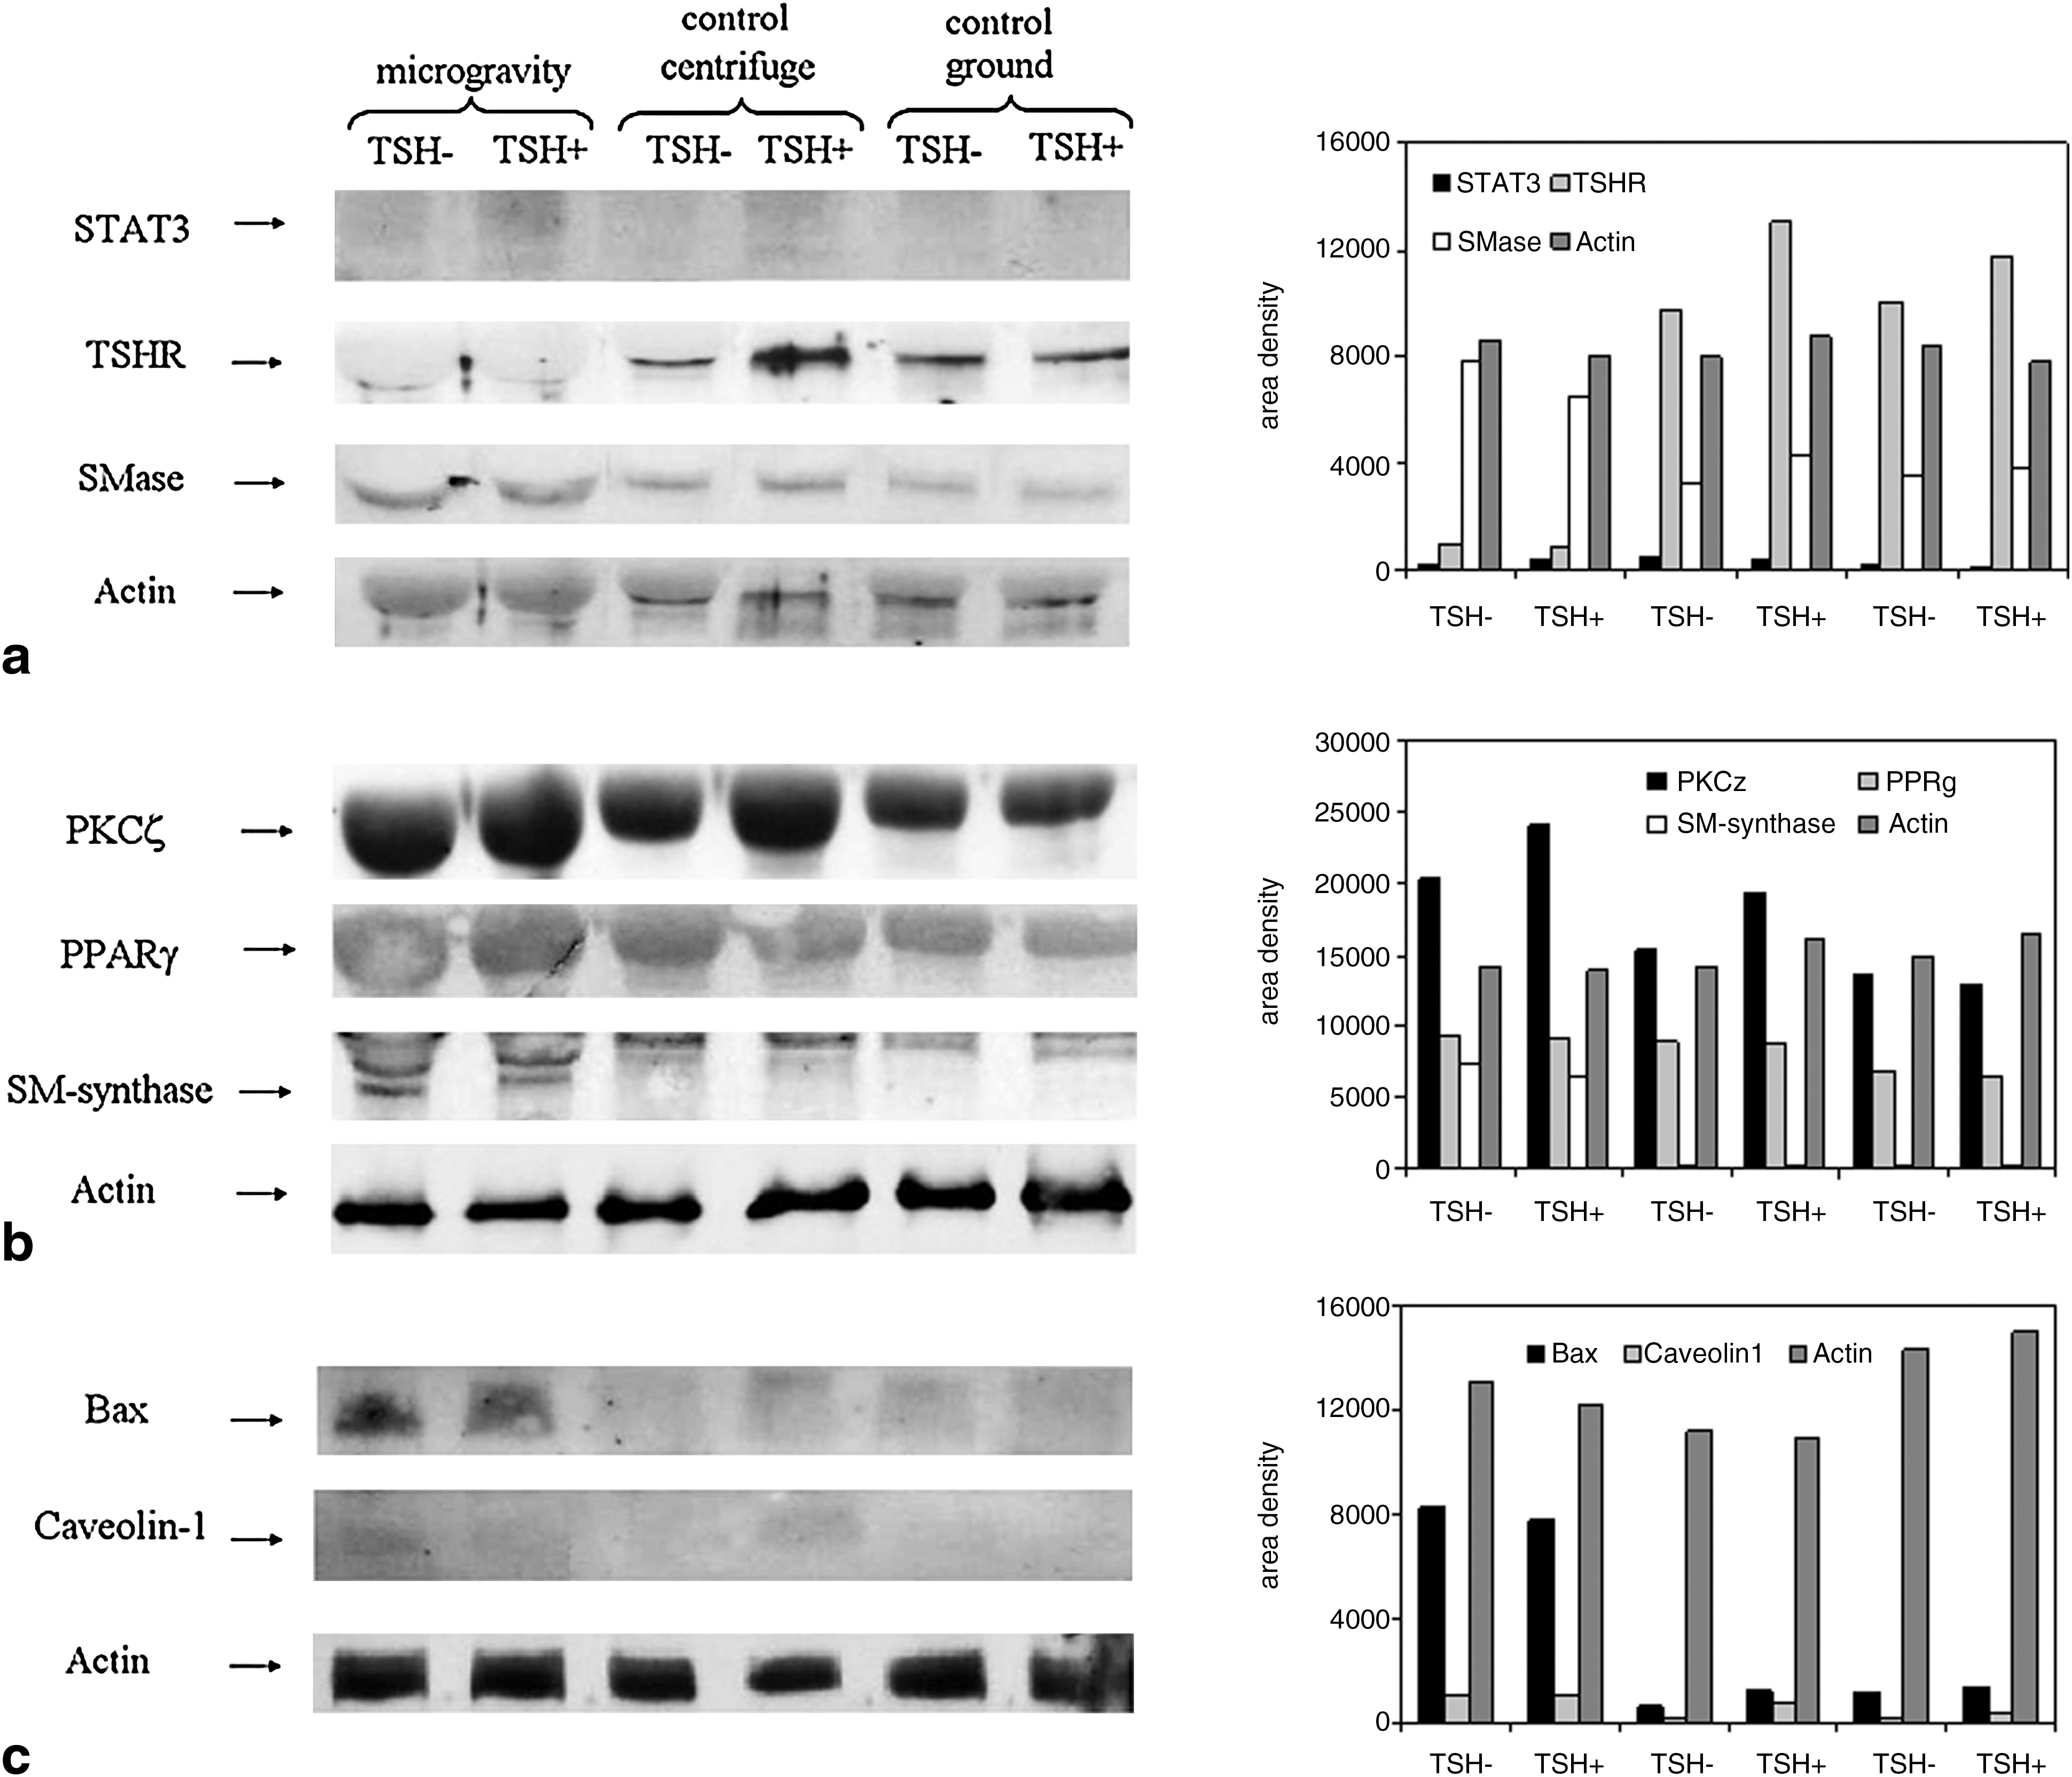
Comparison of proteins in the pellets of the cells in microgravity, in an onboard 1g centrifuge, and on the ground. The first immunoblot of proteins was re-probed after stripping four times for STAT3, TSHR, SMase, and actin detection (Fig. 3a); the second immunoblot was re-probed four times for PKCζ, PPARγ, SM-synthase 1, and actin detection (Fig. 3b); the third immunoblot was re-probed three times for caveolin 1, Bax, and actin detection (Fig. 3c). The apparent molecular weight was 90 kDa for STAT3, 50 kDa for TSHR, 43 kDa for SMase, 43 kDa for actin, 78 kDa for PKCζ, 67 kDa for PPARγ, 49 kDa for SM-synthase, 22 kDa for caveolin 1, and 23 kDa for Bax. The band density analysis of the immunoblottings are presented by the bar charts on the right; the order of the samples is, from left to right, microgravity samples, 1g centrifuge control samples, and ground control samples.
3.4. In microgravity the TSHR leaves the cell membrane
To verify whether the reduced level of TSHR in microgravity was due to the loss of the receptor, immunoblotting analysis was performed in culture medium collected after 6 min and 19 s of microgravity before cell fixation. The receptor was analyzed with anti-TSHR antibodies. In microgravity, the TSHR band density of the TSH− cells was 4 times higher than that present in the 1g centrifuge and ground control samples (Fig. 4). It was therefore evident that TSH treatment reduced the presence of TSHR in the culture medium of the three samples. As in the culture medium in which the actin protein was not present, the content of SMase was evaluated to check the accuracy of the test. The results show that the SMase band was similar for all samples (Fig. 4).
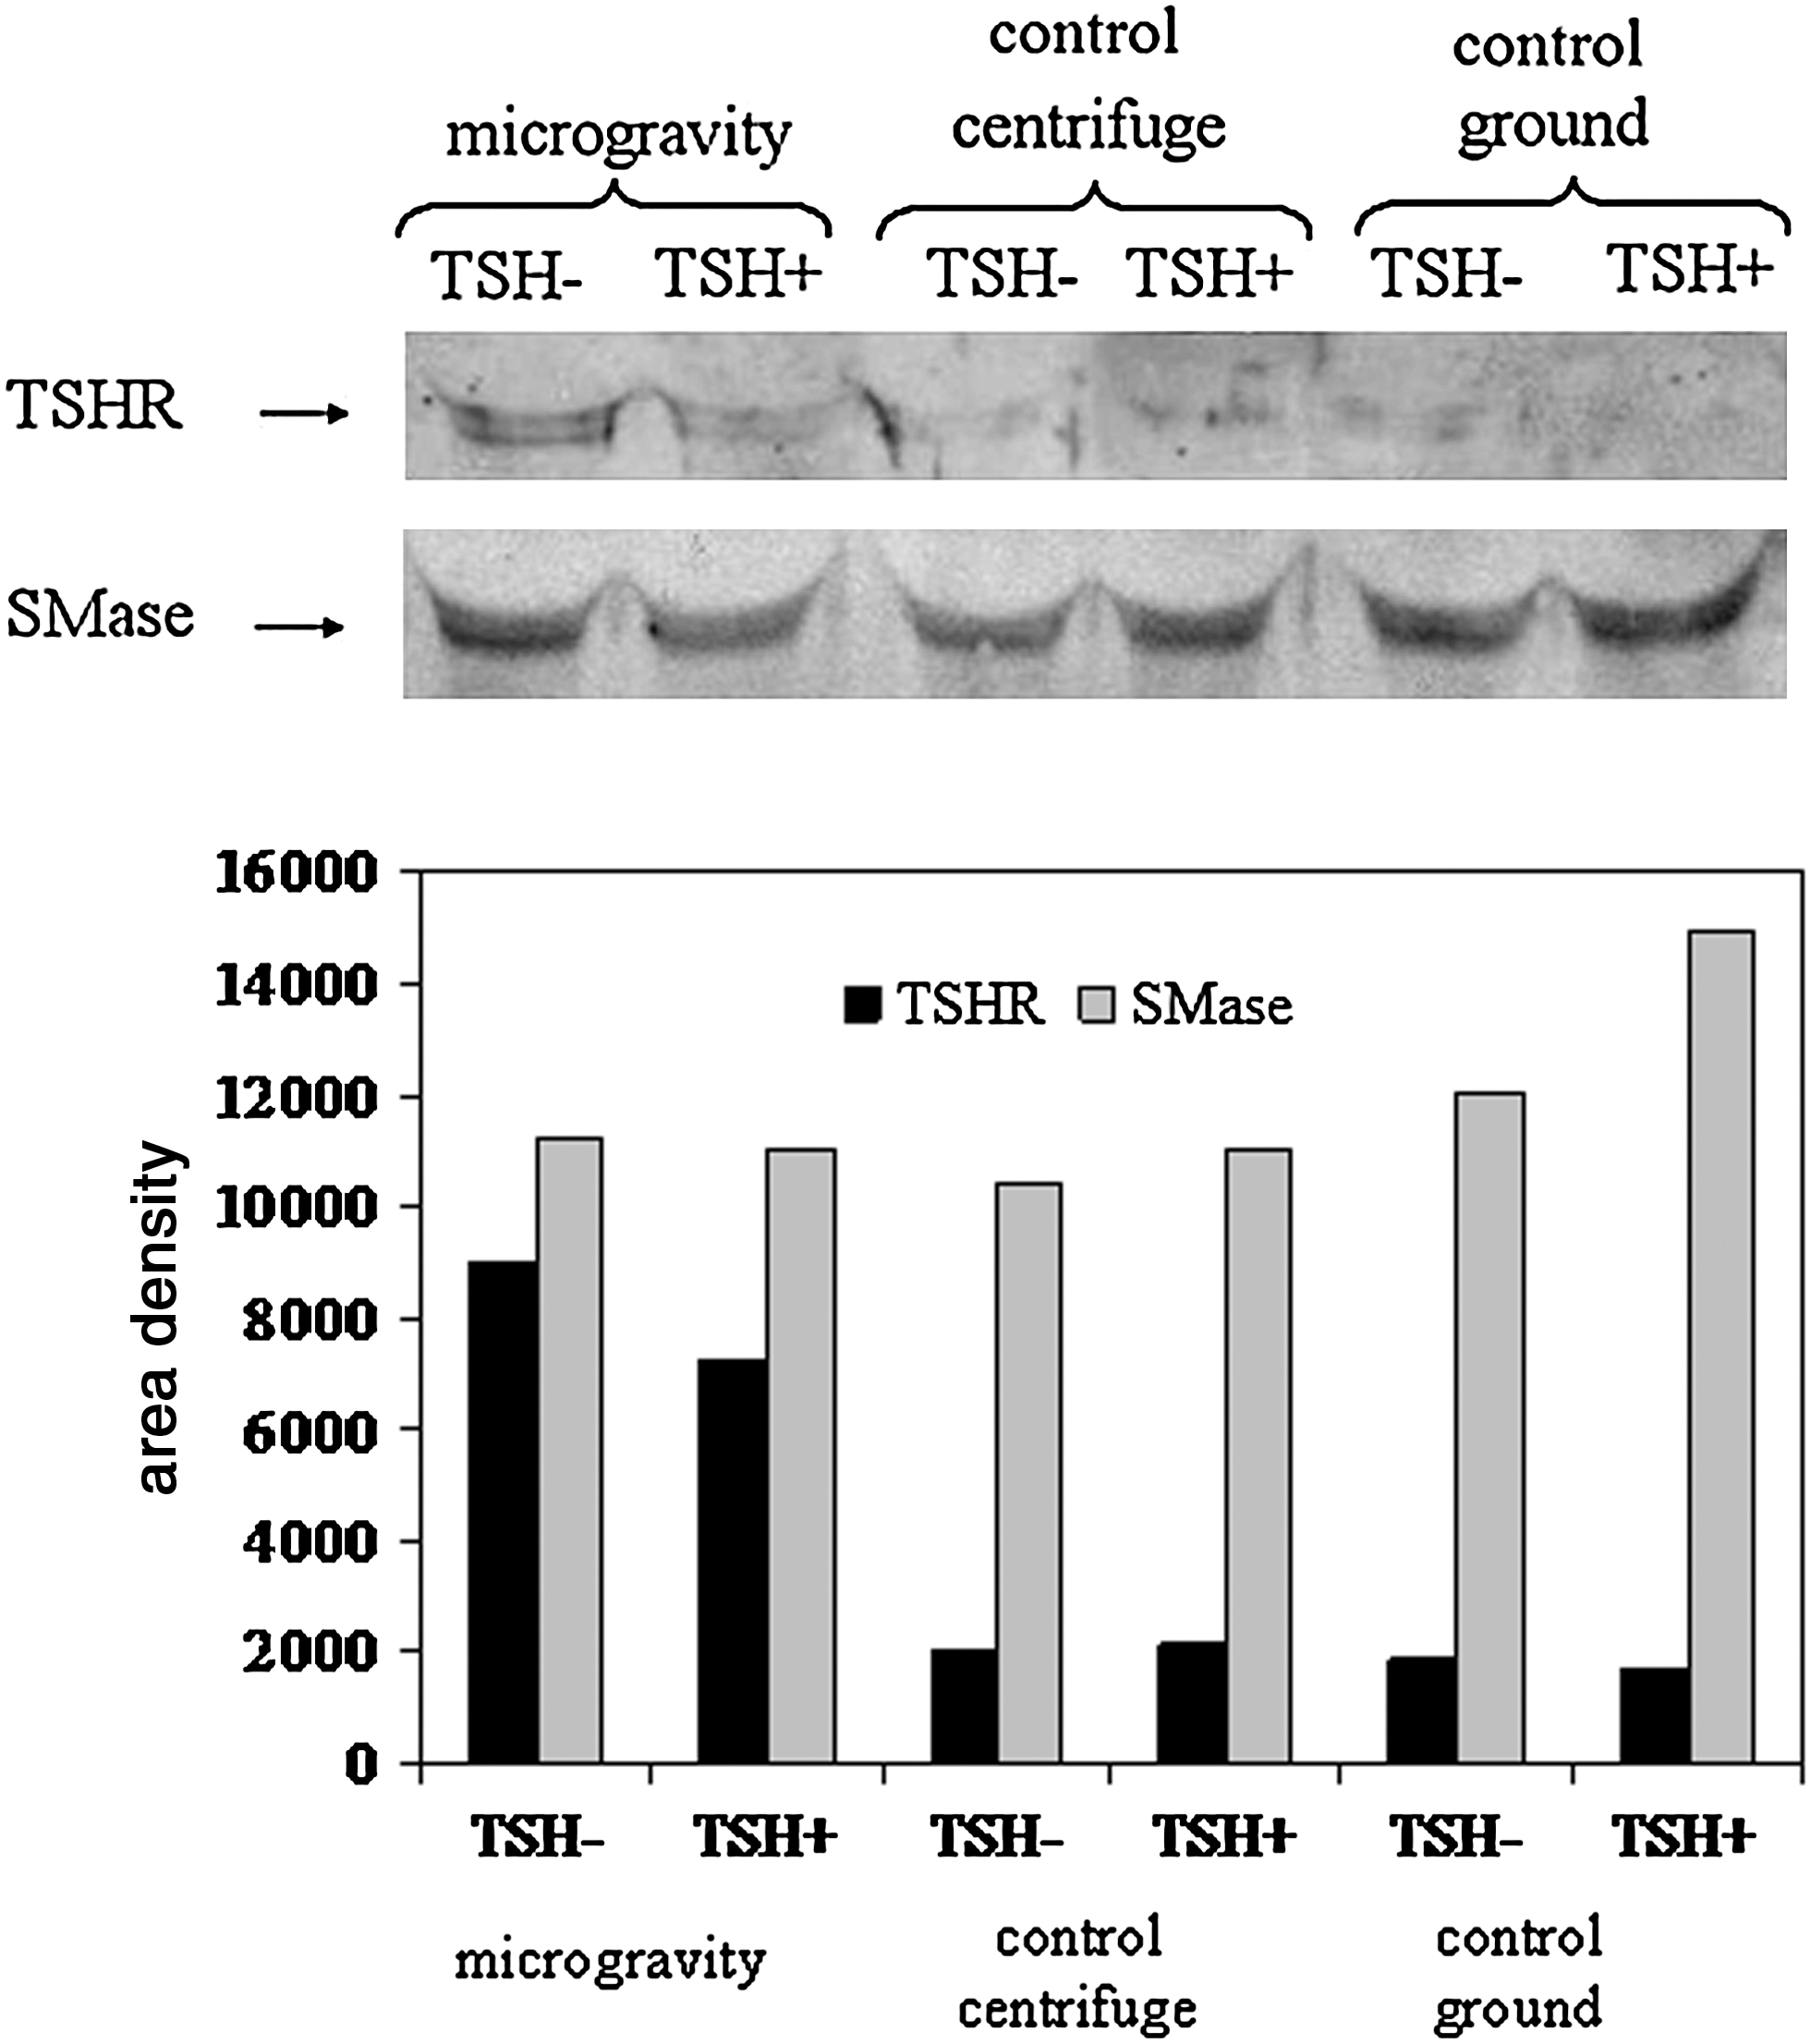
Thyrotropin receptor in the culture medium of the cells cultured in microgravity, in an onboard 1g centrifuge, and on the ground. Immunoblot of proteins was re-probed after stripping two times for TSHR and SMase detection. The 50 kDa apparent molecular weight of TSHR and 43 kDa of SMase was indicated in relation to the position of molecular size standard.
3.5. Sphingomyelin and cholesterol content of the culture medium changes in microgravity
Considering that microgravity induced the release of TSHR in the culture medium, it was possible to hypothesize a modification of cell–culture medium relationship. To investigate this point, SM and CHO content was analyzed in the culture media of TSH− and TSH+ cells. In TSH− culture medium from the microgravity samples, the SM and CHO content decreased 16% and 28%, respectively, when compared with the 1g centrifuge and ground control samples. In TSH+ culture medium, the SM and CHO content increased 1.7-fold and 1.4-fold, respectively, when compared with the 1g centrifuge and ground control samples (Fig. 5).

Cholesterol and sphingomyelin content in the culture medium of the cells cultured in absence of TSH (TSH−) or stimulated with TSH (TSH+) in microgravity, in an onboard 1g centrifuge, and on the ground. The data were expressed as μg/mL and represent the mean ± SD of three independent experiments. Significance, **P < 0.001 microgravity versus centrifuge and ground.
4. Discussion
The present study has clearly shown that FRTL-5 cells underwent relevant changes in real microgravity conditions. Given that (1) the simulated microgravity reproduced only a part of microgravity biological effects (Ricci et al., 2008), (2) the results sometimes appear contradictory (Infanger et al., 2004), and (3) it is impossible to put the complicated instrumentation prepared for the flight (growth chamber, distributor, syringes, and computer system) on a simulator of microgravity, the experiment has not been checked in simulated microgravity. As specific controls, FRTL-5 cells were maintained at Earth's gravity in an onboard 1g centrifuge and ground laboratory in the same culture chambers with the same instrumentation used in the microgravity experiment. Many preliminary experiments were conducted in the Udine laboratories prior to the mission in order to establish the optimal conditions for cell culture in relation to biocompatibility of materials and cell concentration. Parameters that did not affect, in any way, the results of possible changes in microgravity compared to the samples in the centrifuge and those that were ground controls were chosen. For this study, a time of about 6 min of microgravity was programmed, since proteins exposed to the cell surface were degraded or internalized a few seconds to several minutes after damage (Mellgren, 2010). In addition, TSH or forskolin induced in FRTL-5 cells an increase of cAMP after only a few minutes of treatment (Ealey et al., 1987), and we have demonstrated that after 6 min the level of cAMP remained constant (data not shown). Thus, a prolonged permanence in microgravity did not cause further damage, which suggests that the early damage induced by microgravity could be dangerous to humans in space. Our data show that, after 6 min and 19 s of microgravity, the cells appeared aggregated and presented chromatin condensation, the TSH-induced cAMP production was significantly attenuated, and the TSHR was increased about 4.4-fold in the culture medium. At Earth's gravity, the TSHR was unaltered, and the cells responded to TSH treatment with normally high levels of cAMP production. The fixative used for the experiment released the receptor together to other proteins involved in cell signaling, such as PKCζ, PPARγ, and SMase. The observation that the TSHR was present, whereas the caveolin 1 was absent, in the pellets obtained after cell fixation, led us to hypothesize that the fixative determined the release of the receptor from lipid rafts/caveolae (Patel et al., 2008). It is currently very difficult to draw the exact mechanism of action of microgravity on specific regions of the cell membrane. Similar future space missions will be useful in clarifying this point. It is possible that the loss of TSHR from the cells in microgravity was due to the disorganization of microdomains within the cell membrane, depending on SM and CHO incorporation from the culture medium that yielded a more rigid membrane structure. These data were consistent with the observation that a medium lacking TSH caused cessation of FRTL-5 cell proliferation due to the decrease in membrane lipid fluidity, which in turn was caused by an absolute increase of membrane CHO (Beguinot et al., 1987). It is possible that the microgravity exacerbated this process by facilitating the transfer of lipid micelles from the culture medium to cell membranes, and consequently by modifying the structure/function of microdomains and influencing the G protein coupled receptors (Patel et al., 2008). The TSH treatment yielded a more fluid cell membrane, due to the decrease of CHO (Beguinot et al., 1987).
Our results show that microgravity induced the cells treated with TSH to release CHO and SM to the culture medium probably by modifying the microdomain structure. The lower amount of TSHR in the culture medium after TSH stimulation with respect to the TSH− samples may have been due to the fact that raft-TSHR complexes are regulated by TSH, which stimulates the formation of monomers and allows their rapid exit from the rafts (Latif et al., 2003). Therefore, the modification of lipid rafts consequent to the removal of CHO-SM may have been preceded by a transfer of the receptor, which would explain the reduction but not the absence of the cAMP response. The disorganization of microdomains in microgravity was confirmed by the presence of caveolin 1 in the pellet obtained after fixation, which was absent in the samples maintained in Earth's gravity. Lipid rafts and caveolae are biochemically similar even if morphologically distinct and with different and complementing functions (Sprenger et al., 2006). The loss of CHO-SM and the consequent structural change of the membrane microdomains could justify the release of caveolin 1 by the fixative. This is relevant, considering that, in a modeled microgravity study in endothelium cells, the caveolae and caveolae constituents were found to be involved in the molecular mechanisms responsible for gravity sensing (Spisni et al., 2006).
Comparing proteins of the microgravity-exposed cells with those of the control cells maintained at Earth's gravity (and considering that the FRTL-5 cells were selected for the present study because several important signaling pathway proteins have been described in these cells), we obtained intriguing results. While TSHR appeared strongly reduced, a low increase of STAT3, PKCζ, PPARγ, and SMase was observed. It is very difficult to establish whether microgravity induced an increase of these proteins or whether the molecular remodeling induced by microgravity was responsible for the different protein extraction from cells while using the fixative. Given the low increase of the band densities, the second explanation appears more plausible. Here we assign more relevance to the Bax and SM-synthase 1 bands, which were characterized by a strong density increase in microgravity.
Because the microgravity-exposed cells were unresponsive to TSH stimulation due to TSHR alteration, the protein bands in the two samples were very similar. It remains unclear whether in microgravity the SM-synthase is actually an active enzyme. In the same cells, UVC irradiation stimulated the SMase activity and inhibited SM-synthase activity (Albi et al., 2008), as occurred during the stratospheric balloon missions (Albi et al., 2009). In microgravity, we have shown that the two enzymes presented different quantitative changes, though we know nothing about their activity.
Because the values of cAMP after treatment with TSH were significantly lower than those obtained in Earth's gravity, it is possible that they were not sufficient to trigger a cellular response. On the other hand, the effect of TSH on FRTL-5 cell growth was mediated by cAMP, but it was not by itself sufficient to promote cell growth (Beguinot et al., 1987). In addition, cAMP might also mediate the effect of TSH to downregulate its own receptors (Tramontano et al., 1988). It would be important to know the relationship between TSH-TSHR and cAMP-SMase- SM-synthase pathway in the modification of the functional state of thyroid cells in microgravity.
In conclusion, the present paper represents the first observation of a significant TSHR alteration in real microgravity conditions, though many issues remain and reveal the needs for further study. Future space missions will be needed to clarify the role of microgravity on the modifications of thyroid physiology and to study the potential to modulate the membrane lipid microdomains in order to limit their changes in astronauts during space missions.
Footnotes
Acknowledgments
This work is supported by grants from Agenzia Spaziale Italiana (ASI). We thank A. Lazzarini for the technical assistance.
Abbreviations
cAMP, cyclic adenosine monophosphate; CHO, cholesterol; PKCζ, protein kinase C zeta; PPARγ, peroxisome proliferator-activated receptor gamma; SD, standard deviation; SM, sphingomyelin; SM-synthase, sphingomyelin synthase; SMase, sphingomyelinase; STAT3, signal transducer and activator of transcription-3; TLC, thin-layer chromatography; TSH, thyrotropin; TSHR, receptor protein for thyrotropin.