
Abstract
Microbialites can have complex morphologies that preserve clues to ancient microbial ecology. However, extracting and interpreting these clues is challenging due to both the complexity of microbial structures and the difficulties of connecting morphology to microbial processes. Fenestrate microbialites from the 2521±3 Ma Gamohaan Formation, South Africa, have intricate structures composed of three distinct microbial structures: steeply dipping supports (surfaces defined by organic inclusions), more shallowly dipping supports with diffuse organic inclusions below them, and draping laminae. In polished slabs, shallowly dipping supports with diffuse organic inclusions show apparent dips from 27° to 60°, and supports without associated zones of diffuse inclusions dip 75° to 88°, which suggests a distinction between support types based on orientation. However, dips exposed in polished slabs are apparent dips, and three-dimensional analysis is required for analysis of true dips. Through the Keck Center for Active Visualization in Earth Sciences (KeckCAVES), we used locally developed software that controls a three-dimensional environment with head and hand tracking (an “immersive environment”) to visualize and interpret virtual microbialite data sets. Immersive environments have not penetrated into standard scientific work processes (“workflows”) due to their high costs, steep learning curves, and low productivity for users. By contrast, our suite of software tools allowed us to develop a personalized scientific workflow that provides a complete path from initial ideas to characterization of fenestrate microbialites' features. Results of three-dimensional analysis of fenestrate microbialites show that supports with inclusions dip 65° to 75°, whereas supports without inclusions dip 85° to 90°. These results demonstrate that all supports have very steep dips, and a 10° dip gap exists between supports with and without inclusions, which suggests they grew in fundamentally different ways. Results also emphasize how valuable three-dimensional analysis is when combined with a comprehensive workflow for understanding intricate structures such as fenestrate microbialites. Key Words: Immersive visualization—Geoscience—CAVES—Workflow—Microbialites. Astrobiology 11, 509–518.
1. Introduction
Although stromatolite morphology can provide clues to ancient life, determining the biogenicity of ancient structures can be difficult. It is often debated whether microbialite geometries require growth from biogenic processes or whether the morphology could have formed from abiogenic processes alone, such as structural folding (Lowe, 1994) or abiotic chemical and sedimentary processes (Grotzinger and Rothman, 1996; Grotzinger and Knoll, 1999; Batchelor et al., 2003; McLoughlin et al., 2008). Thus, the origins of many stromatolites, including those that may represent the oldest life on Earth, have been highly controversial (Buick et al., 1981, 1995; Lowe, 1994, 1995). For these early stromatolites, as well as for younger structures, refined interpretations of morphology can substantially improve our understanding of the processes that influence stromatolite growth and help resolve issues of biogenicity (Hofmann et al., 1999).
Although the importance of three-dimensional stromatolite morphology has been recognized for decades (Preiss, 1976), previous methods for reconstructing three-dimensional morphology have not allowed visualization of the spatial relationships among internal microbialite components. Early, low-tech methods for three-dimensional reconstruction required interpretation and extrapolation from longitudinal slices (Glaessner et al., 1969; Walter, 1972). With the recent and ongoing development of three-dimensional visualization systems, the opportunity exists to use new methods to explore and characterize complicated microbial structures. However, many new visualization systems present challenges that are unique to virtual environments, such as difficulty manipulating data, non-intuitive workflow, and high costs. We have overcome these difficulties with software produced by the Keck Center for Active Visualization in Earth Sciences (KeckCAVES) at the University of California, Davis. We have developed a complete three-dimensional immersive workflow that plays a critical role in characterizing ancient microbial structures. In this project, we serial sectioned complex microbialites to obtain morphological data at the 100 μm scale and characterized previously poorly understood relationships within the microbialites.
The sample we focused on consists of fossilized microbial communities, similar to stromatolites, but officially classified as fenestrate microbialites (Sumner, 1997b, 2001). These microbialites are composed of variously oriented surfaces and cement-filled voids (Sumner, 1997b). Spatial relationships among these components provide critical constraints on the ecology of microbial communities. For example, Sumner (1997b) argued that two distinct microbial communities were present based on differences in crosscutting relationships between supports and calcite cements. To test this prediction as well as to gain insights into microbial growth processes, the geometry of the various microbial components needs to be fully understood. Although some features can be characterized based on polished rock faces (Fig. 1A), characterization of the three-dimensional morphology of even the simplest samples is required for quantitative analysis of microbial components. Results from this study show that two features similar in two dimensions had very distinctive growth characteristics.

(
1.1. Geological context of studied fenestrate microbialites
Fenestrate microbialites are abundant in the 2521±3 Ma Gamohaan Formation, South Africa (Sumner, 1997a, 1997b; Sumner and Bowring, 1996). They formed prior to the oxidation of Earth's atmosphere. A subset of fenestrate microbialites—plumose microbialites—represents a suite of microbial structures that are of particular interest due to their complicated and previously unknown morphology (Sumner, 1997b, 2001). They consist of intersecting or branching surfaces defined by organic inclusions with an unknown three-dimensional morphology. There are no known modern analogues to provide clues to the origins of their morphology. Thus, the first step to understanding how plumose microbialites might have grown is to characterize their morphology. We chose to study a sample from a 50 cm thick bed of plumose microbialites that is preserved over an area of 7000 km2 (Sumner, 1997a). The studied sample, which is representative of plumose microbialites, consists of surfaces defined by organic inclusions (“supports”), zones of diffuse inclusions encased in fibrous marine herringbone calcite, herringbone calcite that lacks organic inclusions, and bladed to blocky calcite that filled voids formed by the microbial supports (Fig. 1A–C). The morphology of the original microbial community in the sample is very difficult to interpret based on observations of polished slabs because the orientation and lateral extent of the supports are poorly constrained (Fig. 1A–C). Analysis of polished slabs showed that supports are surfaces as opposed to linear features, but their orientation and curvature are not obvious in two dimensions. Analysis in three dimensions was required to characterize their morphology.
1.2. Three-dimensional reconstruction of microbialite morphology: historical methods
Three-dimensional reconstruction has been a useful technique for documenting microbialite forms and taxonomic identification since early stromatolite studies. An early technique for three-dimensional reconstruction of stromatolites is “graphical preparation,” which involves reconstructing the shape of stromatolites from parallel serial sections spaced so that at least two cuts are made for any stromatolite column (Preiss, 1976; Walter et al., 1976). On each slab, the stromatolite features of interest are shaded and transferred to tracing paper and then transferred onto a block diagram with tracings for all slabs (Preiss, 1976). These serial section tracings are used to produce drawings of the three-dimensional structures of stromatolites (Glaessner et al., 1969; Hofmann, 1973; McConnell, 1975). A critique of this method is that shading of surface features is imprecise and subjective depending on the person creating the reconstruction (Hofmann, 1976). Thus, a more precise method was designed to reduce bias imposed by the reconstructor. This method resulted in horizontally contoured isometric diagrams depicting stromatolite columns (Hofmann, 1976). Other early workers built physical reconstructions of stromatolite columns based on similar serial sectioning methods (Horodyski, 1976). Serial sections are cut through branching stromatolite columns, then cardboard templates of the column shaped for each section are cut and assembled in the correct orientation and relative position. Modeling clay is used to fill in open spaces between successive cardboard cutouts, which results in a physical three-dimensional reconstruction of the stromatolite.
These early methods resulted in greater understanding of the diversity of stromatolite forms than would have been possible with analysis of two-dimensional slabs alone. For relatively simple geometries, these methods are probably reasonably accurate at reconstructing stromatolite morphologies. However, because they require extrapolation between successive serial slabs, detail is lost in reconstructions of intricate and complicated structures. Furthermore, these methods focus on reconstruction of the external morphology of stromatolite columns and do not allow analysis of internal textures or spatial relationships between stromatolite features and other sedimentary features that provide clues to processes contributing to formation.
Recently, new studies have demonstrated the value of digital reconstructions for studying the morphology of ancient microbialites (Howell et al., 2011) and of microbialite-associated fossils (Grotzinger et al., 2000; Watters and Grotzinger, 2001). To reconstruct dendrolite morphologies, Howell and others (2011) combined serial and cross-sectional images into a three-dimensional digital model that resulted in a classification scheme for dendroid morphology and a growth model for different structures (Howell et al., 2011). Fossils within microbialite reefs were systematically characterized by using a computer-based reconstruction technique to determine their true geometry (Grotzinger et al., 2000; Watters and Grotzinger, 2001). Similar three-dimensional tomographic reconstructions have also been used in paleontology studies to create models of specimens that cannot be removed from the sediment matrix with conventional techniques (Clarke et al., 2005; Maloof et al., 2010).
1.3. Recent advances in three-dimensional data analysis
Visualization systems for characterizing digital reconstructions of ancient structures are improving rapidly. Immersive visualization systems track the user's position and render images for perfect stereo vision. These types of systems allow us to use our full visual capacity to analyze data, such as the intricate geometry of microbial structures. Graphics are rendered such that the user perceives virtual objects as if they were real. Given the right software, representations can be manipulated and explored in ways that are impossible with real objects, providing the ability to investigate data in novel, insightful ways.
Even though immersive three-dimensional environments have been available for more than a decade, they have not penetrated into the standard scientific workflow or educational environments. In the past, their high costs have limited use, although the availability of GeoWall systems, which can cost less than $10,000, has started to change this (GeoWall, 2011). Commercialization of 3-D TVs allows even lower-cost systems. Thus, cost barriers are quickly falling. A second barrier to widespread use is the “steep learning curve” for most immersive environment software (Jacobs et al., 2008). It is often difficult to integrate diverse data into visualizations and then manipulate them intuitively. The usability problem is being overcome with new software development. For example, Virtual Reality User Interface (Vrui) and 3DVisualizer are freely available applications for interactive, high-performance virtual reality applications (Billen et al., 2008; Kreylos, 2008) that allow users to directly manipulate data in intuitive ways in diverse visualization environments, including both high-end three-dimensional systems (i.e., GeoWall, CAVE) and personal computers. A third barrier is the immersive environment workflow. Immersive visualization environments remove users from their normal work environment, and it is often not convenient to record results in standard ways. For example, taking notes is inconvenient since the user holds an input device and wears special glasses, and screen shots of visualizations are not very meaningful because the two-dimensional captured images do not show the intricacies seen during three-dimensional visualization. Thus, careful attention is needed to develop a workflow that makes immersive visualization convenient for users. The need for this type of flexible work environment drove the development of modern desktop work environments, which has resulted in improved workflow and productivity (Gery, 1991). These same needs must be met within immersive visualization environments to take full advantage of their potential as research tools. Scientists must have confidence in the productivity of the workflow path to adopt it.
The workflow developed during this study, in which software produced by KeckCAVES was used, allows comprehensive investigation and analysis of the external morphology and internal structures of ancient fenestrate microbialites (Fig. 2). This workflow reduces many of the challenges common with immersive virtual environments. It can also be used for diverse visualization tasks.
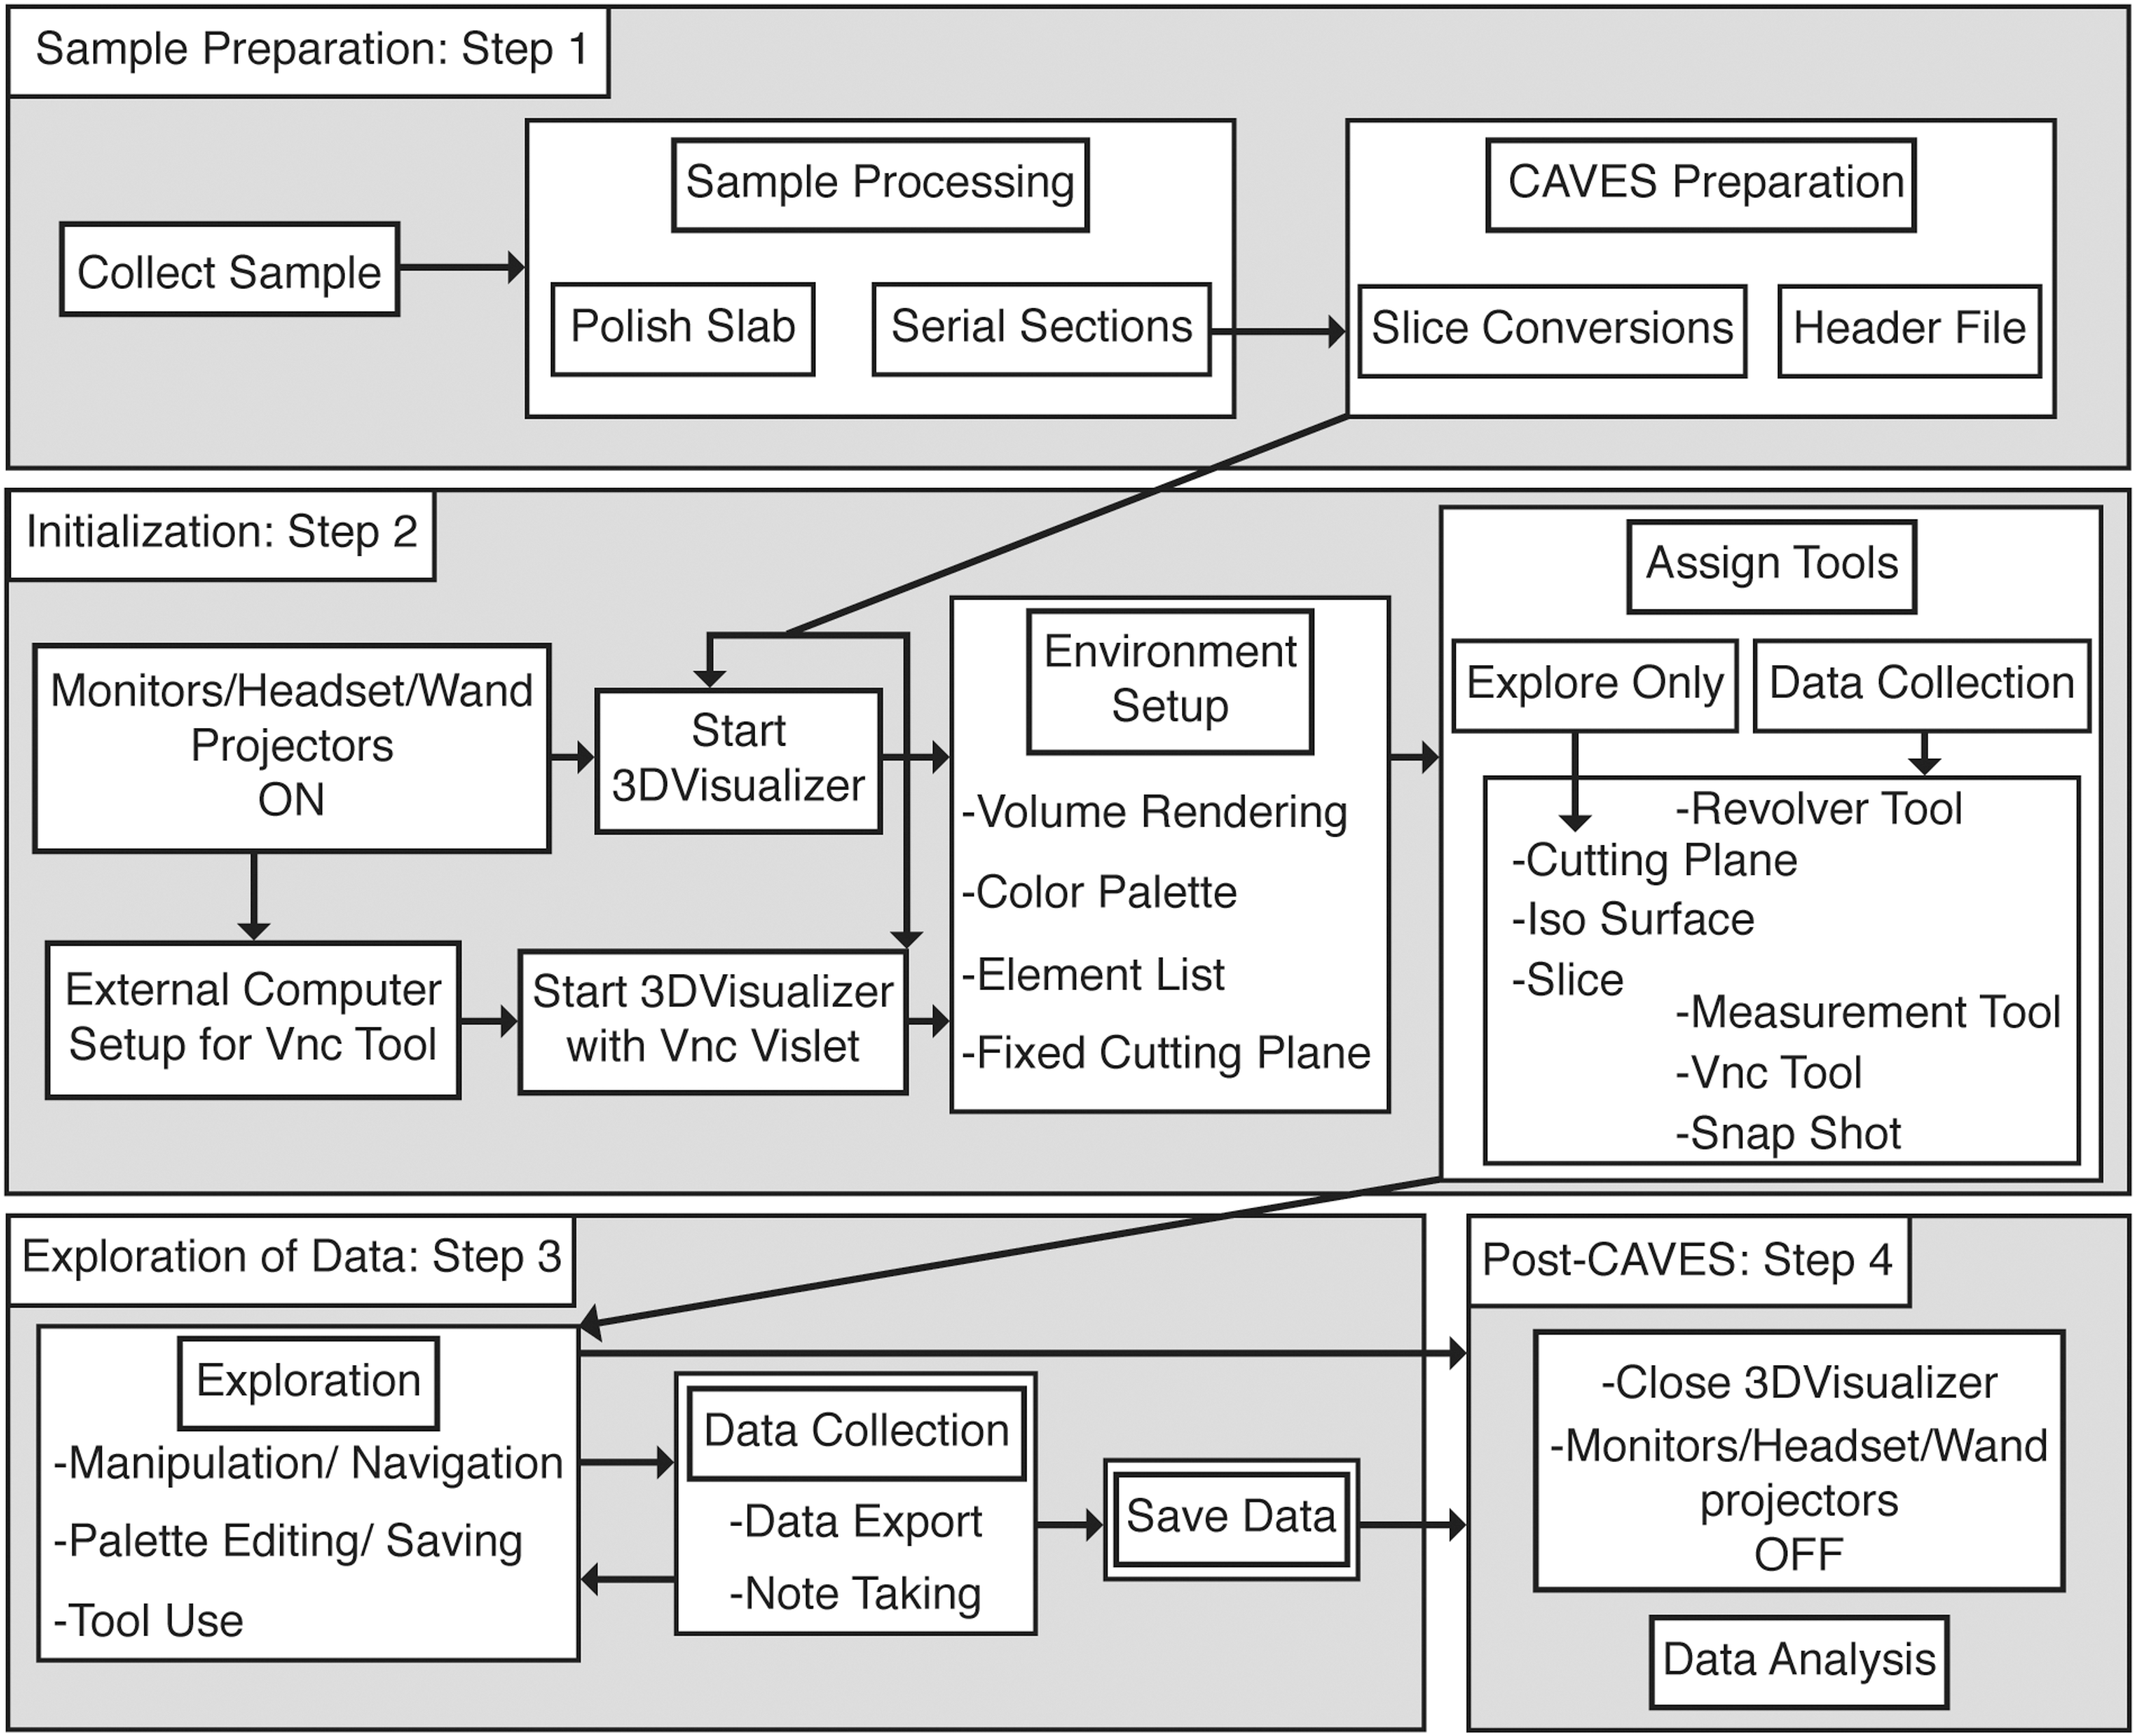
Workflow diagram comprised of four components: sample preparation, initializing the CAVES session, exploration and characterization of data, and post-CAVES analysis.
2. Methods
In general, a productive workflow provides the necessary steps for ideas and hypotheses to be explored with analytical tools that will increase the scientific productivity of users. The workflow must allow the user to explore data in the immersive environment, interpret these data in the context of previous observations, and effectively record relationships and interpretations. For a workflow to be adopted, the user must be able to easily bring ideas and data into the immersive environment, work naturally with appropriate analysis tools, and output results to integrate with other aspects of the research. If a workflow is difficult to use or lacks an effective means by which to record data, it is rarely adopted for substantive research. By contrast, a productive workflow successfully incorporates original questions and triggers new ideas. In our example, the workflow for characterization of ancient microbial structures must allow the user to explore and identify which features are important. This discovery phase is essential because three-dimensional morphologies of the microbial structures are complex and poorly understood. The users must also be able to easily make accurate measurements of spatial relationships among three-dimensional features. Specifically, measurement tools should (1) be natural to operate; (2) allow precise placement of measurement endpoints in three dimensions; and (3) allow the user to focus on deciding what to measure and how to interpret the measurements, rather than how to make them. In addition, the user needs to be able to evaluate the accuracy of measurements in real time and document their context in relation to larger microbial textures. It is also critically important that individual measurements can be reproduced to allow reevaluation of the microbial geometry as hypotheses evolve over time. Finally, results need to be documented outside the immersive environment (i.e., in publications) so they are available for subsequent analysis and can be communicated to the scientific community. We have implemented such a workflow, using the following methods.
2.1. Sample preparation
Evaluation of the sample starts with polished slabs. Structures and spatial relationships between microbial features are observed and described. Hypotheses are developed about growth and three-dimensional spatial relationships. An area of the slab is chosen for three-dimensional reconstruction to test these hypotheses. Most ancient microbial structures cannot be imaged with nondestructive tomographic techniques due to low-density contrast between the microbial components and the enclosing sediments and cements. Because of this, data are generated by serial sectioning and scanning successive sections (see Supplementary Information available online at
2.2. KeckCAVES hardware and software
Visualization of the serial sections is possible with facilities and software developed by KeckCAVES, University of California, Davis. The physical Cave Automated Virtual Environment (CAVE) for viewing three-dimensional data sets consists of four screens: three vertical screens positioned 90° apart and one floor screen. Interleaved right and left eye images are projected onto the four surfaces, and synchronized LCD glasses allow three-dimensional visualization. One user and multiple input devices are tracked for full immersive visualization. The CAVE is controlled by a Linux-operated computer and a locally written virtual reality user interface [Vrui; see Kreylos (2008)].
Visualization algorithms and data structures in KeckCAVES software are optimized for speed to facilitate immersive visualization and real-time interactivity. Interaction modalities focus on direct manipulation of data with the use of various input devices, including handheld, tracked, six-degree-of-freedom (6-DOF) wands. The input device is placed at the point of interest, and actions are performed by using tools assigned to buttons on the device. Actions include basic navigation, visual element creation, measurement of locations and distances, among others (Billen et al., 2008). The application used to view the serial-sectioned data set is 3DVisualizer (Billen et al., 2008). 3DVisualizer allows the exploration and manipulation of any type of three-dimensional gridded data or model results, including image stacks generated by the serial-sectioning process. Vrui and 3DVisualizer are open source and run on Mac OSX and Linux-based operating systems (KeckCAVES, 2011).
2.3. Initialization
Depending on the intent of the session, 3DVisualizer can be started in one of two ways (see Supplementary Information for more details). If the purpose of the session is exploration only, 3DVisualizer is started, and the session begins. If the user will export data (i.e., notes, measurements, images, etc.) during the CAVE session, the user sets up an external computer to receive data by enabling it as a Virtual Network Computing (VNC) server (Richardson et al., 1998). 3DVisualizer is then started with the VncVislet, which allows data to be sent from within the CAVE to the external computer. The VncVislet maps the desktop of an external computer into the CAVE as a window; it provides users in immersive environments access to all information available on a normal desktop. The VncTool allows data to be sent from inside the CAVE to applications that run on an external computer such as a text editor or spreadsheet program.
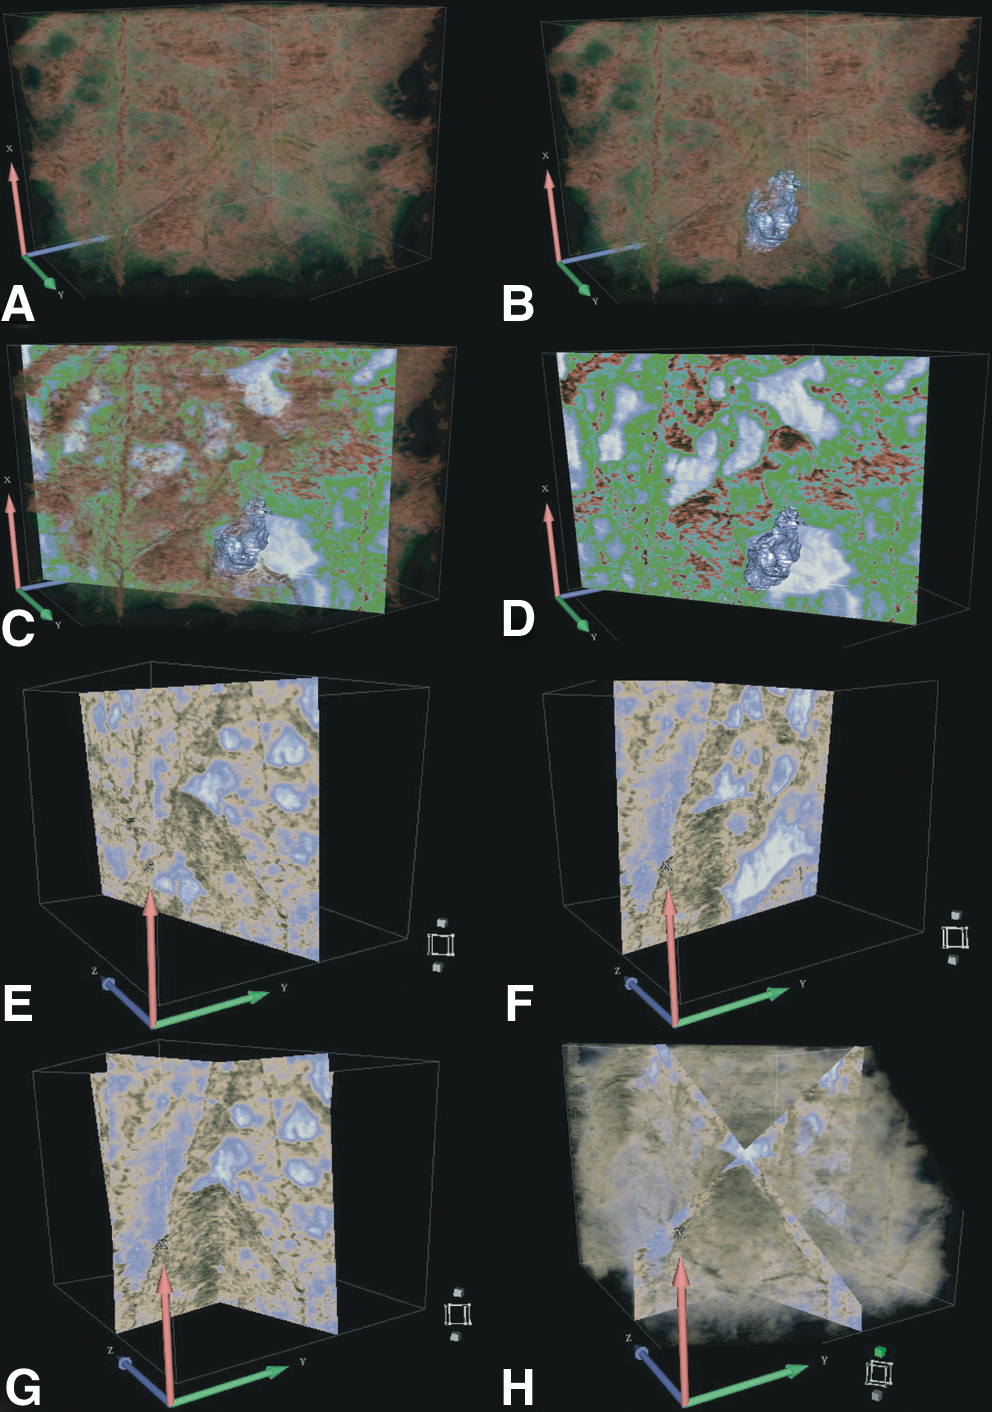
Within the CAVE, we start with a rendered volume, a color palette and transparency editor, and a fixed cutting plane. The virtual microbialite consists of a volume rendered by using color and transparency values tied to the grayscale values of the input images. The user can interactively modify the color and transparency assignments in the palette editor density window, as well as save palettes for future use or load pre-existing color palettes (Fig. 1D–F). Typically, the internal carbonate cements are made transparent, and the microbial structures, defined by dark organic material in fenestrate microbialites, are rendered opaque and in multiple colors to visualize the microbial components in isolation.
The fixed cutting plane is useful for exploring the three-dimensional microbial morphology in ways that are not possible with a physical rock sample. A cutting plane (Table 1) defines a boundary on one side of which none of the rendered volume is displayed. Once a fixed cutting plane is created (Fig. 1D–F), it can be positioned anywhere within the CAVE, and the user can pull the rendered volume through the fixed cutting plane to reveal internal structures. Different vantage points can be achieved with simple rotations and translations of the rendered volume relative to the fixed cutting plane. The user can leave the fixed cutting plane and volume in place while performing other visualization functions, moving them only as needed.
2.4. Exploration and data collection
After setting up the basic environment, the user can begin to focus on exploring the data volume (see Supplementary Information for more details). This exploration stage is characterized by the user observing and becoming familiar with the features in a new data set, as well as mentally placing them into the context of observations of polished slabs. The user develops the scientific framework for recognizing, interpreting, and characterizing the three-dimensional morphology of structures, and decides which types of measurements will be useful for characterizing sample geometry. Due to the intricacy of many three-dimensional microbial structures, several exploration sessions are often necessary before it becomes clear which features represent the main structural elements of the ancient microbial community and how they should be quantified.
Vrui and 3DVisualizer are equipped with a diverse set of tools for exploration and data collection (Table 1). For example, the user might want to explore the volume by cutting through it via the movement of the hand rather than having a fixed cutting plane. When a cutting plane is assigned to a button on the 6-DOF wand, the user dynamically cuts away the rendered volume between him or herself and the tip of the wand (see Supplementary Video). This type of cutting plane is very effective for exploring the geometry of a sample. To highlight specific structures in a sample, the user can use the isosurface tool to create an opaque surface that follows connected voxels (three-dimensional pixels) with the same value (Table 1). Isosurfaces are particularly useful for outlining cement-filled voids in the microbialites (Fig. 3A—D). To compare three-dimensional structures with those identified during two-dimensional analysis, the user creates an opaque plane through the data, using the slice tool (Table 1). The opaque slice allows the user to see the projection of three-dimensional structures into two dimensions, rendering them as they would appear in a polished slab (Fig. 3E–H). Multiple isosurfaces and slices can be created. They can be interactively turned on and off, as can the sample volume, so that only the desired elements are visible while continuing to work (see Supplementary Video).
If quantitative data will be collected, more tools are required. Typical tools used for characterizing microbialites include those for measuring distances and angles, recording snapshots that show the measurements in the context of the rendered volume, and sending measurements and images to the external computer. With the cutting plane, isosurface, and slice tools, the number of tools exceeds the number of buttons available on most input devices. Thus, we use a “revolver tool,” which allows the user to assign six functions to a pair of buttons (Table 1). The user can then cycle through each assigned function to the desired tool when necessary. The ability to switch tools easily is absolutely essential for a smooth, productive workflow when the user wants to document results using the measurement tool, VncTool, and snapshot tool (Table 1). The measurement tool allows the user to measure positions, distances, and angles within the data (Fig. 4). In the microbialites, we position the data volume and cutting plane such that target structures are clearly visible. We then use the measurement tool to define a plane that approximates the orientation of the structure, and we test the fit of the plane to the structure by moving the data containing measurement markers relative to a fixed cutting plane. Once a desired measurement is taken, the results are exported to the external computer with the VncTool (see Supplementary Video). Measurements can be annotated with the microbial structure type and time stamped from within the CAVE to aid later analysis. The measurements can also be documented with the snapshot tool, which takes a two-dimensional picture of the data outlined by a virtual “viewfinder” attached to the input device. The measurement markers are included in the snapshot, which allows the user to capture a visual reference of the measured features so that they can be revisited as necessary. The snapshot tool also allows the user to document what is being explored or measured within the CAVE. The ability to record images and quantitative observations from within the CAVE is critical to making a complete and productive workflow in the visualization environment.
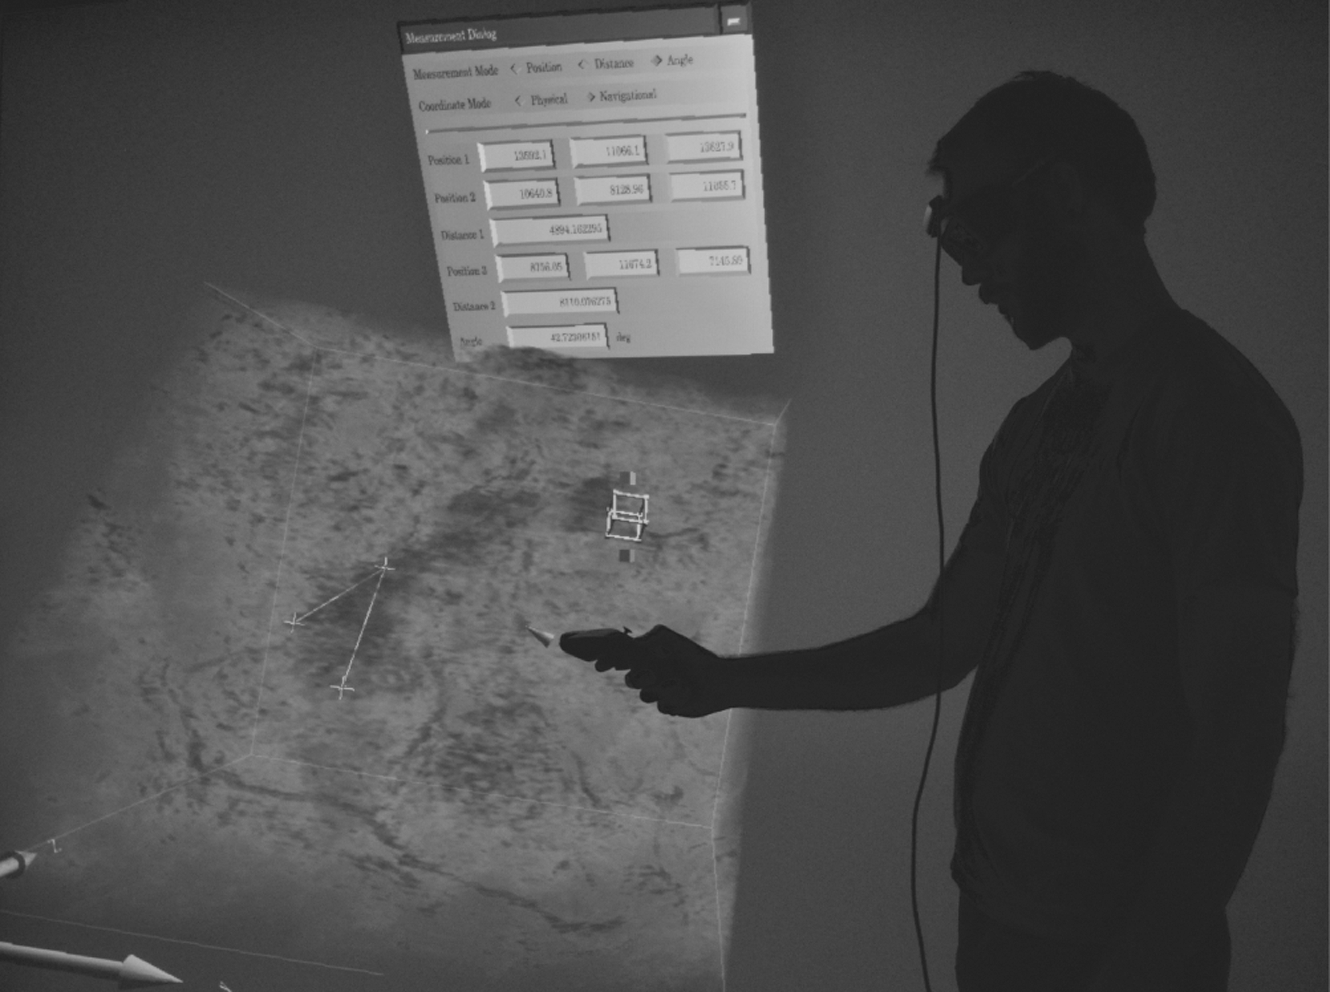
A user analyzing the fenestrate microbialite sample in the CAVE. The Measurement Dialog window is in the background. The cube between the user and volume represents a cutting plane assigned to a Virtual Input Device; it remains fixed in space. Three white points connected by lines within the sample represent the Measurement Tool markers. They are placed on a surface representing a support with ORZ in the three-dimensional volume.
2.5. Post-CAVES
During a typical work session, the user repeats the exploration, measurement, and documentation steps many times. Once the visualization session is over, exported data (i.e., measurements and snapshots) are available for further analysis such as calculating the relative orientations of features, comparing the geometry of structures, and so on. For this study, one of the authors (Stevens) spent a dozen sessions in the CAVE exploring the sample and collecting data. From his exported data, we calculated the dips of structures, using the planes defined by the measurement tool and a horizontal plane in the sample. We also used snapshots from within the CAVE to produce most of the images in this paper.
3. Microbialite Results
Analysis of polished slabs and scanned images revealed that supports in these plumose microbialites are dipping from 27° to 88° and can be divided into supports with organic-rich zones (ORZ) and supports without ORZ (Fig. 1A–C). Supports with ORZ have diffuse inclusions draping or hanging down from them; on average, inclusions extend 3.8±1.3 mm (N=9, 1σ) below the support. The average length of a support with ORZ in the polished slab is 23±10 mm (N=9). They appear orientated more horizontally than vertically (27° to 60°, with an average of 45±13°, N=9). The average length of a support lacking ORZ in the polished slab is 25±8 mm. They are orientated subvertically (75° to 88°, with an average of 81±5°, N=9).
Based on the observations made in two dimensions, the hypothesis that a critical angle exists at which a support structure has, or lacks, diffuse organic inclusions below the structure was developed. However, polished slabs provide only apparent dip due to the orientation of the polished surface relative to the dipping support; to measure the true dip, the three-dimensional orientation of supports has to be determined (Fig. 3E–H). This could be accomplished by using a slab with two polished surfaces that intersect the same support if one assumes the support is planar, but this process is extremely time consuming and would allow characterization of only a few structures; thus surface orientations were not measured from slabs. Initial exploration of the reconstructed sample in the CAVE confirmed that supports are sharply defined planar surfaces, some associated with ORZ and some without. Differences in true dip were also confirmed between supports with and without ORZ, but no low-dipping supports were identified; all apparently shallowly dipping surfaces in polished slabs were revealed to be steeply dipping surfaces in three dimensions.
We measured 18 supports in three-dimensional space in the CAVE, using the Vrui Measurement Tool. Three points were placed on each support to define a plane, and we used them to calculate the true dip of the measured structure. True dips were distinctly different between the nine supports with ORZ and nine without an ORZ (Fig. 5). Of the nine supports with ORZ, seven of them dipped 70° to 75°, with two more shallowly dipping, producing an average of 71±3° (1σ). Of the nine supports lacking ORZ, all dip between 85° and 90°, with an average of 87±2° (Fig. 5). Thus, there is a range of dips (60° to 75°) for supports with ORZ that is larger and distinctly different than the narrow dip range (85° to 90°) of supports lacking an ORZ. These results confirm the observation that arose from analysis of polished surfaces, which was that the two types of supports have distinct dips, but the results also demonstrate that all supports are steeply dipping and there is a 10° gap in dips between the steepest supports with ORZ and the shallowest without an ORZ. There appears to be no gradation between supports with and without ORZ.
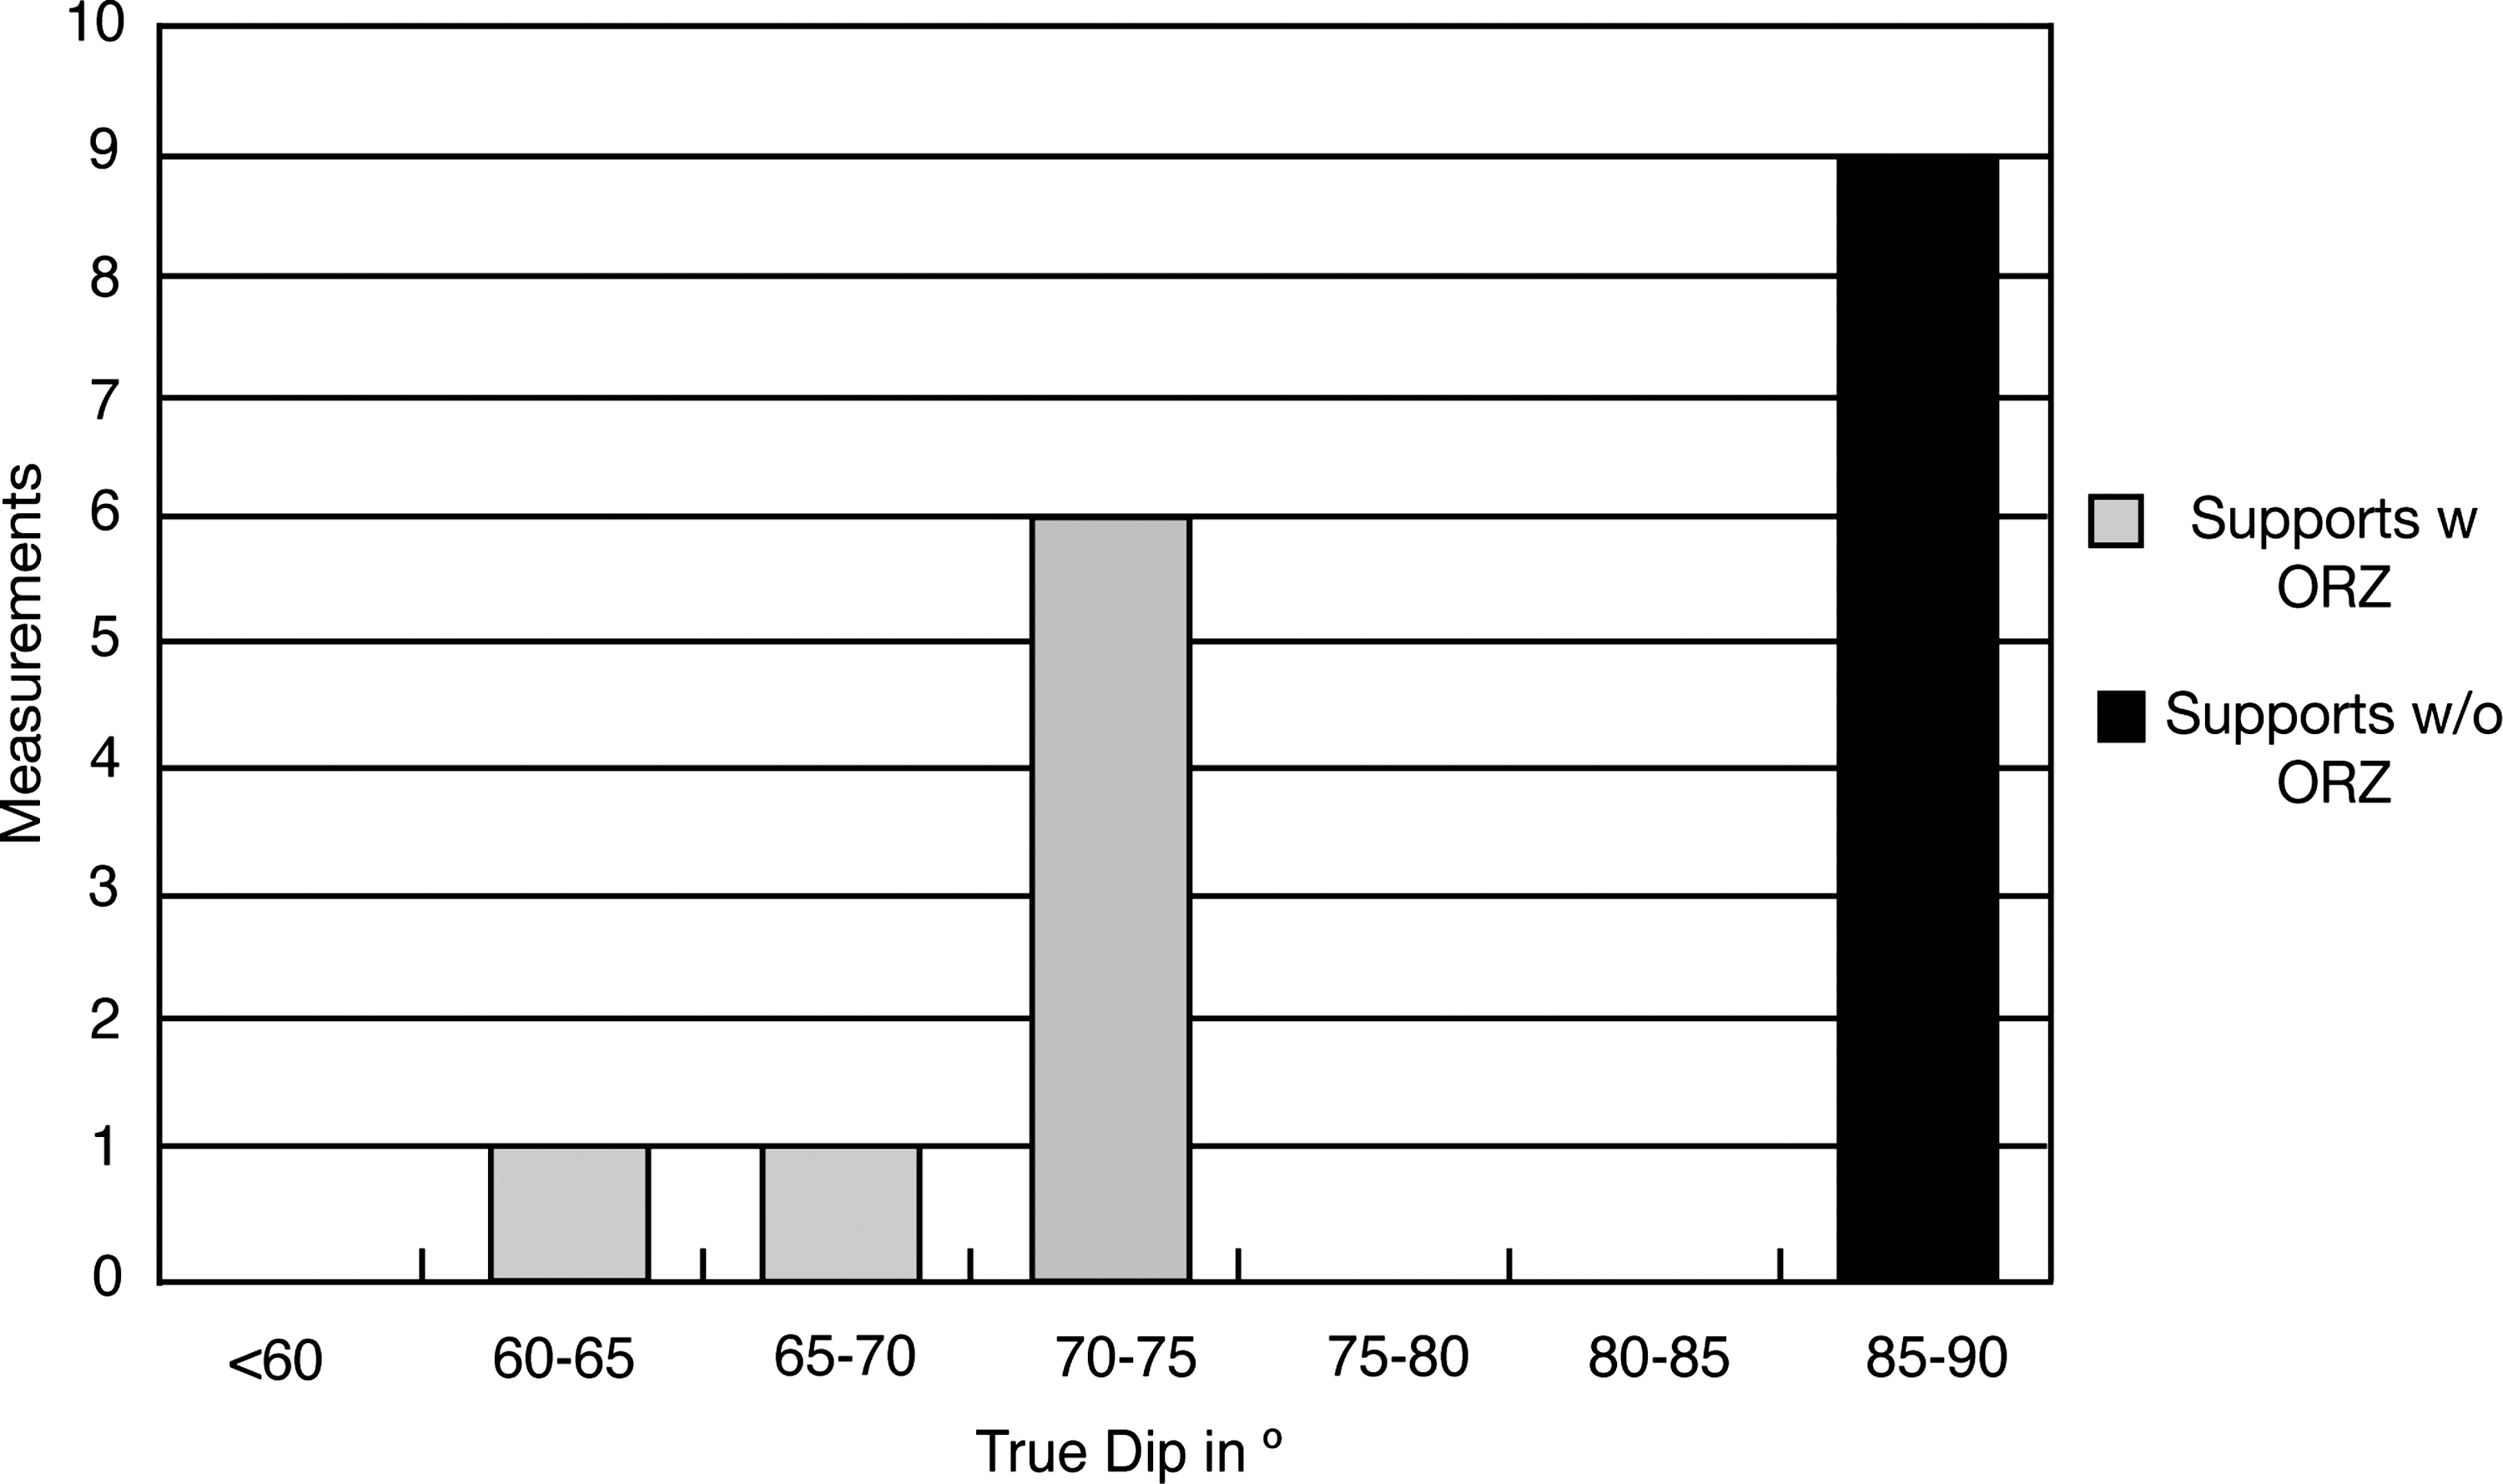
Distribution of slopes of supports with ORZ (gray) and supports without ORZ (black). The slopes were calculated from measurements of supports taken during three-dimensional analysis. Results show that all supports dip steeply and there is a 10° distinction between supports with ORZ and supports without ORZ.
4. Discussion
Although we do not yet have a growth model for these structures, results suggest that growth of the two types of supports differ from each other. The strong correlation between the orientation of supports and the neighboring microbial textures requires a subdivision of the growth environments within the microbial structures; the gap in dip angles implies a difference in growth habit for the communities that form the two types of supports. Either a less steeply dipping support created a niche for the communities composing the ORZ, or growth of the community forming the ORZ promoted a lower dip in associated supports.
These microbial results required a workflow that allows the user to identify areas of interest during the discovery phase and then become fully engaged in the immersive environment and make accurate quantitative observations of spatial relationships among microbial features. 3DVisualizer running on the Vrui library in a CAVE environment provided the necessary infrastructure for a productive workflow. Specifically, the analysis tools are natural to operate and allow the user to focus on deciding what to measure and how to interpret the measurements. Finally, the workflow allows users to evaluate the accuracy and relevance of measurements in real time, save data for further analysis, and document their findings to be shown outside of the immersive environment, all of which provide for a productive research environment.
5. Conclusion
Three-dimensional analysis of fenestrate microbialites in the University of California, Davis, KeckCAVES revealed that two distinct types of microbial supports are present. The distinct orientations of the two types of supports strongly suggest that they reflect different microbial growth processes. These results were obtained through the implementation of an effective workflow that allowed measurements of the three-dimensional orientations of microbial structures. Previous barriers to use of immersive environments have been reduced with improved software approaches and workflow. Specifically, 3DVisualizer provides a user-friendly environment with a workflow promoting efficient manipulation and analysis of data. Users can explore data intuitively, interpret these data in the context of previous observations, and record relationships and interpretations. Having an immersive environment that both facilitates accurate visual characterization and provides convenient mechanisms to document observations made within the environment is highly productive. Until now, these were the missing components required for the characterization of intricate microbialite morphology. As the workflow, software, and CAVE system evolve, the ability to identify, document, and characterize microbialite morphology will continue to improve.
Footnotes
Author Disclosure Statement
The authors have no actual or potential conflicts of interest (financial or other) in association with this manuscript.
Acknowledgments
The authors wish to thank all participants of the KeckCAVES collaboration for their numerous contributions to the ideas, workflow, and software described here. In addition, the reviewers provided very valuable comments that led to significant improvements to the presentation of our results. This research was funded by NSF Grant OCI-0753407 and a gift from the W.F. Keck Foundation.
Abbreviations
6-DOF, six-degree-of-freedom; CAVE, Cave Automated Virtual Environment; KeckCAVES, Keck Center for Active Visualization in Earth Sciences; ORZ, organic-rich zones; VNC, Virtual Network Computing; Vrui, Virtual Reality User Interface.
References
Supplementary Material
Please find the following supplemental material available below.
For Open Access articles published under a Creative Commons License, all supplemental material carries the same license as the article it is associated with.
For non-Open Access articles published, all supplemental material carries a non-exclusive license, and permission requests for re-use of supplemental material or any part of supplemental material shall be sent directly to the copyright owner as specified in the copyright notice associated with the article.