
Abstract
Microorganisms have been found to etch volcanic glass within volcaniclastic deposits from the Ontong Java Plateau, creating micron-sized tunnels and pits. The fossil record of such bioalteration textures is interpreted to extend back ∼3.5 billion years to include meta-volcanic glass from ophiolites and Precambrian greenstone belts. Bioalteration features within glass clasts from Leg 192 of the Ocean Drilling Program were investigated through optical microscopy and Fourier transform infrared (FTIR) spectroscopy of petrographic thin sections. Extended depth of focus optical microscopic imaging was used to identify bioalteration tubules within the samples and later combined with FTIR spectroscopy to study the organic molecules present within tubule clusters. The tubule-rich areas are characterized by absorption bands indicative of aliphatic hydrocarbons, amides, esters, and carboxylic groups. FTIR analysis of the tubule-free areas in the cores of glass clasts indicated that they were free of organics. This study further constrains the nature of the carbon compounds preserved within the tubules and supports previous studies that suggest the tubules formed through microbial activity. Key Words: Infrared—Organics—Bioalteration—Basalt glass. Astrobiology 11, 585–599.
1. Introduction
S
(
Bioalteration textures within basaltic glasses have been observed to be associated with enrichments of carbon and other biologically important light elements (e.g., Banerjee and Muehlenbachs, 2003). The origin of these elements has been extensively investigated to infer a biotic or abiotic origin. Electron probe microanalysis detected carbon, potentially present in an organic form. This is implied, as the carbon was not associated with cations such as Ca, Mg, or Fe, which may indicate a carbonate source if present (Banerjee and Muehlenbachs, 2003). Tubular bioalteration structures in Ontong Java Plateau (OJP) glass shards that were stained with ethidium bromide revealed the probable presence of nucleic acids (Banerjee and Muehlenbachs, 2003). Organic carbon associated with tubular bioalteration was also detected by Benzerara et al. (2007) via synchrotron transmission X-ray microscopy. These bioalteration textures and associated geochemical features have been used as a signature of former microbial activity.
The nature of the organic compounds associated with bioalteration textures in basaltic glass, however, has not yet been fully characterized. In the present study, attenuated total reflectance (ATR) Fourier transform infrared (FTIR) spectroscopy was employed to further elucidate the nature of carbon found to be associated with bioalteration textures within samples of volcaniclastic tuff from the OJP, which was previously studied by Banerjee and Muehlenbachs (2003) and Izawa et al (2010a).
2. Geological Setting and Sampling
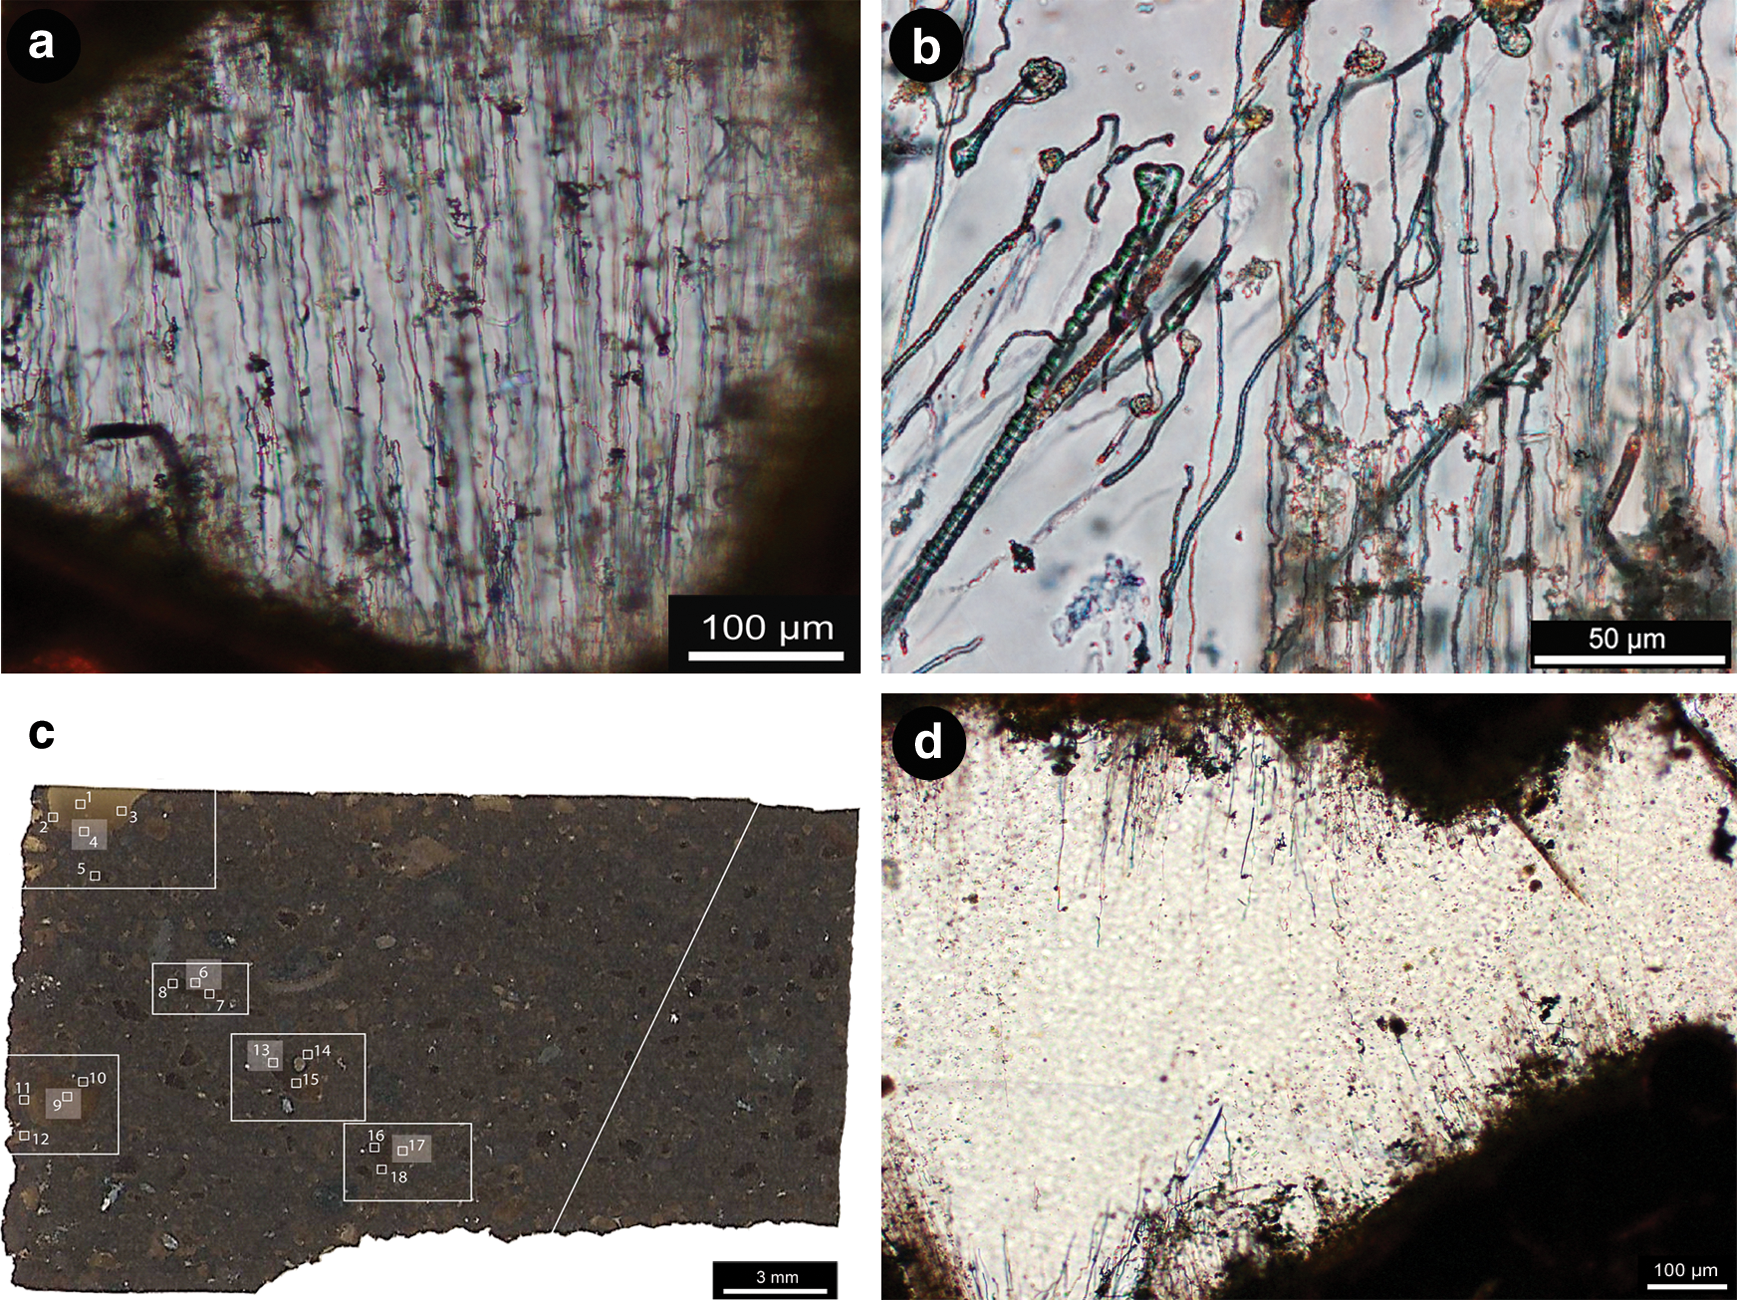
The OJP is the world's largest volcanic oceanic plateau and covers >1.6 million km2 with a crustal volume of 40–50 million km3 (Mahoney, 1987; Coffin and Eldholm, 1993). The rock samples for this study included fine to coarse-grained volcaniclastic rocks with tuff, lapilli tuff, and lapillistone. For a detailed description of all units recovered see Mahoney et al. (2001). The volcaniclastic rocks of interest consist of ash- to lapilli-sized lithic clasts and vitric shards; accretionary lapilli; armored lapilli; and crystal fragments set in a matrix of fine-grained vitric and lithic ash, clay, and other alteration minerals cemented by smectite, analcime, calcite, rare celadonite, and several zeolites (Mahoney et al., 2001; Banerjee et al., 2004). Vitric clasts, either completely altered to clay or variably altered with fresh glass cores, were studied with the intent to observe microbial alteration textures in volcanic glasses (Fig. 1a) (e.g., Banerjee and Muehlenbachs, 2003). These samples contain some of the best-preserved, highly diverse, and abundant evidence of microbial alteration of volcanic glasses (Fig. 1b). Two distinct types of microbial alteration were observed as endolithic microborings in the basaltic glass, termed tubular and granular textures. Tubular textures (Fig. 1a, 1b) are the subject of this study. They are more easily recognized, albeit less common, as they are distinctive and larger, typically a few microns in diameter and up to hundreds of microns in length (Banerjee and Muehlenbachs, 2003).
In both tubular and granular textures, it is inferred that microbes colonize exterior surfaces or surfaces of cracks and begin to dissolve the rock through changes in pH at their contact area (e.g., Thorseth et al., 1995; Torsvik et al., 1998; Furnes et al., 2001a, 2001b; Banerjee and Muehlenbachs, 2003; Staudigel et al., 2006, 2008a, 2008b). Bioalteration textures are initially hollow but may be filled and preserved by a variety of authigenic mineral phases, including phyllosilicates, zeolites, Fe-oxyhydroxides, and titanite (Banerjee and Muehlenbachs, 2003; Staudigel et al., 2006; Benzerara et al., 2007). Early mineralization of bioalteration textures with minerals, such as titanite, enables their preservation for geologically long periods of time (e.g., Furnes et al., 2004; Banerjee et al., 2007, 2008; Staudigel et al., 2008a; Izawa et al., 2010a, 2010b). Titanite (CaTiSiO5) is a particularly important mineral that contributes to preservation of traces of microbial activity in basaltic glass (e.g., Furnes et al., 2004; Banerjee et al., 2006, 2007, 2008), as it can enable the preservation of morphological and chemical signatures of biological activity, either within the titanite itself or by preserving biologically important elements at grain boundaries (Furnes et al., 2004; Banerjee et al., 2006, 2007, 2008). Observation of cross-cutting relationships (e.g., Furnes et al., 2004), in situ detection of titanite in seafloor basaltic glasses (Izawa et al., 2010b), and direct dating of titanite in tubular bioalteration textures from metamorphosed basaltic glasses (Banerjee et al., 2007) have all indicated that tubule formation begins soon after basaltic glass emplacement and tubule formation and mineralization occur penecontemporaneously.
The samples for this study were recovered during Leg 192 of the Ocean Drilling Program (ODP) from Hole 1184A on the eastern lobe of the OJP at a water depth of 1661.1 m. Thin section 1184A 13R3 145-148A of glass-rich volcaniclastic core was used for the bulk of this study (Fig. 1c) to identify biomolecules within areas that host abundant tubular bioalteration textures (Fig. 1d). Reflectance FTIR spectroscopy was used, as characteristic fundamental vibrational modes that correspond to molecular bonds in organic molecules can be detected and characterized in the mid-IR region, 4000–700 cm−1 (2.5–14.2 μm).
3. Methods
3.1. Contamination
Contamination is an issue that strikes almost every form of life-detection research. Further, the issue of contamination leads inevitably to a fundamental philosophical problem: it is impossible to prove non-existence. It is possible, however, to exclude many potential sources of contamination and thus greatly reduce the probability that contamination exists. To this end, we prepared the thin sections studied by using alumina polishing compounds and non-organic lubricants for polishing. The section was kept in a sealed container and handled minimally and only with sterile nitrile gloves. The section was Ar sputtered to remove surface contamination prior to analysis.
3.2. Optical petrography
The OJP thin section was polished to produce a 30 μm thick section with a smooth surface for both optical imaging and reflectance FTIR measurements. This section contained >20 glass shards of various sizes, containing abundant tubules (Fig. 1d). The bulk of the sample is fine-grained and nearly opaque, which rendered transmitted light ineffective for imaging; however, this was not the case for the glass shards and tubules. These were imaged in plane-polarized light with a Nikon Eclipse LV100 POL petrographic microscope equipped with a Nikon DS-Ri1 12 Mpixel camera. Images of tubule-rich glass were acquired at ∼0.4 μm spacing in the z direction, with the in-focus areas merged to create an extended depth of focus image stack of 30–40 images. This was accomplished by using Nikon Elements software.
3.3. Infrared and Fourier transform infrared spectroscopy
Infrared spectroscopy is based on the absorption of polychromatic electromagnetic radiation by matter due to the different vibrational modes of chemical bonds within a substrate. For a molecule to show IR absorptions, that is, to be “infrared-active,” an electric dipole moment of the molecule must change during the vibration. The larger the dipole moment change, the more intense the absorption band observed. An IR spectrum is commonly obtained by passing IR radiation through, or reflecting it from, a sample and determining what fraction of the incident radiation is absorbed at each particular energy. The energy at which any peak in an absorption spectrum appears corresponds to the frequency of the vibration of part of a molecule, which is diagnostic for various functional groups within molecules. For a detailed description of IR spectroscopy, molecular symmetry, and group theory, see books by Diem (1993), Günzler and Gremlich (2002), and Stuart (2004).
Fourier transform infrared spectroscopy is based on the idea that interference of radiation between two beams yields an interferogram. The basic principles and advantages of modern FTIR spectroscopy were explained in detail by Diem (1993) and Griffiths and de Haseth (1986). Various FTIR measurement techniques can be used; however, ATR is the technique used here. In FTIR-ATR spectroscopy, the IR beam is reflected within an IR-transparent internal reflection element. An evanescent wave of the same frequency as the incoming IR light penetrates through the interface into the optically thinner medium, such as a thin section, that is adjacent to the interface. A sample spectrum is therefore obtained from a thin layer adjacent to the crystal surface, with the depth of penetration limited to a fraction of the wavelength (Harrick, 1967; Goos and Hähnchen, 1964). Most sample preparation methods for FTIR spectroscopy can be destructive; however, the ATR tool enables analyses to be conducted directly at specific sites of interest within a thin section, which preserves sample integrity such that the sample can be used in other studies.
Over the last 50 years, IR spectroscopy has been successfully applied to the characterization of chemical compounds within materials. More recently, transmission IR microspectroscopy has been employed for characterizing individual microscopic components of sedimentary organic matter (Thiessen, 1925; Brenner, 1984; Blob et al., 1987; Landais and Rochdi, 1990; Rochdi and Landais, 1991). So far, most applications of IR and micro-IR techniques have been concentrated on the relative abundance of aliphatic C–H, aromatic C=C, and acid C=O bands. The functional groups of peptide and protein structures, polysaccharides, phospholipids, and nucleic acids can be observed and yield a spectrum with a high content of information. The aliphatic stretching region in particular will be described in this study, which was first unraveled by Painter et al. (1981) on the IR study of coal. The authors identified five bands in the stretching vibration region between 3000 and 2800 cm−1, which correspond to the CH3 asymmetrical stretching vibration at 2956 cm−1, the CH2 asymmetrical stretching vibration at 2923 cm−1, the C–H stretching vibration at 2891 cm−1, the CH3 symmetrical stretching vibration at 2864 cm−1, and the CH2 symmetrical stretching vibration at 2849 cm−1. There can be slight deviations from these values by up to 8 cm−1, depending upon the resolution of the instrument being used. This study is also interested in the minerals found in association with the bioalteration structures. The “fingerprint region” of the mid-IR (between 500 and 1200 cm−1) allows for the observation of not only organics as described above but also the absorption bands of minerals created by vibrations within a crystal lattice.
Fourier transform infrared–attenuated total reflectance spectroscopy was carried out on all samples by using a Bruker IFS55 FTIR with a Baseline Horizontal ATR attachment equipped with a germanium crystal, under an IRScope II microscope. The IR microscope is a sampling accessory used to obtain IR spectra of very small samples. The microscope provided visual assessment of the sample and condensed the IR beam for spectral acquisition. Analyses of polished thin sections were carried out at Surface Science Western at a spectral resolution of 4 cm−1, with a scan and sample background of 100 scans, over a spectral range of 4000–700 cm−1 (2.5–14.2 μm); analysis focused on a spot size between 50 and 60 μm in diameter. All analyses were calibrated to the ATR-equipped germanium crystal, and atmospheric H2O and CO2 bands were subtracted out. Measurements were carried out on the pure glass thin sections surrounding the samples and the mounting media to identify contaminants and enable the removal of these contaminants from the spectra obtained. However, these media did not impact the analyses in this study. To calculate the integrated band intensities for component bands in the C–H stretching vibrational frequency region mentioned earlier, Fourier self-deconvolution is required to determine the center frequencies of the C–H moieties. A curve-fitting routine was then employed to expand the region. The curve-fitting procedure within the OPUS program was used, based on the damped least-squares optimization algorithm developed by Levenberg and Marquardt (Levenberg, 1944; Marquardt, 1963). The band shape used in the curve-fitting procedure was a linear combination of 100% Lorentzian+Gaussian bands. The residual RMS error was below 10−3 for all fitted data.
To enable ease of understanding of the spectra to follow, refer to Table 1 for a list of the characteristic absorption bands and vibrational modes of the inorganic and organic molecules identified in this study. Spectral bands are assigned with reference to the literature.
Organic bands (indicated by ♣) compiled from Stuart and Ando (1997), Stuart (2004), Tamm and Tatulian (1997), Krimm and Bandekar (1986), Jackson and Mantsch (1995), Arrondo et al. (1993), Schmitt and Flemming (1998). Mineralogy band positions: ◆Dufresne et al. (2009); ×Zhang et al. (2002) and *Verma et al. (2007).
4. Results
Fourier transform infrared–attenuated total reflectance spectroscopic measurements of three representative tubule-rich areas within a number of glass shards are described. Areas observed to be highly distinct from one another were sampled within the glass shards but were found to yield very similar spectra. Measurements were also taken of areas with no observable tubules for comparison. The mid-IR spectrum between 4000 and 500 cm−1 can display characteristic bands of minerals and organic functional groups suitable for the characterization of microorganisms and their constituent molecules. The tubules analyzed in this study are not wide enough to fill the entire measurement area; consequently, there is a strong contribution to the FTIR spectra from the glass and minerals present.
4.1. Tubule-rich areas
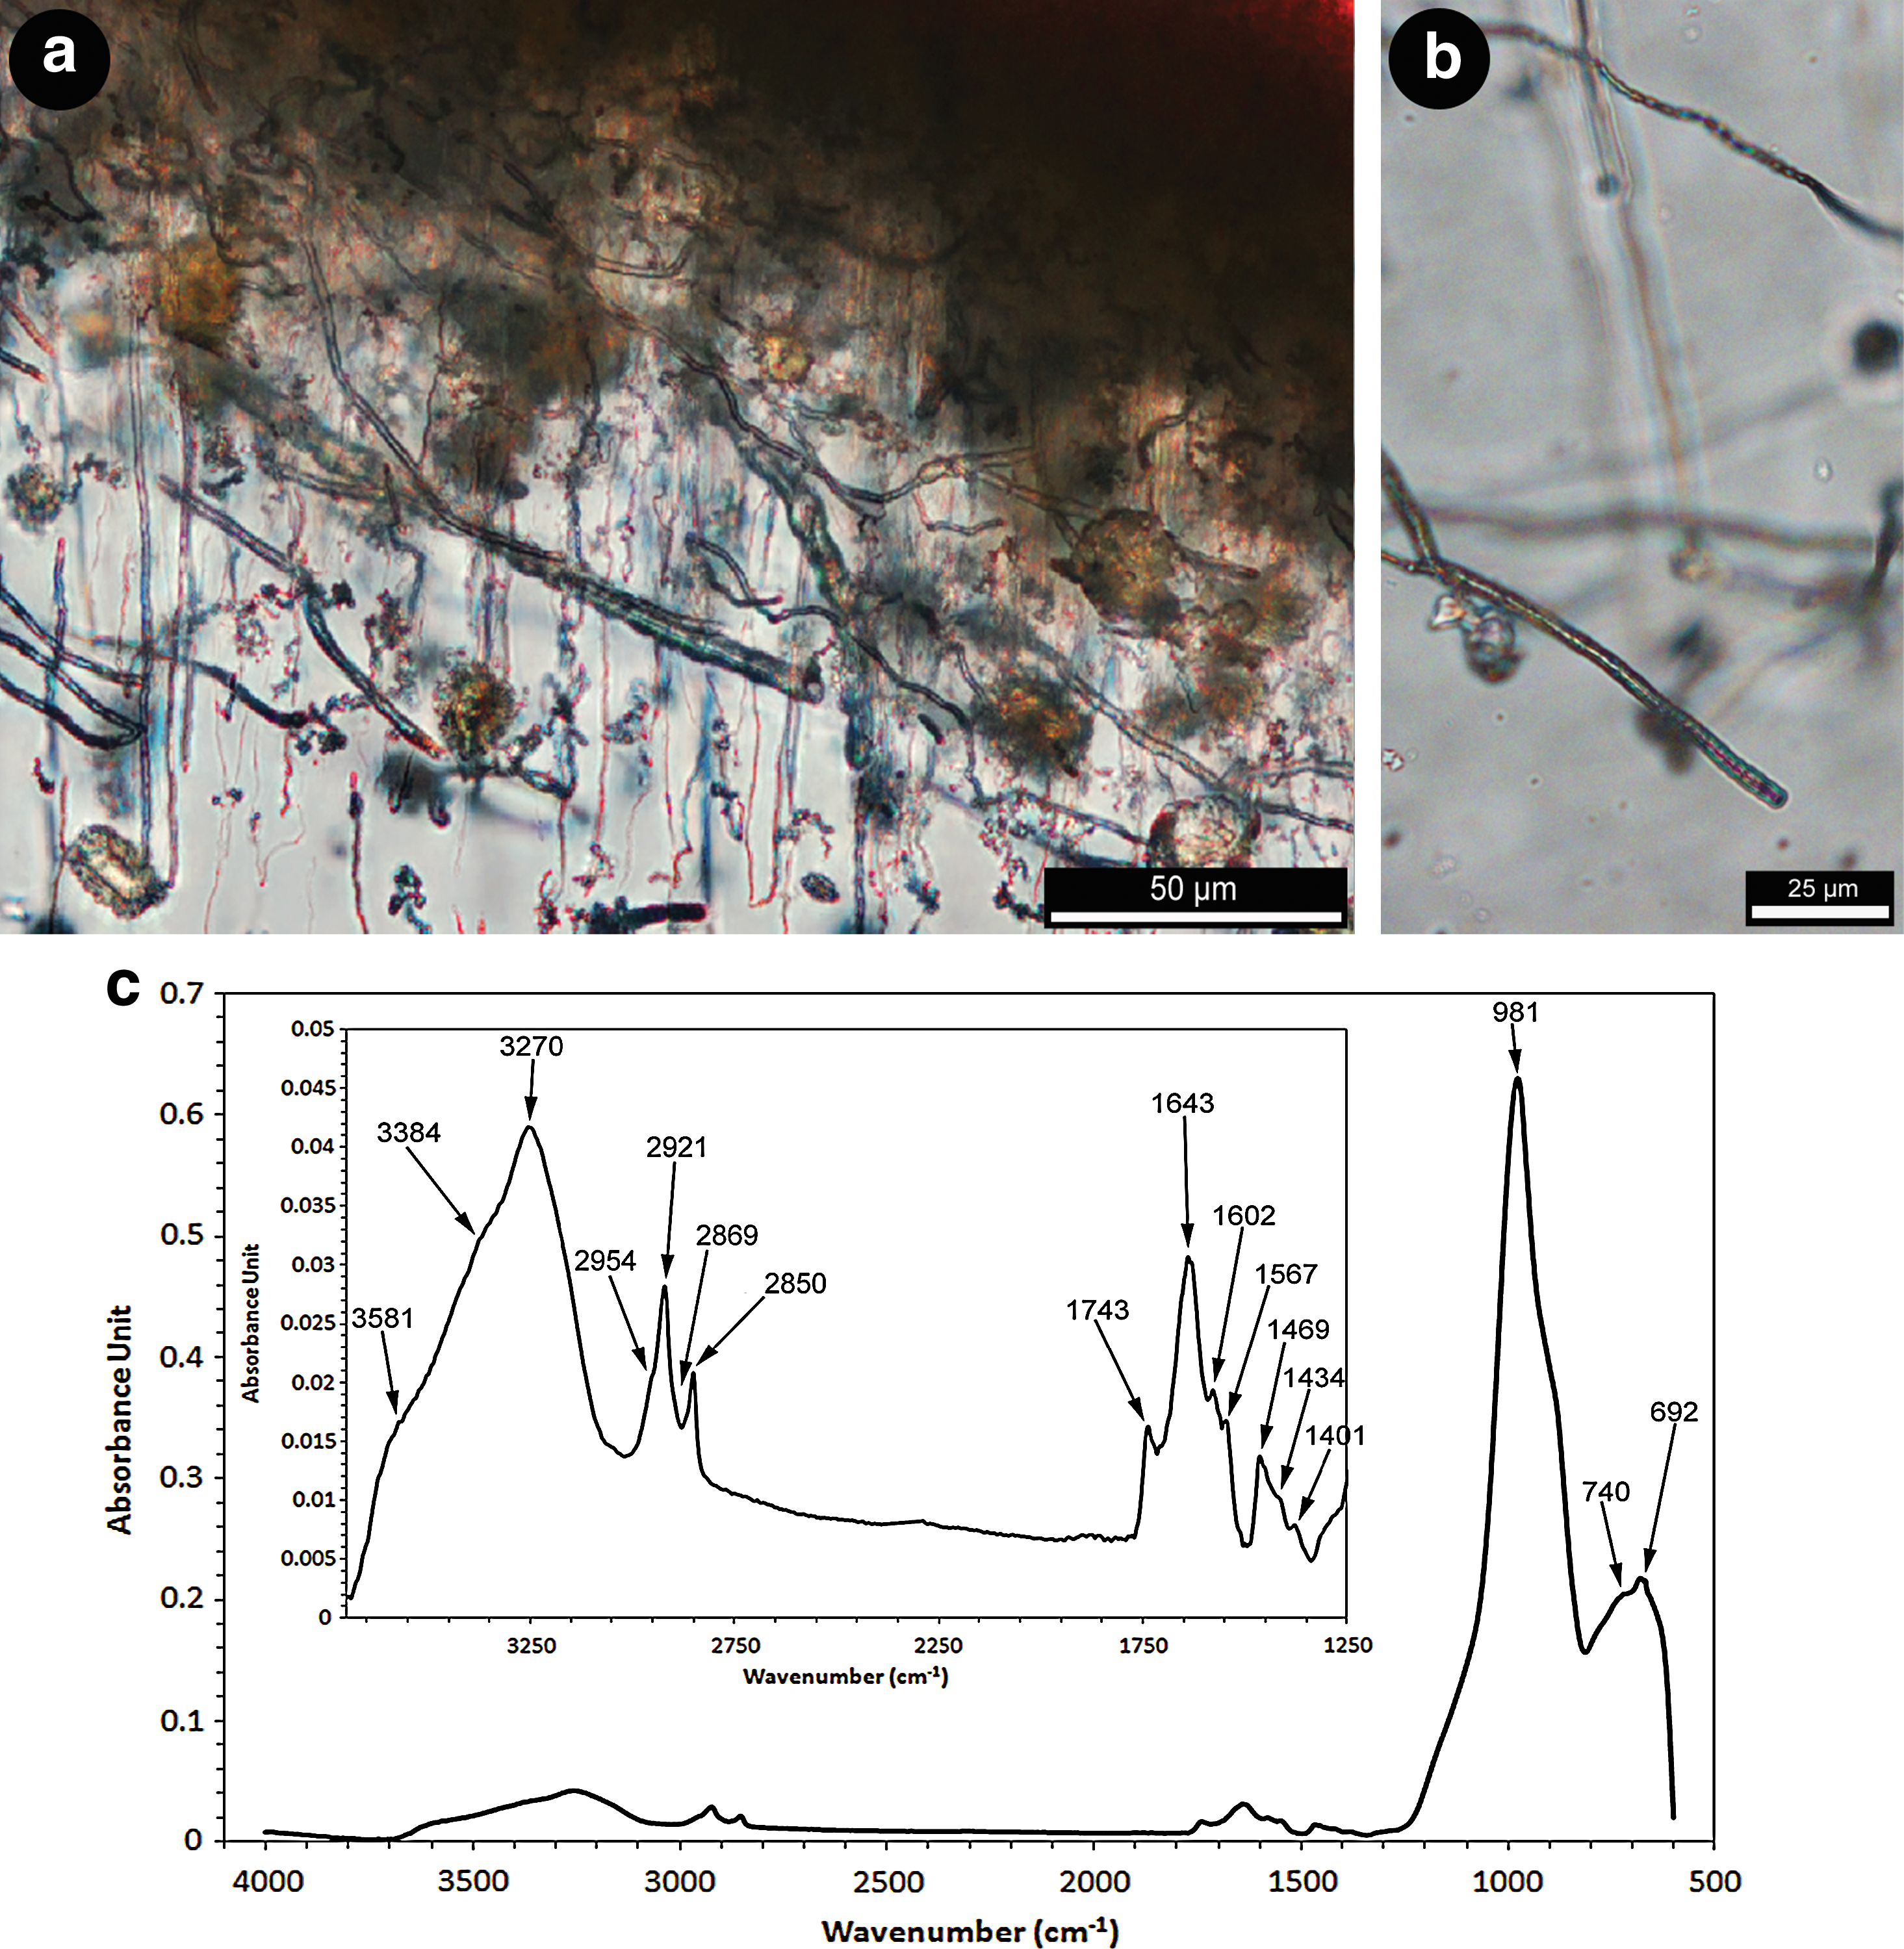
Analyses were first directed at Spot 4 (Fig. 1c), which is located at the edge of a large glass shard (Fig. 2a) and was observed to contain abundant tubules extending from the rim into the clast (Fig. 2b).

Transmitted light images and FTIR absorbance spectra from Spot 4. (
Mineralogy
The FTIR absorption bands displayed in Fig. 2c were obtained at the site shown in Fig. 2b. Bands at 981 and 723 cm−1 are the Si–O asymmetric stretching vibrational mode of SiO4 tetrahedra, and Si–O or Si–O–Al symmetric bending vibrational mode, respectively. The 723 cm−1 band can also be derived as a Ti–O stretching vibrational mode of TiO6 octahedra (Table 1), as can the absorption band observed at 678 cm−1. Absorption bands at 3571, 3403, and 3272 cm−1 in the Fig. 2c inset are assigned to the OH symmetric stretching vibrational mode of partially hydrogen-bonded water molecules, and the asymmetric and symmetric OH stretch of water molecules fully hydrogen-bonded with surrounding water molecules, respectively (Verma et al., 2007). This region of OH bands can be contributed through Si–OH stretching vibrational modes relating to the silicate minerals present, or are hydrogen-bonded to an organic matrix.
Organics
Fourier transform infrared absorption bands of aliphatic C–H moieties can be seen at 2954, 2921, 2865, and 2852 cm−1 (Fig. 2c inset). The shoulder band absorption at 2954 cm−1 and the absorption band at 2921 cm−1 are derived from the asymmetric stretching vibrational modes of CH3 and CH2, respectively. A weak absorption band at 2865 cm−1 relates to the symmetric stretching vibrational mode of CH3, while the symmetric CH2 stretching vibrational mode appears at 2852 cm−1 (see Table 1 and references therein). An absorption band at 1637 cm−1 may be derived from the Amide I C=O stretching vibrational mode (Krimm and Bandekar, 1986). This absorption band frequency, however, overlaps the H2O bending vibrational mode. Shoulder absorption bands appear on the Amide I/H2O band at 1743 and 1700 cm−1, due to C=O stretching vibrational modes (Schmitt and Flemming, 1998, and references therein), and at 1565 and 1548 cm−1, corresponding to Amide II vibrational modes (Krimm and Bandekar, 1986). The absorption band at 1290 cm−1 matches that of the Amide III vibrational mode (Krimm and Bandekar, 1986). An asymmetric bending vibrational mode of aliphatic CH3 is seen at 1459 cm−1 (e.g., Tamm and Tatulian, 1997). Absorption bands at 1434, 1394, and 1320 cm−1 can be identified as C–O–H, CO2, and C–O vibrational modes.
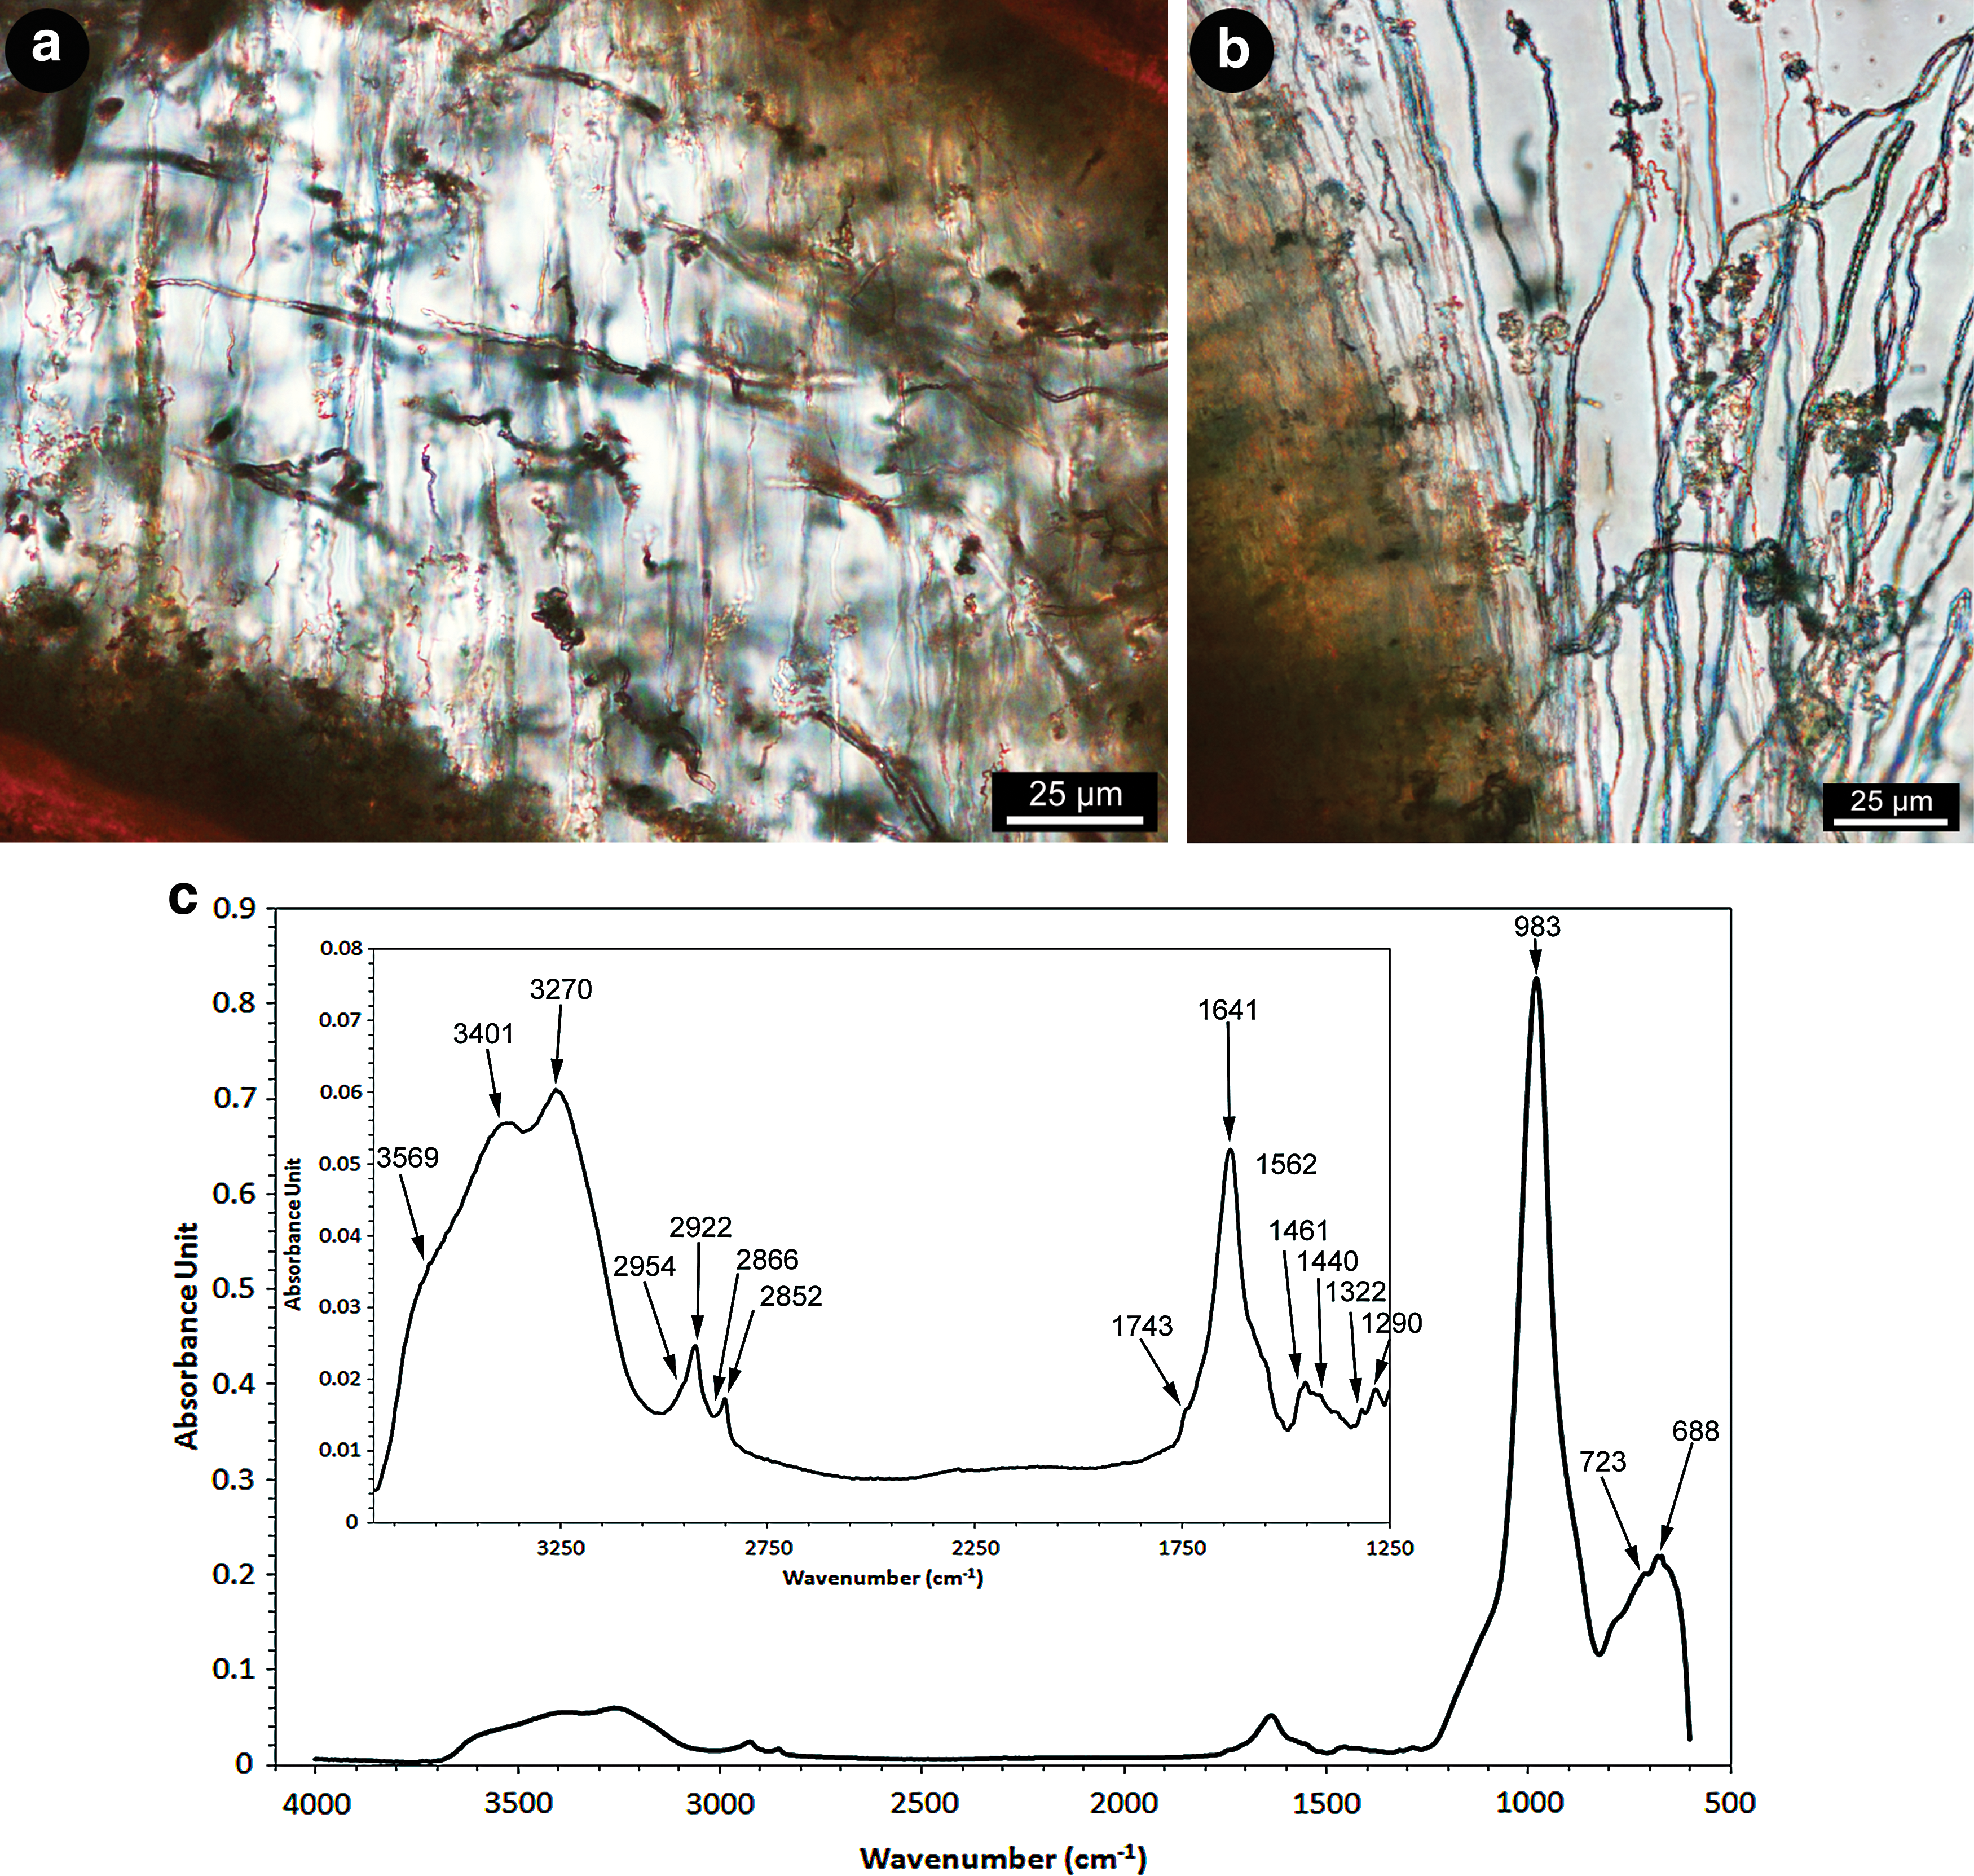
Analyses were also directed at Spot 6 (Fig. 1c), which is located along the palagonite-rich edge of a tubule-rich glass clast (Fig. 3a). An image of one of the tubule-rich areas analyzed is shown in Fig. 3b.
Transmitted light images and FTIR absorbance spectra from Spot 6. (
Mineralogy
An FTIR absorption band occurs at 981 cm−1 that is assigned to the asymmetric stretching vibrational mode of Si–O bonds in SiO4 tetrahedra (Fig. 3c). An absorption band at 740 cm−1 is a Si–O, Si–O–Al symmetric bending vibrational mode or a Ti–O stretching vibrational mode. A Ti–O stretching vibrational mode of TiO6 octahedra is located at 692 cm−1 (see Table 1 and references therein). Absorption bands at 3581, 3384, and 3270 cm−1 are assigned to the symmetric OH stretching vibrational mode of partially hydrogen-bonded water molecules, and asymmetric and symmetric OH stretching vibrational modes of water molecules that are fully hydrogen-bonded with surrounding water molecules, respectively (Fig. 3c inset). The OH absorption bands are contributed through Si–OH stretching vibrational modes or those that are hydrogen-bonded to an organic matrix (Verma et al., 2007).
Organics
Fourier transform infrared absorption bands attributed to organics within the tubule-rich areas are shown in the inset of Fig. 3c. The aliphatic C–H moiety absorption bands appear at 2954, 2921, 2869, and 2850 cm−1, corresponding to the asymmetric stretching vibrational modes of CH3 and CH2, and the symmetric stretching vibrational modes of CH3 and CH2, respectively. An absorption band at 1643 cm−1 may be derived from the Amide I C=O stretching vibrational mode. This same band, however, can be attributed to the H2O bending mode. Shoulder absorptions appear on the Amide I/H2O band at 1743, 1602, and 1567 cm−1. The bands at 1743 and 1602 cm−1 are attributed to the C=O stretching vibrational mode and to either the C–C or asymmetric C=N vibrational modes, respectively, while the 1567 cm−1 band is located at the Amide II absorption band position (Krimm and Bandekar, 1986). An absorption band at 1469 cm−1 relates to an asymmetric bending vibrational mode of aliphatic CH3 or a CH2 scissoring vibrational mode. The absorption band at 1434 cm−1 can be attributed to a C–O–H bending vibrational mode, and the band at 1401 cm−1 may represent the N+(CH3)3 symmetric bending vibrational mode (Tamm and Tatulian, 1997).
Analyses directed at Spot 13 (Fig. 1c) are located within a glass shard that is crosscut by tubule bioalteration features (Fig. 4a, 4b). The clast also contains a zeolite-filled vug in the center and is surrounded by a palagonite rim.
Transmitted light images and FTIR absorbance spectra from Spot 13. (
Mineralogy
Mineralogical FTIR absorption bands are shown in Fig. 4c. The absorption band at 983 cm−1 is from the Si–O asymmetric stretching vibrational mode of SiO4 tetrahedra, while that at 723 cm−1 could be a Si–O or Si–O–Al symmetric bending vibrational mode or a Ti–O stretching vibrational mode. An absorption band at 688 cm−1 represents the Ti–O stretching vibrational mode of TiO6 octahedra. Bands at 3569, 3401, and 3270 cm−1 are assigned to the symmetric OH stretch of partially hydrogen-bonded water molecules, and asymmetric and symmetric OH stretch of water molecules that are fully hydrogen-bonded with surrounding water molecules, respectively (Verma et al., 2007). This region is from the Si–OH stretching vibrations relating to the silicate mineral vibrations around 1000 cm−1, or from hydrogen bonded to the organic matrix.
Organics
Fourier transform infrared spectra were obtained from areas abundant with tubules (Fig. 4b) and are shown in Fig 4c. FTIR absorption bands of aliphatic CH moieties appear at 2954, 2922, 2866, and 2852 cm−1. The shoulder absorption bands at 2954 and at 2922 cm−1 are derived from the asymmetric stretching vibrational modes of aliphatic CH3 and CH2, respectively. The absorption bands at 2866 and 2852 cm−1 relate to the symmetric stretching vibrational modes of CH3 and CH2. There is an absorption band at 1743 cm−1 of the C=O stretch vibrational mode (Schmitt and Flemming, 1998). An absorption band at 1641 cm−1 may be derived from the Amide I C=O stretching vibrational mode. This same band, however, can be attributed to the H2O bending vibrational mode. A shoulder at 1562 cm−1 can be assigned to an Amide II absorption band, and the absorption band at 1290 cm−1 that of an Amide III vibrational mode (Krimm and Bandekar, 1986). The absorption band at 1461 cm−1 is derived from an asymmetric bending vibrational mode of aliphatic CH3. Absorption bands at 1440 and 1322 cm−1 are tentatively assigned to C–O–H bending and C–O stretching vibrational modes.
4.2. Tubule-free areas
The cores of glass clasts that were observed to contain no tubules (Figs. 5a and 6a) were also analyzed to allow comparisons with the tubule-rich rims. Spot 9 and Spot 17 (Fig. 1c) are tubule-free cores of large irregular glass clasts (Figs. 5b and 6b).
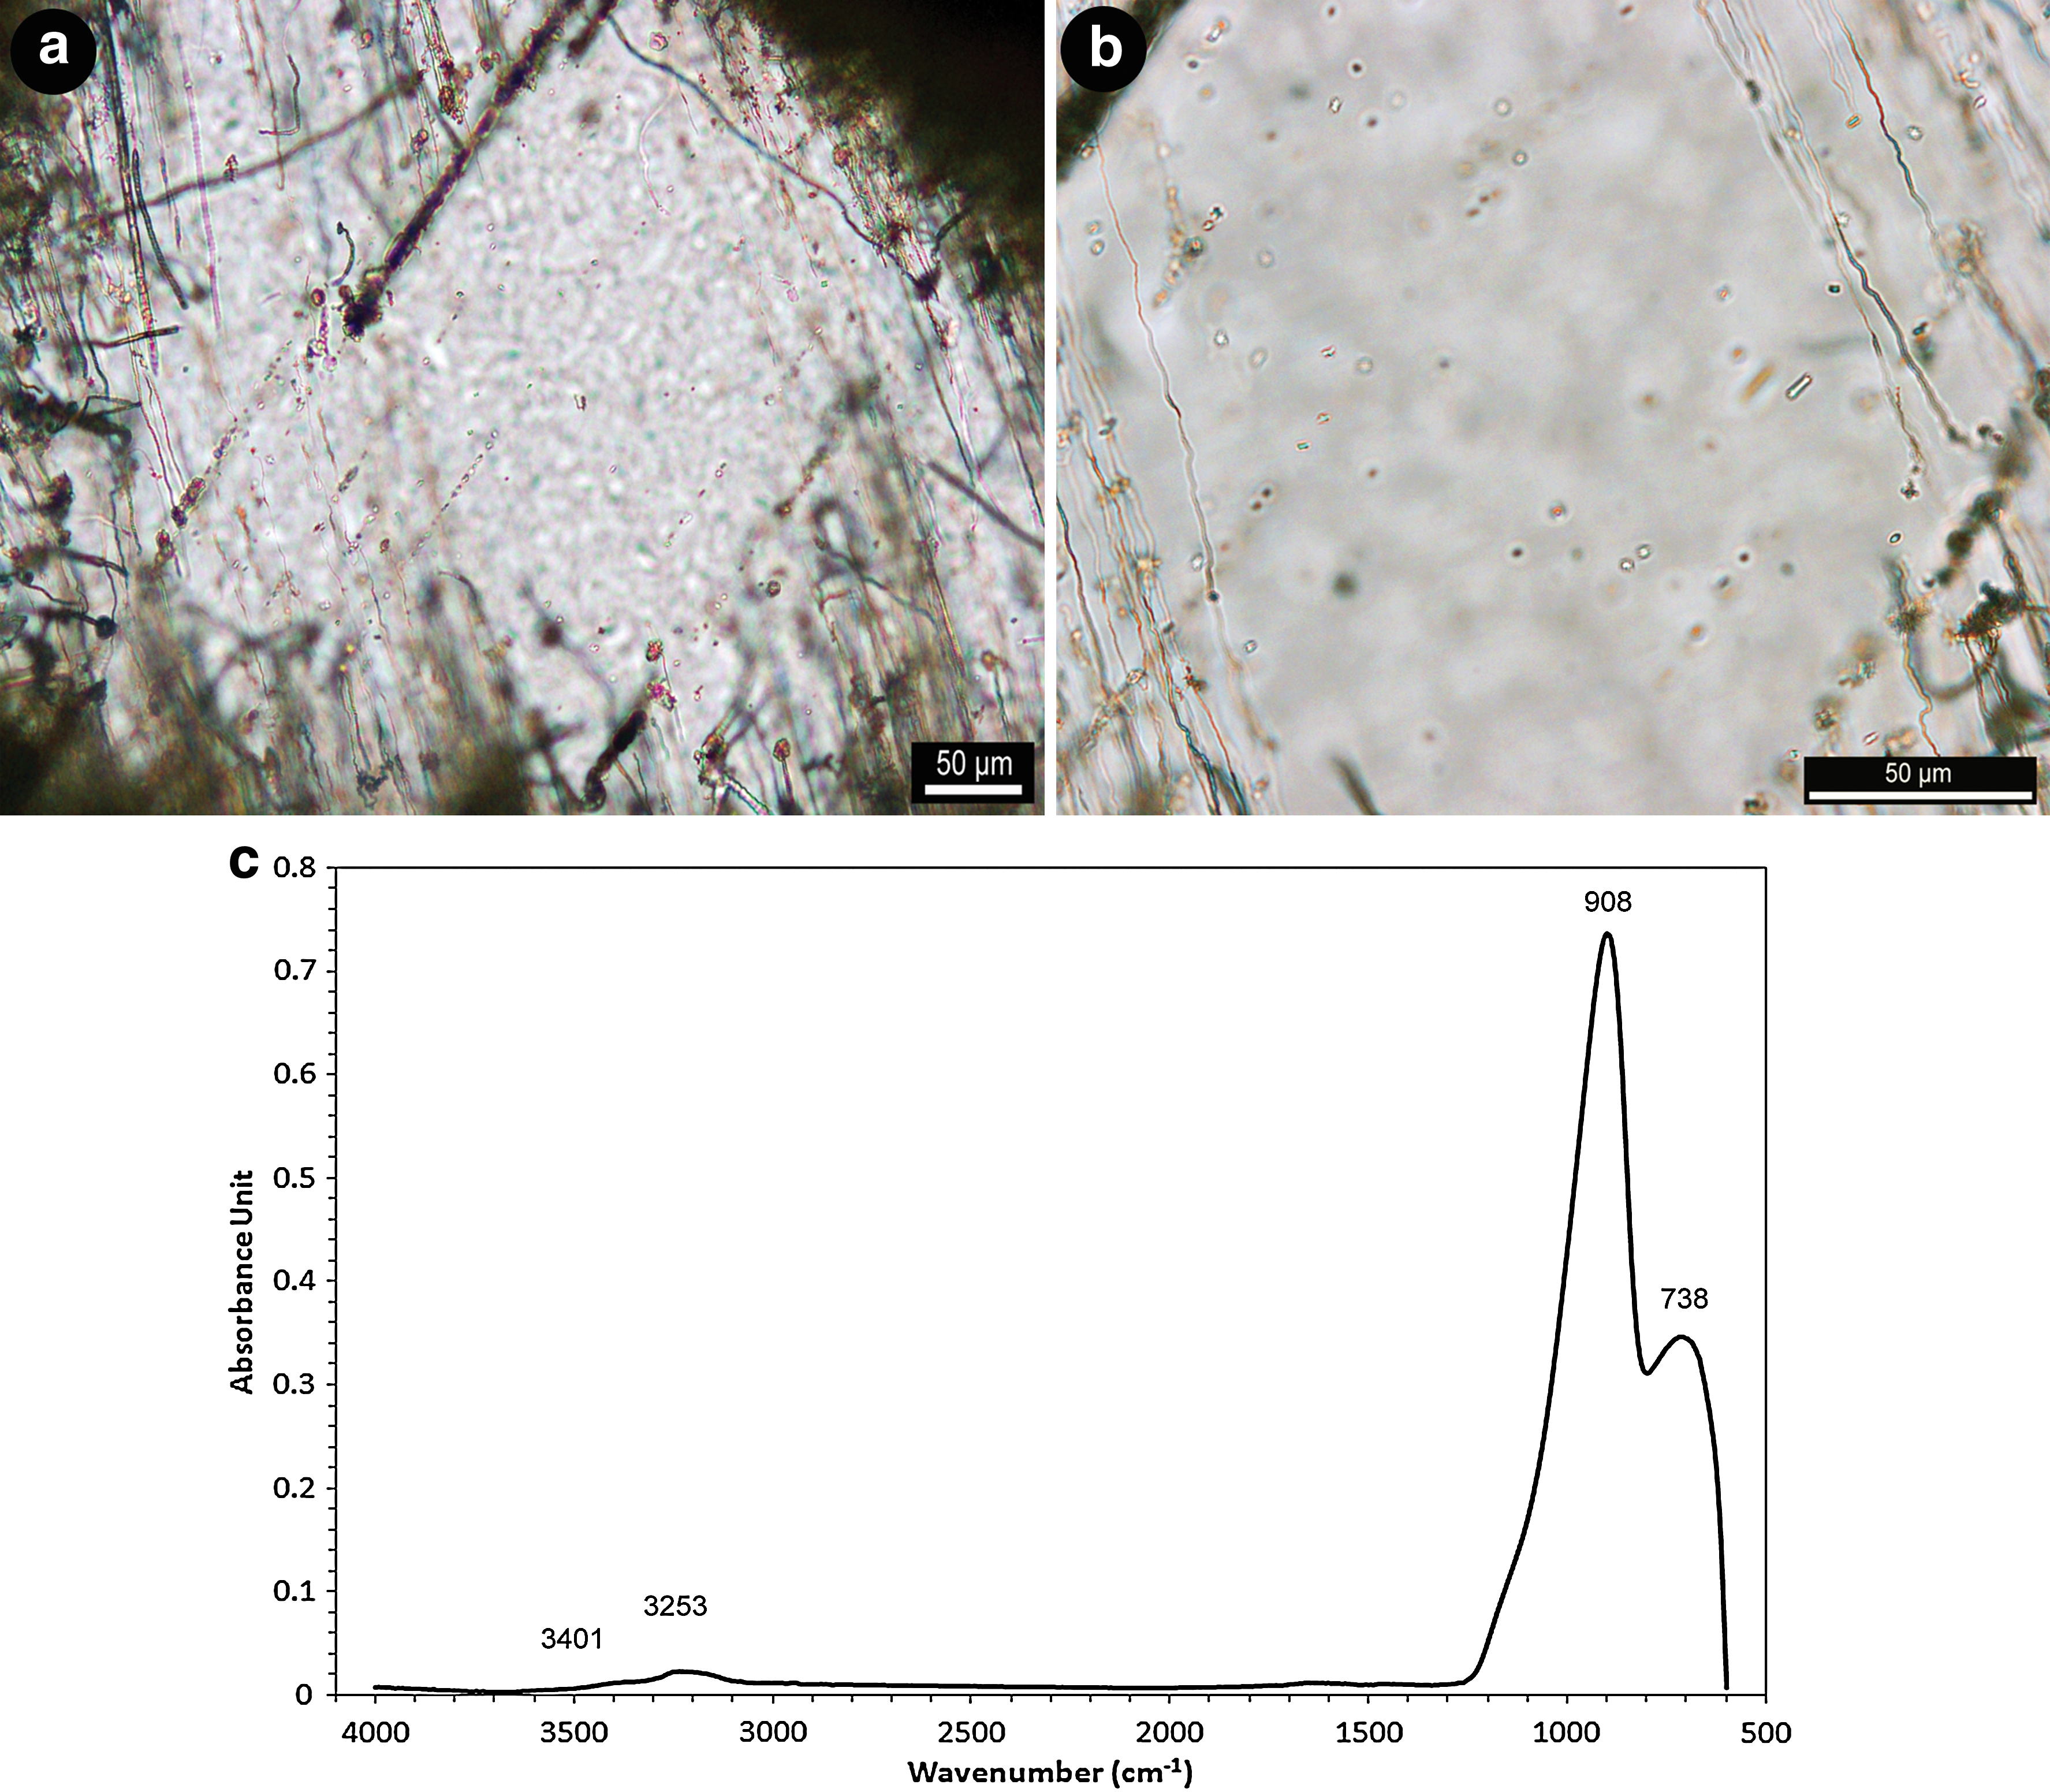
Transmitted light images and FTIR absorbance spectrum from Spot 9. (
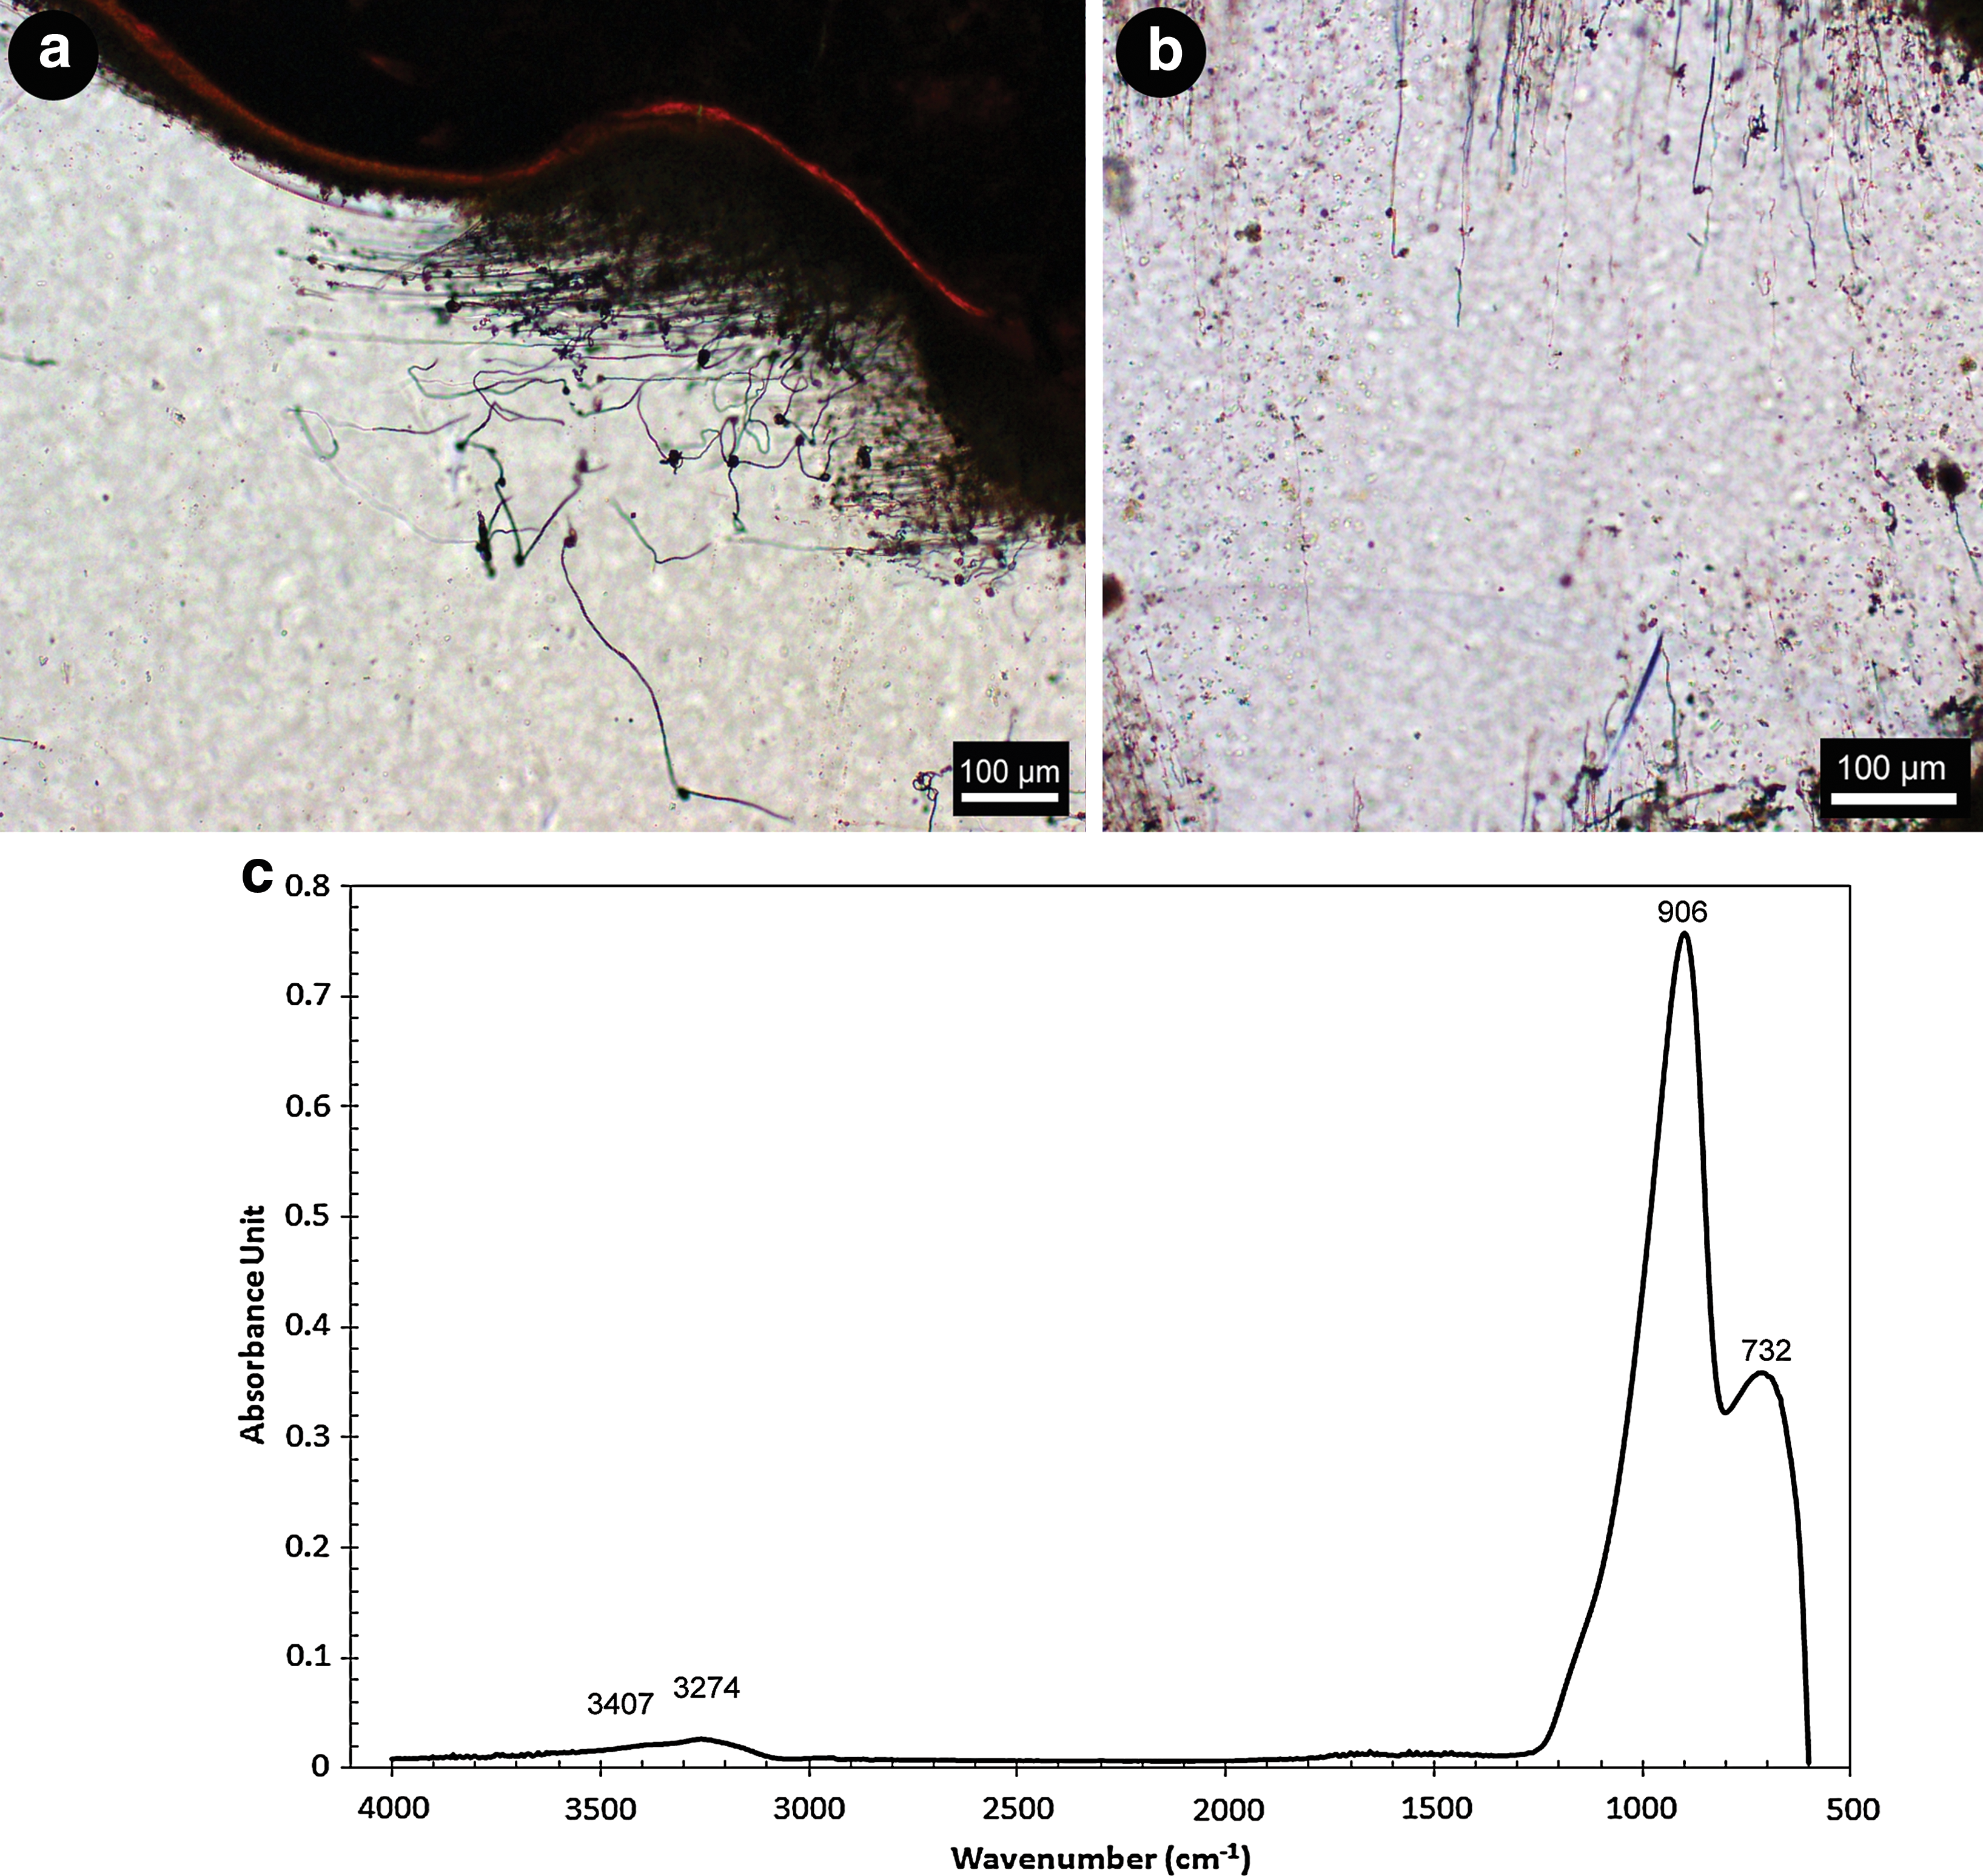
Two transmitted light images and FTIR absorbance spectrum from Spot 17. (
An FTIR absorbance spectrum from the Spot 9 tubule-free core (Fig. 5c) indicates an absorption band located at 3401 cm−1 on a broad band centered at 3253 cm−1. These are the asymmetric and symmetric OH stretching vibrational modes of water molecules that are fully hydrogen-bonded with surrounding water molecules (Verma et al., 2007). The absorption band at 908 cm−1 is a Si–O asymmetric stretching vibrational mode of SiO4 tetrahedra, and the 738 cm−1 absorption band is a Si–O or Si–O–Al symmetric bending, or a stretching vibrational mode of Ti–O (see Table 1). Both absorption bands are shifted to lower wavenumbers than those in the tubule-rich spectra.
Fourier transform infrared absorption spectra obtained from Spot 17 (Fig. 6c) contain a broad absorption band centered at 3274 cm−1 with a shoulder at 3407 cm−1 attributed to the symmetric and asymmetric OH stretching vibrational modes of water molecules that are fully hydrogen-bonded with surrounding water molecules. The absorption bands at 906 and 732 cm−1 are those of a Si–O asymmetric stretching vibrational mode of SiO4 tetrahedra and a symmetric bending vibrational mode of Si–O or Si–O–Al, or a Ti–O stretching vibrational mode (see Table 1).
5. Discussion and Interpretations
Infrared spectroscopy in the broadest sense has been applied to the study of microorganisms for nearly 60 years (e.g., Heber et al., 1952; Norris, 1959) based on the observation that different bacteria display different IR spectra. However, a bacterial cell or a biofilm represents an extremely complex system that creates many different signals from vibrations of molecules in the extracellular polymeric substances, the cell wall, the membrane, and the cytoplasm. The presence of these molecules within mineral matrices adds a further complicating factor in IR studies and determinations.
Analysis of the FTIR absorbance spectra obtained from this study indicates that the tubule-rich areas of glass clasts contain a number of organic absorption bands, which are lacking in the tubule-poor regions. The absorption bands that correspond to vibrational modes of Si–O and Ti–O corroborate previous data and observations regarding compositions of the glass clasts and accompanying minerals (e.g., Banerjee and Muehlenbachs, 2003; Staudigel et al., 2006; Benzerara et al., 2007; Izawa et al., 2010b). FTIR spectroscopy covering the region of 700–4000 cm−1 was therefore a highly appropriate tool for this study and enabled identification of both the minerals found in association with the glass clasts and the organics preserved within the tubule features.
5.1. Mineralogy
The major spectral features observed in most silicate minerals and silicate glasses are due to Si–O–Si, Si–O–Al and/or Al–O–Al fundamental vibrational modes (e.g., McMillan, 1984; McMillan and Hofmeister, 1988). Asymmetric stretching vibrational modes contribute to about five bands relating to structural units in silicate glasses between 700 and 1250 cm−1 (e.g., Bell et al., 1968; Furukawa et al., 1981; McMillan, 1984; Dowty, 1987; Poe et al., 1992; Parot-Rajaona et al., 1994; Agarwal et al., 1995; McMillan and Wolf, 1995; McMillan et al., 1998; King et al., 2004; Dalby and King, 2006). Individual absorption bands are, however, difficult to discern in silicate glasses; instead a broad band can be seen centered at ∼900–1100 cm−1, which shifts to higher wavenumbers as a function of increasing mol % SiO2 (e.g., Heaton and Moore, 1957; Sweet and White, 1969).
In the Ontong Java glass sample, these broad absorption bands are centered on 980 cm−1 in the tubule-rich areas and 910 cm−1 in the tubule-free glass cores. The higher wavenumber absorption bands may be caused by a greater amount of SiO2 in the tubule-rich areas than occurs in the glass cores that are essentially void of tubules. Benzerara et al. (2007) reported that the tubules are surrounded by an amorphous silica-rich rim, with palagonite composed of fine intergrowths of clays, oxides, and/or amorphous phases within the tubules. This indicates that the tubule-rich areas will have a higher SiO2 content than the cores, which is reflected by a higher wavenumber band position for the SiO2 vibrational modes. The network-forming cations Si and Al, as well as network-modifying cations, including Fe, Ti, Mg, Ca, Na, and K, have also been observed within the glasses with a variety of electron-beam, X-ray, and ion-beam techniques (e.g., Banerjee and Muehlenbachs, 2003; Benzerara et al., 2007; Banerjee et al., 2010). The presence of multiple network-forming and network-modifying cations may influence the wavenumber position of the Si–O absorption bands.
Regarding the tubule-rich areas, absorption bands appear between 680 and 690 cm−1, and between 720 and 740 cm−1. These are tentatively assigned to the Ti–O stretching vibrational modes of TiO6 octahedra based on studies by Zhang et al. (2002). Titanium-rich minerals, such as titanite, are particularly important in the preservation of traces of microbial activity in basaltic glass (e.g., Furnes et al., 2004; Banerjee et al., 2006, 2007, 2008; Izawa et al., 2010b) in that they enable the preservation of morphological and/or chemical signatures of biological activity. Enrichments of titanium have been observed in association within tubules in the basaltic glass of this study and were previously documented by Banerjee and Muehlenbachs (2003). The Ti–O absorption bands of this study coincide with areas that were previously documented to contain titanite by using micro X-ray diffraction (Izawa et al., 2010b). The OH absorption bands observed around 3250 and 3400 cm−1 are common to all spectra obtained, which indicates that the samples are hydrated. The water molecules are most likely bound to the glass within the samples. The absorption band at ∼3570 cm−1 of the symmetric OH stretching vibrational mode of partially hydrogen-bonded water molecules can be identified in all spectra from the tubule-rich areas but is absent in those from the tubule-free cores. The water molecules may only be spectrally visible when bound to an organic matrix, so they are only observed in tubule-rich spectra. The H2O absorption band commonly located at ∼1645 cm−1 overlaps with that of the Amide I absorption band described later. An absorption band with a high absorbance is located at this wavenumber within the tubule-rich spectra but is very minor to absent in the glass core spectra.
5.2. Organics
This work has identified a number of distinct functional group frequencies belonging to aliphatic hydrocarbons, amides, and carboxylic acids, which may be assigned to various functional groups in lipids, proteins, and carboxylic acids (see Table 1 for the absorption bands identified and potential assignments). Although these groups can be found as part of the structure of other organic compounds, their spatial association with the tubular bioalteration patterns (e.g., Fisk et al., 1998; Furnes et al., 2001a), and the organic carbon and nucleic acids (Banerjee and Muehlenbachs, 2003; Benzerara et al., 2007) already detected within the structures, adds weight to the inference that these FTIR absorption bands likely reflect biomolecules produced by past microbial inhabitants of the tubules.
The aliphatic C–H stretching vibrational bands between 3000 and 2800 cm−1 may be derived from groups usually present in fatty acid components of cell membranes (Helm et al., 1991). The symmetric and asymmetric CH2 stretching vibrational modes in this region have higher absorbance values than the CH3 absorption bands in the FTIR spectra. This indicates the highly aliphatic nature of the tubule areas under analysis and potentially the organisms that created the tubules. A predominance of methylene-chain CH2 over end-methyl CH3 has been used to indicate a dominant presence of long and straight aliphatic chains (i.e., fatty acids; Igisu et al., 2009). Within a single FTIR spectrum of this study, there were four CH2 and four CH3 vibrational modes detected, which indicates that neither aliphatic functional group is dominant in these samples. A comparison of the ratio of the asymmetric CH2 and CH3 stretching vibrational modes can be used to assess chain lengths and the degree of branching of the aliphatic structures present. A low CH2/CH3 band intensity ratio indicates a shorter, more branched aliphatic structure. Conversely, a higher ratio indicates a long and less-branched aliphatic chain (Lin and Ritz, 1993).
The expanded C–H stretching vibrational absorption bands for spot locations 4, 6, and 13 produced CH2/CH3 band intensity ratios of 4.9, 4.2, and 4.4, respectively. A CH2/CH3 ratio≤2 signifies a biopolymer containing shorter and more branched aliphatic structures (Lin and Ritz, 1993; Marshall et al., 2005). The ratio values of this study are considered moderately high as described for Tasmanites by Lin and Ritz (1993), which implies that a biopolymer is present within the tubules consisting of aliphatic structures that are slightly longer and less branched. Considering the equal number of CH2 and CH3 absorption bands identified through FTIR analyses, these tubules may contain a mixture of branched and less-branched aliphatic structures. It was also proposed by Lin and Ritz (1993), and applied by Marshall et al. (2007), that the CH2/CH3 intensity ratio values can be correlated to the chain length of the aliphatic structures (i.e., the CH2/CH3 ratio should increase as the aliphatic chains become longer). The values in this study would therefore imply an n-alkane chain length of about 12 carbons; however, this is an oversimplified model and should be used in conjunction with other evidence.
The CH2 and CH3 ratios of spectra obtained from preserved microfossils are proposed to reflect the chemical composition of their precursor membrane lipids. Igisu et al. (2009) proposed a reversal of the CH2/CH3 ratio, called the R 3/2, whereby the peak heights of the absorbance bands of asymmetric CH3 and asymmetric CH2 are used. They proposed that a low R 3/2, between 0.3 and 0.5, is indicative of bacterial lipids. The intensity of the asymmetric CH3 and CH2 absorbance bands of this study yield ratio values of 0.43, 0.47, and 0.67 for Spots 4, 6, and 13, which implies that bacterial lipids might be present within the tubules. R 3/2 values for fossilized coccoids and filaments observed within the Gunflint Formation are 0.45±0.04 (n=5) for aggregated filaments and coccoids, and 0.43±0.11 (n=10) for amorphous organic matter (Igisu et al., 2009). These values match the majority of those in this study. The value of 0.67 obtained may signify an increase in branching of the aliphatic chains or indicate an archaeal component within the tubules. Studies by Igisu et al. (2009) also included R 3/2 analyses of extant bacteria and cell components as comparisons to their fossilized observations. A value of 0.65 was obtained through analysis of cyanobacteria whole cells. Some tubule structures of this study may therefore contain extant as well as fossilized bacteria, which would generate a range of R 3/2 values. Both aliphatic C–H ratio methods proposed indicate that the tubules of this study contain aliphatic hydrocarbons with both long and short carbon chains, with variable degrees of branching, which may be of bacterial lipid origins.
Most of the important vibrational modes associated with lipids (Tamm and Tatulian, 1997) were identified in the FTIR spectra from the tubule-rich areas of this study; for example, the absorption band at 1743 cm−1 is that of a C=O stretching vibrational mode of esters found within fatty acids. All absorption bands are listed in Table 1. These functional groups are frequently encountered within membrane lipids, which may be an indication of the source for the organic functional groups found within the tubule-rich areas.
The IR spectra of polypeptides exhibit a number of amide absorption bands, which represent different vibrational modes of the peptide bond. An absorption band at 1637 cm−1 may be derived from the Amide I C=O stretching vibrational mode (e.g., Byler and Susi, 1986; Arrondo et al., 1993; Goormaghtigh et al., 1994; Jackson and Mantsch, 1995). If this vibrational mode is assumed to be a protein backbone vibration, then its wavenumber might indicate a β-sheet secondary structure. The Amide I band is most widely used for secondary structure analyses. Amide II absorption bands of secondary protein structures appear at 1567 cm−1 and at 1290 cm−1; an Amide III absorption band was identified in most spectra. These amide vibrational modes are additional evidence that organics, maybe of biological origin, are preserved within the tubule-rich areas. Previous studies of biomolecule preservation (Preston et al., 2011) have indicated that, over geological time, the observation of amide absorption bands within rocks decreases, whereas aliphatic hydrocarbons are more persistent. This observation may imply that the tubules of this study are geologically young and/or that agents such as titanite are aiding long-term preservation of organics.
The Amide I absorption band overlaps with that of H2O; however, both are expected to be present within the samples. The H2O absorption band is mirrored by the existence of bands around 3300 cm−1, while the Amide I assignment is strengthened by the Amide II and Amide III absorption bands. Further deconvolution of these bands caused artifacts to be created in the spectra that hindered more detailed interpretations. An absorption band at 1700 cm−1 may be the stretching vibrational mode of a C=O ester of a carboxylic group (Schmitt and Flemming, 1998), and the absorption bands below 1500 cm−1 are tentatively linked to vibrational modes of a number of carboxylic groups.
The organic absorption bands of this study correlate with those commonly found within membrane lipids and create spectra that resemble those obtained from biofilms (e.g., Schmitt and Flemming, 1998). The identification of these organic bands within a single FTIR spectrum spatially associated with the tubules, and correlated to previous research that identified organic carbon and nucleic acids, may imply that the FTIR spectra are displaying molecular vibrations from biomolecules linked to the microorganisms that created the tubules.
6. Implications for Astrobiology
Meteorites, remote sensing spectroscopic investigations, and robotic exploration studies have shown us that basalts are among the most widespread rocks in the solar system. Therefore, basaltic glasses are expected to be widespread and can form anywhere basaltic melts are quenched. Basaltic glass can provide chemical energy and nutrients in the form of reduced Fe and Mn, as well as transition metals that are commonly found in cofactors and coenzymes (e.g., Staudigel et al., 2008a). Numerous lines of evidence indicate that, in the presence of liquid water, basaltic glass interacts in such a way as to create a habitat suitable for microbial colonization. Basaltic glass in contact with liquid water may therefore constitute a habitable environment during the early stages of solar system formation. The record of basaltic glass bioalteration on Earth extends to at least 3.5 Ga and has remained remarkably consistent through geological time (Furnes et al., 2004; Banerjee et al., 2006). The habitat provided by basaltic glass is a potential refuge from impact bombardment and irradiation. Basaltic glass may remain an important habitat on icy satellites such as Europa and Enceladus, in the deep subsurface of Mars, and in martian impact craters and post-impact hydrothermal systems (Izawa et al., 2010a). Mars in particular is known to host abundant basaltic rock, and numerous lines of evidence indicate that liquid water has interacted with the crust, at least transiently, for much of Solar System history.
This study can also be applied to the investigation of life on early Earth. Previous studies into the biological affinities of Proterozoic microfossils to allow further elucidation into early life on Earth have been conducted (e.g., Arouri et al., 1999; Marshall et al., 2005, 2007; Javaux and Marshall, 2006), and the preservation of organics within ancient rocks on Earth have been investigated with spectroscopy by Schopf et al. (2002), Schopf and Kudryavtsev (2005, 2009), Derenne et al. (2008), Lepot et al. (2008, 2009), Preston et al. (2008), Igisu et al. (2009), Preston and Genge (2010), and Preston et al. (2011). FTIR spectroscopic analyses have shown that aliphatic hydrocarbons and amides potentially related to fatty acids and proteins, respectively, can be detected within 396 Ma hydrothermal silica deposits (Preston and Genge, 2010). The combined evidence from previous studies of ancient preserved organics, combined with those preserved within basaltic glasses of this study, increases the possibility that organics from Archean-age rocks will be uncovered in the future through FTIR spectroscopic techniques to enable a further constraint on the date of the emergence of life on Earth.
The astrobiological implications of this study are amplified by the use of FTIR spectroscopy, which itself is a powerful tool for astrobiology. FTIR spectroscopy allows for nondestructive characterization of organic matter associated with microbial textures in rocks in situ with a high degree of chemical specificity. In reference to this study, the nondestructive aspect of FTIR spectroscopy is highly beneficial due to the critical nature of morphology in the interpretation of tubular and granular textures as biogenic features. Other methods for in situ analysis of carbon compounds cannot unambiguously identify organic carbon (EPMA, SEM-EDX); are destructive and fragment organic compounds, which complicates interpretation (ToF-SIMS); and can identify the presence of organic carbon but not its cellular host or hosts (STXM, TEM-EELS). Such methods can also contaminate the sample, and they are subject to interference from mineral phases. FTIR spectroscopy also provides advantages for the mitigation of contamination, a perennial difficulty in biomarker research. In contrast to whole-rock acid dissolution or combustion techniques, samples for in situ IR spectroscopy can be carefully treated to minimize contamination, as in the present study. We anticipate that spectromicroscopy techniques similar to those used in the present study will be profitably applied to highly contamination-sensitive samples, including martian meteorites and future sample returns.
7. Conclusions
Several independent lines of evidence support a biological origin for tubular features within volcanic glass shards. Organic carbon and nucleic acids associated with tubules have been previously identified; however, further details regarding the carbon species present have been elusive. This study adds FTIR spectroscopy to the previous suite of techniques employed to help further constrain the nature of these carbon compounds. We identified FTIR absorption bands that match those of aliphatic hydrocarbons, amides, esters, and carboxylic groups, which, along with the morphological evidence and results of previous investigations, may indicate an origin from fatty acids and proteins left over from previous biological inhabitants of the tubules. These may have been incorporated into, and preserved by, the titanite and/or palagonite precipitates within the tubules, or they may be biomolecules from the tubule-forming microorganisms that still exist within the glasses but, in time, may decay.
Footnotes
Acknowledgments
We thank the crew, technicians, and science party of ODP Leg 192 aboard the drill ship JOIDES Resolution. Funding was provided by Natural Sciences and Engineering Research Council of Canada (NSERC) and Canada ODP. The authors would also especially like to thank Surface Science Western, especially Rebecca Jacklin, for their time, support and advice during the FTIR analyses of this study. We finally would like to acknowledge The Centre for Planetary Science and Exploration (CPSX) for funding the lead author, the Canadian Astrobiology Training Program (CATP), and the Mineralogical Association of Canada (MAC).
Author Disclosure Statement
No competing financial interests exist.
Abbreviations
ATR, attenuated total reflectance; FTIR, Fourier transform infrared; ODP, Ocean Drilling Program; OJP, Ontong Java Plateau.