
Abstract
NASA's EPOXI mission observed the disc-integrated Earth and Moon to test techniques for reconnoitering extrasolar terrestrial planets, using the Deep Impact flyby spacecraft to observe Earth at the beginning and end of Northern Hemisphere spring, 2008, from a range of ∼1/6 to 1/3 AU. These observations furnish high-precision and high-cadence empirical photometry and spectroscopy of Earth, suitable as “ground truth” for numerically simulating realistic observational scenarios for an Earth-like exoplanet with finite signal-to-noise ratio. Earth was observed at near-equatorial sub-spacecraft latitude on 18–19 March, 28–29 May, and 4–5 June (UT), in the range of 372–4540 nm wavelength with low visible resolving power (λ/Δλ=5–13) and moderate IR resolving power (λ/Δλ=215–730). Spectrophotometry in seven filters yields light curves at ∼372–948 nm filter-averaged wavelength, modulated by Earth's rotation with peak-to-peak amplitude of ≤20%. The spatially resolved Sun glint is a minor contributor to disc-integrated reflectance. Spectroscopy at 1100–4540 nm reveals gaseous water and carbon dioxide, with minor features of molecular oxygen, methane, and nitrous oxide. One-day changes in global cloud cover resulted in differences between the light curve beginning and end of ≤5%. The light curve of a lunar transit of Earth on 29 May is color-dependent due to the Moon's red spectrum partially occulting Earth's relatively blue spectrum. The “vegetation red edge” spectral contrast observed between two long-wavelength visible/near-IR bands is ambiguous, not clearly distinguishing between the verdant Earth diluted by cloud cover versus the desolate mineral regolith of the Moon. Spectrophotometry in at least one other comparison band at short wavelength is required to distinguish between Earth-like and Moon-like surfaces in reconnaissance observations. However, measurements at 850 nm alone, the high-reflectance side of the red edge, could be sufficient to establish periodicity in the light curve and deduce Earth's diurnal period and the existence of fixed surface units. Key Words: Atmospheric composition—Biomarkers—Life detection—Habitability—Extrasolar terrestrial planets—EPOXI mission—Light curves—Exoplanets. Astrobiology 11, 907–930.
1. Introduction
The EPOXI mission re-used the Deep Impact flyby spacecraft for the Extrasolar Planetary Observation and Characterization (EPOCh) investigation and the Deep Impact eXtended Investigation (DIXI), which combined to form EPOXI. The Deep Impact eXtended Investigation followed the 4 July 2005 Deep Impact flyby and impactor mission to comet 9P/Tempel (A'Hearn et al., 2005) with the 4 November 2010 flyby of a second cometary nucleus, 103P/Hartley. The EPOCh investigation used the Deep Impact high-resolution imager visible-light instrument (HRIVIS) as a stable photometric platform in heliocentric orbit to obtain detailed light curves of known transiting exoplanets from which to refine parameters for these systems (Ballard et al., 2010; Christiansen et al., 2010). In addition, the EPOCh investigation observed the global Earth, using both the HRIVIS camera and the high-resolution instrument infrared spectrometer (HRIIR). The results reported here are from observations at a sub-spacecraft latitude close to Earth's equator, at a range of ∼1/6 to 1/3 AU.
Although many spacecraft missions have conducted in-depth observations of our habitable home planet from near-Earth orbit (e.g., Remer et al., 2008), and some from interplanetary spacecraft (Sagan et al., 1993; Geissler et al., 1995), most of those measurements do not directly describe the global Earth in a way that is directly applicable to exoplanetary science operating at interstellar range; one notable exception is the global-scale observation of Earth at mid-IR wavelengths (∼6–15 μm) by the Mars Global Surveyor Thermal Emission Spectrometer (Christensen and Pearl, 1997). Near-Earth measurements cannot view the entire disc at once from a single phase angle, so a global view must be synthesized from close-in data (e.g., Tinetti et al., 2006a, 2006b; Hearty et al., 2009). The accuracy of the synthesis needs to be checked with empirical data, to have confidence in using the same tools to model the spectroscopy of arbitrarily conceived exoplanets.
Observations of Earth's visible-light spectrum also have been attempted by exploiting Earthshine reflected from the Moon's shadowed side (Woolf et al., 2002; Seager et al., 2005; Turnbull et al., 2006; Arnold, 2008). The accuracy of Earthshine observations as a global model is limited, as the measured Earthshine spectrum has passed through Earth's atmosphere three times, so the results depend critically on accurate telluric absorption corrections as well as accurately modeled lunar reflectance. Earthshine observations are obtained from the dark side of the crescent Moon, so observations over a full Earth rotation must combine data from multiple observing sites. Finally, spectral features of greatest interest to remotely detect the composition and properties of an Earth-like atmosphere are inaccessible from the ground due to opacity in those same features and thus cannot be measured well in Earthshine.
This paper documents the complete data collection and reduction processes employed in the EPOXI mission to acquire an accurate empirical description of Earth as an unresolved model exoplanet. Distant observations of Earth's whole disc accurately simulate the geometry for observations of an extrasolar Earth-like planet and thus can measure the spectroscopy and photometry that could be detected in such circumstances in the limit of very high signal-to-noise ratio. The EPOXI/EPOCh measurements were obtained by repeatedly viewing the global Earth directly from a remote spaceborne platform in heliocentric orbit in the equatorial plane, with the same detectors on each occasion. Earth was observed over a full 24 h rotational period in each of three epochs, which resulted in time-resolved and time-averaged disc-integrated visible-to-near-IR spectroscopy and fully defined the rotational light curve at multiple wavelengths. This work summarizes the major properties of Earth's signature as a model exoplanet, without recourse to detailed modeling, including both visible and near-IR spectroscopic features of the atmosphere and surface. Associated papers derived from modeling or interpreting subsets of these data already have been published. The present report is the primary reference for the data used in these analyses: (1) Cowan et al. (2009) used the visible light curves of the first and third EPOXI observations of Earth to test techniques for deriving first-order maps of an unresolved planetary surface; (2) Crow et al. (2011) used the time-averaged visible spectrum of Earth from the second EPOXI observation as well as the Moon's spectrum from the same data set and the time-averaged visible spectrum of Mars (unpublished EPOXI data) to investigate the distinctive character of contemporary Earth's global color in comparison to other Solar System objects; (3) Fujii et al. (2011) used the visible light curves from the first and third EPOXI Earth observations to evaluate the significance of contributors to Earth's visible spectrum and rotational modulation; (4) Robinson et al. (2011) used the three EPOXI Earth observations of 2008 in both visible and near-IR spectral regimes to validate the techniques employed in the Virtual Planetary Laboratory to synthesize the spectrum of planets of arbitrary construction.
We describe the observations and calibration in Sections 2 and 3, respectively. Section 4 focuses on reflectance by vegetation and other surface units, and its significance for astrobiological sensing of extrasolar worlds. Section 5 discusses the diurnally averaged reflectance properties of Earth and Moon at visible to near-IR wavelengths, and Section 6 discusses multiwavelength rotational light curves of Earth and their implications for astrobiology and exocartography. Section 7 summarizes our results and describes the public availability of the data for other investigators.
2. Observations
Following the Deep Impact flyby mission and impact into comet 9P/Tempel of 4 July 2005 (A'Hearn et al., 2005), the Deep Impact flyby spacecraft entered a trajectory for an encounter with Earth (Fig. 1). The encounter, on 31 December 2007, transferred the spacecraft to a heliocentric orbit similar to Earth's. An Earth flyby in late June 2010 sent the spacecraft toward its encounter with comet 103P/Hartley on 4 November 2010. The EPOCh mission element was conducted during 2008 and 2009. All the Earth observations that are being reported here were obtained during the first 6 months of the EPOCh investigation.
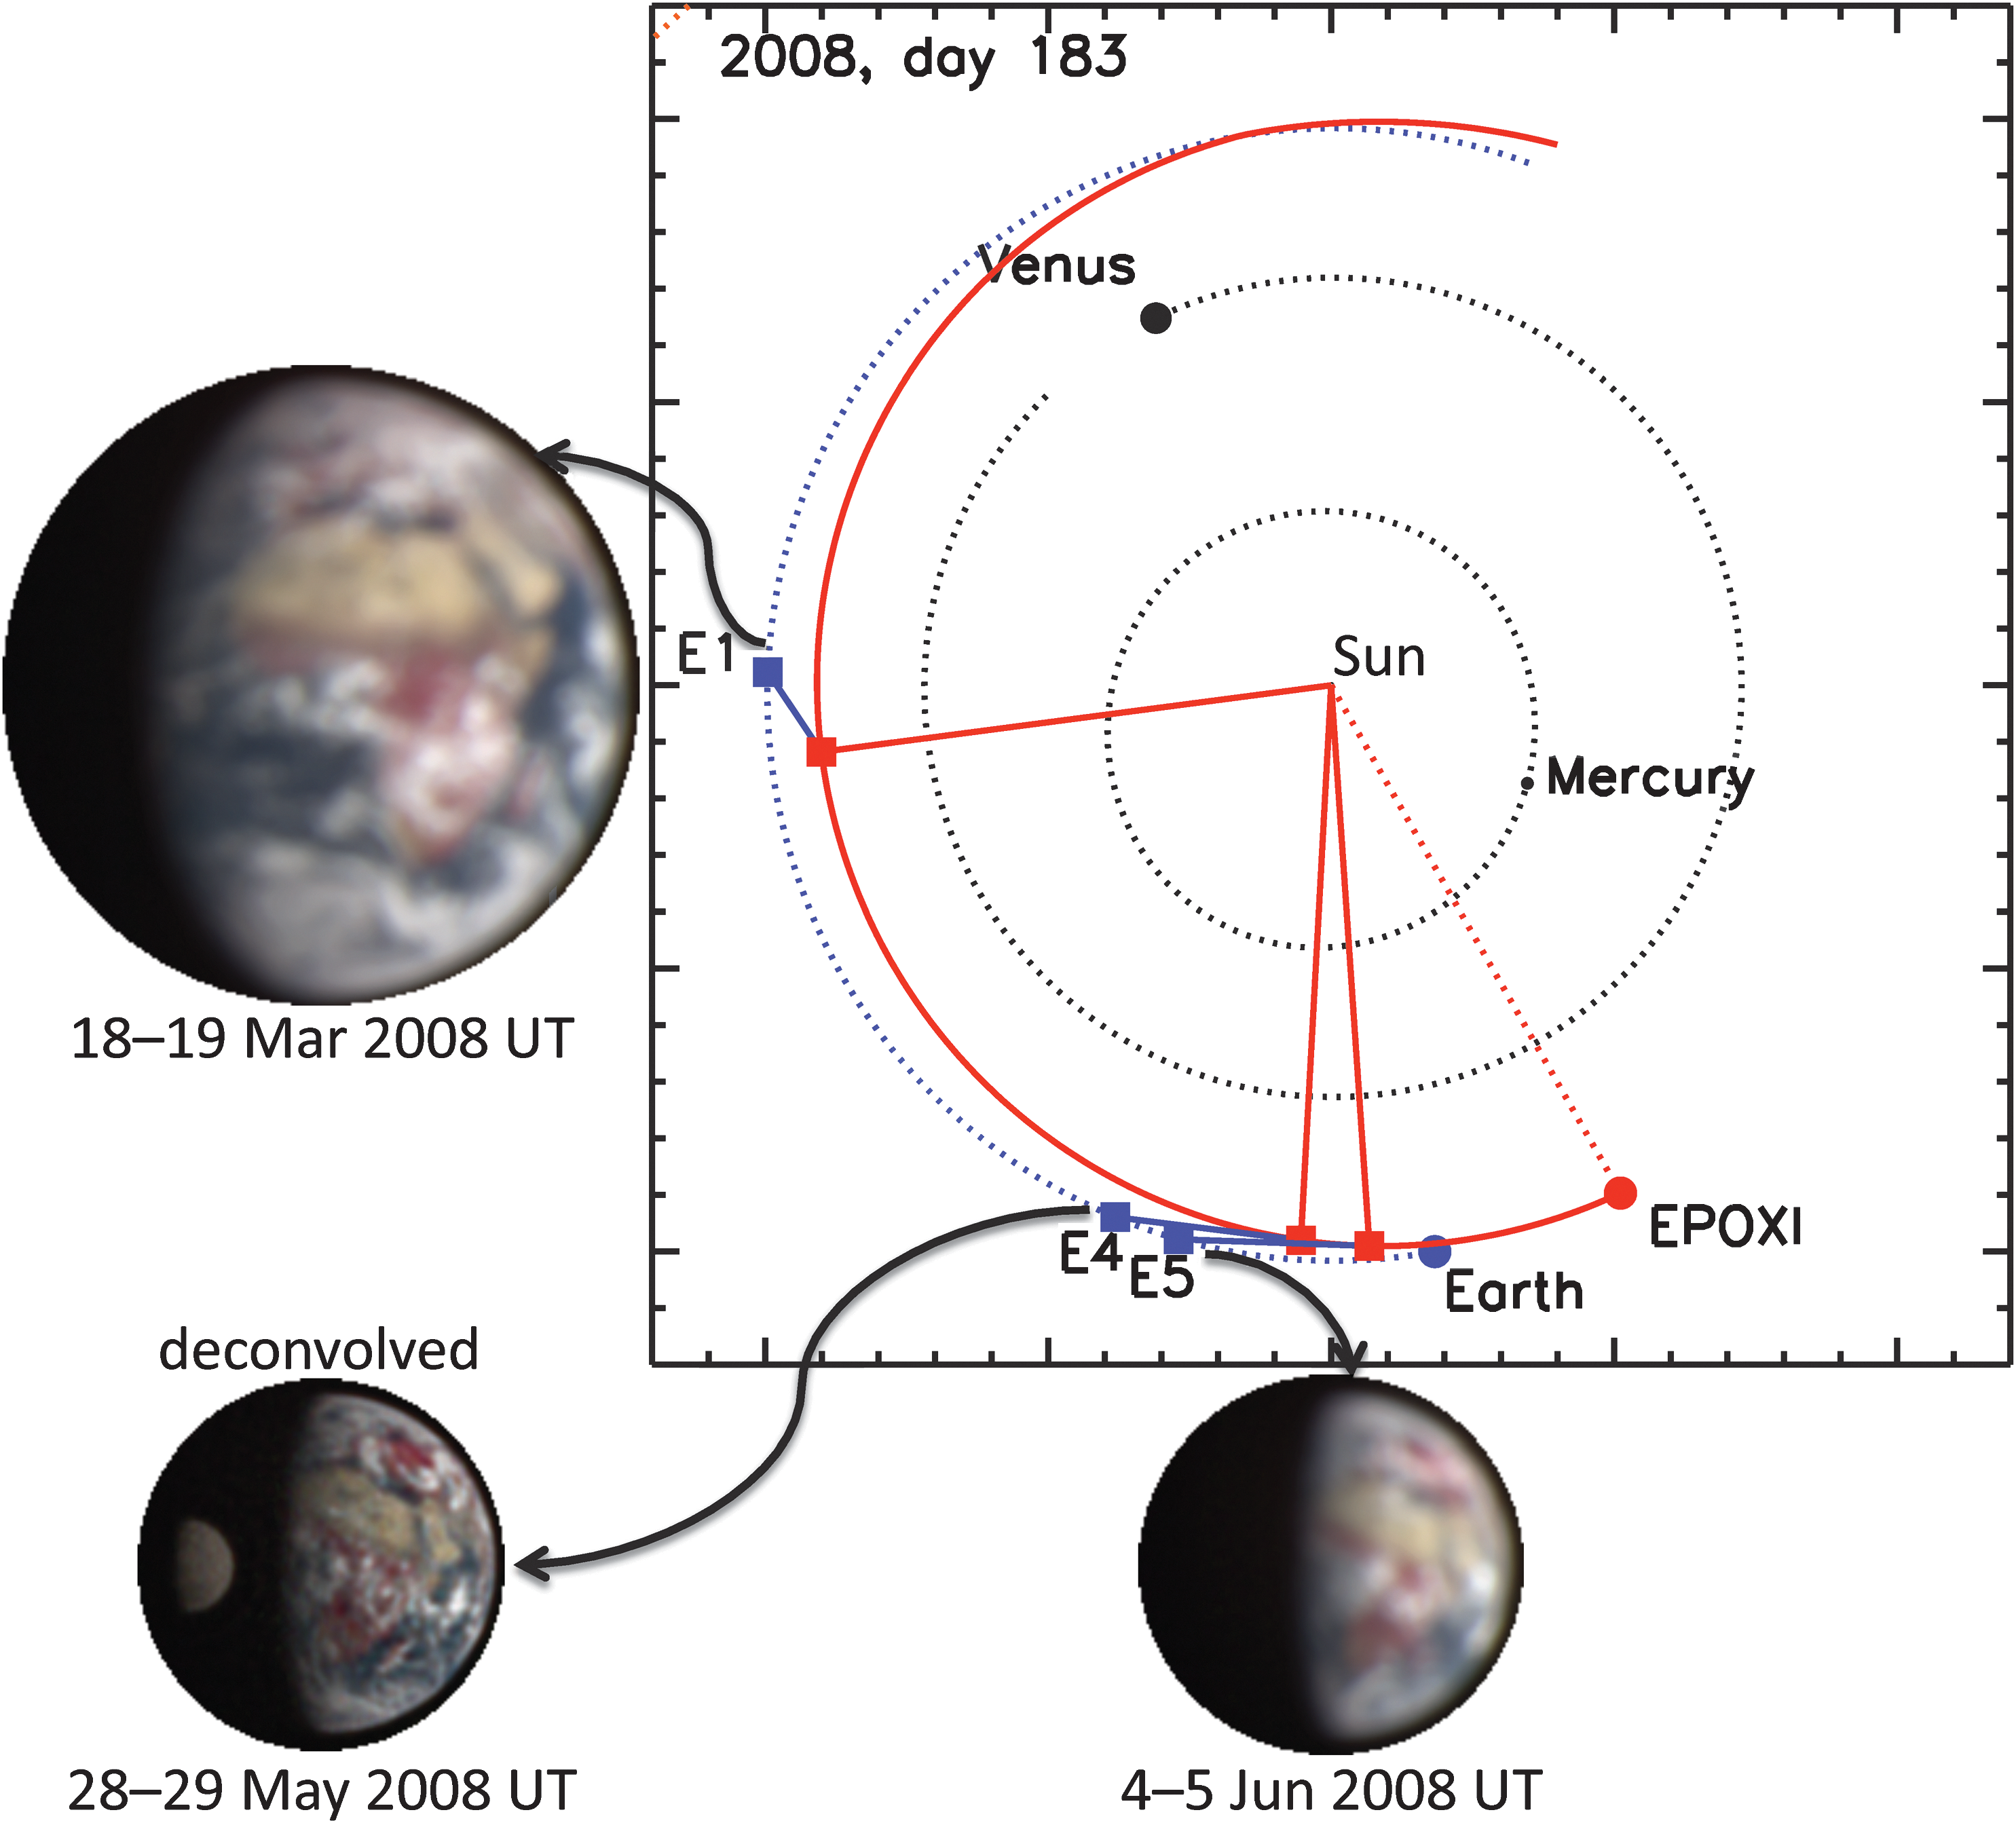
Orbital geometry for EPOXI observations of Earth E1, E4, E5, with spacecraft and planet positions as of 1 July 2008. E2 and E3 were cancelled. The spacecraft position (red dot and orbital trajectory) led Earth (blue dot and dotted blue trajectory), resulting in access to the dawn terminator only. Red squares show the spacecraft position, and blue squares show the Earth position at the time of observation. Sample images show the correct relative scale of each observation. The EarthObs4 (E4) image of the Moon transiting Earth has been deconvolved by the measured point-spread function.
The Deep Impact spacecraft was designed specifically for the trajectory of its encounter with comet 9P/Tempel. The resulting instrument orientation requires that the line of sight to a target must fall within a narrow range of 87–107° from the spacecraft-Sun line to maintain passive cooling of the three remote-sensing instruments: the high-resolution instrument visible camera (HRIVIS), the high-resolution instrument infrared spectrometer (HRIIR), and the medium-resolution instrument visible camera (MRI). The spacecraft's orbit satisfied these angular constraints for observations of Earth through most of the northern spring of 2008.
Five observations of Earth, designated EarthObs1, 2, 3, 4, and 5, were planned for spring 2008, running from approximately northern spring equinox to a little before the northern summer solstice. Spacecraft telecommunication problems prevented the execution of EarthObs2 and 3, which resulted in three successful observations that retain the indexed designations EarthObs1, EarthObs4, and EarthObs5. Figure 1 shows the orbital geometry of these events, with comparison images that show the relative angular size of Earth on each date. The EarthObs1 and EarthObs5 images include the defocus of the HRIVIS camera, discovered after launch, yielding an effective spatial resolution of ∼4 arcsec (10 pixels). The displayed EarthObs4 image, with Earth and Moon together, has been deconvolved by the measured point-spread function (Barry et al., 2010). The spectrophotometric analysis reported here uses the non-deconvolved images.
The HRIVIS camera defocus poses no defect for spectrophotometric and light curve results from unresolved whole-disc photometry. EarthObs1 and EarthObs5 represent the contrast between the beginning and the end of one northern spring/southern autumn season. EarthObs4 and EarthObs5 are very similar but differ in that Earth was transited by the Moon during EarthObs4, an event that might occur in actual exoplanet observations. Table 1 summarizes the three observations. EarthObs1 was conducted on 18–19 March 2008 UTC, with Earth about three-quarters illuminated and at about 1/6 AU distance from the spacecraft. EarthObs4 and 5 were conducted on 28–29 May and 4–5 June 2008 UTC, respectively, with Earth a bit less than two-thirds illuminated at about 1/3 AU range. Identical 24 h observing sequences were executed on each occasion, which overlapped the beginning and end central meridian longitude by ∼0.2–0.4° rotation.
CML, central meridian longitude in west longitude.
2.1. Acquisition of visible-light spectrophotometry
The HRIVIS and HRIIR share a 30 cm telescope equipped with a dichroic beam splitter that supplies the HRIVIS camera with wavelength less than ∼1000 nm and the HRIIR with wavelength greater than ∼1050 nm. The HRIVIS filter wheel samples visible wavelengths from ∼365 nm through ∼1100 nm in seven filters of ∼100 nm bandpass, on nominal center wavelengths 350 nm (centroid at 372 nm), 450 nm (454 nm), 550 nm (550 nm), 650 nm (647 nm), 750 nm (745 nm), 850 nm (842 nm), and 950 nm (948 nm). Table 2 tabulates the average wavelength and full width at half-maximum response of each filter, weighted by instrument and filter response (Hampton et al., 2005) to the ASTM Standard E490-00a (2006) standard solar spectrum. The short wavelength cutoff of the “350” filter is longward of 350 nm due to the performance of the detector and optical components. The “950” filter is a long-pass filter, cut off at ∼1000 nm by the dichroic and by the detector response. Detailed instrument properties are described by Hampton et al. (2005). The Earth observations read only the central region of the 1024×1024 pixel HRIVIS detector array, resulting in 500 pixel-square images of 2 μrad/pixel, for a 1000 μrad-square (206 arcsec-square) field of view to capture Earth, which was a maximum of 467 μrad (96.3 arcsec) diameter.
Columns record the measured disc-integrated photometry in each filter in radiance units of 10−7 W/m2/μm, scaled to 1 AU equivalent range from the spacecraft.
The quoted uncertainty is approximately the central 1σ percentile (68% confidence) of retrieved values, centered on the median.
Quantities in parentheses indicate filter full-width-at-half-maximum response to the solar spectrum.
T C=color temperature.
The cadence and duration of observations was limited by a maximum of 350 megabytes of data storage between downlinks to Earth. Images of Earth were acquired with the HRIVIS every 15 minutes through the 450, 550, 650, and 850 nm nominal-wavelength filters with short exposure times of 8.5–26.1 msec, depending on the filter, so that bright snow, ice, or cloud-covered terrain of ∼95% albedo would be optimally exposed at about half the full dynamic range of the camera system (Fig. 2). A total of 97 image sets were acquired in these four filters, separated by 3.75° rotation of Earth. Images were acquired in the remaining three filters (350, 750, 950) at slower cadence, once per hour, in exposure times of 13.8–73.6 msec, depending on the filter. A total of 25 image sets were acquired with these three filters, separated by 15° rotation of Earth. Exposure times and the lag between images were short enough that Earth's rotation is negligible within a set (Klaasen et al., 2008). The diurnal-average visible spectrum of each observation derived from the filter photometry is presented in Fig. 3. Close inspection shows “error bars” that represent the full range of actual variability in the measured signal in each passband as Earth rotated.
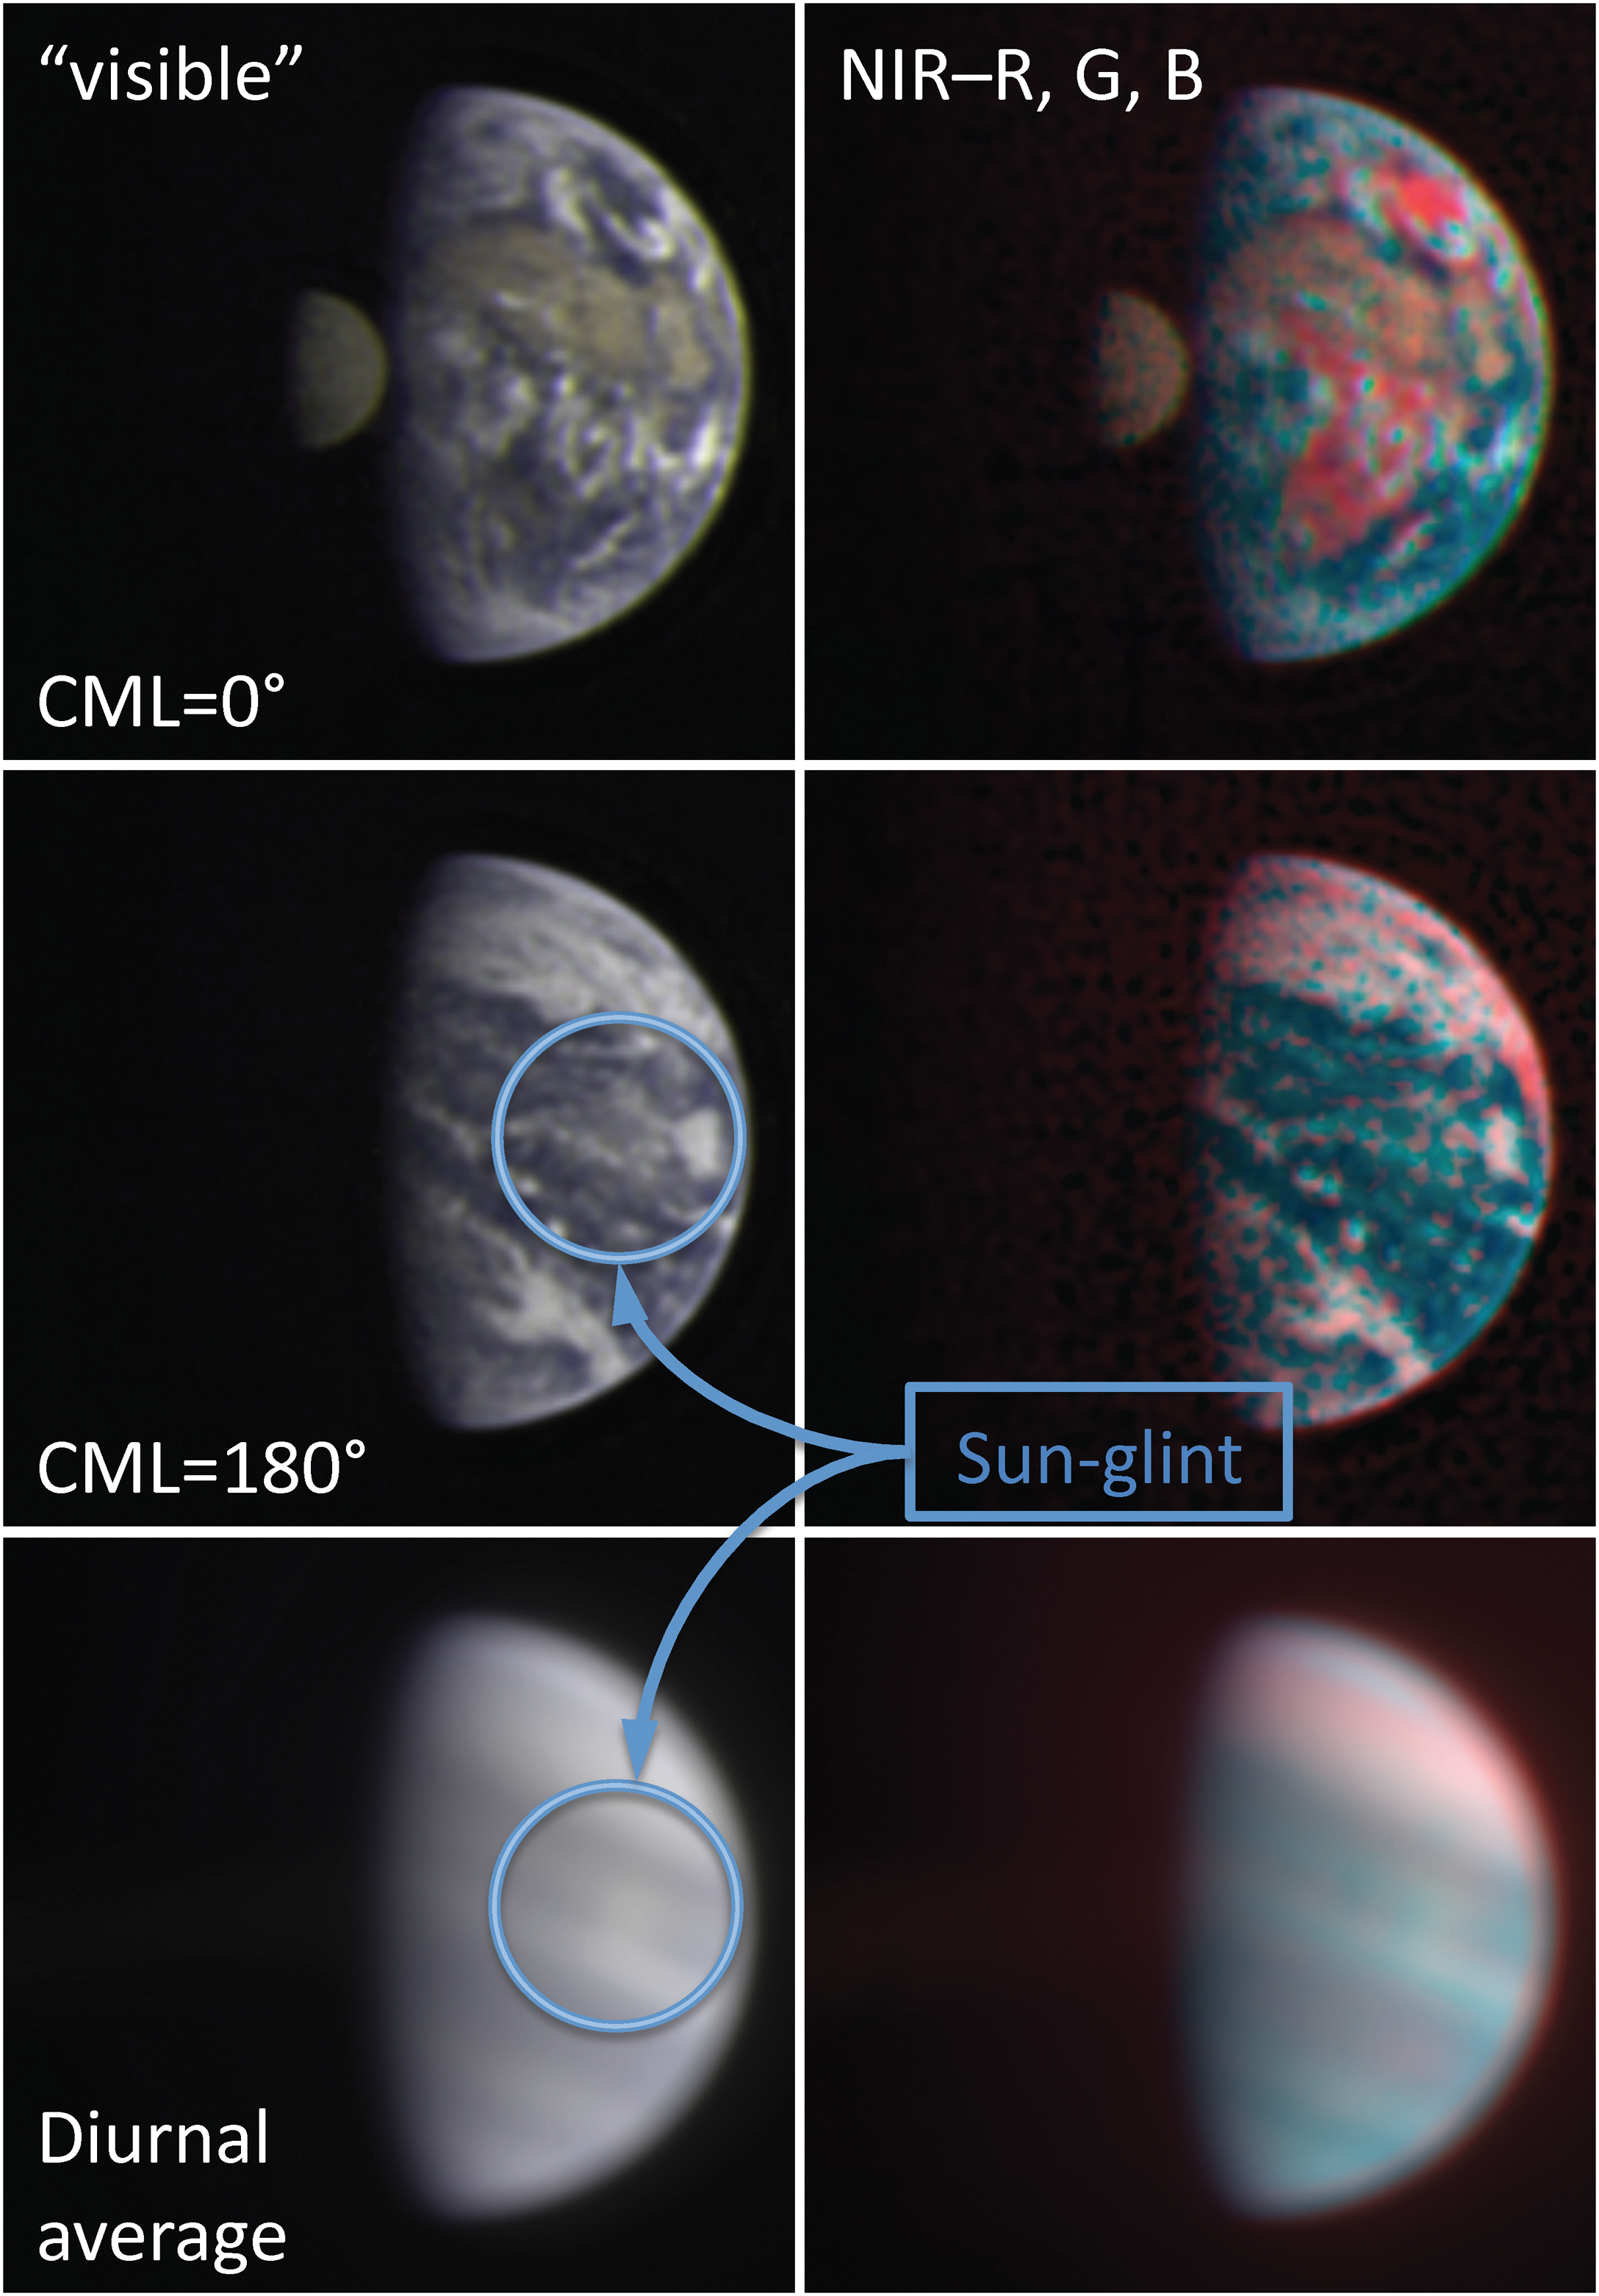
EarthObs4 images, illustrating contributions by variable reflection from surface coverings, specular reflection from open water (Sun glint), and the Moon. These images have been deconvolved by the HRIVIS point-spread function. At 0° central meridian longitude (CML), the disc is dominated by Africa and the Sahara Desert. At 180° CML, the disc is dominated by the Pacific Ocean, with North America at the sunlit limb. The bottom row is diurnally averaged. Sun glint is in an extended region centered in the circular indicators, most easily seen in animated imagery. The “visible” column is a low-fidelity approximation to human color vision, in which Earth is relatively low in contrast. The “NIR–R, G, B” images map the 550 nm reflectance to green, the 450 nm reflectance to blue, and the red channel is the difference in reflectance between 850 nm (NIR) and 650 nm (R), mapping the “vegetation red edge” spectral contrast. The diurnally averaged image of Earth exhibits little contrast at the VRE, with the greatest contrast at northern temperate latitudes. The color of the arid Moon is similar to the Sahara due to red slope in the soil spectrum.

(
2.2. Acquisition of infrared spectroscopy
Spectroscopic measurements of Earth were acquired with the HRIIR every 2 h, covering the spectral range 1100–4540 nm. A total of 13 distinct spectroscopic measurements were acquired in each Earth observation, separated by 30° rotation of Earth. The HRIIR slit is 10 μrad wide (2.1 arcsec), dispersed refractively by a prism to illuminate a 1024×512 pixel detector array (Hampton et al., 2005), operated in a binned mode to yield an effective 512×128 pixel spectral “frame” with the larger dimension in the dispersion direction and the smaller dimension yielding coarse spatial information along the slit length at 10 μrad/pixel. The spatial dimension was limited by binning and by reading only the central half subarray of the detector. The spectral resolving power (λ/Δλ) of the HRIIR in this mode is approximately 730 near ∼1100 nm, diminishing to ∼215 near 2500 nm and increasing to ∼370 near 4500 nm. The central half of the spatial range in the binned subarray is covered by a filter that is nearly transparent at short wavelength with increasing opacity at long wavelength. Earth was placed behind the filter in all measurements to avoid saturating the long-wavelength portion of the spectrum with thermal emission. The slit was oriented parallel to the direction of the Sun and thus perpendicular to Earth's terminator, with dispersion parallel to the terminator. Figure 3 illustrates the diurnally averaged IR spectrum obtained from the HRIIR for Earth and Moon. The individual component spectra also are plotted in Fig. 3 with dotted lines, showing the variability of the measured spectra.
The spatial dimension of the central filter is significantly greater than the apparent diameter of Earth during these observations, whereas the narrow spectrometer slit is many times narrower. Earth's globally integrated spectrum was acquired by scanning the slit across the disc perpendicular to the slit and parallel to the terminator, so that one integration frame could capture the spectrum of the entire disc. A total frame integration time of 2 sec with an angular scan rate of 300 μrad/sec (62 arcsec/sec) captured Earth's spectrum with an optimal maximum exposure level of about half the detector dynamic range for the combined Earth signal and detector dark current. Each acquisition recorded eight consecutive frames: two waste frames at the beginning of a sequence while electronics settled and the spacecraft accelerated to the intended angular scan rate, two frames to acquire instrument background before the science frames, three science frames, and one more background frame. Although Earth, in principle, could be captured in a single frame, spacecraft targeting is not sufficiently accurate to time the beginning and end of a frame integration such that Earth would have been entirely contained within a single scanned frame. Instead, Earth signal is distributed unpredictably over one or two consecutive frames of the three science frames. Time lost during the frame read-out operation is negligible compared to the overall integration time; thus, the sum of the frames containing signal represents the full signal from the target. Since spacecraft targeting was uncertain in both the scan direction and in the cross-dispersion (spatial) direction, spectra were acquired by scanning in three parallel strips spaced by 150 μrad (31 arcsec) so that even with the known pointing uncertainty of up to ∼145 μrad (30 arcsec), at least one of the scanned frame sets included Earth fully within the anti-saturation filter. In those instances in which two frame sets included a well-positioned spectrum of Earth, the spectra were averaged together to improve signal to noise.
3. Data Reduction and Calibration
Visible imaging with the HRIVIS camera was corrected for pixel-to-pixel variations in CCD detector sensitivity by using flat-field exposures of an integrating sphere measured during spacecraft testing and validation prior to launch (Klaasen et al., 2008). Observations of transiting planets as part of the EPOCh investigation (e.g., Ballard et al., 2010) showed that the flat-field response of the detector changed in flight. Differences from the ground flats of approximately 1% are present with a quasi-random spatial variation across the detector array. Although these differences posed a challenge to the ultrahigh-precision small-aperture photometry required for exoplanet transits, they are not a significant source of error for the Earth observations, which combine signal from many thousand pixels per frame and thus reduce the significance of random deviations in flat-fielding to negligible levels.
Flat-fielding of the IR spectrometer detector was accomplished after launch by scanning the slit across the Moon in the cross-dispersion direction to uniformly illuminate the slit with reflected sunlight and thermal continuum emission. Observations of astronomical standard stars were also used to develop absolute intensity calibration for the visible filter spectrophotometry and IR spectroscopy (Klaasen et al., 2008). All calibrations applied to the data reported here were determined during the Deep Impact prime mission. While additional calibration data have been acquired during the EPOXI mission, the resulting updated calibrations have not yet been incorporated into automated processing.
3.1. Extraction of calibrated visible spectrophotometry from images
The spectrophotometric signal is extracted from Earth images by aperture photometry, summing over a circular extraction region centered on Earth's disc. Earth disc center is located automatically by maximizing the correlation product between the measured Earth image and a model disc with enhanced limb, for sensitivity to the location of the limb in the images (Fig. 2). For these purposes, high precision is not necessary, and the center location is precise to only about one pixel. The extraction region is surrounded by an annulus of similar surface area from which an average background signal per pixel is determined and subtracted from pixels in the extraction region to compensate for internal reflections and minor defects in bias subtraction. The radius of the extraction region is gradually enlarged over successive evaluations of the aperture-integrated signal from slightly greater than Earth size until the net signal stabilizes, which ensures that signal from Earth's image is completely captured. The calibrated image units evaluate surface brightness in W/m2/μm/ster. Multiplication of the summed signal by the known solid angle per pixel yields collected intensity, W/m2/μm. The net extracted signal in each individual measurement is further scaled by the square of the spacecraft range, in astronomical units, and by the square of Earth's heliocentric distance, in astronomical units, to yield signal equivalent to a measurement at precisely 1 AU range, with Earth at precisely 1 AU heliocentric distance. This scaling accounts for ∼3% variability between beginning and end of EarthObs1 and the much greater signal disparity between the individual observation events.
The diurnally averaged visible spectrophotometry of Earth and Moon is reported in Table 2 and displayed in Fig. 3. The nominal uncertainties quoted in Table 2 represent the outer limits of the central 68th percentile of measured points and thus approximate the population standard deviation of the actual measured light curve. This distribution is determined primarily by intrinsic variability of Earth's signal rather than measurement uncertainty. Lunar photometry was extracted from the subset of EarthObs4 images in which the Moon appears fully within the camera field of view and the Moon's signal could be extracted with neither the extraction region nor the surrounding annulus encountering Earth's visible-light image. The lunar photometry variability was estimated similarly to that of Earth but for fewer measurements: 22 measurements in the four high-cadence filters and 7 measurements in the three low-cadence filters. The Moon rotated negligibly during the course of these observations; thus the variability in the lunar signal should be a good estimator for measurement uncertainty. Scaling by the relative diameter of Earth and Moon to account for the relative signal-to-noise ratio suggests that the measurements of Earth signal in EarthObs4 are good to about 0.05%, or five parts in ten thousand.
The signal for Earth was extracted from EarthObs4 data as described previously, except that in a subset of images the extraction region centered on Earth unavoidably included the image of both Earth and Moon during the transit. When the Moon was more completely separated from Earth in EarthObs4 observations, the Moon was masked out of the image by replacing that region of the image with the average signal level from the surrounding annulus, so that Earth's signal could be extracted without interference. The extracted lunar signal was then added back to the Earth extraction to yield the net signal for the observed system, since the Moon and Earth could not be extracted separately during the actual transit. The reported spectrophotometry in Table 2 and Fig. 3 for EarthObs4 includes a combination of measurements with and without the Moon in the field of view, which turns out to make very little difference in visible light.
Table 3 and Fig. 4 report the diurnally averaged visible reflectance of Earth, computed as the measured signal intensity scaled by 1/r 2 from the spacecraft to Earth's surface and divided by the surface insolation, but otherwise not employing any particular scattering model or assumed phase function to attempt to recover the geometric albedo. The tabulated values thus are directly proportional to some actual phase function, but neither the phase function nor the constant of proportionality are determined. The filter-averaged insolation is determined from the ASTM Standard E490-00a (2006) solar spectral intensity at the top of the atmosphere, at 1 AU heliocentric distance.
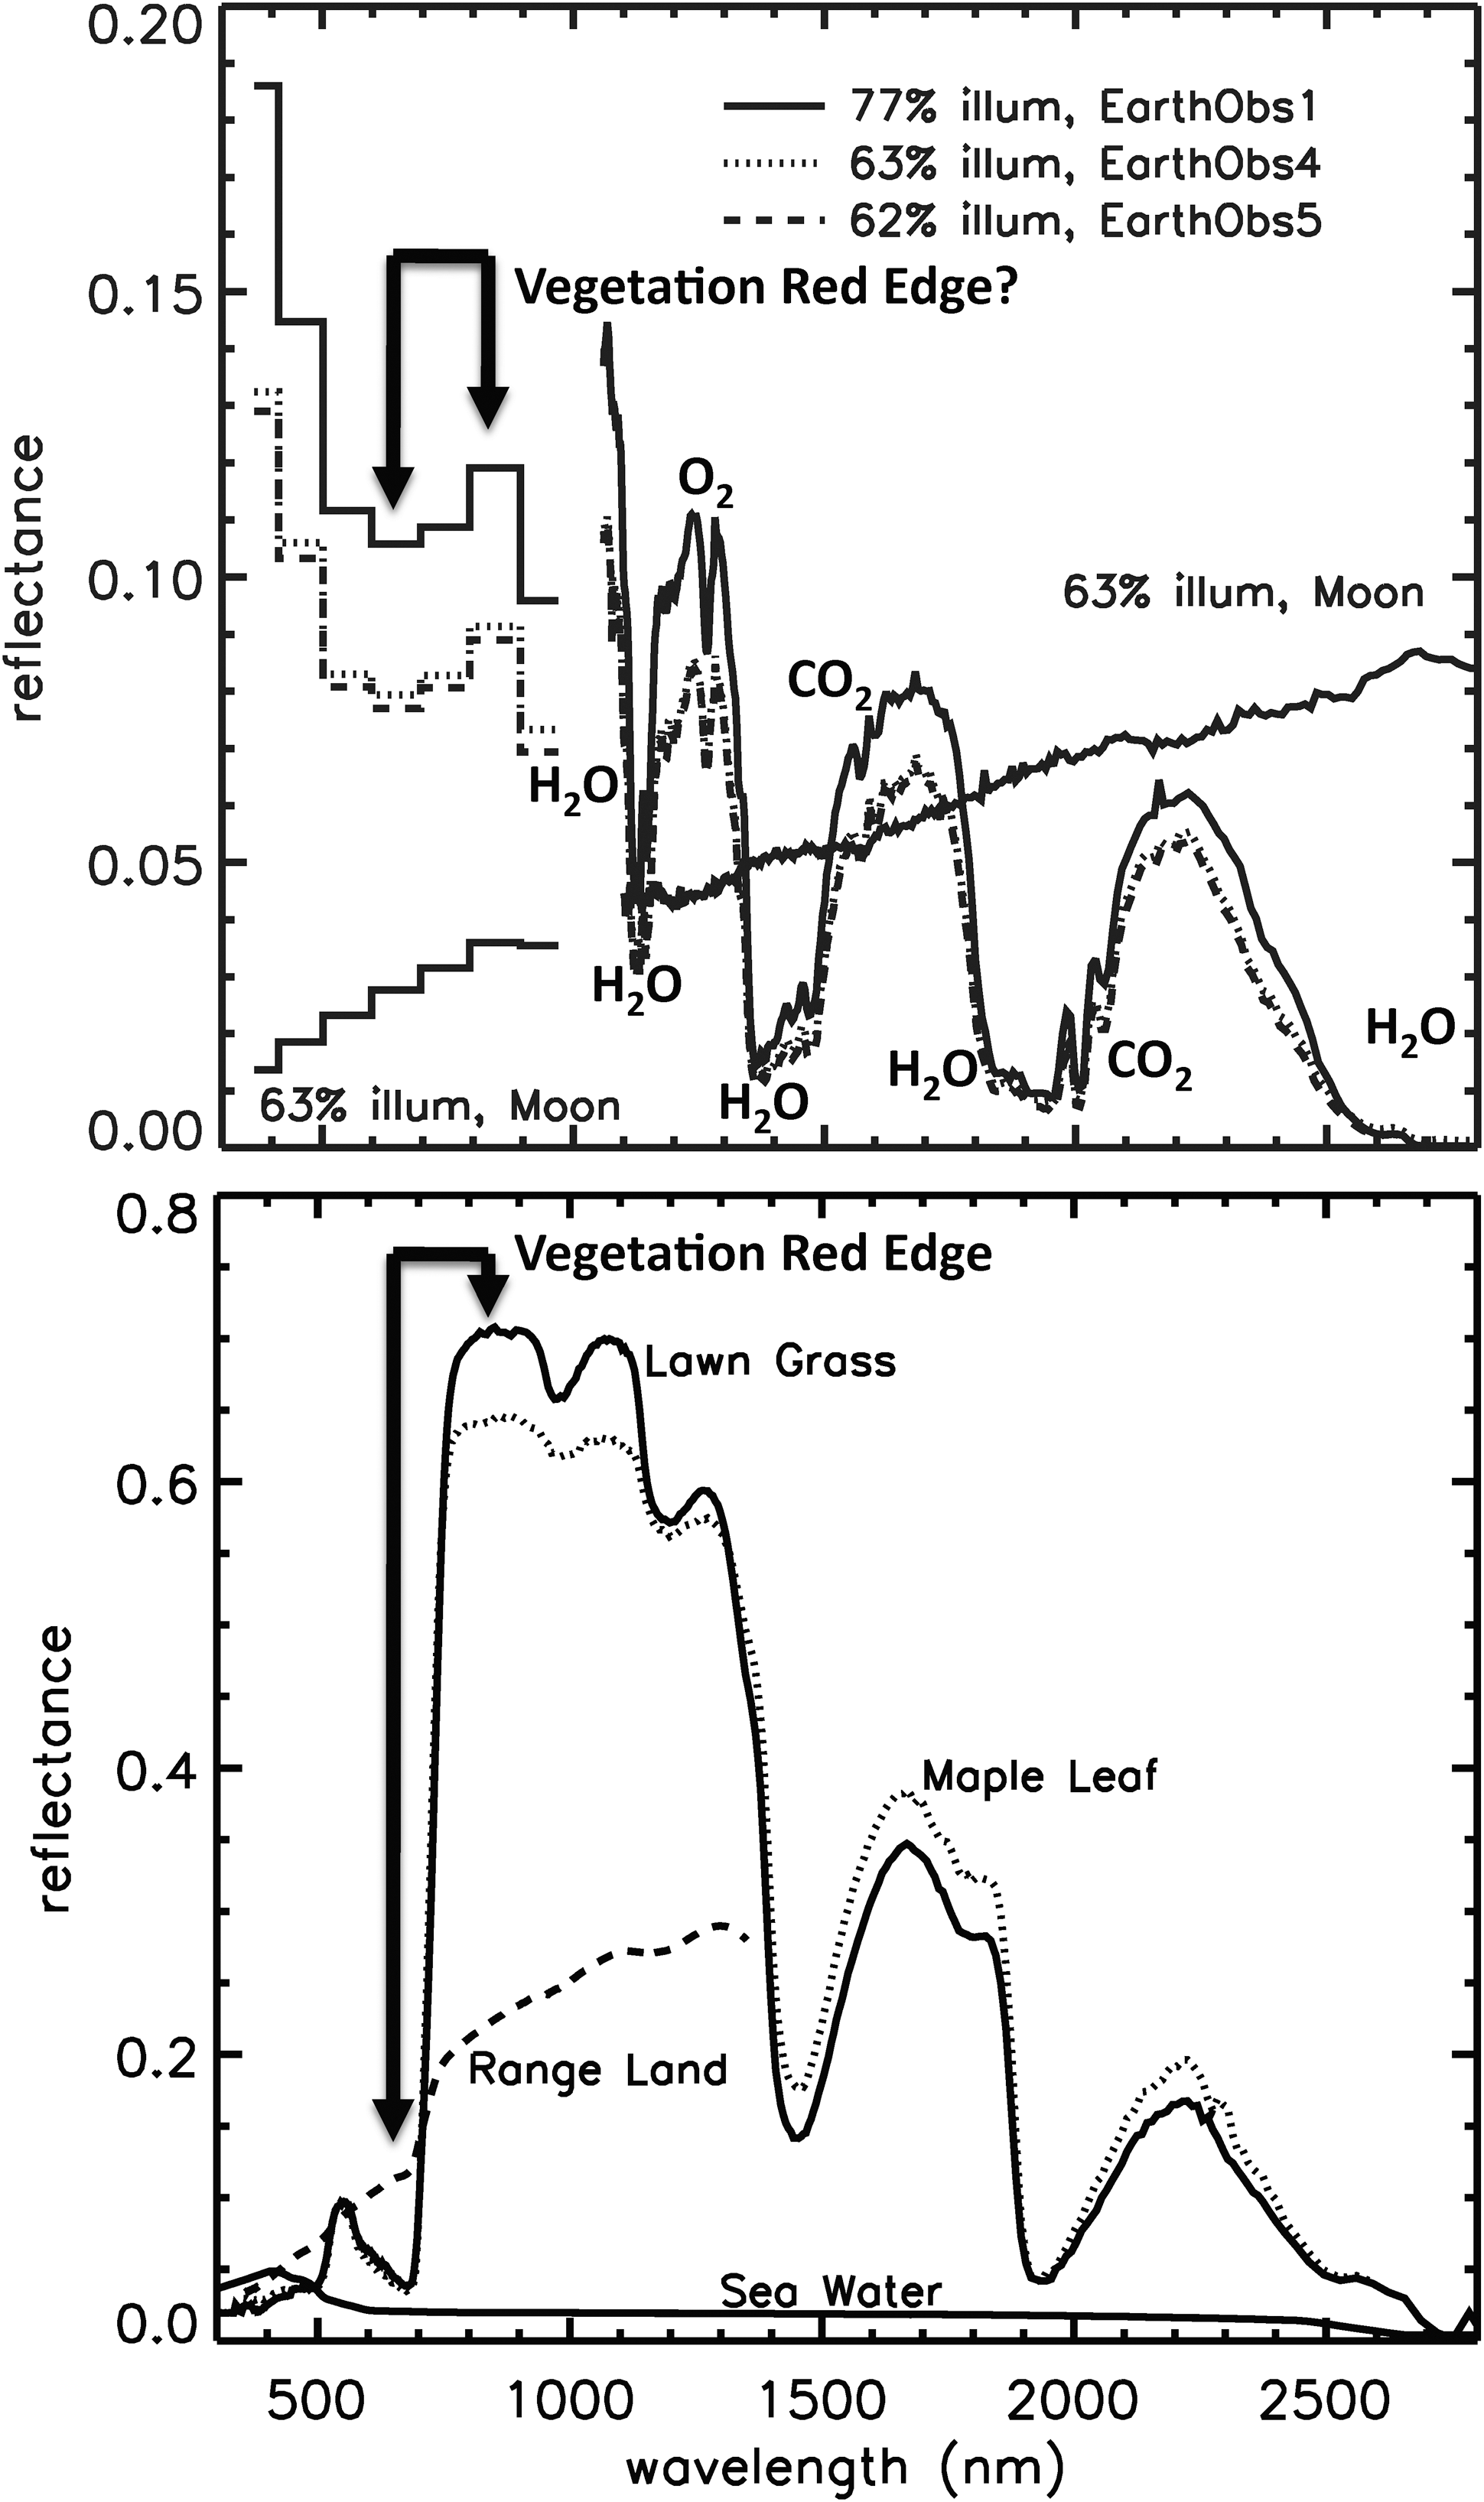
Diurnally averaged reflectance spectra of the global Earth and Moon, 372–2800 nm, not corrected for phase angle, compared to some relevant Earth cover materials: lawn grass, maple leaf, sparse range land, and seawater (from Clark et al., 2007). The Moon's spectrum is steeply sloped and red but otherwise relatively featureless. Plant leaves are highly reflective at ∼800–1300 nm and weakly reflective shortward of ∼750 nm, the “vegetation red edge.” Seawater is relatively dark at all wavelengths, and range land is sloped red, similar to the lunar spectrum. Short-wavelength reflectance in Earth's spectrum is consistent with Rayleigh scattering by the atmosphere and inconsistent with surface coverings. The modest contrast in Earth's spectrum at long visible wavelengths is not consistent with the strong contrast of the red edge in green plants.
Reflectance is determined by scaling intensity from 1 AU range to the surface of Earth/Moon and dividing by the filter-weighted average of the solar intensity at 1 AU heliocentric range; thus, reflectance quoted here is proportional to the actual phase function, but the constant of proportionality is undetermined.
3.2. Extraction of calibrated infrared spectra from spectral images
The IR spectrum is extracted from each scan sequence by processing multiple spectral images (frames). The three background frames from the sequence are spatially median-filtered to eliminate cosmic-ray hits and co-added, then subtracted from the co-added three science frames to compensate for defects in pipeline bias subtraction. The image is summed in the spatial (cross-dispersion) direction to construct a combined disc-integrated spectrum. In EarthObs4, the lunar signal is processed separately from Earth's signal when they are sufficiently spatially separated to be distinguished. Lunar data also include signal from when the Moon is located outside the anti-saturation filter, as the net signal is modest enough to avoid saturation and the apparent diameter of the Moon is small enough that it is fully captured in this region. Both Earth and Moon spectra are displayed in Fig. 3.
The calibration of the spectra to absolute surface brightness is a routine part of the automated data analysis pipeline. Multiplication of the surface brightness in W/m2/μm/ster by the solid angle of each pixel, which is effectively a rectangular region of 10 μrad by the scanned angle of 600 μrad, recovers spectral intensity in W/m2/μm. Similar to the visible spectrophotometry, the variability of Earth's illumination intensity and variability in Earth-to-spacecraft range were compensated by scaling by the range squared. This scaling is accurate for the reflected portion of the spectrum but does not correctly represent the heliocentric range dependence of the thermally emitted portion of the spectrum, at long wavelength, where the spectral shape depends on the temperature in radiant equilibrium. The inaccuracy of the intensity scaling applied to the thermal emission has no effect on deducing the color temperature of Earth in each observation. Recently, in December 2010, an error was identified in the calibration pipeline for binned HRIIR spectra that results in overestimating the measured brightness by a factor of two (precisely). This error has been corrected post-calibration in the spectra reported here. A future delivery of EPOXI and Deep Impact data to the Planetary Data System will correct this error. At the present time, the calibration of binned data in the Planetary Data System archive is incorrect by this factor.
4. Properties of Major Reflectance Components
Figure 4 compares the observed diurnally averaged and disc-integrated reflectance spectrum of Earth with the reflectance of some common Earth surface coverings: vegetation, represented by lawn grass of indefinite species and hardwood (maple) leaves, which have very similar spectra; sparsely vegetated soil, represented by Western North American range land; and seawater, covering roughly two-thirds of Earth's surface, by far the most significant surface unit (spectra from U.S. Geological Survey digital spectral library, Clark et al., 2007). The reflectance of range land increases monotonically toward longer wavelengths. Sea water is dark apart from a modest blue component. These spectra should be grossly representative of Earth surface materials, aside from details due to specific plant or mineral species. None of these spectra is consistent with the short-wavelength reflectance enhancement in Earth's spectrum, which suggests Rayleigh scattering by Earth's dense and transparent atmosphere of molecular oxygen and nitrogen.
Earth's atmosphere is a relatively strong Rayleigh scatterer. The H2-dominated atmospheres of the giant planets have a low cross section for Rayleigh scattering. Mars' CO2 atmosphere is relatively tenuous and does not offer sufficient optical path length to scatter significantly. Venus, although having a very dense CO2 atmosphere, has the optical path length cut off by high-altitude haze clouds and thus is similar to Mars in terms of Rayleigh scattering. Earth's strong short-wavelength visible Rayleigh scattering thus appears to be a unique feature within the Solar System, demonstrated empirically by Crow et al. (2011) in comparisons with disc-integrated spectra of the major Solar System bodies. Radiative-transfer modeling will be required to explore whether other atmospheric recipes—for example, putative early-Earth atmospheres with little or no molecular oxygen (Kaltenegger et al., 2007); high densities of species such as methane; a haze-free Venus-like atmosphere; a dense Mars atmosphere; and so on—could result in a spectrum similar to modern Earth. Spectroscopy of Earth validates simulations such as the Virtual Planetary Laboratory three-dimensional spectral model for the appearance of Earth to a distant observer (e.g., Robinson et al., 2011), which enables this and similar tools to be applied to model any arbitrarily imagined exoplanet, as in the cases described above.
The “vegetation red edge” (VRE) is a distinctive feature in the reflectance spectrum of Earth's chlorophyllaceous plants, a sharp discontinuity at ∼700–800 nm with strong reflectance in the near IR and weak reflectance at shorter wavelength (Fig. 4; Seager et al., 2005). In the visible range, the spectrum of plant leaves typically features the familiar green maximum reflectance between major absorption features at blue and red wavelengths, while the near-IR spectrum is dominated by absorption features of adsorbed and intracellular H2O.
Earth has featured land-surface photosynthesis for no more than the past billion years of its history (Heckman et al., 2001) and definitively for only the past 0.5 billion years for which there is fossil evidence (Taylor et al., 2009)—at most, ∼29% of the estimated 3.5 billion years of bacterial life on Earth (Schopf, 2006). This is the only portion of Earth's history as a living planet during which the red edge could be exploited to detect life by remote sensing. Phytoplankton and cyanobacteria are much older than land plants and also photosynthesize, but they are submerged within seawater. The minimal reflectance of seawater results in essentially no contrast at 700 nm; thus, only land-based or floating surface vegetation is detectable in the VRE contrast (Fig. 2). Some terrestrial organisms that photosynthesize find refuge from a harsh environment within the shallow subsurface or out of direct light, which results in no surface spectral signature from the VRE (Cockell et al., 2009). Many terrestrial bacteria photosynthesize by using chemical systems other than chlorophyll, while many other bacteria and archaea consume chemical resources (chemotrophy) in anaerobic environments with gaseous waste products other than oxygen. These organisms provide possible models for non-chlorophyll-based alternative ecosystems that may have been well represented during the oxygen-poor first few billion years of life on Earth. Ultimately, chlorophyll conquered Earth through unlimited energy resources from sunlight and the production of gaseous waste; terrestrial non-chlorophyll photosynthesis now is relegated to niche environments such as the purple halobacteria in the salt evaporation ponds of South Bay, San Francisco (e.g., Rothschild, 2002). Although it may not be the only photosynthetic system that could do so, chlorophyll's demonstrable domination of Earth's biosphere makes it plausible to consider for the remote detection of extraterrestrial life on a planetary scale, even though in Earth's example it would be detectable for only a minority of the biosphere's lifetime.
The distribution of vegetation on Earth's surface can be mapped by remote sensing observations sensitive to the VRE spectral contrast (Figs. 2, 4). The normalized difference vegetation index (NDVI) is commonly used for this purpose in Earth remote sensing (Ustin et al., 1999; Bannari et al., 2007) and has been applied to numerical simulations of Earth's global spectrum (Tinetti et al., 2006b). In the present case, the NDVI is applied to Earth's empirically determined disc-integrated spectrum to investigate whether the combination of Earth surface materials results in a measurable vegetation signature in Earth's actual rotationally averaged spectrum. The NDVI is composed from the difference between the reflectances above and below the VRE, divided by their sum to yield a dimensionless ratio that is relatively independent of phase angle or absolute calibration. The NDVI value varies from −1 to +1, where high positive values indicate abundant chlorophyllaceous leaf cover. The relevant EPOXI/EPOCh measurements are the reflectances measured at 650 nm and at 850 nm:
The upper image of Earth and Moon in Fig. 2 is from a phase in which Africa was presented on Earth while the Moon was in transit across Earth's nightside, while the next lower row shows the opposite face of Earth, dominated by the Pacific Ocean with the Americas barely visible on the daylight limb. The “visible” image column approximately simulates human color vision with weighted linear combinations of the 650, 550, and 450 nm reflectance images mapped to the red-green-blue image channels, modeled after the more careful methods of Bell et al. (2006) and Bell and Savransky (2006). Mapping the red image channel to an image proportional to the NDVI, composed from the difference between the 850 nm and 650 nm reflectance, with 550 nm reflectance in the green channel and 450 nm reflectance in the blue channel, results in very bright red in the well-vegetated regions of sub-Saharan Africa, Madagascar, and Europe, and partially eliminates the obscuration of the continents by low–optical depth clouds, as the gray scattering by clouds subtracts to near-zero differential between the images.
The NDVI is effective in identifying vegetated regions in resolved images, but the technical difficulty of sufficiently high angular resolution is such that early reconnaissance of exoplanets will study unresolved targets with light collected over an extended interval. The lowest row of Fig. 2 explores the meridional distribution of contributions to the measured spectrum from registering and averaging Earth images through each filter over the full rotation observed in EarthObs4. The Moon's residence time in any given part of the image is so short, and the Moon is of such low reflectance, that it is not a significant component of these images. The EarthObs1 and EarthObs5 data sets result in similar time-averaged images. The time-averaged Earth is nearly uniform gray, with a slightly brighter Sun-glint feature interior to the illuminated crescent. Sun glint has been proposed as a strategy to detect oceans on exoplanets from specular reflection by open water (e.g., Williams and Gaidos, 2008; Robinson et al., 2010). The visible spectroscopy of the Sun glint detected in EPOXI data will be explored by Barry et al. (unpublished results) to assess whether the glint is produced exclusively by specular reflection from the ocean surface or includes sub-Sun reflection from high-altitude cirrus particles. The diurnal-average NDVI image identifies the northern temperate and higher latitudes as the dominant location of plant life in the rotational average, regardless of the fact that Africa is a major vegetated region. Only about one-third of Earth's diurnally averaged image displays a significant NDVI vegetation signature. This image shows that the inclination angle from which an Earth-like planet is observed can have a significant effect on whether any vegetation is available to be observed, regardless of the detection strategy used. A view from high southern latitude would be dominated by ocean, with little continental landmass.
The NDVI concept can be expanded to the rest of the visible spectrum as a normalized difference index (NDI), in which NDIλ is a function of wavelength computed from the difference between reflectance at 850 nm and reflectance at any other wavelength, normalized to the sum of the respective reflectance measurements:
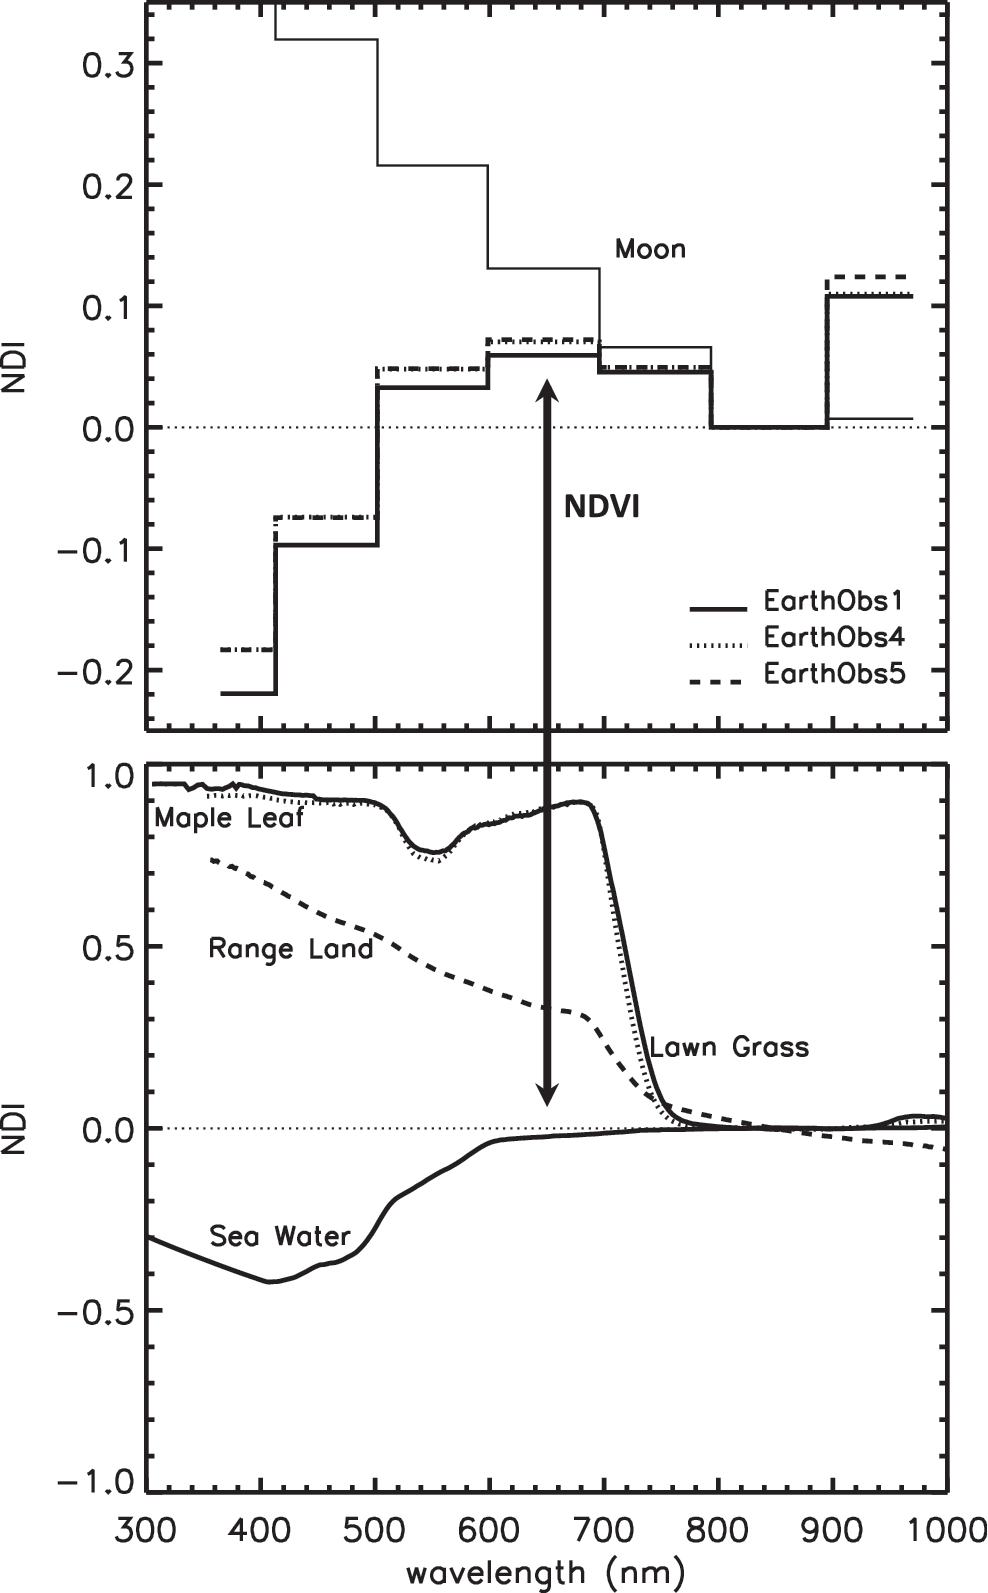
Normalized difference index (NDI) spectrum of Earth and Moon (top) representing the contrast of reflectance relative to 850 nm, in comparison to relevant Earth surface cover materials (bottom). EarthObs4 and 5 (dotted and dashed histograms) are nearly indistinguishable, despite the Moon's unique contribution to measurements in the EarthObs4 average, suggesting that spectral differences between EarthObs1 and EarthObs4/5 are solely seasonal effects. The special case of the normalized difference vegetation index (NDVI) is indicated, contrasting 650 and 850 nm. The NDVI is a modest local maximum for Earth. Lunar NDVI is greater than Earth's global average, and the lunar NDI monotonically increases with decreasing wavelength. NDI of plant materials (bottom) is elevated for all wavelengths short of 700 nm; range land is sloped similar to the lunar NDI spectrum; seawater NDI is depressed below zero at shorter wavelengths due to blue reflectance of ocean water but with a different spectral shape than Earth's blue global spectrum.
Normalized difference index, NDI=(R 850−R λ)/(R 850+R λ), where R λ is reflectance at wavelength λ; values are in the range [−1, +1]. NDI at 650 nm is identical to the normalized difference vegetation index (NDVI).
The NDI spectrum of the Moon and of range land are superficially similar. Both increase monotonically toward shorter wavelength, although the Moon's slope is much less steep than range land. Earth's NDI spectrum is locally peaked at 650 nm, the NDVI, which would seem to be evidence for vegetation on Earth. However, the NDVI for the Moon is much greater than that for Earth, and Earth's NDI spectrum does not otherwise resemble any single one of the suggested surface materials, including leaves. The actual spectrum of Earth must result from a linear combination of Earth surface materials as well as gray scattering by clouds and atmospheric Rayleigh scattering. A surface of low reflectance, like seawater, does not significantly dilute the NDI, as it contributes neither to the numerator nor to the denominator in evaluating the NDI. A surface of relatively high gray reflectance, like clouds, snow, or ice, contributes little to the difference term in the numerator of the NDI but can increase the summed term in the denominator and thereby diminish the magnitude of the disc-integrated NDI. Earth's extensive cloud cover, and to a lesser extent its ice cover, substantially masks the fraction of Earth's surface that is composed of minerals and vegetation. It is not clear whether unambiguous evidence for vegetation could be extracted from such a measurement of an exoplanet in the absence of prior knowledge of vegetation. The significant differences between the lunar and terrestrial NDI spectra, however, demonstrate that measurements of three or more well-chosen wavelengths could definitively distinguish between Earth-like and Moon-like surfaces.
Crow et al. (2011) used EPOXI data to compare Earth's visible-light colors with the other major bodies of our Solar System and found that Earth is unique in having both a blue spectrum at short wavelengths and a red spectrum at long wavelengths. While it is possible that Earth's peak NDI (minimum reflectance) at 650 nm is actually due to the spectral properties of vegetation, an alternate scenario that happens to be untrue for Earth could account for the observation equally well: a global desert planet with red-sloped mineral soils under a dense Rayleigh-scattering atmosphere (à la Herbert, 1965). The VRE appears to be, at best, ambiguous in describing the surface properties of Earth, much less those of an unknown planet. The Rayleigh-scattering signature at short wavelengths, combined with the red slope at long visible wavelengths, may be sufficient in itself to justify a reconnaissance identification of an Earth-like planet.
5. Diurnally Averaged Reflectance and Emission Spectra
Figure 3 displays the full wavelength range of the diurnally averaged and disc-integrated measured spectra for Earth and Moon, from 300 to 4540 nm, compared to the solar spectrum scaled to the peak in the EarthObs1 visible spectrum for comparison. The EPOXI Earth spectrum peaks in the 450 nm band, while the lunar spectrum peaks broadly at 550–650 nm. Each body's spectrum declines through the near IR toward longer wavelengths. At wavelengths longer than about 2700 nm, Earth's spectrum is dominated by thermal emission between major absorption features of CO2 at ∼2800 nm and at ∼4200–4500 nm.
The emission spectrum between the CO2 features can be fit by a simple model of gray-body thermal continuum emission plus a modest solar reflected component. Ignoring the relatively minor absorption features due to H2O, methane (CH4) at ∼3300 nm, and a feature due to nitrous oxide (N2O) at ∼3910 nm, the spectrum can be fitted with a uniform reflectance for the solar component, uniform emissivity for thermal emission, and the Planck function color temperature for thermal emission measured in each of the 13 near-IR spectra. We do not report the fitted value for the emissivity (which is close to unity), nor brightness temperature, since the intensity of the thermal emission component of the spectrum is not well determined, and the precise retrieved values therefore would be misleading.
The median color temperature and error bars estimated from the limits of the central 68th percentile (1σ) interval of the retrieved values are reported in Table 2. The temperatures retrieved from EarthObs4 and EarthObs5 spectra, representing late northern spring, are nearly identical: (283–285)±4 K, close to the radiative equilibrium temperature at 1 AU of ∼282 K for an ideal blackbody test object. The EarthObs1 disc-integrated color temperature, representing early northern spring/early southern autumn, is somewhat warmer at 291±6 K. The thermal continuum emission surface is an indistinguishable amalgam of clouds, sea surface, and landmasses at a variety of physical temperature. The time-averaged EarthObs4 spectrum displayed in Fig. 3 includes spectra contaminated by lunar thermal emission and retrieves a warmer color temperature, 295 K, due to the added thermal emission component from the Moon. In a real measurement of a spatially unresolved exoplanet, only the blended spectrum would be observed except for possible brief intervals in which the primary occults its satellite(s).
By comparison, the reflected solar spectrum is a more substantial contributor to the observed lunar spectrum at long wavelengths than for Earth. The lunar reflectance can be modeled very well as a linearly increasing function from 1000 to 2500 nm wavelength. By extrapolating this linear trend through the thermal emission region, we modeled the lunar flux as a simple sum of the solar spectrum times the linearly varying reflectance plus a gray-body thermal emission, fitting coefficients to the reflected and emitted components, as well as fitting the color temperature. The retrieved color temperature for the Moon at half phase is 316±6 K, determined from the median in the population of retrieved spectra; the uncertainty is estimated from the full range of variability in retrieved values, since so few spectra are available. The displayed spectrum and fit in Fig. 3 are for the averaged lunar spectrum, retrieving a somewhat cooler color temperature than the median, 314 K versus 316 K. The lunar color temperature is warmer than Earth's color temperature due to the combination of the Moon's lack of an atmosphere, its low reflectance, and its slow rotation rate, with a superheated subsolar point and little nighttime flux contribution/energy storage (after Spencer et al., 1989, and Lisse et al., 1999, 2005), while Earth's atmosphere and oceans as well as its relatively fast rotation spread the Sun's energy around the globe and store and release it on both the dayside and nightside.
Although the minor absorption features in Earth's spectrum at 2800–4200 nm are negligible for their effect on the retrieved color temperature, they are interesting as potential indicators for life on Earth-like exoplanets, as CH4 and N2O generally are considered to be biomarker species in Earth's oxidizing environment. Terrestrial N2O is created predominantly by soil bacteria (Chamberlain and Hunten, 1987). While methane is common in extraterrestrial environments, terrestrial CH4 is destroyed relatively rapidly in Earth's oxidizing atmosphere and thus must be resupplied by, for example, bacterial digestive processes, with only minor contributions (∼5–10%) from sources such as abiotic geochemistry (Atreya et al., 2011); contributions from human industry are more uncertain but certainly were minor until recently. There is a minor ozone (O3) absorption roughly coincident with the 3300 nm CH4 feature. Terrestrial ozone results from photochemistry of free molecular oxygen produced by photosynthesis; free oxygen is not strictly necessary as source material, however, since photochemistry in the CO2-dominated atmosphere of Mars results in small but measurable quantities of O3 (e.g., Fast et al., 2006). The suitability of these and other species as definitive biomarkers in the current or ancient terrestrial atmosphere is a topic for continued investigation (e.g., Schindler and Kasting, 2000).
Spectra from the EarthObs4 lunar occultation illustrate a potential source of systematic error in characterizing an Earth-Moon–like system by remote spectroscopy of features in the thermal emission spectrum, as in mid-IR concepts for a Terrestrial Planet Finder mission. In two of the measured spectra, the lunar and terrestrial images are not separable. In a real exoplanet detection of an Earth-like primary with a Moon-like secondary, no measurement could directly discriminate either body except during an occultation or transit. The depth of molecular features in the measured combined spectrum is significantly weaker than in Earth alone due to the relatively intense thermal emission by the airless lunar surface. Moskovitz et al. (2009) theoretically investigated the effect of such blended spectra on photometry of thermal emission from an exoplanet-exomoon system as a function of orbital phase. They found that a satellite's unrecognized presence significantly distorts parameters retrieved for the exoplanet, including thermal characteristics. The presence of an unrecognized planetary satellite in IR emission spectra of an exoplanetary system would dilute the signature of molecular species in the spectrum of the primary, including biomarker species. A very large moon or a moon with a high-albedo surface could have a similar diluting effect on the blended reflected-light spectra.
Figure 4 summarizes the diurnally averaged reflectance of Earth and Moon for all three observations, in the shorter-wavelength interval 300–2800 nm that is dominated by reflected solar signal. Significant molecular absorption features of gaseous H2O and CO2 are readily observable in the EPOXI spectra in this range. The presence of molecular oxygen (O2) from photosynthesis on Earth is indicated directly by a narrow feature at 1260 nm. The depth of the major H2O absorption features is variable, either due to variable cloud height changing the path length for reflection or variable humidity changing the extinction coefficient. Either explanation can be interpreted as an indicator for weather on contemporary Earth. Although most weather on Earth is confined to the troposphere, a more general conception of weather could include variable hazes in the stratosphere and higher (e.g., noctilucent clouds).
The reflected spectra of Earth and Moon are distinct (Fig. 4). The Moon's spectrum is a very red continuum, contrasting with Earth's water-absorption–dominated reflectance in the near IR and enhanced reflectance at the shortest visible (blue) wavelengths. The lunar reflectance spectrum shows no major molecular absorption features, which is consistent with the lack of a significant lunar atmosphere. Detailed analysis of other EPOXI mission spectra of the Moon has revealed subtle but measurable water absorption signatures due to mineral hydrates at the lunar surface (Sunshine et al., 2009).
6. Diurnal Light Curves
The EPOXI observations of Earth measured the diurnal variation of reflectance in each visible filter. Geometrically similar observations for exoplanets could acquire data of finite signal-to-noise ratio over an extended interval, from which to deduce the rotation period and phase the data to construct a time-averaged rotational light curve. Figure 6 shows light curves for the three equatorial Earth observations with the highest cadence filters, while Fig. 7 shows the variation of the normalized difference index, which could be used to attempt detection of variations in the VRE (e.g., Woolf et al., 2002). The complete measured photometry in all seven filters and for all three Earth observations is tabulated in Tables 5 (EarthObs1), 6 (EarthObs4), and 7 (EarthObs5), which are scaled to uniform range at 1 AU heliocentric distance and 1 AU from the spacecraft.
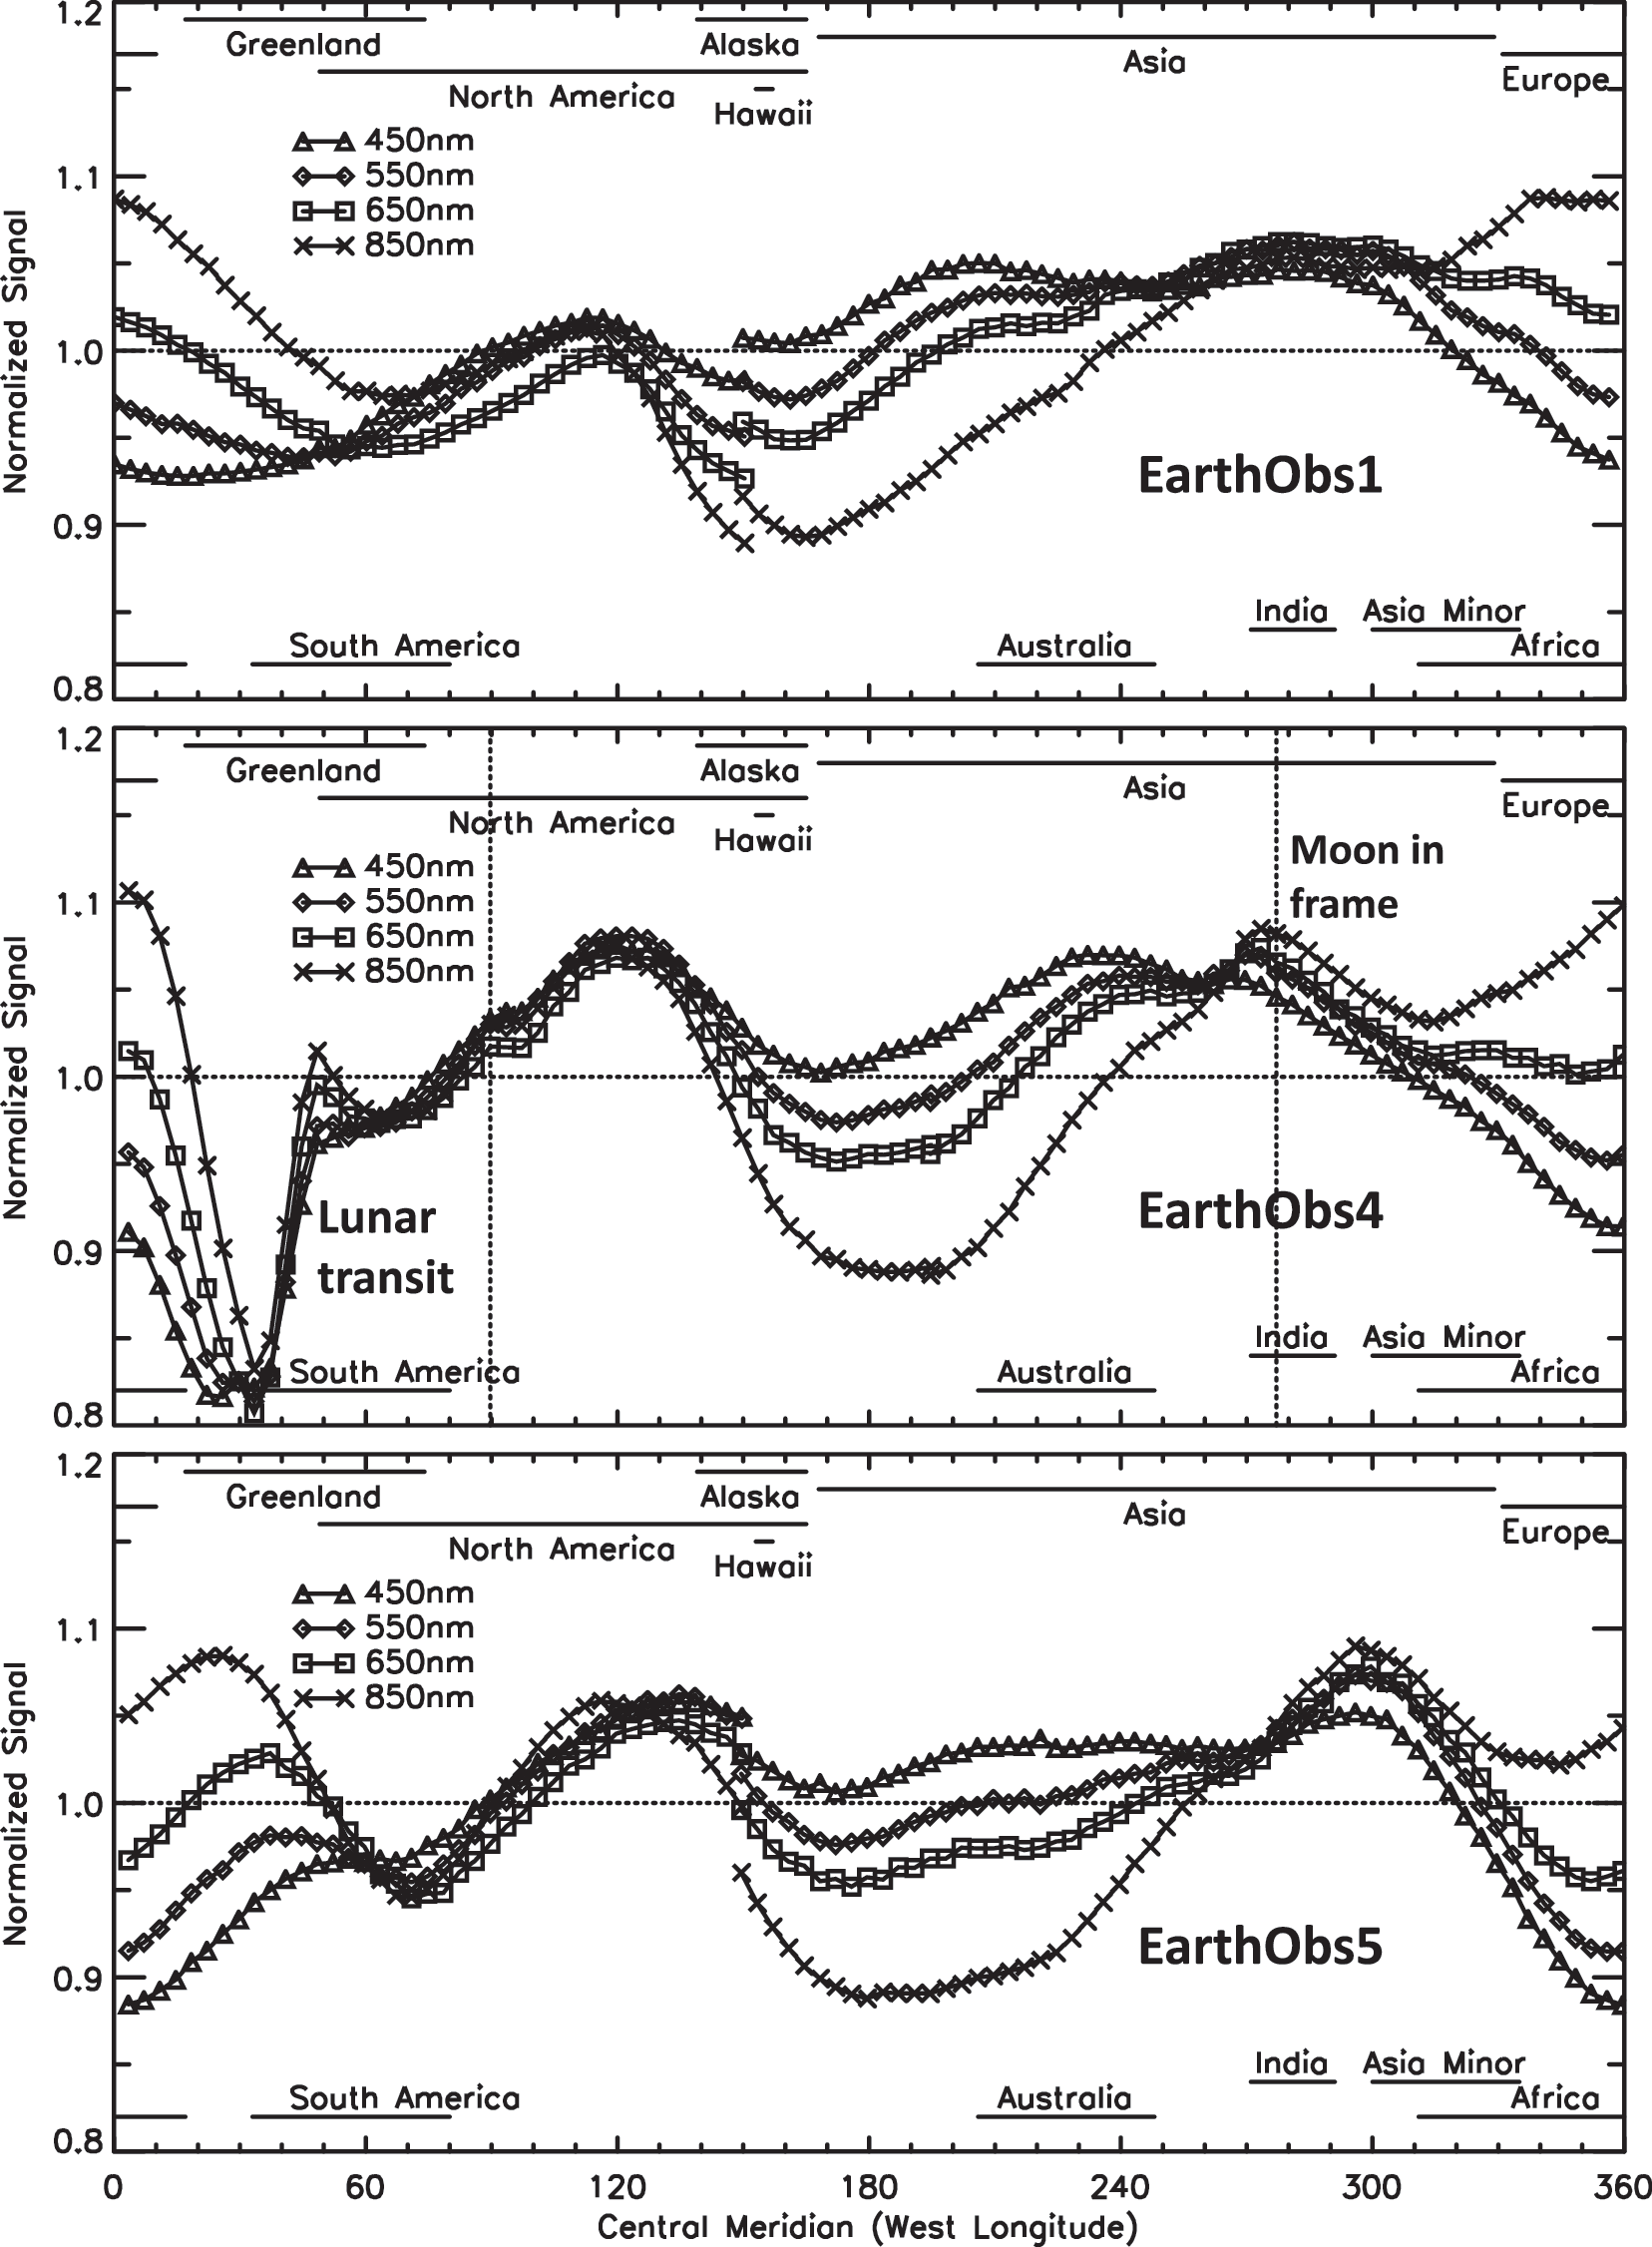
Disc-integrated light curves vs. west longitude in high-cadence visible photometry of Earth, normalized by the average photometric signal in each filter. The physical extent of the continents is indicated as they transited the central meridian, which was near the dawn terminator, thus illuminated only for west longitude greater than the nominal longitude of the continent. The discontinuity in the middle of the light curves is due to variable cloud cover between beginning and end of the measurement period. The greatest modulation is in 850 nm photometry, dark over the Pacific Ocean (transition between North America and Asia) and brighter over Europe and the Americas. The lunar transit in EarthObs4 resulted in a sharp decrease in signal at ∼10–40°W, as the Moon transited the day-lit portion of Earth's visible disc. The Moon entered the camera frame at about 277°W and exited at about 90°W.
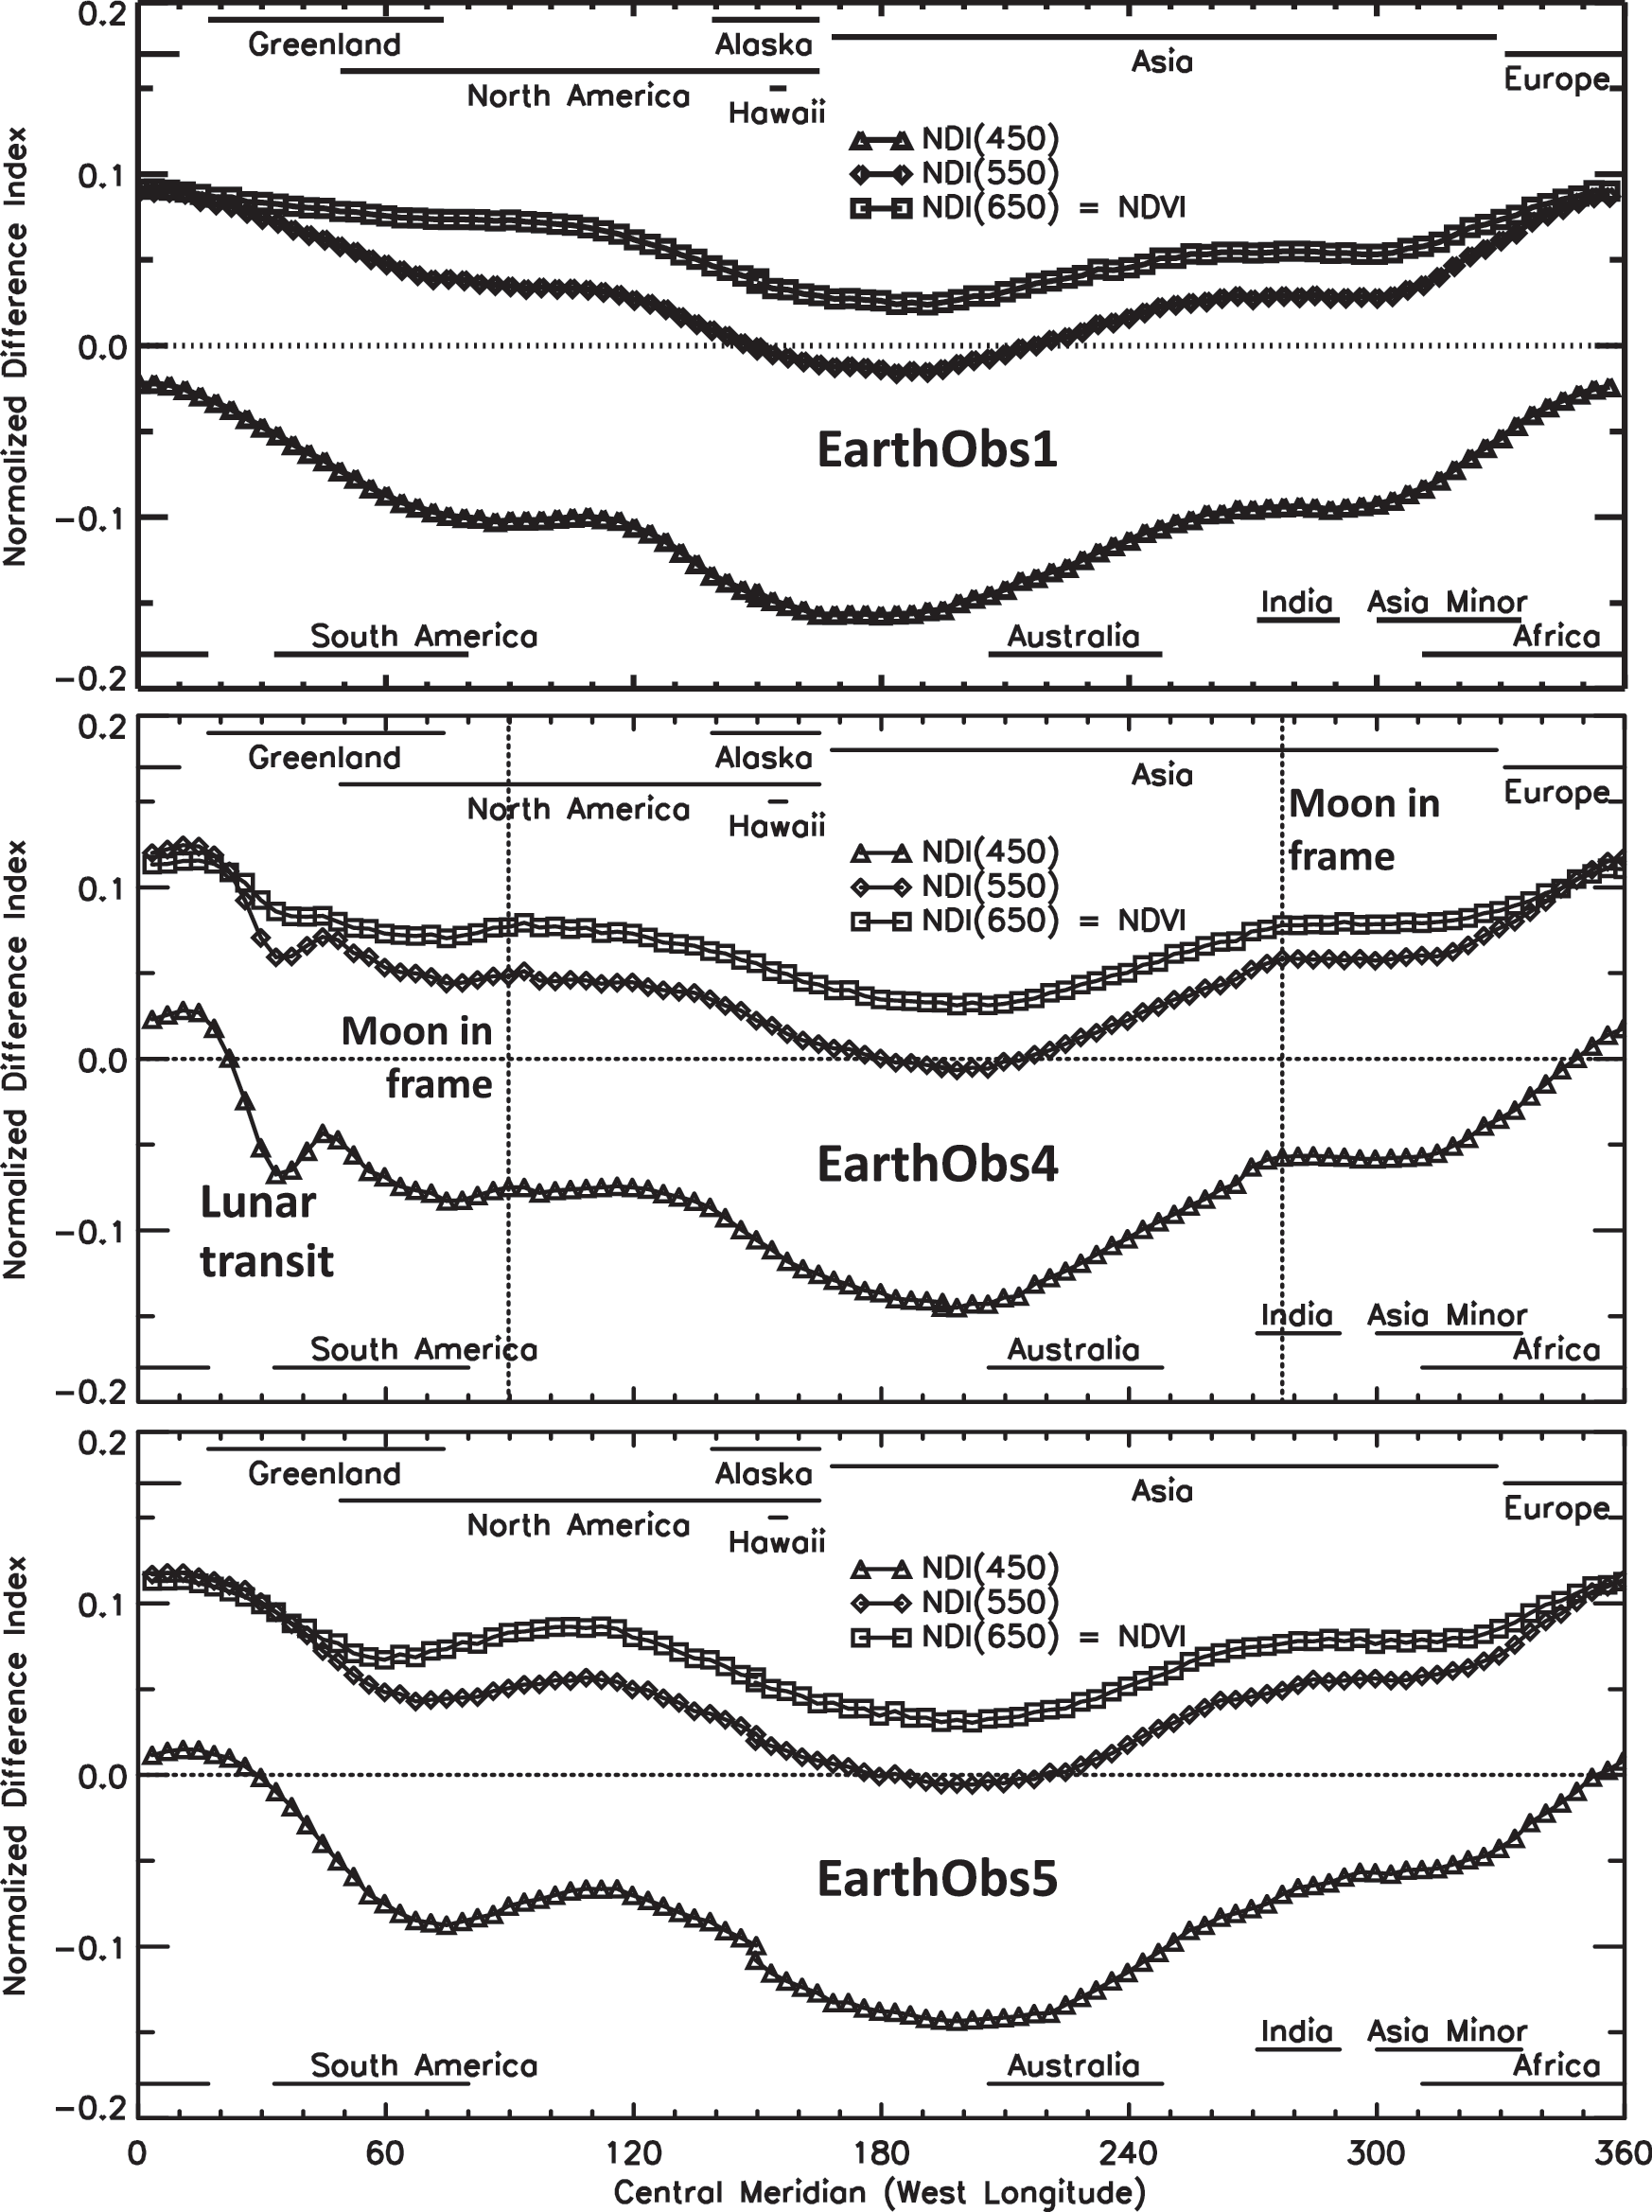
Modulation of the NDI vs. west longitude, from disc-integrated photometry of the high-cadence filters. Maximum NDI corresponds to Africa and Europe dominating the visible disc, consistent with reflectance from continental surfaces. The modulated NDI in EarthObs4 varies significantly at shorter wavelengths while the Moon transited the day-lit portion of Earth's disc but has minimal effect in the NDVI curve (850 vs. 650 nm contrast). The Moon's contribution to reflectance from the total Earth-Moon system has a negligible effect on visible contrast of the total system.
CML, central meridian longitude in west longitude.
S-O-SC, Sun-object-spacecraft angle.
Columns record the measured disc-integrated photometry in each filter in radiance units of 10−7 W/m2/μm, scaled to 1 AU equivalent range from the spacecraft and 1 AU equivalent heliocentric range.
Upper wavelength listed is nominal design wavelength for each filter; lower wavelength listed is average filter wavelength.
Shaded region includes the Moon in field of view.
CML, central meridian longitude in west longitude.
S-O-SC, Sun-object-spacecraft angle.
Columns record the measured disc-integrated photometry in each filter in radiance units of 10−7 W/m2/μm, scaled to 1 AU equivalent range from the spacecraft and 1 AU equivalent heliocentric range.
Upper wavelength listed is nominal design wavelength for each filter; lower wavelength listed is average filter wavelength.
Coarsely similar morphology in the three sets of light curves establishes that Earth has fixed surface features. Cowan et al. (2009) used principal component analysis and data from EarthObs1 and EarthObs5 to invert Earth's wavelength-dependent light curves to infer the presence of oceans and continents from linear combinations of spectral components that resemble the spectrum of ocean and the spectrum of continental land. Here, we apply a simpler, more direct approach to examining the general properties of the measured light curves and compare them to model predictions.
The EPOXI-measured rotational light curves broadly resemble models by Ford, Seager, and Turner (2001), but with significant differences. The degree of overall modulation in a measured light curve will be a function of the phase angle, that is, the degree of illumination. When only a small fraction of the visible disc is illuminated, the passage of continents and cloud features through the visible crescent causes larger relative light curve variations in comparison to a gibbous disc, in which a wide range of surface units may be well represented simultaneously. Ford et al. modeled Earth at 50% illumination fraction, similar to the EarthObs4 and 5 observations. Their Fig. 3b model, which combines a 50% illuminated Earth at equinox with annual-average cloud cover, has a peak-to-peak variation at 550 nm of ∼16%, similar to the rotational contrast in the EPOXI measurements at the same wavelength. The EPOXI observations had limited sensitivity to diurnal variability, with discontinuities between the start and the end of each light curve that were ≤5%. The models of Ford et al. that test day-to-day variability in global cloud cover over a few days can vary quite widely at some sub-observer longitudes, up to ∼37% peak to peak. It is not clear whether the discrepancy is a feature of variability in a particular region on Earth, a feature of the particular day of each EPOXI observation or the particular days that Ford et al. selected for cloud data, or an artifact of the model. The light curve contrast in the longitude region in which they find the greatest variability, ∼230–290°W central meridian longitude, is reproduced to within a few percent in each of the three EPOXI observations.
The EPOXI light curves differ by wavelength, with the greatest rotationally modulated contrast at long visible/short near-IR wavelength (Fig. 6), which is consistent with the high contrast in reflectance between continental materials (range land, leaves) and ocean at 850 nm (see Fig. 4). The observed peak-to-peak variation is about 18–23% at 850 nm for observations in all three epochs. Ford et al. (2001) modeled multiwavelength light curves in a cloud-free model that predicts the greatest variability at 750 nm, the longest wavelength that they model, with about 90% peak-to-peak contrast relative to the mean. The cloud-free multiwavelength model is qualitatively consistent with the EPOXI data, but the observed rotational modulation is much smaller than the cloud-free model, which is consistent with masking by cloud cover at all wavelengths.
The lunar transit during EarthObs4 imposes a significantly wavelength-dependent feature on the light curve. At long wavelength, the Moon's reflectance is on the order of a factor of 2 less than Earth's reflectance (Table 3), whereas the Moon's albedo is 10 times less than Earth's albedo at the shortest measured wavelength. The lunar transit signature is broadest at short wavelength, where even the Moon's daylight side is relatively dark and thus the photometric signal decreases as soon as the Moon's limb occults the terminator. At long wavelength, the Moon's daylight side is sufficiently bright that the signal does not significantly decrease until the Moon's terminator crosses Earth's terminator, so the Moon's nightside occults Earth's daylight side. The transit ends simultaneously in all filters shortly after the Moon's terminator crosses Earth's daylight limb, and then the Moon's nightside limb passes beyond Earth's limb.
Even without a sophisticated inversion analysis, the measured light curves clearly indicate the presence of persistent reflectance contrast features on the surface of the planet and provide some evidence to associate these features with continental surfaces versus ocean. All three epochs of observation, in spite of variable cloud conditions, show a brightness minimum near 180°W longitude, when the view is dominated by the Pacific ocean, and brightness peaks associated with Northern Hemisphere landmasses. This pattern is especially prominent at the longest wavelength, 850 nm, where landmasses are highly reflective regardless of whether the reflectance is due to soil or vegetation cover. These properties of the global Earth, that is, bright, spectrally red units separated by dark, spectrally flat units, are the predominant contributors to the normalized difference index (NDI or color) curves in Fig. 7. Cowan et al. (2009) exploited the light curves in greater detail to deduce an approximate map for Earth that can be interpreted in terms of continental masses separated by oceans according to the distribution of the dominant spectral units.
The observed modulation of the NDVI in the NDI curves suggests a standard for the signal-to-noise ratio required in real photometry of an Earth-like exoplanet to evaluate the modulation of spectral properties in surface features. The maximum and the minimum of the NDI modulation must be distinguishable from the mean value by at least three standard deviations, which is a minimal standard to demonstrate confidence that a distinguishable maximum and minimum actually exist. The maximum and minimum therefore must differ from each other by six standard deviations. The difference in NDVI observed in EarthObs1, for example, is 0.091 −0.024=0.067, so the maximum and the minimum of the NDVI must be determined to within±0.0112 or better to demonstrate with confidence that the index actually is modulated by the rotation of a planet with color properties consistent with Earth. Assume that the reflectance values determined for an exoplanet at two comparison wavelengths differ only slightly, which is consistent with the EPOXI measurements, and have similar measurement uncertainty. In this case, the required signal-to-noise ratio in the photometry of each comparison color in order to distinguish the maximum and the minimum of the rotational modulation can be estimated by standard propagation-of-error techniques applied to Eq. 2. The required minimum signal-to-noise ratio in each photometric measurement is inversely proportional to the target maximum uncertainty in the dimensionless normalized difference index as:
7. Conclusions
As part of the Extrasolar Planetary Observation and Characterization (EPOCh) investigation of NASA's Discovery program mission of opportunity, EPOXI, we have observed the whole disc of Earth in partial phase from near the equatorial plane on three occasions, using visible-light imaging and globally integrated near-IR spectroscopy, including a transit of Earth by the Moon. These observations were conducted from the Deep Impact flyby spacecraft during an extended mission. The present report summarizes the range of phenomena represented in this data set, some of which are exploited quantitatively in other publications.
The EPOXI Earth observations test strategies to investigate exoplanets and set an empirical standard for designing and interpreting future observations of extrasolar terrestrial planets. The Deep Impact instruments cover the spectrum from ∼372–4540 nm wavelength, which includes spectral intervals that can only be observed from space due to molecular opacity in Earth's atmosphere. These observations measured the disc-integrated and time-averaged spectroscopy of Earth at the beginning and the end of a Northern Hemisphere spring; the time-resolved spectroscopy of the disc-integrated spectrum; and time-resolved spectrophotometry as an indicator of the inhomogeneous surface. Detailed investigations of some components of this data set have begun, including azimuthal mapping of Earth's surface units from multicolor light curves (Cowan et al., 2009); constraining models for Earth's emergent visible spectrum and light curve based on properties of the surface and atmosphere (Fujii et al., 2011; Robinson et al., 2011); and empirically categorizing Earth among the planets of our Solar System by using visible colors (Crow et al., 2011).
The existence of Earth's atmosphere and the identity of some constituents is unambiguously demonstrated by the time-averaged global spectrum, which is summarized in Fig. 8. Signatures of gaseous H2O and CO2 appear as multiple absorption-band structures in the near IR, as well as a weak feature of molecular oxygen at 1260 nm. Thermal emission at wavelengths longer than about 2800 nm is marked by features of gaseous H2O and CO2 as well as methane (CH4) and nitrous oxide (N2O). Significant gaseous water indicates temperatures that could be too hot to be habitable but not too cold to be habitable. Terrestrial N2O primarily is a metabolic product of soil bacteria, and CH4 primarily is a product of various terrestrial bacteriological processes. These species within an oxidizing atmosphere thus provide some evidence for life on Earth (Des Marais et al., 2002). Molecular oxygen can result from abiotic processes such as the photolysis of CO2, which occurs in the atmosphere of Mars (e.g., Fast et al., 2006), albeit in low concentrations by comparison to the modern Earth atmosphere. A simple gray-body fit to Earth's thermal emission spectrum between major molecular features yields a disc-integrated color temperature of ∼(283–291)±5 K for Earth, well below the standard pressure boiling point of water and thus suggestive evidence that Earth is cool enough to be thermally habitable by known biological processes.
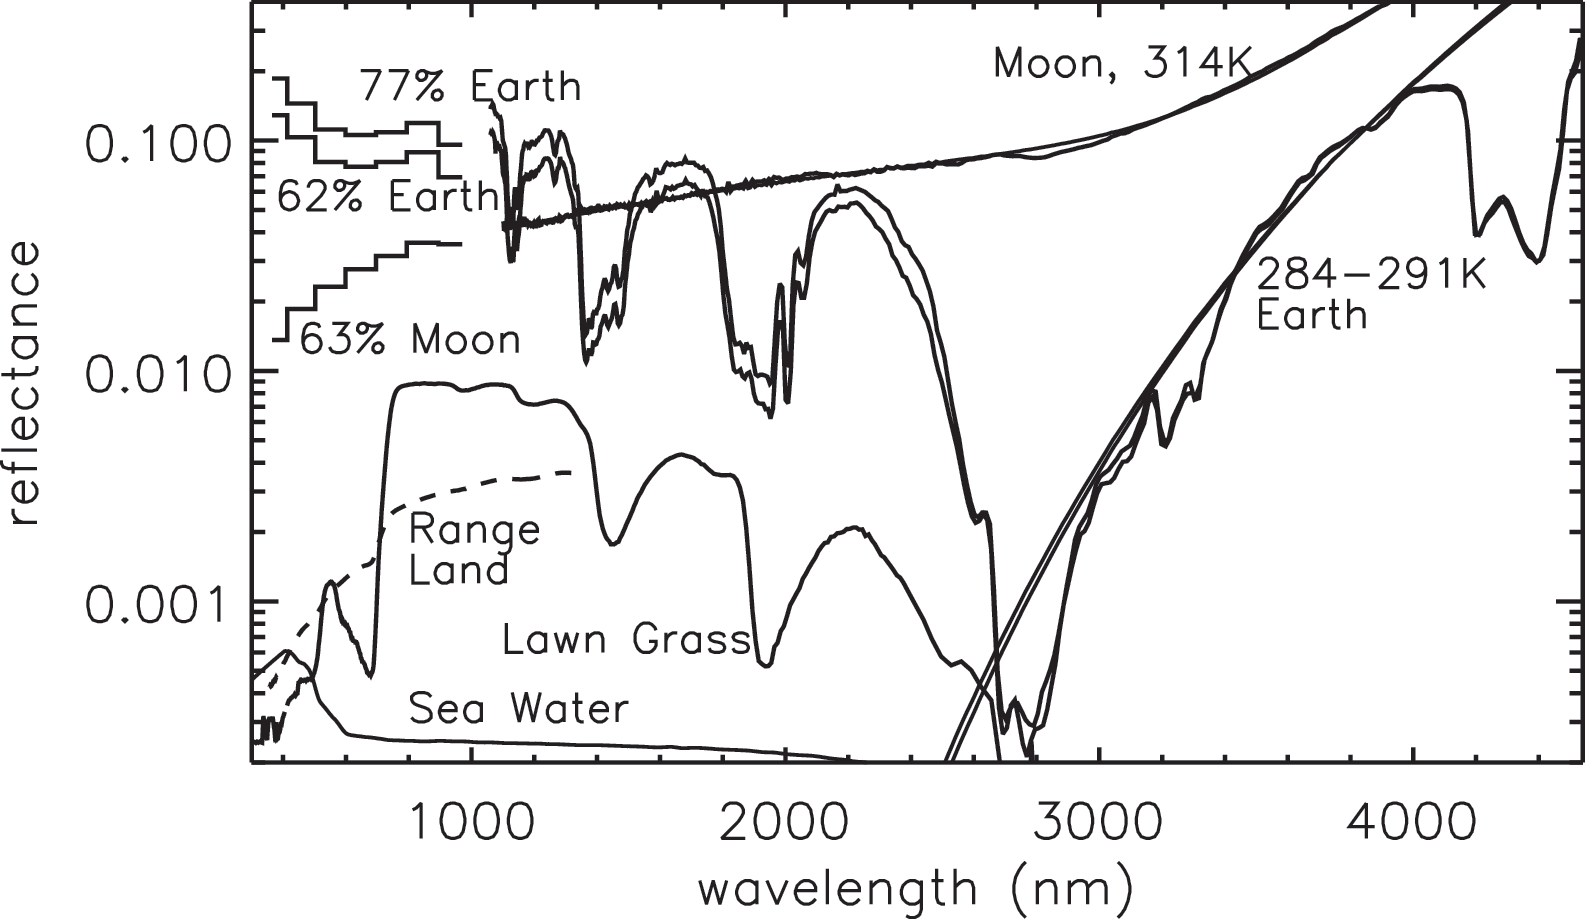
Summary of Earth and Moon spectroscopy over the entire measured wavelength range, including the average Moon spectrum from EarthObs4 and Earth spectra from EarthObs1 (77% illuminated) and EarthObs5 (62% illuminated), all in reflectance units computed as described in Section 3, compared with sample surface coverings (from Clark et al., 2007). The added contribution from thermal continuum self-emission creates anomalously high apparent reflectance beyond about 2800 nm. Models for Earth and Moon thermal emission are displayed, noting the color temperature. The majority of the disparity between EarthObs1 and EarthObs5 at short wavelengths is due to the difference in phase angle. At long wavelength, the spectra are nearly indistinguishable, consistent with efficient redistribution of heat between day and night sides of Earth. The slight difference between the lunar model and the measured spectrum at 2750–3000 nm is consistent with the mineral hydration feature described by Sunshine et al. (2009).
The Moon's disc-integrated color temperature of 316±6 K apparently also meets the criterion of thermal habitability, but the conspicuous lack of evidence for a significant molecular atmosphere demonstrates that the Moon does not have a habitable surface environment. Thermal emission by an exoplanet's satellite(s) could be a major component of observed thermal emission from an unresolved exoplanet. Despite the comparatively small surface area of the Moon, its high brightness temperature dilutes molecular signatures in the combined spectrum of Earth and Moon, which skews the overall color temperature and the apparent abundance of gas species. The satellites of terrestrial exoplanets could conceivably be very different from the Earth-Moon system: exomoon(s) comparable in size to the primary and possessing an atmosphere, a situation not observed in our Solar System; significantly smaller than the primary and airless, like our Moon; small enough to be negligible, like the satellites of Mars; or absent entirely. Reflected-light spectrophotometry of the actual unresolved Earth-Moon system is nearly insensitive to the Moon except during transit, due to its smaller size and low albedo. Ultraviolet/visible/near-infrared measurements of an Earth-like exoplanet probably can be interpreted with reasonable accuracy without explicitly accounting for satellites, unless a satellite is a significantly greater fraction of the primary's size or possesses a significant atmosphere, or both—for example, a Mars-scale satellite of an Earth-like parent. A comparison between reflected-light and thermal emission measurements may be the only way to definitively identify the presence of one or more moons in an unresolved system.
The VRE spectral discontinuity is not supported as the basis for an effective strategy to detect life on Earth-like exoplanets. Although the modest reflectance contrast between 650 nm and 850 nm superficially is consistent with the signature of land-based vegetation, the magnitude of Earth's disc-integrated reflectance contrast is diluted by spectrally gray cloud and snow/ice cover. The same spectral contrast is significantly greater for the lifeless Moon due to the red slope of the lunar reflectance spectrum. Earth's actual spectrum includes atmospheric properties, such as short-wavelength Rayleigh scattering, visible-light molecular absorption features that are unresolved in these measurements, time-variable scattering and opacity from cloud cover, as well as linear combinations of surface units. Only detailed modeling of these contributions can determine whether a vegetation component can be demonstrated with realistic confidence limits applicable to interpreting an exoplanetary spectrum, which has been considered theoretically by, for example, Kiang et al. (2007), Kaltenegger et al. (2007), Seager et al. (2005), and Des Marais et al. (2002). This effort is pursued in interpreting the EPOXI/EPOCh empirical data by Robinson et al. (2011) and by Fujii et al. (2011), with future work expected, since these data are available to the entire scientific community.
The major spectral distinction between Earth and Moon is at short visible wavelengths, where Rayleigh scattering contributes significantly to Earth's reflectance versus the dark Moon. A minimum of three samples, distributed across the visual spectrum, can discriminate between an exoplanet analogous to modern Earth and a lunar analogue (Crow et al., 2011). Deeper investigation is required to determine whether early Earth and early versions of other terrestrial planets, with different atmospheric conditions than today, could be distinguished by the same broad spectral features.
Phased modulation of Earth's light curve provides evidence for surface properties. The general form of the modulation in the light curve is preserved in all three spectrophotometric observations, which is consistent with the fixed distribution of landmasses and oceans. The measured disc-integrated reflectance varies by up to ∼5% between beginning and end of a rotational light curve, due to variability in global cloud cover (weather). The wavelength of strongest modulation is 850 nm. Measurements at 850 nm alone would be sufficient to establish periodicity in the light curve and thus deduce the diurnal period as well as the existence of fixed surface units. The most striking difference between the measured light curves is the transit of Earth by the Moon in one observation. The Moon's steeply red spectrum differs sharply from Earth, with significant consequences for the apparent progress of the occultation light curve.
Identifying life on an Earth-like exoplanet will be challenging. EPOXI shows that even with high-quality measurements, the global signature of known life is relatively modest. The difficulty of identifying an unambiguous signal for vegetation, combined with the evolutionary inventiveness of microbial life and the long history of life prior to land vegetation and the oxygen-rich atmosphere of the last quarter of Earth's history (approximately), suggests that pursuing the unique signature of the modern biosphere is an ineffective strategy to identify life. An inhabited terrestrial planet could be “Earth-like” in all fundamentally important respects—such as a biosphere founded on phototrophic organisms (“plants”) with macroscopic heterotrophic organisms (“herbivores”)—yet it seems most likely that it would be chemically and spectroscopically unique. The differences between Earth and the non-living Moon, however, are clear even at low spectral resolution. Identifying the degree to which a planet is similar to Earth is difficult; identifying the degree to which a planet is dissimilar from non-Earth-like bodies such as the Moon, Mars, Venus, Mercury, or other known Solar System bodies is a more tractable problem and more consistent with the scientific method of rejecting null hypotheses rather than seeking confirmation of a theory.
The EPOXI archive includes three other sets of terrestrial-planet observations: two sequences from above Earth's poles and an observation of Mars. These data will be presented in subsequent publications. The complete EPOCh component of the EPOXI mission data is already available in the Multimission Archive at Space Telescope (MAST) and in the Small Bodies Node of the Planetary Data System (PDS-SBN), which is currently hosted at the University of Maryland. These sites also record the measured filter transmission functions and other features necessary to interpret the data. We encourage other researchers to exploit this as-yet unique resource for astrobiology.
Footnotes
Acknowledgments
This work was supported by the NASA Discovery Program and the EPOXI mission. The authors gratefully acknowledge the contributions of the Deep Impact/EPOXI operations team at the Jet Propulsion Laboratory, without whom the unique observations described here could not have been accomplished, and the paleobotanical assistance of A.C. Dooley of the Virginia Museum of Natural History.
Author Disclosure Statement
No competing financial interests exist.
Abbreviations
EPOCh, Extrasolar Planetary Observation and Characterization; HRIIR, high-resolution instrument infrared spectrometer; HRIVIS, high-resolution imager visible-light instrument; NDI, normalized difference index; NDVI, normalized difference vegetation index; VRE, vegetation red edge.