
Abstract
Our primary objective was to evaluate gene expression changes in Arabidopsis thaliana in response to parabolic flight as part of a comprehensive approach to the molecular biology of spaceflight-related adaptations. In addition, we wished to establish parabolic flight as a tractable operations platform for molecular biology studies. In a succession of experiments on NASA's KC-135 and C-9 parabolic aircraft, Arabidopsis plants were presented with replicated exposure to parabolic flight. Transcriptome profiling revealed that parabolic flight caused changes in gene expression patterns that stood the statistical tests of replication on three different flight days. The earliest response, after 20 parabolas, was characterized by a prominence of genes associated with signal transduction. After 40 parabolas, this prominence was largely replaced by genes associated with biotic and abiotic stimuli and stress. Among these responses, three metabolic processes stand out in particular: the induction of auxin metabolism and signaling, the differential expression of genes associated with calcium-mediated signaling, and the repression of genes associated with disease resistance and cell wall biochemistry. Many, but not all, of these responses are known to be involved in gravity sensing in plants. Changes in auxin-related gene expression were also recorded by reporter genes tuned to auxin signal pathways. These data demonstrate that the parabolic flight environment is appropriate for molecular biology research involving the transition to microgravity, in that with replication, proper controls, and analyses, gene expression changes can be observed in the time frames of typical parabolic flight experiments. Key Words: Microgravity—NASA Reduced Gravity Office—Signal transduction—Microarray—Transcriptome—Spaceflight analogue. Astrobiology 11, 743–758.
1. Introduction
Although the biological effects of parabolic flight have not been evaluated in plants at the molecular level, there have been studies focused on plant gene expression patterns in spaceflight as well as other spaceflight analogues, such as clinorotation. Spaceflight research has suggested that the microgravity environment of space may affect the ability of plants to process critical biological signals, such that the perception of certain signals may be inappropriately processed into a stress response (Hashemi et al., 1999; Hatton et al., 1999; Paul et al., 2001; Hughes-Fulford, 2002; Taylor et al., 2002; Stutte et al., 2006). These data indicate a rich field of study with which to approach questions of molecular responses to spaceflight in general and microgravity in particular.
Parabolic flight platforms provide two critical needs to the research community. First, parabolic flight opportunities are far more accessible and less costly than the orbital environment. This accessibility enables researchers to design and execute experiments, then replicate experiments, and further redesign and fly experiments based on the results of the initial runs. Second, parabolic flight provides a window of time that is unavailable in a spaceflight experiment. The initial adaptive response to microgravity cannot be captured in a spaceflight experiment as almost invariably experiments are inaccessible during the first minutes (and usually hours) after launch; most experiments cannot be assayed in any form until the vehicle is reconfigured for orbit. This reconfiguration timeframe is likely well into the adaptive phase of biological responses, and the window of time that captures the transition from unit gravity to microgravity is lost to the experiment. With the emergence of commercial suborbital operations, it becomes possible to explore the phases of early entry into microgravity, from the short time spans of parabolic flight into the longer time frames of suborbital platforms. As such, it is imperative that these parabolic and suborbital platforms be evaluated and matched to biological questions appropriate to the transition to orbit. This is the first study to apply full-genome microarray analyses in conjunction with reporter gene biosensors in the realm of parabolic flights to evaluate whether duration of exposure in parabolic flight induces biological changes that were recognizable as changes in gene expression.
We describe operational aspects and results from a series of replicated experiments conducted on NASA's KC-135 and C-9 parabolic aircraft, using the model plant Arabidopsis thaliana. Arabidopsis has significant spaceflight heritage and is well suited to molecular genetic analyses. Genome-wide gene expression profiling was conducted on samples from three separate flight days on the KC-135, and reporter gene assays were conducted on the C-9.
2. Materials and Methods
Mounting an experiment for the parabolic aircraft is akin to mounting a field expedition, in that a substantial portion of the operational support (growth lights, reagents, materials and tools for harvesting and processing, etc.) needs to travel with the biology. In addition, there are strict safety requirements for the payload, health requirements for any researcher who flies with the payload, and a number of operational constraints unique to conducting an experiment in a parabolic aircraft. As a consequence, the preparations and setup are central to the operational success of the experiment and relevant in the interest of enabling a subsequent researcher to mount an ensuing experiment with high fidelity. Thus, the Methods section is divided into two sections; the first outlines the preparations and operational tactics to mount a successful parabolic flight experiment, and the second outlines the biology, procedures, and analytical tools that comprise it.
2.1. Preparations for parabolic flight
2.1.1. Human prerequisites to accompany the experiment in flight
The experiment necessitated in-flight operations (see following sections) and therefore required at least two members of the research team to fly with the experiment. The authors were required to complete hypobaric chamber training. In addition, all researchers who needed access to Ellington Field, the operations base of the Reduced Gravity Office (
Because the parabolic flight environment is novel and challenging to the researchers as well as to the biology, the in-flight maneuvers and harvest operations were practiced by the team before being executed in the aircraft. There is a limited and well-defined footprint within the aircraft to which the research team must confine themselves as well as adhering to short timing between operations. For practice in the home laboratory, a section of floor was marked off in the dimensions that were to be allocated on the aircraft and was populated with the in-flight hardware, biology, harvest tools, and support materials. Team members practiced moving from one station to the next in the allocated time. Again, time is limited, the motion sickness medications can be disorientating, and the environment itself is foreign to normal laboratory practices. Situational awareness within the aircraft is also critical, especially during the microgravity portions of the flight. All members of the research team were briefed on how to maneuver in micro- and hyper-gravity to effectively conduct the experiment and also to be aware of their surroundings for their safety and for the safety of those around them.
2.1.2. Transport of biology and supporting equipment
The biology consisted of Arabidopsis plants grown on Petri plates containing 12–15 plants per plate (see Fig. 1 and preparation details in the Biology section below). When the plants were between 4 and 7 days old (depending on set), they were transported from the University of Florida by car in padded coolers to maintain temperature around 23°C. The plants had limited light in transit (approximately 15 h), but upon arrival a light bank was erected to provide continuous 80 μmol m−2 s−1, and the room air conditioned to between 22°C and 24°C. The light bank was constructed of two cool white fluorescent tubes and two grow-light fluorescent tubes, and was also transported from the University of Florida. Supporting equipment and materials for photography, harvest, staining, and preservation reagents were transported in compartmentalized coolers, which were deployed to create a mobile laboratory in the hanger high-bay at Ellington Field.
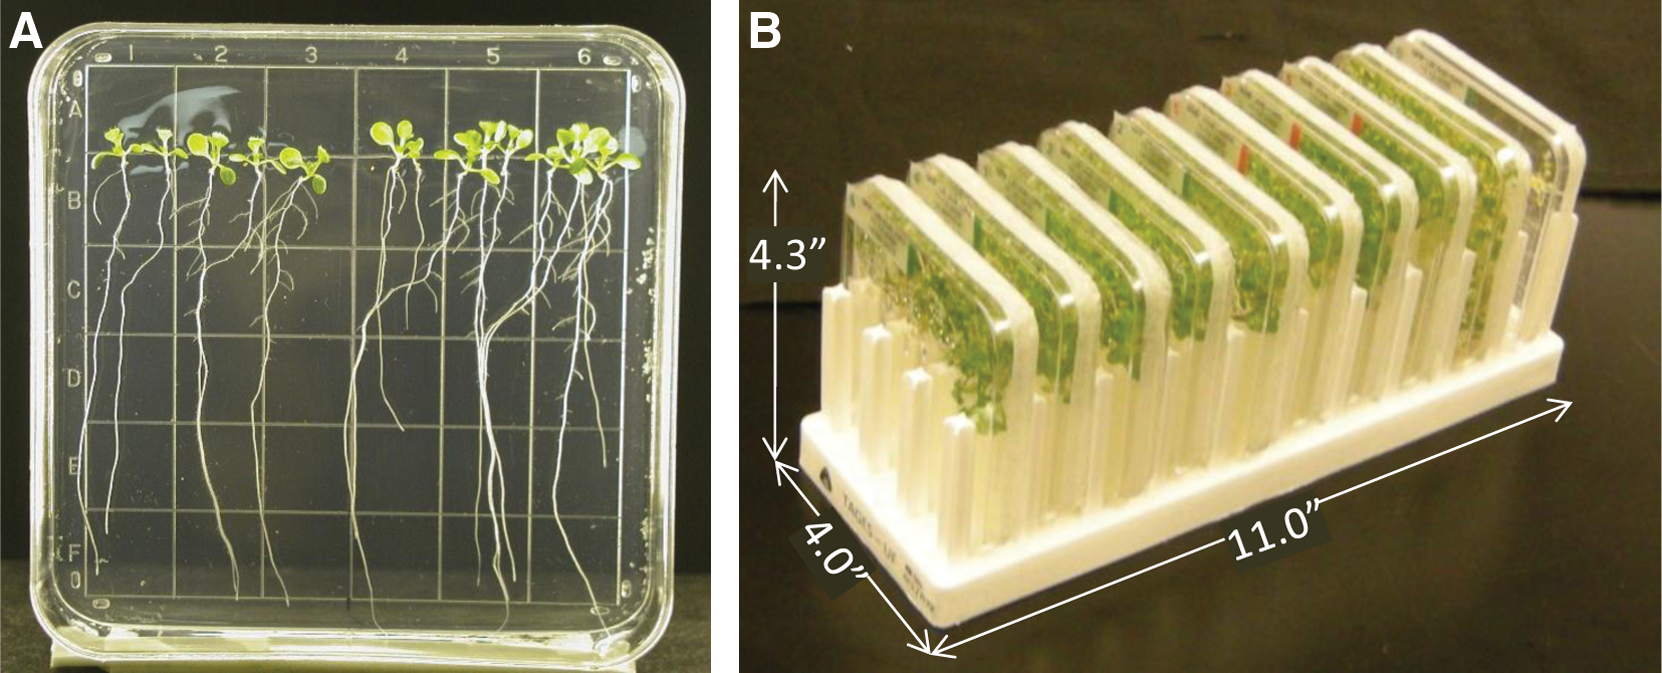
Biological samples. Each sample consisted of twelve 10-day-old plants growing on the surface of a square Petri plate (
2.1.3. Development of in-flight harvest kits and support materials
Items that flew as part of the experiment were subjected to a number of requirements related to safety. All larger items, such as duffel bags, tool boxes, and containers of biology were required to be stowed during takeoff and landing. Experiment-specific stowage during parabolic flight was contained within easily accessible Biotransporter boxes (Fisher) that were secured with cargo straps and Velcro (see Fig. 2A). All small tools, harvesting materials, and biology (such as the plates used in this experiment) were secured inside the Biotransporter boxes, which, for this experiment, were only opened for harvest activities during the periods of level flight as the aircraft turned around in its flight plan between sets of parabolas (Fig. 2B). Turnaround times varied between 3 and 7 min, depending on the turn's position in the flight schedule; thus harvest activities were constrained to this time.
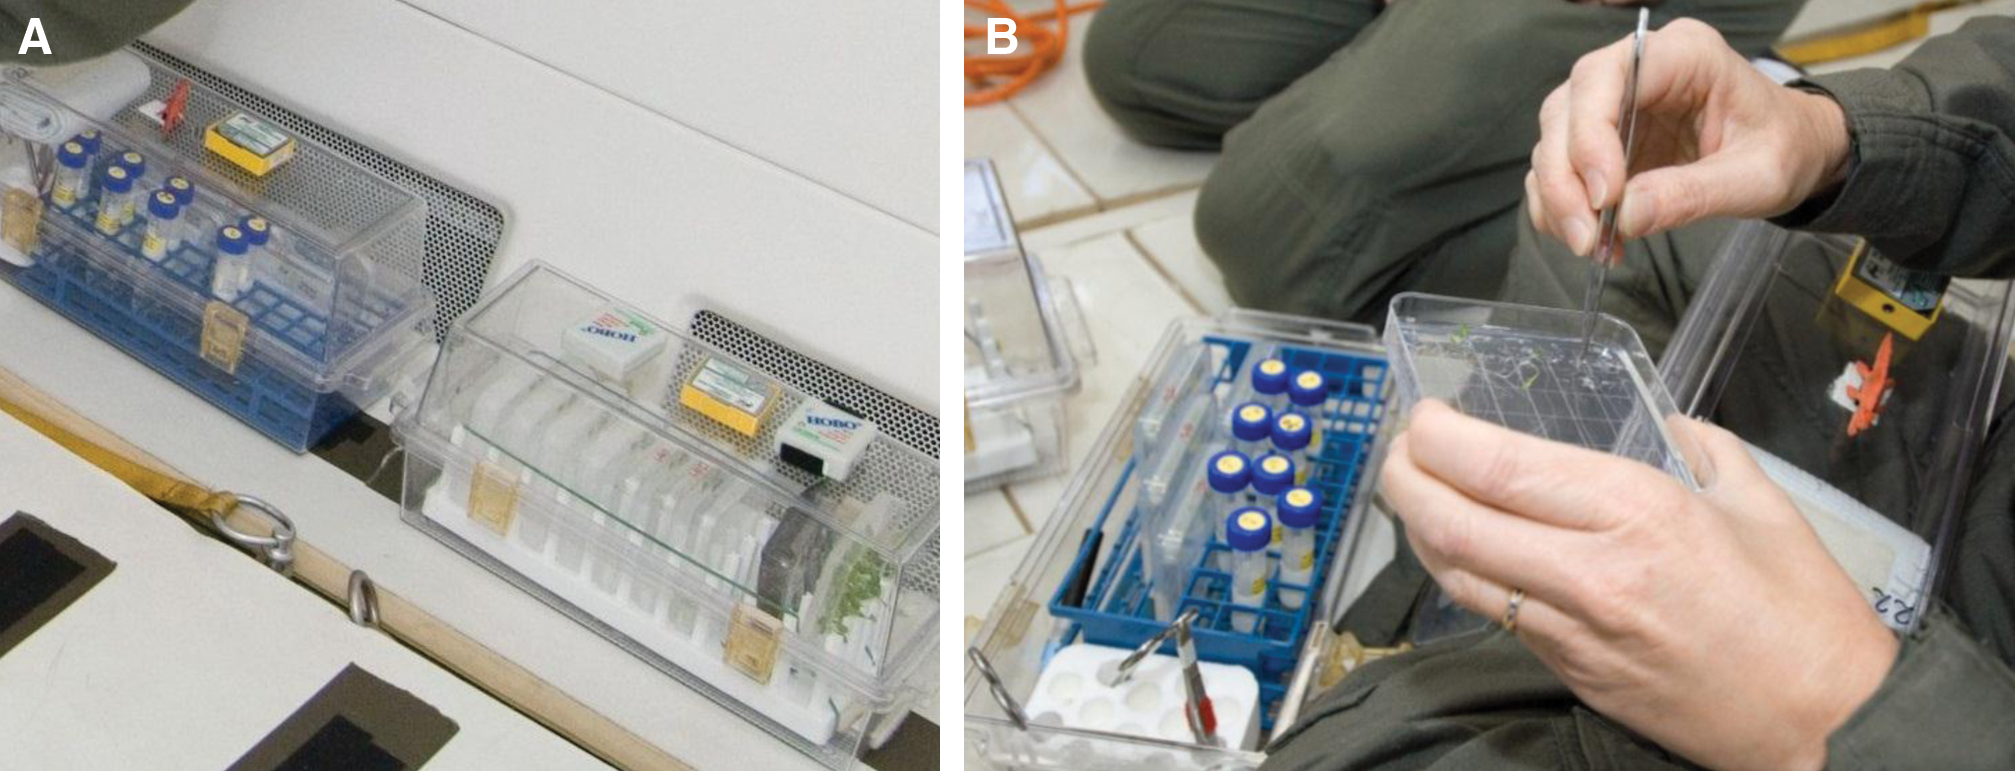
Operational context on the flight deck. Shown are photographs of the stowage of materials in two Biotransporter boxes secured to the flight deck of the aircraft (
2.2. Biology, procedures and analytical tools
2.2.1. Plants and growth conditions
Wildtype Arabidopsis (Arabidopsis thaliana L. cult. Ws) were grown on vertical solid nutrient media agar Petri plates (10 cm2) to facilitate root growth along the exposed surface of the agar to promote uniform aeration of root and shoot tissue. Plates were planted with 12–15 seeds in a row 1.5 cm from the top edge of the plate (Paul et al., 2001). To support four possible replicate experiments (see below), six sets of plates were prepared; each set was planted precisely 24 h apart. This approach facilitated launching plants of identical age on each of the four flight days of the parabolic flight campaign. Plates containing 10-day-old plants, with roots approximately 8.5 cm long (not yet reaching bottom edge of plate), were chosen for each flight day (see Fig. 1). With the exception of transit time from the University of Florida to Johnson Space Center, Houston, Texas, the plants were grown in continuous light (80 μmol m−2 s−1) at 22–24°C.
2.2.2. Parabolic flight conditions and harvests
The operational design for the gene expression microarray experiments was to conduct four replicate days of parabolas. This design was to ensure recovery from three replicated sample days. This approach accommodated a scrub day, or a day that contained an operational anomaly (such as a disruption of a subset of parabolas). Each flight day was comprised of 40 parabolas in sets of 10, each set ending with a 3–7 min window of 1g turnaround as the aircraft reoriented its flight path. Each parabola was comprised of 27–32 s of microgravity and a comparable span of 1.8–2.2g forces. One set of plants was harvested before flight as ground controls (GND). Two additional sets flew 20 parabolas and 40 parabolas, (P20) and (P40) respectively, before harvesting. The plants on plates were held in the vertical position within a secured box and harvested during the 3–7 min turnaround period of level flight at the end of the second set of 10 and the beginning of the third set of 10 parabolas (P20). The remaining plants were harvested after having experienced a total of four sets of 10 parabolas (P40). Three replicate samples were taken with each harvest. Plants were harvested with forceps to 5 mL of RNAlater reagent (Ambion) contained in 15 mL conical screw-top tubes, and then re-secured inside Biotransporter boxes until landing (see Fig. 2A, 2B). This experiment harvesting procedure was replicated each flight day. Plants harvested to RNAlater were kept at room temperature for 1–2 h before transfer to cold stowage (2–10°C) for 1 week. After the week of cold stowage, the samples were held at −20°C until RNA isolation.
Follow-on experiments with GUS reporter genes were conducted to explore preliminary indications obtained from the microarray experiments. Reporter gene plants were flown in similar sets of parabolas on NASA's C-9 parabolic aircraft. Details describing transgene and fixation are discussed below in the Transgene analyses subsection.
2.2.3. RNA extraction and microarray hybridization
RNA extraction and microarray hybridization were conducted as previously described (Paul et al., 2004). Total RNA from each pooled shoot sample was extracted with RNeasy kits from Qiagen: 120 mg of tissue was ground in a solution composed of 100 μL of RNAlater and 450 μL of the Qiagen RLT buffer. All subsequent steps were as described by the Qiagen kit instructions, including a DNase I treatment. The target RNAs were labeled and prepared for hybridization according to the protocols outlined in the GeneChip Expression Analysis Technical Manual (Revision 1, 2001, Affymetrix, Santa Clara, CA). Briefly, 8 μg of total RNA was used as template for first-strand cDNA synthesis (Superscript, Invitrogen), which was primed with a T7-(dT)24 primer containing a T7 RNA polymerase promoter sequence (Genset Oligos). In vitro transcription was performed on the second-strand product (Bioarray High Yield RNA Transcript labeling Kit, Enzo Diagnostics), and the resulting biotinylated cRNA was heated at 94°C for 35 min in a magnesium and potassium acetate–containing buffer (Affymetrix), which produced fragments 35–200 bases in length. Arabidopsis genome arrays (Affymetrix 900292) were hybridized for 16 h at 45°C with 15 μg of fragmented cRNA, stained with a streptavidin-phycoerythrin conjugate (Molecular Probes), and scanned with an Agilent argon-ion laser (488 nm emission and 570 nm detection) (GeneArray Scanner).
2.2.4. Microarray analyses
The microarray analyses were conducted as described previously in Paul et al. (2004). Briefly, Affymetrix files were analyzed with Probe Profiler software (Corimbia) to generate quantitative estimates of gene expression. Probes that were not considered present in any of the samples were eliminated from further analyses. K-means clustering was performed on the normalized expression values by using Cluster (Eisen et al., 1998). Examination of the different K-means clusters was the fundamental way different patterns of gene expression were identified. Vizard v1.2 (Moseyko and Feldman, 2002) was used to generate fold-change data on the expression values. The K-means cluster data, together with the analysis of variance values and the derived fold-change data, were visualized with Treeview (Eisen et al., 1998) and after techniques described in Paul et al. (2004).
2.2.5. Gene Ontology analyses
The differentially expressed genes displayed in Fig. 3 were categorized according to biological function through The Arabidopsis Information Resource (TAIR) website (
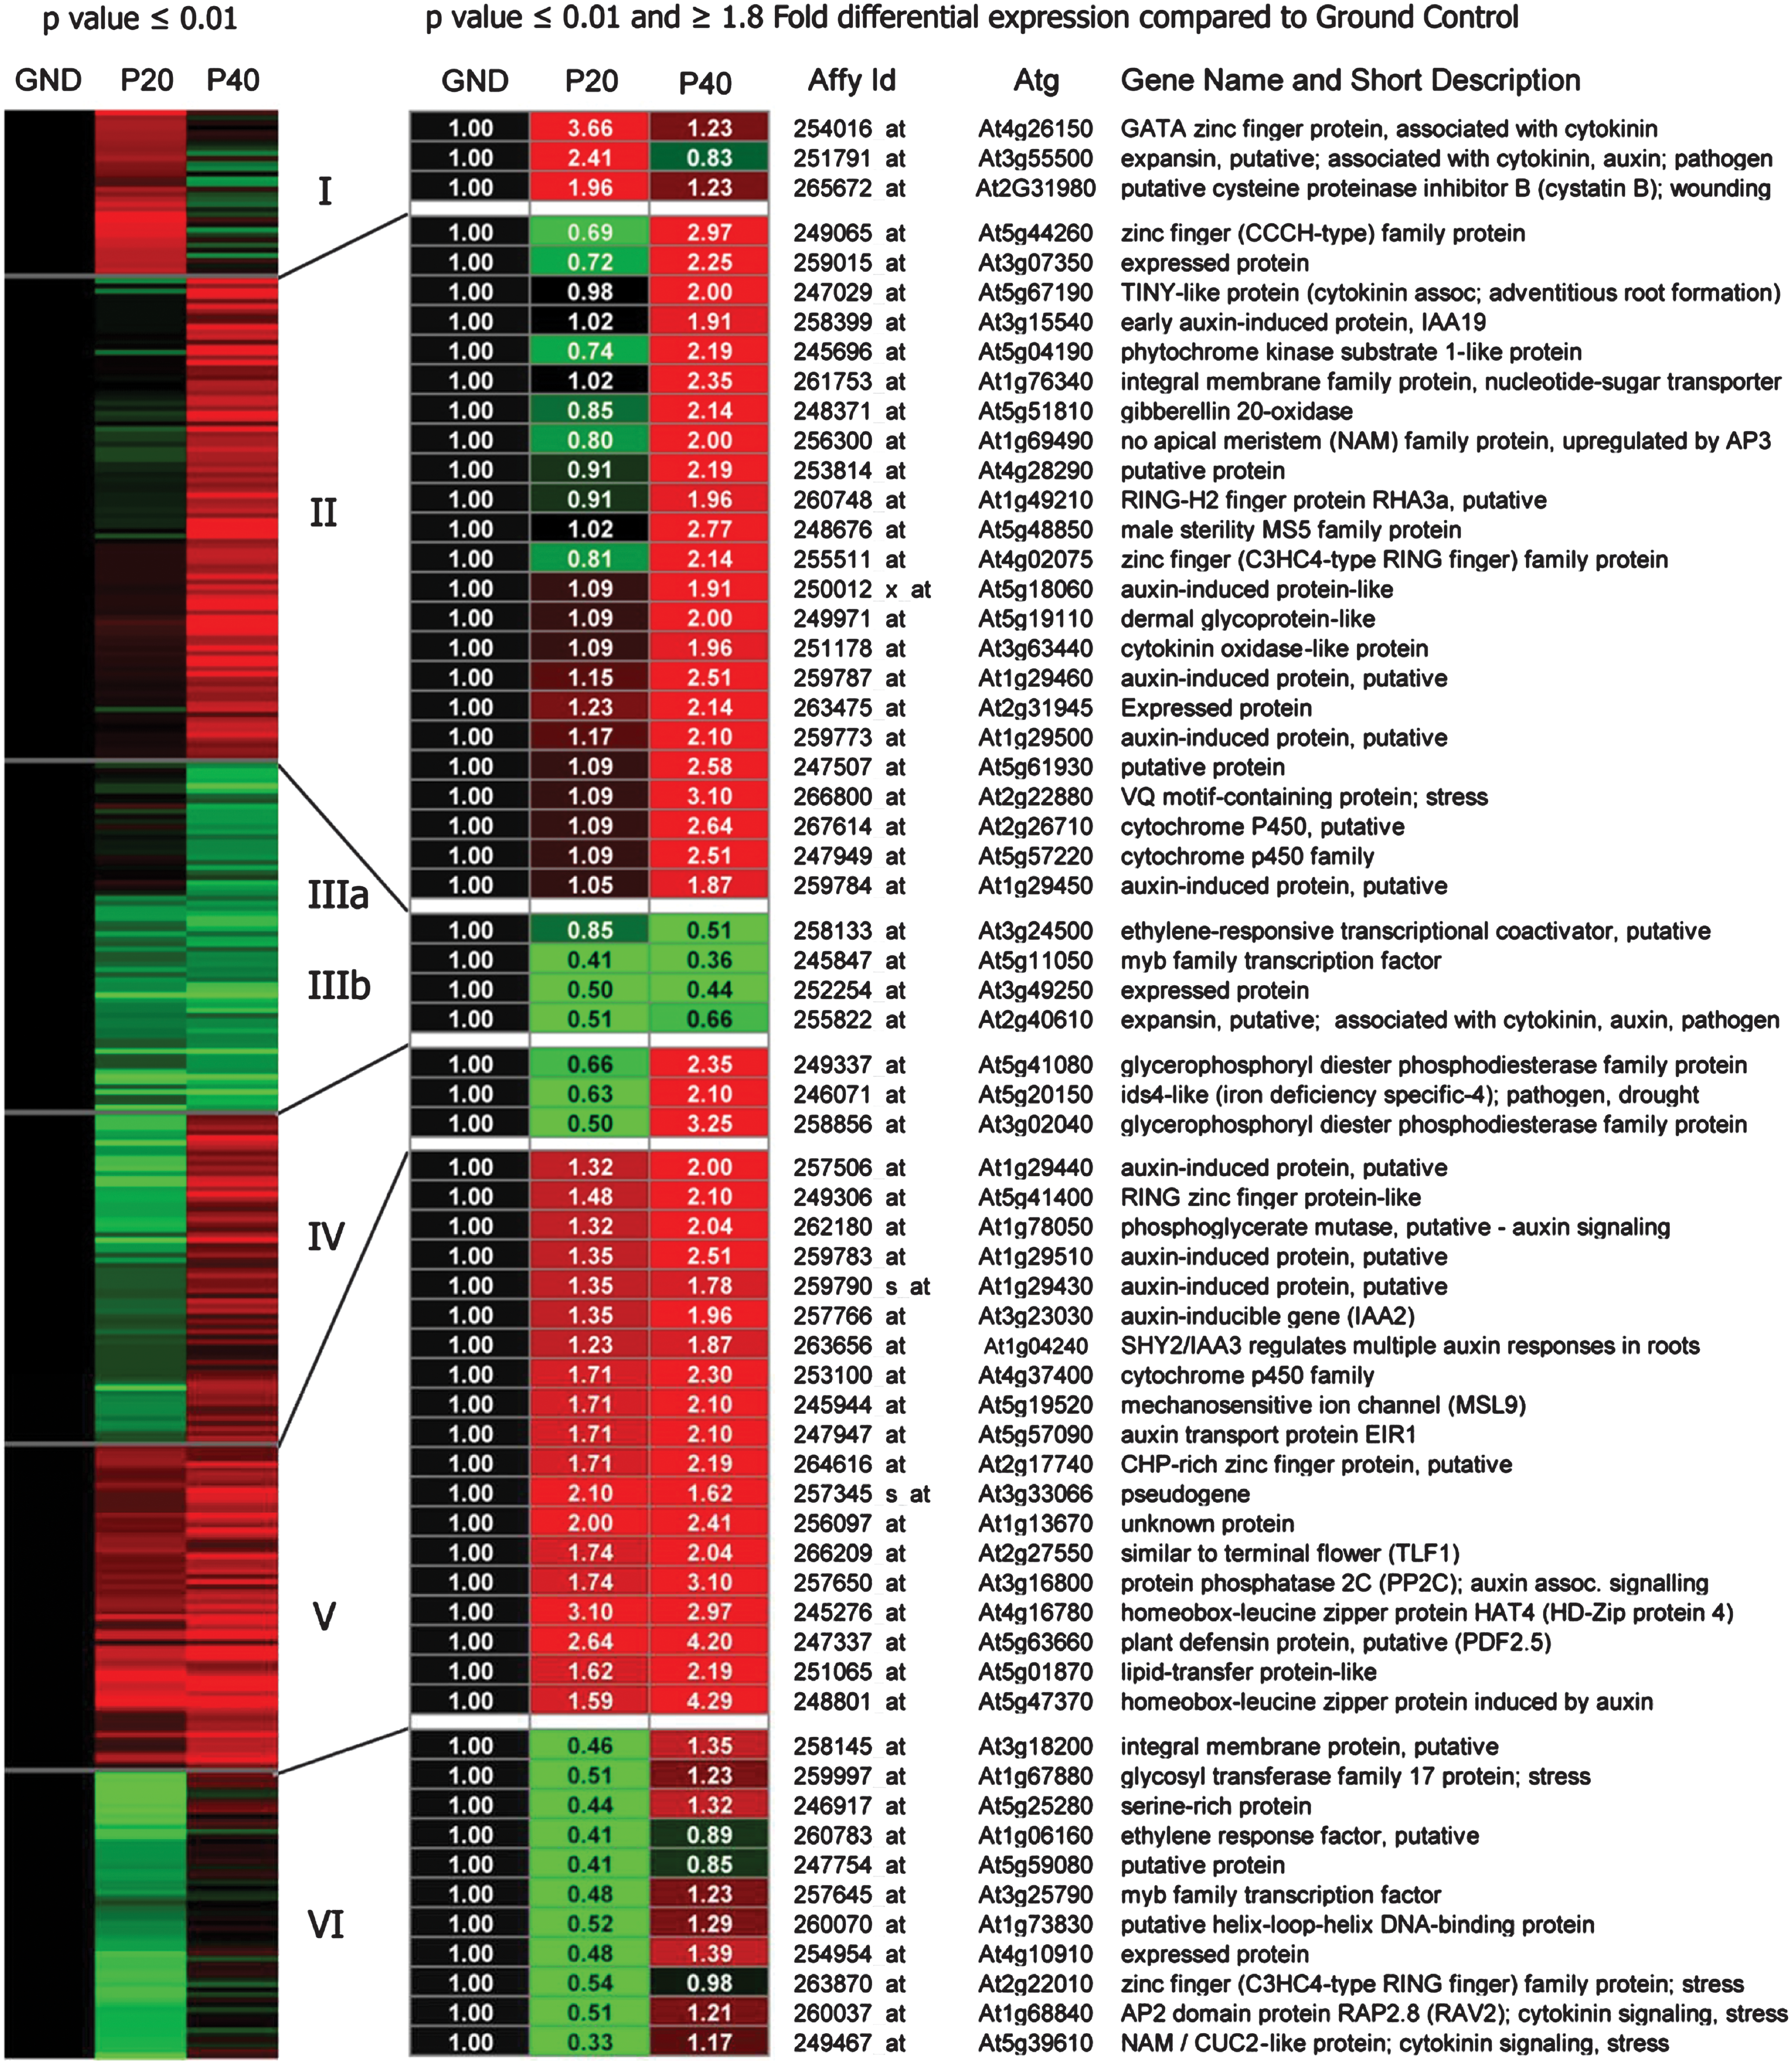
Changes in patterns of gene expression clustered to reveal trends with increasing time of exposure to parabolic flight environments. GND, ground control: P20, at 20 parabolas; P40, at landing after 40 parabolas. The graphic on the left represents all genes showing statistically significant (p value of ≤0.01) differential gene expression compared to the ground control. The annotated graphic to the right shows the p≤0.01 genes with at least 1.8-fold differential expression. A fully annotated table (names, Affymetrix and gene ID numbers, numerical values) of all differentially expressed genes in this figure can be found online in the Supplementary Material. Color images available online at
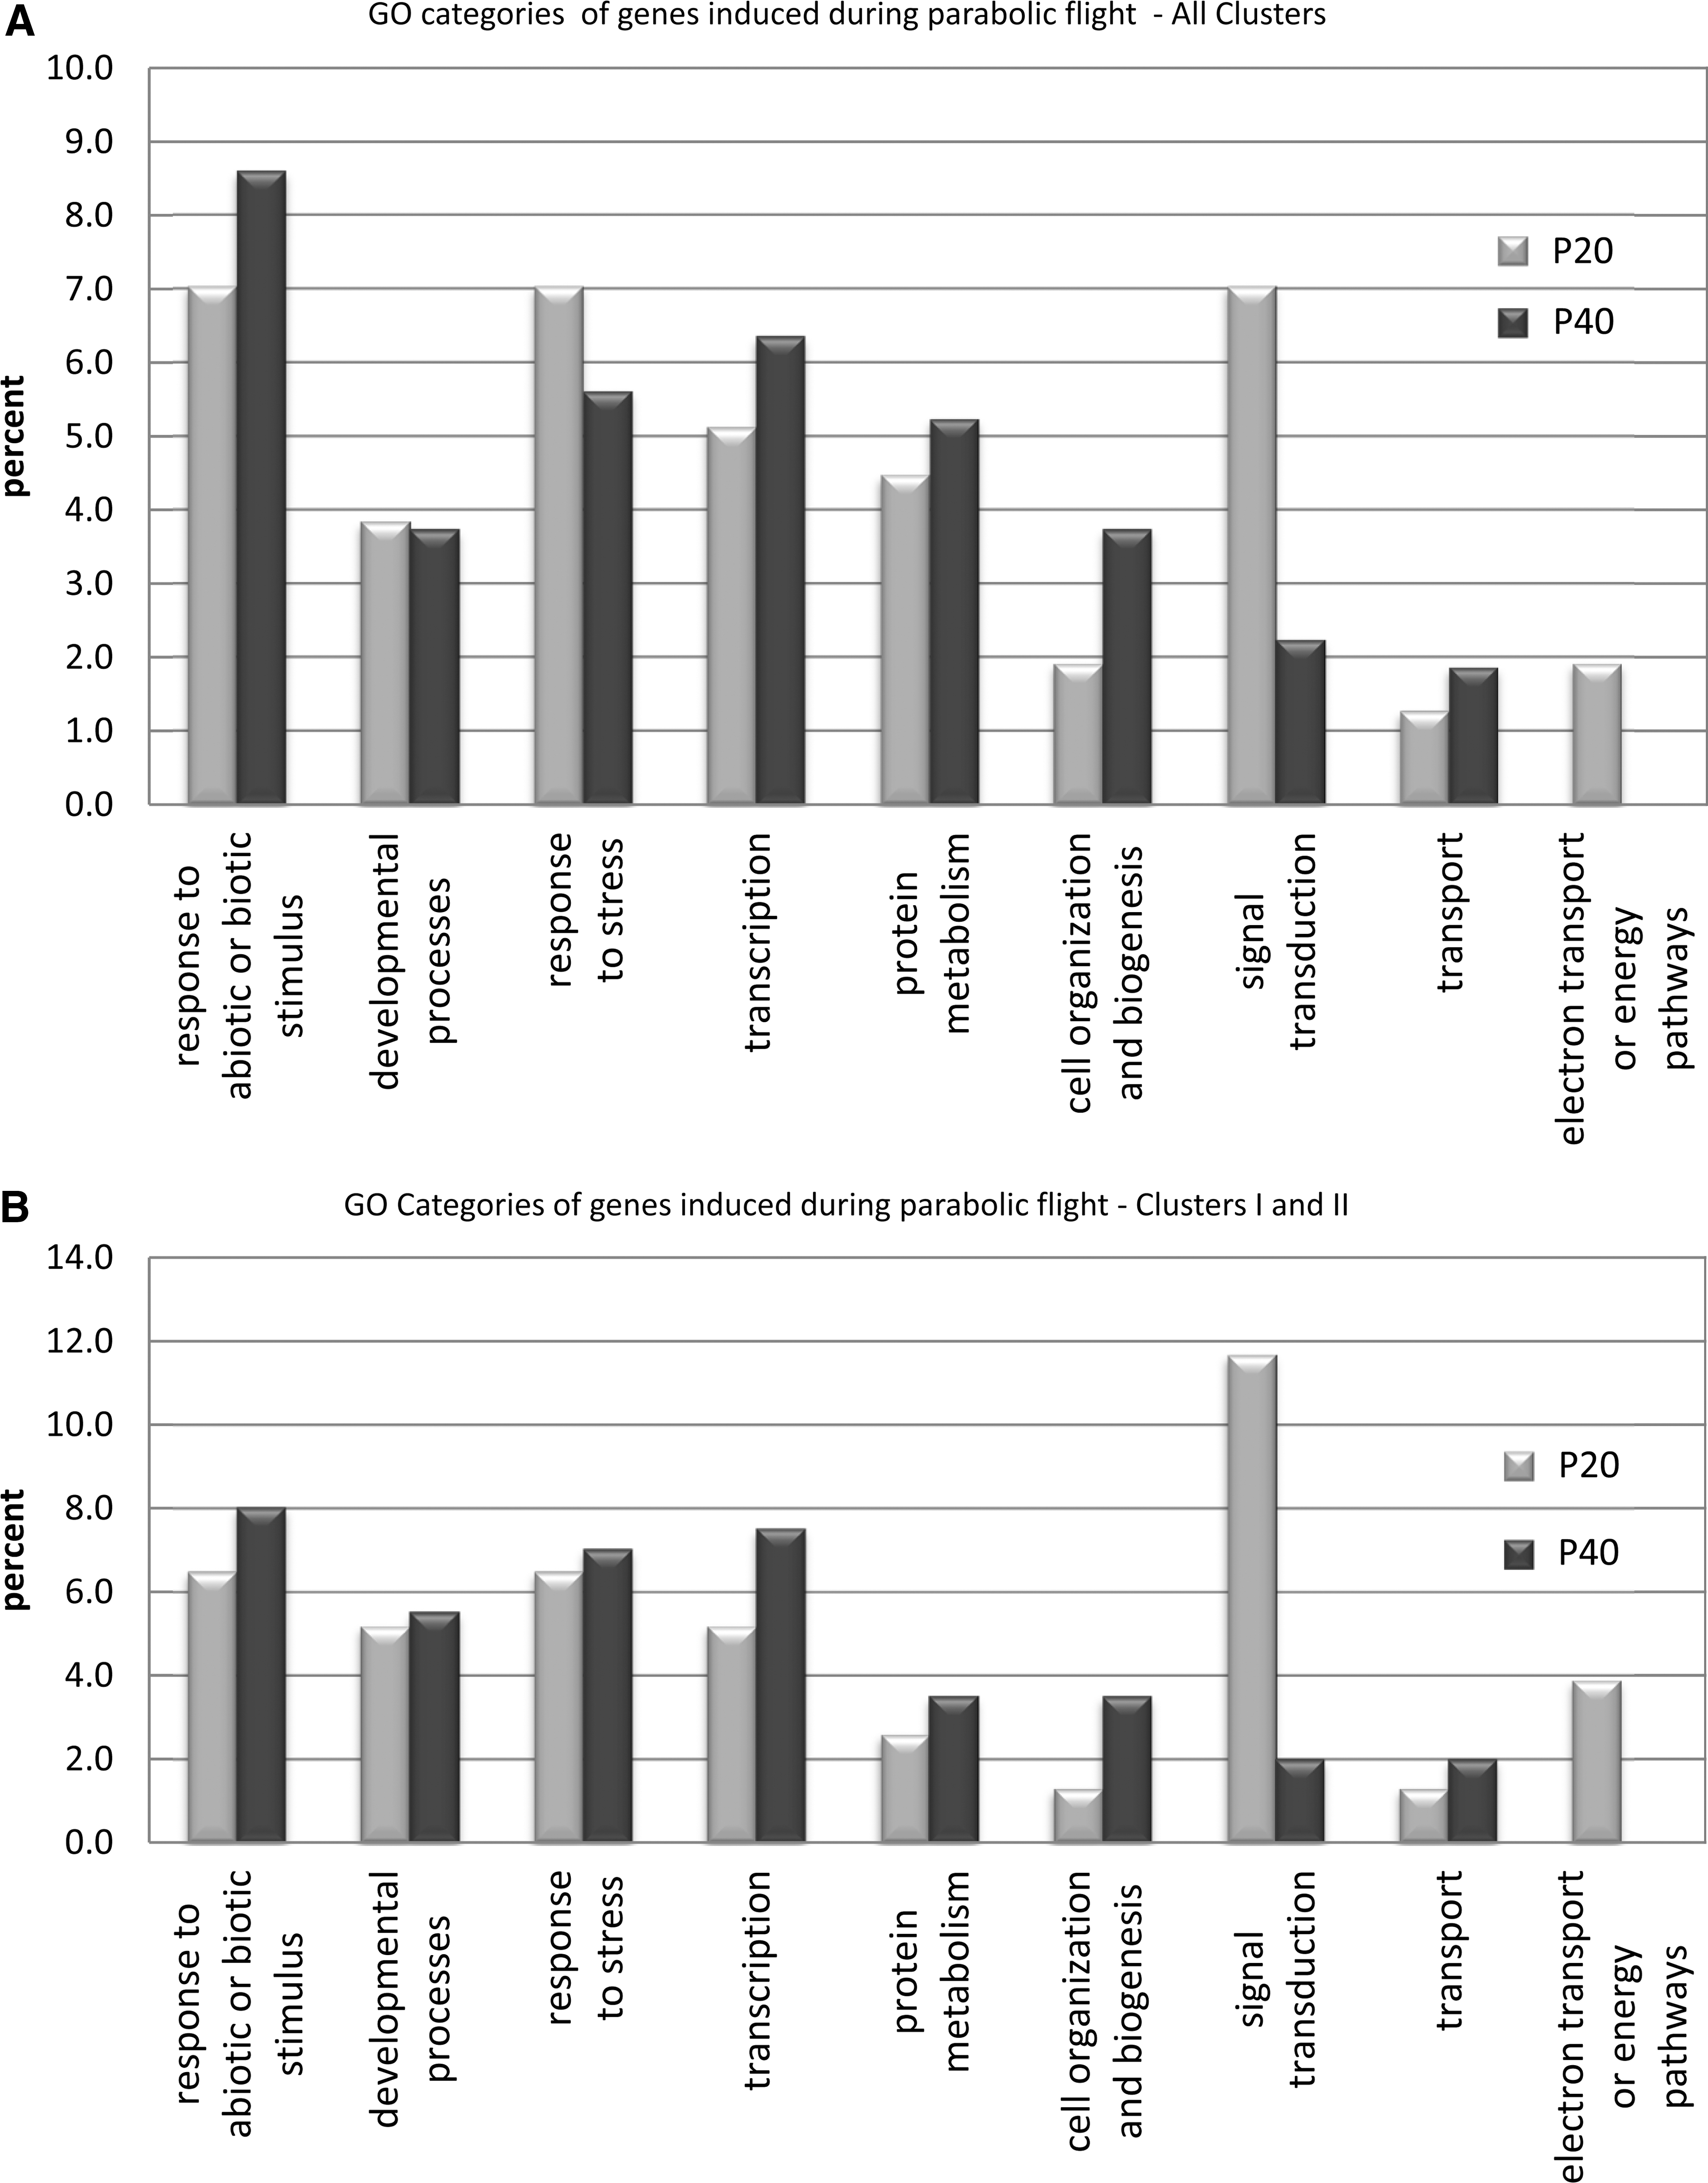
The distribution of induced genes in categories of biological function. Each graph shows the percentages of statistically significant (p≤0.01) induced genes in each of several Gene Ontology (GO) categories that are upregulated after 20 (P20, light gray) and 40 (P40, dark gray) parabolas. (
2.2.6. Quantitative reverse transcriptase–polymerase chain reaction (qRT-PCR) primers and probes
Two genes identified from the microarrays were quantified with quantitative TaqMan real-time reverse transcriptase–polymerase chain reaction from Applied Biosystems (Bustin, 2000). qRT-PCR Ct values were determined in triplicate for each gene of interest, and for Ubiquitin (AT4G05050) as the internal control gene within each reaction. The mean normalized expression values relative to Ubiquitin were determined with the Q-Gene spreadsheet tool (Simon, 2003). The error bars represent standard error of the mean. The Applied Biosystems Prism 7700 Sequence Detection Systems was used for the analyses. Forward and reverse primers flanking a 60–100 bp section of the gene of interest were ordered from Applied Biosystems along with the fluorescently tagged probe sequence that lies between the primer pairs. The amount of targeted message in each sample was determined by relating the TaqMan results for the gene of interest to a standard curve (also described in Paul et al., 2004).
2.2.7. Transgene analyses
Two transgenic lines were obtained through TAIR and Arabidopsis Biological Resource Center (
3. Results
3.1. Parabolic flight produces changes in gene expression that are consistent over multiple flights
The primary goal of this study was to determine whether parabolic flight would produce observable changes in Arabidopsis gene expression. A much-related major goal was to determine whether the same changes in gene expression would be evident across multiple flights conducted on different days. Arabidopsis plants were exposed to parabolic flight and harvested at parabola 20 (P20) and parabola 40 (P40). Microarray analyses of these samples indicated that patterns in gene expression are indeed altered after exposure to parabolic flight as compared to preflight ground controls (Fig. 3).
The expression of 377 genes was found to be altered by parabolic flight at a p value of ≤0.01 at either P20 or P40. Principal component analysis clearly indicated that by far most of the variation among the samples and replicates was due to the treatment of parabolic flight, rather than the day of the flights (data not shown). All subsequent analyses assessed the variation in gene expression across the three replicated samples taken on the separate flight days and expressed statistical measures across those three flights (Fig. 3).
3.2. Gene expression patterns cluster with the duration of the parabolic environment
K-means clustering was used to partition those 377 genes with p≤0.01 based on the fold-change gene expression data relative to the ground control (GND), averaged over the three separate flight days. This resulted in six groups of genes that displayed similar patterns of gene expression over the experimental treatments, P20 and P40 compared to the GND. The left panel of Fig. 3 shows a graphic representation of this K-means clustering of all 377 genes. Since the two treatments (P20 and P40) are compared to the GND, the GND column is black while the P20 and P40 columns show patterns of up (red) and down (green) regulation. The intensity of the color is roughly correlated to intensity of fold change compared to the GND—the dimmer reds and greens represent a fold change of between 1.5 and about 1.8, the very bright/intense greens and reds are those showing differential expression of greater than 1.8-fold.
These relatively small fold-change values all passed statistical stringency of p≤0.01 among the treatments across the three flights. There were, however, 63 genes that showed differential expression of at least 1.8-fold. The right panel of Fig. 3 shows those 63 genes with fold-change values above 1.8 at P20, P40, or both, together with the Affymetrix ID, Atg number, and gene name. A full annotation of the genes presented in Fig. 3, which contains numerical values and gene names, can be found in the Supplementary Data. (Supplementary Data are available online at
3.3. Differentially regulated genes can be organized into clusters according to their patterns of expression and biological function
Focusing on the patterns of color in Fig. 3 provides an immediate appreciation that a substantial number of genes were either induced or repressed after only 20 parabolas of flight and that the patterns of gene expression changed between the two time points. P40 was not just a more intense or amplified version of P20. The patterns of gene expression were examined from two basic perspectives: the biological process in which a gene or cluster of genes is involved, and the metabolic role a gene plays. Genes were placed in categories according to biological process with the Gene Ontology feature on TAIR (see Methods section for details). The patterns of gene expression were also examined as to differential expression at P20 and P40. A summary of the distribution of differentially expressed genes among various categories of biological processes is presented in Fig. 4. The category of biological process that was among the most highly represented at 20 parabolas, and the one that showed the largest degree of change between the P20 and P40 time points, was the category of signal transduction. There were more than 3 times the number of signal transduction genes expressed at 20 parabolas than those expressed after 40 parabolas of flight (Fig. 4A). This pattern is even more dramatic when individual clusters are compared.
Cluster I represents those genes that were induced early but returned to close to ground-control levels by 40 parabolas. This cluster contains a large number of transcription factors, phosphatases and kinases, and calcium-signaling proteins. Examination of this set with respect to biological process showed that a large proportion of these genes (12%) are categorized as being involved in signal transduction. In contrast, in the set of genes gathered in Cluster II, only 2% are considered to be involved with signal transduction. Genes in Cluster II were not induced until after 40 parabolas. Cluster II is a large cluster comprised largely of genes associated with plant hormone pathways (auxins, cytokinins, ABA) and also contains an abundance of transcription factors. Most of the genes induced in Cluster II are categorized as responders to abiotic and biotic stimuli and stress, as transcription factors or as involved with developmental processes.
Genes that were induced at P20 and remained induced at P40 are organized into Cluster V. In this group, only 3% of induced genes fall into the signal transduction category, but the percentages of genes comprising the categories of cell organization and biogenesis and protein metabolism have more than doubled as compared to Cluster I. Many of the genes in Cluster V are related to auxin metabolism and genes that encode phosphatases. Calcium-mediated signaling proteins and proteasome-related proteins are also well represented.
The genes organized into Cluster III can be divided into two sections: IIIa genes were unchanged at 20 parabolas, and evidence of downregulation was not observed until after 40 parabolas, while IIIb genes exhibited downregulation at P20 and remained downregulated through P40. This cluster is rich in pathogen/wounding response genes and cell wall metabolism genes. Interestingly, 9% of the genes downregulated in Cluster IIIa are categorized as responders to abiotic and biotic stimuli, while only 1% of downregulated genes in IIIb fall into this category of biological function. Cluster IV genes are also initially downregulated, but they became upregulated by the 40-parabola time point. A substantial portion of these genes encode transcription factors and DNA-binding proteins. And indeed, one of the largest categories represented in this cluster is that of genes involved in transcription. Cluster VI genes were downregulated at P20 as well, but the manner of expression for these genes in response to additional parabolic flight is acclimation, and expression levels mostly returned to ground control levels by P40. There are several meristem-associated genes in this cluster (AP2, NAM, NAP, CUC, NPH) as well as several ethylene-associated genes and additional transcription factors.
3.4. Differentially regulated genes predominate in several metabolic classes
As described above, many of the differentially regulated genes fall into categories of function that are associated with signaling and rapid response to changing environments. Such genes include kinases, phosphatases, and transcription factors. However, there are several metabolic groups, or classes, for which a large proportion of the differentially expressed genes can be associated. These groups are, in descending order of number of genes in the group, auxin-associated, cytokinin-associated, disease and pathogen response–associated, ethylene-associated, and calcium/phospho-mediated signaling.
Genes regulated by auxin or involved in auxin metabolism are highly represented in the list of genes upregulated by parabolic flight. Figure 5 shows the differential levels of expression for 18 auxin-related genes that were upregulated after 40 parabolas, although the expression levels at P20 are variable. The data are again presented in terms of fold change compared to the ground control (GND), which is set to a value of 1. Each bar represents the average of the three replicates from experiments conducted on three different days. Error bars show the standard error of the mean for the gene expression across the three flights. A number of the genes in this group are immediately recognizable as encoding proteins involved in auxin metabolism: auxin transport proteins REH1, EIR1 and auxin-responsive proteins GH3, IAA19, IAA2, IAA1, as well as a number of putative proteins simply identified as “auxin-induced proteins” in the array annotations. Others, such as extensin, the plant defensin PDF2, protein phosphatases 2C PP2C, cytochrome p450, and the F-box protein, are either associated with auxin-mediated regulation or represent members of protein families that are associated with auxin-mediated regulation. For instance, the most highly upregulated gene in this group is a putative plant defensin with similarity to PDF1, a jasmonate-responsive pathogen defense gene that is also influenced by auxin (Diaz and Alvarez-Buylla, 2006; Llorente et al., 2008).
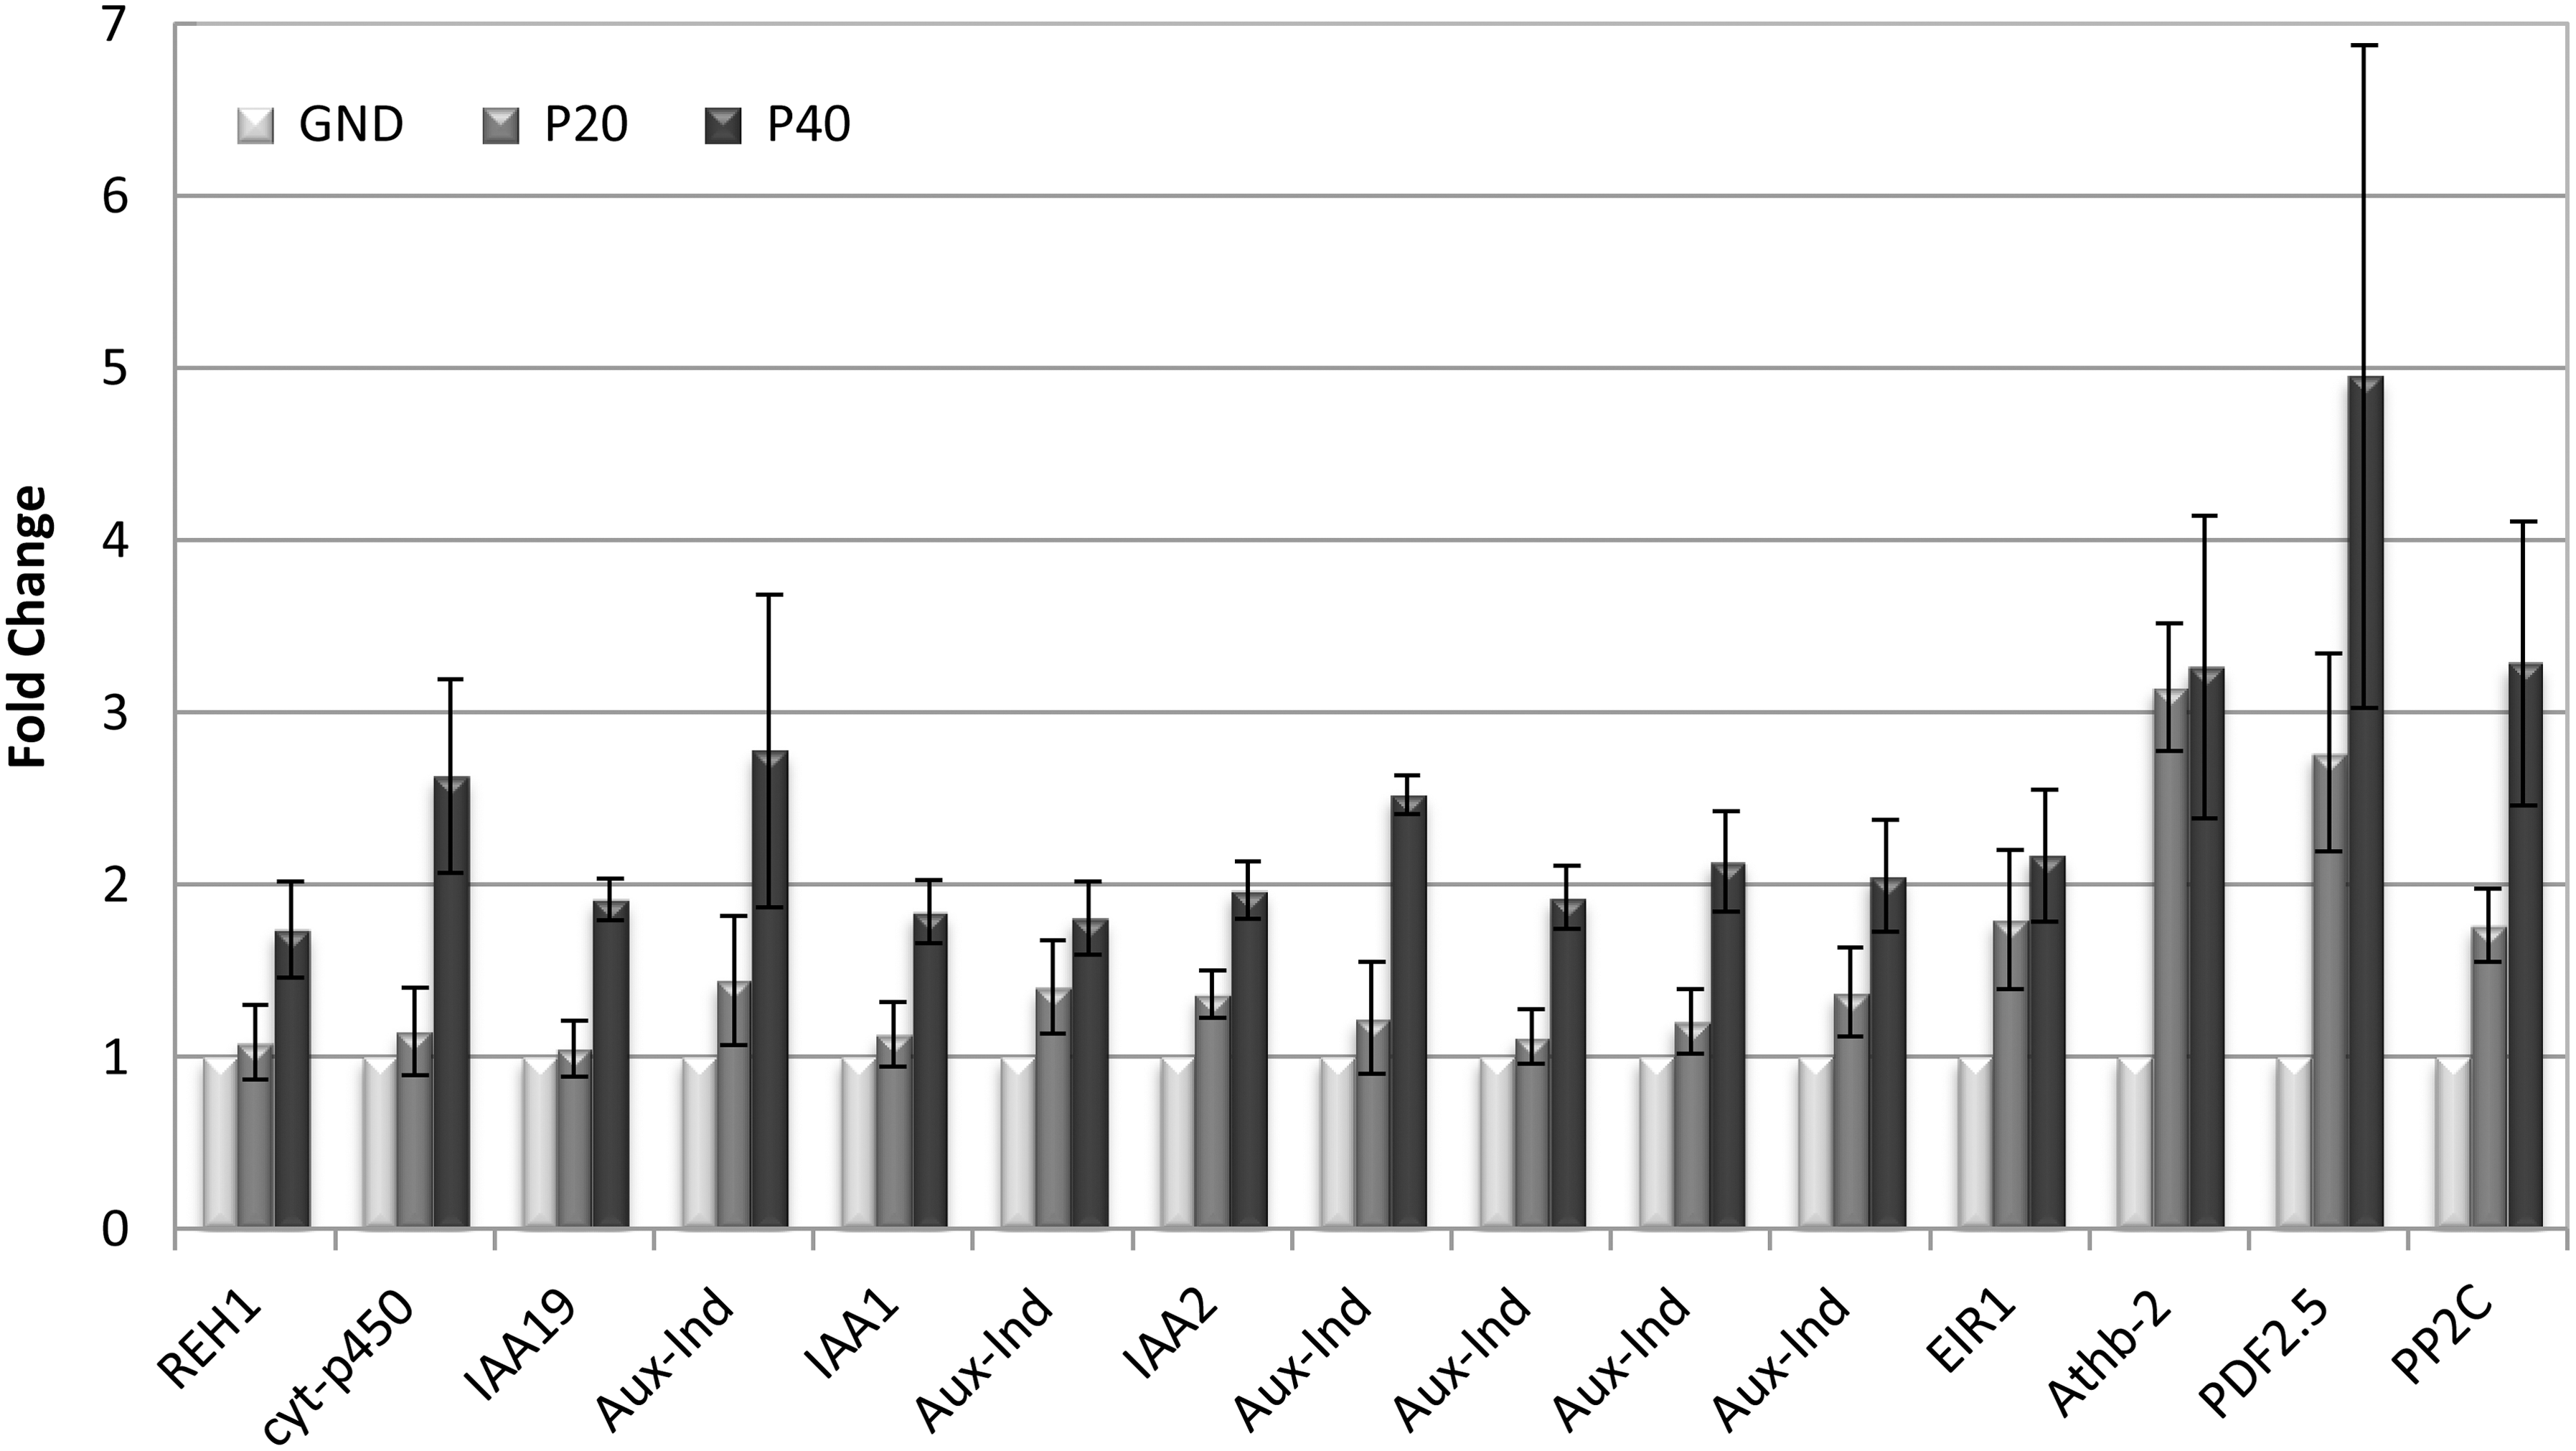
Examples of upregulated genes from the arrays that encode proteins involved in auxin metabolism. Error bars reflect standard error of the mean for the three replicate experiments (p≤0.01). Abbreviated gene names are placed below each set of parabola data for correlation with the fully annotated names and numerical values that are found in Table 1.
As might be expected from the biological processes data, another well-represented group of genes that were differentially expressed after parabolic flight encodes a variety of signal transduction proteins. These genes are distributed about equally among clusters and represent a diversity of metabolic processes, but calcium-binding proteins are a good example of the group. Most are labeled as “unknown proteins” but are annotated with descriptive designations such as calcium-binding EF hand family protein, calmodulin-binding family protein, calcium transporter, and calcium-dependent kinase. Many of these were upregulated at P20 and then returned to ground control levels by P40 (Cluster I), although calcineurin B-like protein was unaffected until 40 parabolas, where it was upregulated (Cluster II). More than 20 kinases and phosphatases are similarly distributed and have members in several different clusters. However, phosphatases are generally upregulated, while kinases predominate in downregulated gene clusters.
Genes associated with ethylene response constitute another well-represented group. Most were downregulated and are found in Cluster III, such as the gene that encodes the ethylene-responsive element binding factor (EREBP-2) and another AP2 domain-containing protein: ethylene-responsive binding factor 5 (ERF5); and other genes that encode nonspecified ethylene-responsive proteins. Others, including ACC synthase, ABC transporter, and a gene that encodes an ethylene-associated TPR-containing protein, were upregulated. Genes that encode several DNA-binding factors involved with auxin- and ABA-regulated transcription were also downregulated, such as the cold-responsive transcription factors RAV1 and RAV2 (Yamasaki et al., 2004). Genes associated with other plant hormone metabolism are also differentially expressed, such as those that encode GAST1-like (gibberellic acid stimulated transcript-like) and GA20OX1 (gibberellin 20 oxidase), which regulates gibberellin synthesis (Vanhaeren et al., 2010; Xiao et al., 2010). In addition, the genes that encode isoforms of the ABA-inducible ATHB transcription factors, which also serve to repress GA20OX (Son et al., 2010), were differentially regulated in two different clusters: Athb-2 was upregulated while Athb-7 was downregulated.
Cluster III is also populated with a large number of well-characterized genes that encode proteins associated with wounding, pathogen response, and cell wall metabolism. These genes were all downregulated in response to parabolic flight. Figure 6 provides a sample of genes from this group. As with Fig. 5, the data present the average values of three replicates as fold-change compared to the GND, with error bars showing the standard error of the mean. In this case, since the GND is still set as a value of 1, the fold-change values are expressed as fractions. Thus, a value of 0.5 indicates a 2-fold reduction in expression levels. Again, many of these genes are readily recognizable, in this case as encoding defense-related proteins. Many are represented on the arrays by multiple members of disease resistance–related proteins, wound-responsive family proteins, jasmonate-inducible proteins, and GTP-binding proteins, but only one from each group is given in Fig. 6. The two-nucleotide binding site containing genes (TIR-NBS-LRR and CC-NBS-LRR disease-resistance proteins) are also just single examples of several of the group. Table 1 annotates the graphical data presented in Figs. 5 and 6.
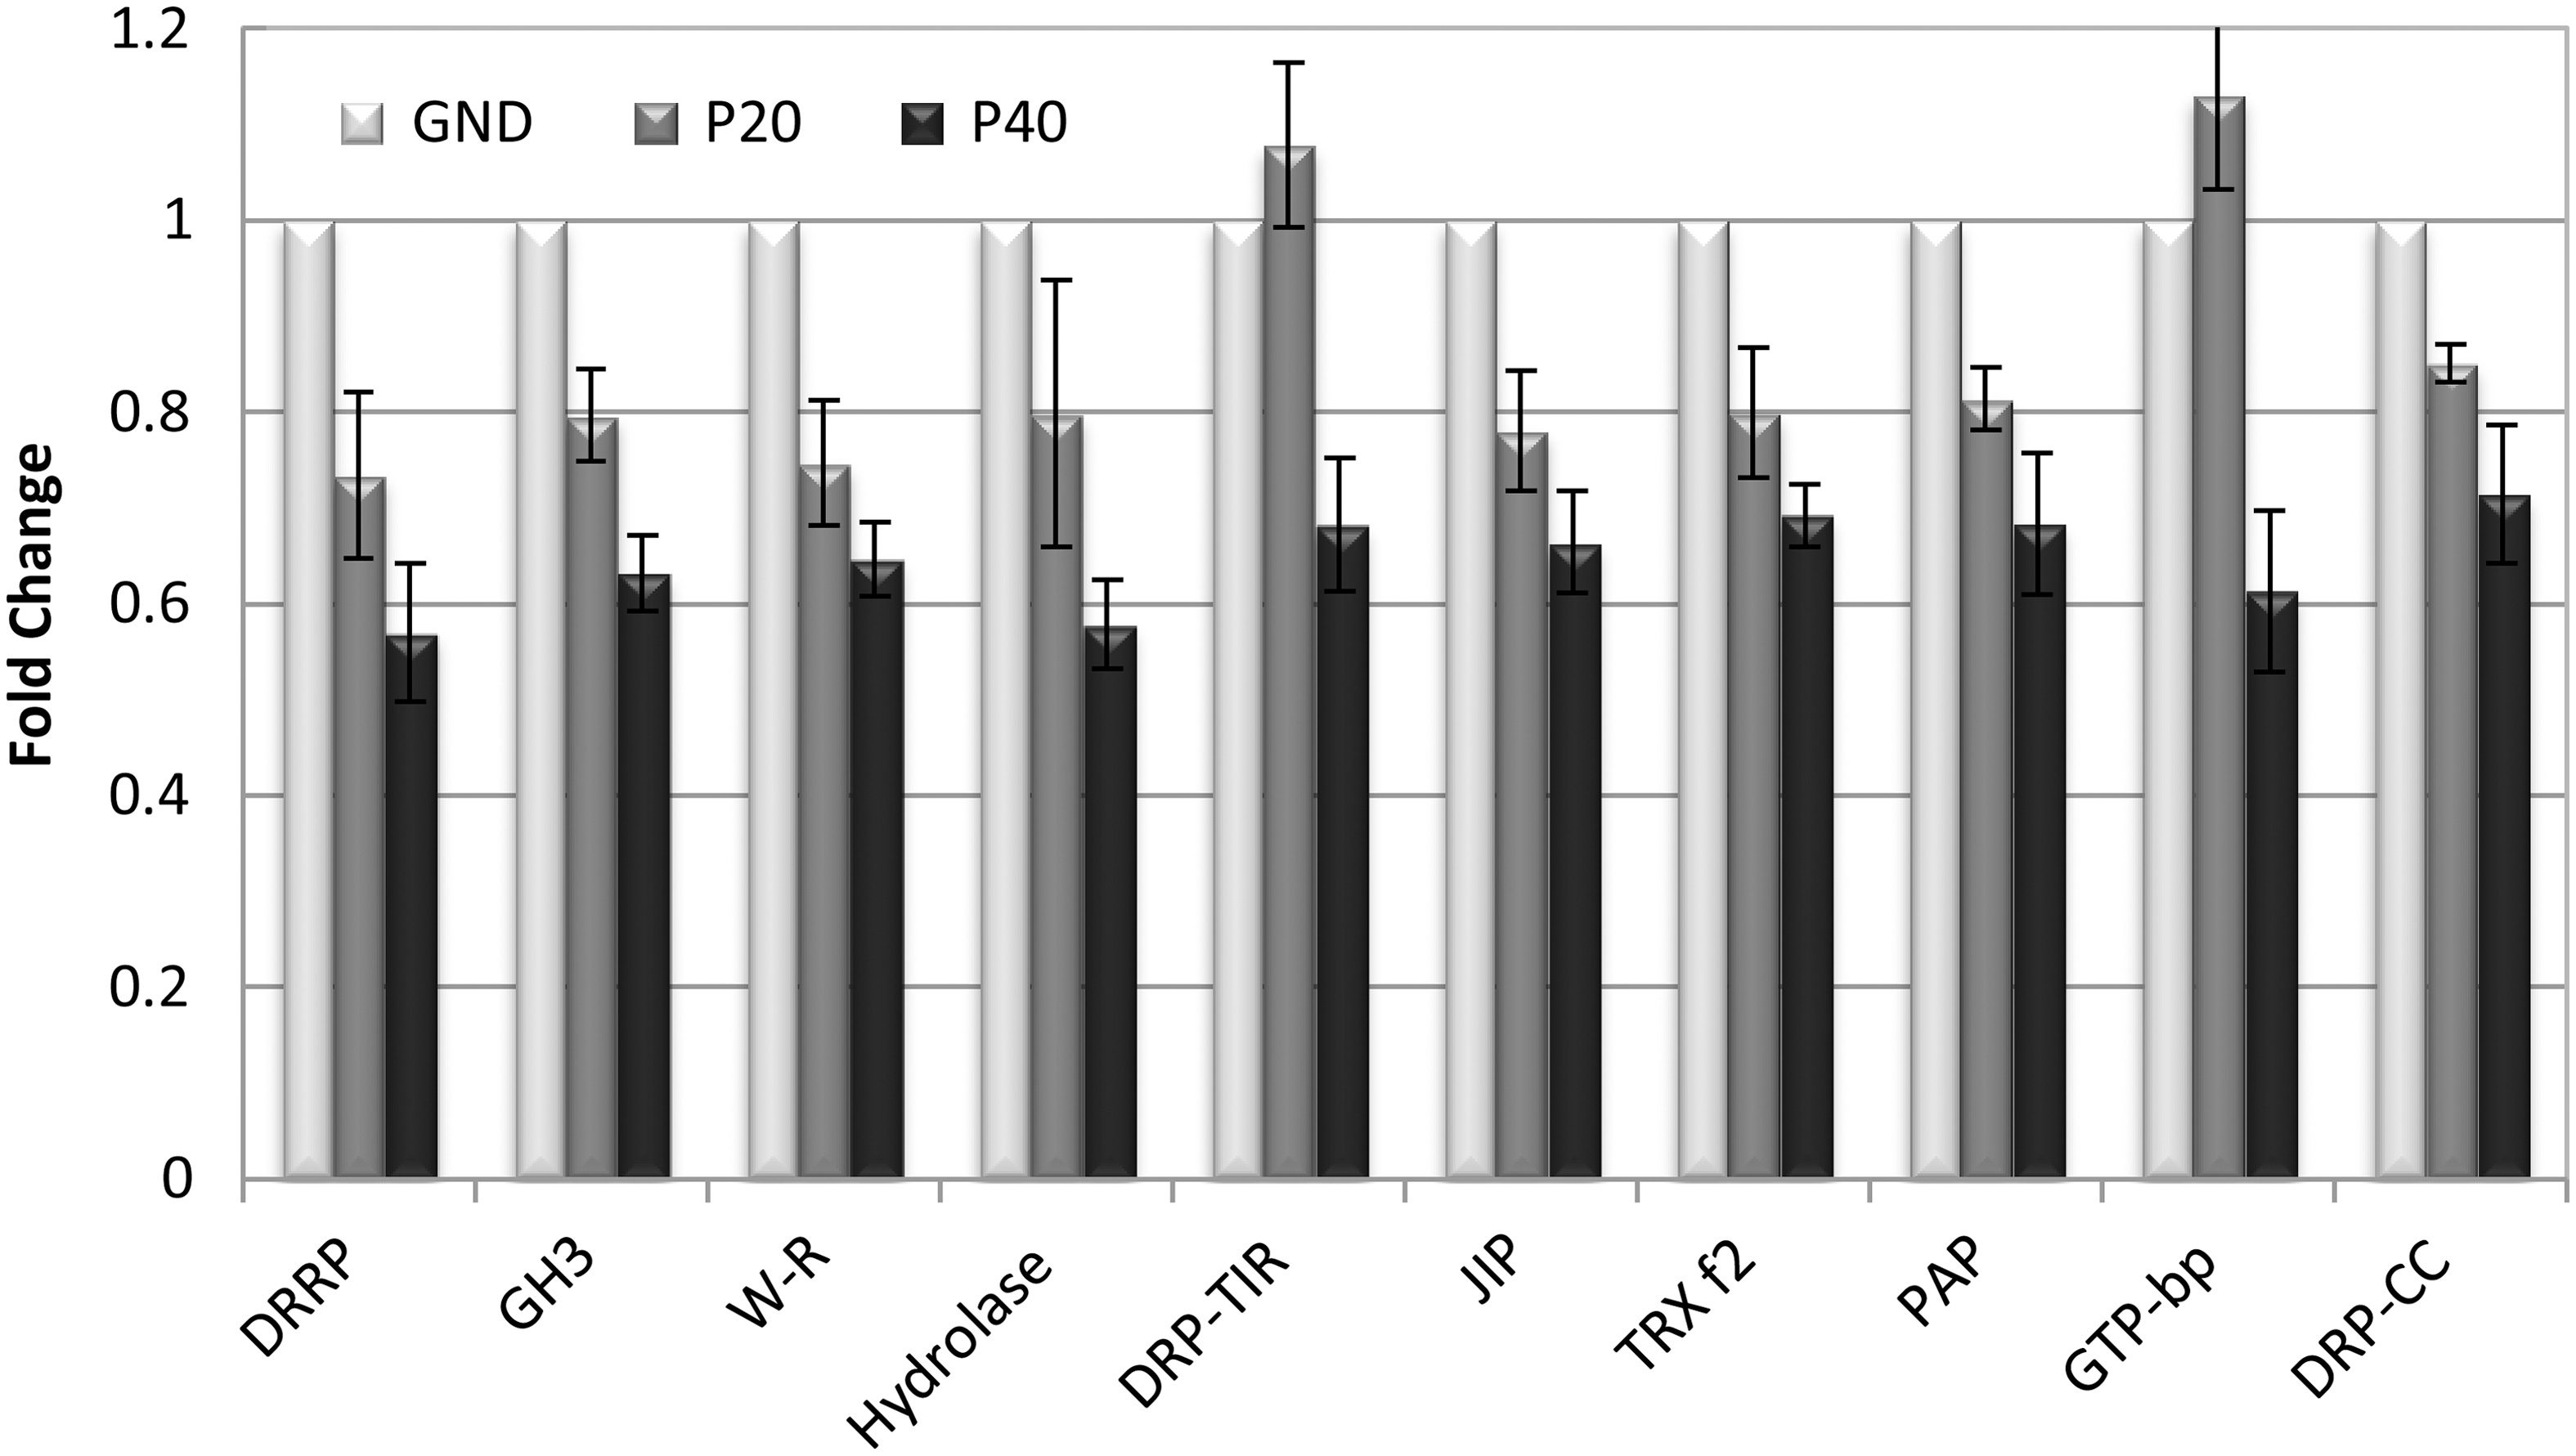
Examples of downregulated genes from the arrays that encode proteins associated with pathogen response metabolism. Error bars reflect standard error of the mean for the three replicate experiments (p≤0.01). Abbreviated gene names are placed below each set of parabola data for correlation with the fully annotated names and numerical values that are found in Table 1.
3.5. Quantitative confirmation of changes in gene expression
Quantitative reverse transcriptase–polymerase chain reaction was used to confirm the trends of regulation patterns for key representative genes from each of Figs. 5 and 6, respectively. Ethylene insensitive root 1 (EIR1), which encodes an auxin efflux transmembrane transporter, was chosen as a marker for an upregulated gene that is considered rapidly engaged in auxin responses. Disease resistance–related protein (DRRP), which encodes an extension-like protein, was chosen as a marker for downregulated genes associated with stress. Figure 7 shows a comparison of qRT-PCR of the upregulated EIR1 in the left-hand panels and the downregulated DRRP in the right-hand panels. In each panel, the top graphs show a fold-change comparison between the values from the qRT-PCR (dark gray) and the arrays (light gray). The bottom graphs provide the mean normalized expression in the qRT-PCR data for each parabolic treatment. The standard error of the mean is shown as error bars in each graph. The trends for EIR1 track well in both analyses. The trends for DRRP track very well for the P40 values, but qRT-PCR indicates that DRRP was downregulated even further than was indicated by the arrays. Overall, however, the qRT-PCR data support the array data and suggest that these two genes could be effective markers for targeted analyses.
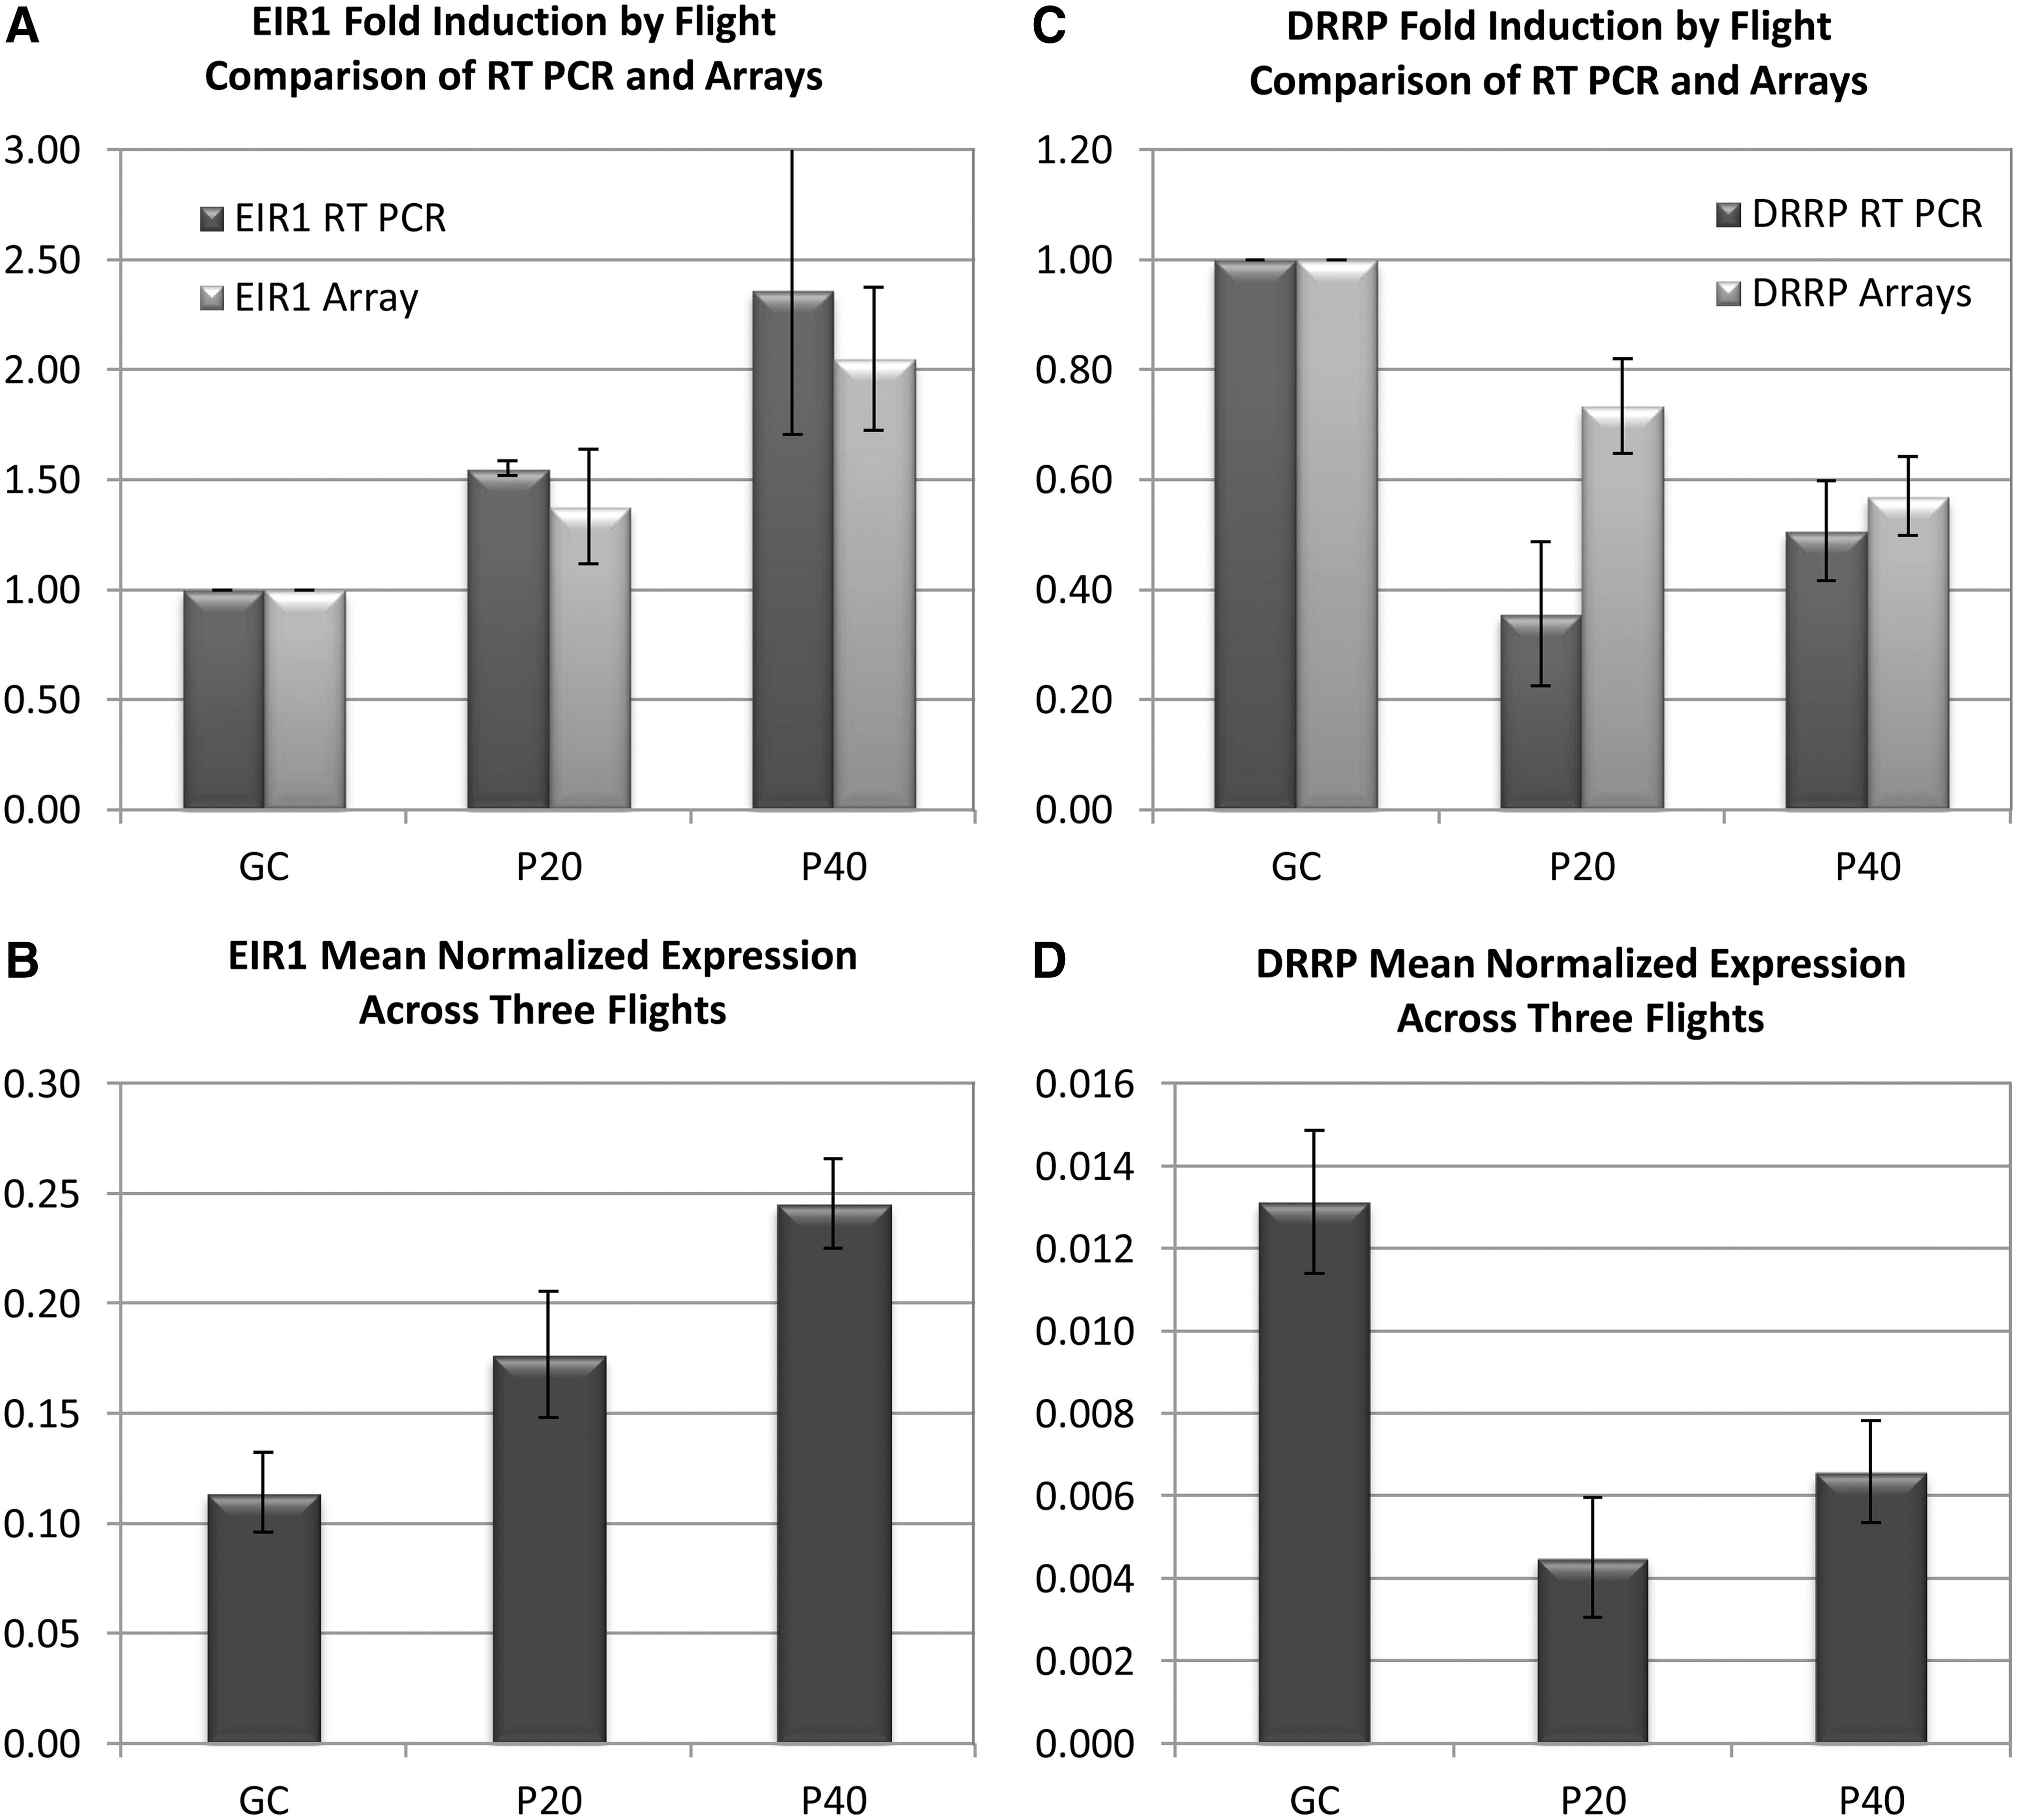
qRT-PCR analyses of EIR1 (ethylene insensitive root 1, an auxin efflux transmembrane transporter) (
3.6. Qualitative and cell-specific confirmation of changes in gene expression
In addition to the quantitative analyses of plant-wide changes in gene expression provided by the arrays and qRT-PCR for two key genes, qualitative analyses with available reporter genes were used to evaluate tissue-specific changes in expression patterns. Since microarray data from the initial set of flight experiments indicate that numerous auxin-associated genes were affected by the parabolic flight environment, two transgenic gene-reporter lines, Pin4:GUS and Arf7/NPH4:GUS, were chosen to report tissue-specific patterns of gene expression of early auxin signaling in a set of follow-on experiments. Pin4 encodes an auxin efflux mediator localized in developing and mature root meristems, and Arf7/NPH4 encodes a transcription factor that binds to the auxin-responsive element.
Plants were flown when they were 7 days old and harvested immediately to x-Gluc stain after the end of the last designated parabola. Figure 8 provides composite photos of Pin4:GUS plants in the left panels (A–D) and Arf7/NPH4:GUS plants in the right panels (E–H). The aerial portions of the photos also show the apical region of a second plant example as an insert in the primary picture. The root photos are taken from two or three different plants. In the Pin4:GUS plants, the distribution of transgene expression appeared to become less intensely localized after 40 parabolas. Pin4 expression in the aerial portions of the plants was more localized to the vascular tissue in the controls (A) compared to those exposed to parabolic flight (C). Expression in the newly developing lateral roots appeared less distinct from the primary root in the plants exposed to parabolic flight (B) versus (D). The Arf7/NPH4 plants also displayed subtle changes in the patterns of transgene expression. The ground control plants were more likely to exhibit transgene expression in the petioles of the emerging true leaves (E) than the parabolic flight plants (G). The ground controls also tended to show more intense expression at the base of the emerging lateral roots (F) compared to roots from parabolic flight plants (H). Because of the relative small proportion of the tissues exhibiting a response, it is unlikely that whole seedling arrays would indicate any statistically significant differences for these genes.
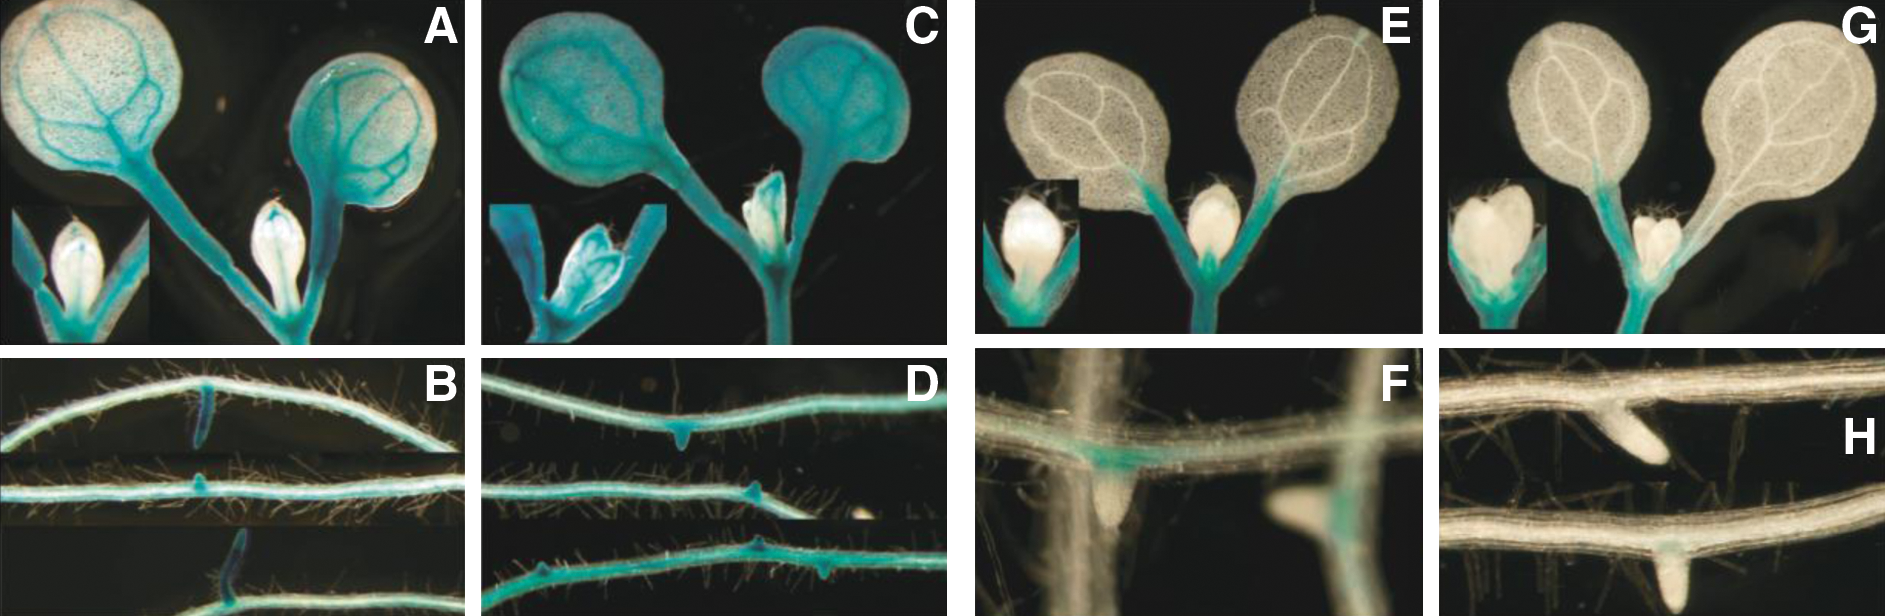
Seven-day-old Arabidopsis Pin4/GUS plants showing patterns of transgene expression. Ground controls (
4. Discussion
Parabolic flight is a novel environment. It is outside the evolutionary experience of any terrestrial organism and includes strong elements of altered gravity along with operations-associated variables such as preflight, flight time, pressure changes, and other largely uncontrollable elements of complex flight operations. It was unknown whether the many operational variables associated with parabolic flight campaigns would obscure changes in gene expression, as gene expression is a robust but delicate indicator of biological response and adaptation. Our results clearly show that, even across multiple flight days with different operational elements, consistent changes in gene expression induced by parabolic flight can indeed be observed at the relatively stringent level of p≤0.01.
Having established that reproducible gene expression changes could be observed, it becomes important to investigate whether the observed gene expression changes were potentially correlated with changes in gravity or were more broadly associated with the many potential stresses of parabolic flight.
Genes involved with auxin- and cytokinin-mediated signaling are prominent among the genes significantly altered by parabolic flight and represent a third of all annotated genes in Fig. 3. Cytokinin and auxin allow perception of sensitive environmental orientation (Moubayidin et al., 2009; Perrot-Rechenmann, 2010), and there is overlapping and interconnected regulation of genes associated with the balance of auxin and cytokinin with tissues (reviewed by Bishopp et al., 2010). Therefore, the most obvious physical feature of the parabolic flight environment, the rapid fluctuation in the gravity vector, is seemingly reflected in the patterns of gene expression observed in these experiments.
Auxin metabolism is tightly connected to the signal transduction pathways associated with gravity perception. There are innumerable studies that have made this connection; reviews of the subject date from Darwin and his son (Darwin and Darwin, 1881) to many in the past dozen years or so (e.g., Lomax, 1997; Luschnig et al., 1998; Rosen et al., 1999; Sieberer et al., 2000; Swatzell and Kiss, 2000; Perera et al., 2001; Wolverton et al., 2002; Blancaflor and Masson, 2003; Perbal and Driss-Ecole, 2003; Morita and Tasaka, 2004; Perrin et al., 2005; Palme et al., 2006; Kepinski, 2007; Toyota et al., 2008; Li et al., 2011). Most of the auxin-related genes were upregulated in parabolic flight very quickly, initial induction being seen after 20 parabolas of flight. This rapid response is in keeping with that observed in previous studies that have shown that plants can detect changes in the gravity vector within minutes. It has been shown that 15 min is sufficient to engage a number of pathways related to changing the gravity vector in Arabidopsis plants (Moseyko et al., 2002; Kimbrough et al., 2004). Both of these studies used transcriptional profiling to examine the genes affected by changing the gravity vector and through mechanical stimulation. Kimbrough et al. (2004) showed many of the trends seen for the parabolic flight data: cell wall–associated genes down and auxin-related genes up. In addition, there were several genes that were similarly induced: the lectin-related and keltch repeat-containing F-box genes, protein phosphatase 2C, and no apical meristem (NAM). Moseyko et al. (2002) showed gravity-related upregulation of NAM as well. The roles of genes associated with calcium-mediated signaling and kinases, and phosphatases in gravity perception and phytohormone signaling, are also well established (Fasano et al., 2002; Rentel and Knight, 2004; Plieth, 2005; Gilroy, 2008; Hong-Bo et al., 2008; Boudsocq et al., 2010).
The two auxin-related genes chosen as GUS reporter genes, Pin4 and Arf7, each show changes in gene expression with parabolic flight. The PIN-FORMED proteins (PIN1) and (PIN4) function in the maintenance of auxin gradients (Friml et al., 2002; Weijers et al., 2005) as efflux mediators in polar transport of auxin (Paponov et al., 2005; Jonsson et al., 2006). Further, Pin1 expression in pea and maize is impacted by spaceflight and analog environments that disrupt the gravity vector (Ueda et al., 2000; Shimazu et al., 2001; Hoshino et al., 2003; Miyamoto et al., 2003, 2005). Arf7/NPH4 encodes a transcription factor that binds to the auxin-responsive element (Wang et al., 2005; Guilfoyle and Hagen, 2007; Okushima et al., 2007). Arf7 is a member of an extended family of transcription factors that are involved in the regulation of auxin metabolism-related genes. Transcription of many of auxin metabolism genes is regulated through a balance of ARFs and the family of auxin-induced gene products (Kerr and Bennett, 2007). Many of the Aux/IAA proteins act as repressors of ARF through the formation of protein complexes (Woodward and Bartel, 2005), which removes ARF factors from the pool of transcriptional activators of Aux/IAA encoding genes. ARF7 has been found to be a component of the auxin-related signaling that initiates lateral root formation and is upregulated in pre-branch sites (Moreno-Risueno et al., 2010). The periodicity of lateral root formation appears to be affected by the roots' response to gravity; thus it is possible that the disruption of the gravity vector experienced by plants in parabolic flight also impacts the level of Arf7 expression at these sites.
Not all gene expression changes that occur in parabolic flight can be easily explained by microgravity effects, as there is a highly represented category of genes that are generally considered stress response genes (Ma and Bohnert, 2007). This category of genes also includes a variety of genes associated with wounding and pathogen defense, although, invariably, some of the genes in this category intersect with auxin and cytokinin metabolism as well (Spoel and Dong, 2008). The regulation of these genes is consistent with an interpretation that plants are being exposed to an environment outside their evolutionary experience, and while many of the signals are familiar and can be easily categorized (like changes in the gravity vector), there are aspects of the phenomenon of parabolic flight that perhaps elicit an inappropriate response or are due to other operational components of the flight besides gravity. The plant senses that it is in an unfamiliar situation, which is then translated as a stress. The plant subsequently engages the metabolic pathways that most closely match the set of cues it is receiving. On the surface, it does not appear clear how a greater than 4-fold induction of a plant defensin gene might function in stress mitigation. However, the regulation of defensin is also tied to the Ca(2+)-dependent protein kinase CPK3, which is involved in calcium-mediated signaling in plant adaptation to a wide variety of abiotic stimuli, including drought, salt, and cold. Indeed, the responses of plants to pathogens, wounding, and auxin metabolisms is strongly tied to calcium signaling on many levels (Poovaiah et al., 2002; Benjamins et al., 2003; Lanteri et al., 2006; Tuteja and Mahajan, 2007; Du et al., 2009; Vadassery and Oelmuller, 2009; Kanchiswamy et al., 2010). A recurring theme includes the participation of calcineurin B-like (CBL) calcium sensors, which work in concert with CBL-interacting protein kinases to carry calcium-mediated signals from a variety of sources (Weinl and Kudla, 2009). Members from both of these gene families are represented in the sets of differentially regulated genes in response to parabolic flight (see also Supplementary Data) and appear to intersect the regulation of dozens of other genes represented in the this data set.
It is not our intent to address the full scope of the subject of auxin or calcium signaling but rather to place in context the patterns of gene expression we see in response of Arabidopsis to parabolic flight environments, especially as relevant to using this environment as a spaceflight analogue (see Rosen et al., 1999; Kamada et al., 2000; Perera et al., 2001; Poovaiah et al., 2002). The biological impact of spaceflight environments has been assayed in many ways, from the Apollo-era Biostack experiments that were designed to examine the effects of high-energy particles (e.g., Bucker et al., 1973) to the use of molecular tools to evaluate changes in gene expression and signal transduction in (e.g., Hughes-Fulford, 2001). As molecular tools were engaged, a common feature of many of these latter spaceflight experiments is the involvement of calcium-mediated signaling in the effected response. In plants, spaceflight has been shown to disrupt the ability of fern spores to establish proper polarity, and ground-based treatments with a calcium-channel blocker that reduced the calcium current similarly disabled the polarity-orienting influence of gravity (Chatterjee et al., 2000). Arabidopsis plants had root-to-shoot signals disrupted, which, again, could be recapitulated in ground experiments only through the use of calcium blockers (Paul et al., 2001). In addition, a genome-wide survey of gene expression patterns in Arabidopsis plants exposed to a spaceflight environment indicated that a number of genes are highly up- or downregulated compared to ground controls (Paul et al., 2005). One example of a group of genes that were highly downregulated were several chlorophyll a/b binding proteins (cab), the regulation of which also involves calcium-mediated signal transduction (Barnes et al., 1995; Shiina et al., 1997). Array analyses for wheat that had been germinated and grown in a spaceflight environment for 21 days showed very little differential expression of genes compared to the ground control plants (Stutte et al., 2006, and supplemental data therein). Interestingly, of the few that showed modest downregulation, two are associated with calcium-mediated signaling—cystatin and superoxide dismutase (Price et al., 1994; Kaseda et al., 2007). Patterns of differential gene expression have also been evaluated in Arabidopsis cell cultures exposed to the suborbital environment of a sounding rocket. Again, many of the genes identified are associated with calcium-mediated signaling, being predominantly upregulated compared to ground controls (Martzivanou et al., 2006).
The conclusions from these data suggest that, at a minimum, plants do respond to the novel environment of parabolic flight with observable and repeatable changes in gene expression. After an initial response rich in genes involved in signal transduction, plants begin to engage pathways that seem to address the adaptive needs of the plants in this environment, including changes in genes known to be influenced by gravity. It seems wholly appropriate that many genes in this category are directly associated with known gravity-influenced patterns of gene expression. However, the changes in expression of stress-related genes seem to reflect a general perception of stress, or a perception of an altered, abnormal environment that is potentially the collective operational experience of parabolic flight. These data suggest that the first few minutes of the initial transition to orbital spaceflight can be explored through tractable molecular biology approaches and can be richly informative regarding biological responses to spaceflight.
Footnotes
Acknowledgments
The authors would like to acknowledge the help and support of Mick Popp of ICBR, University of Florida, for bioinformatics and microarray analyses; John Yaniec, Dominic Del Rosso, Wanda Thompson of the Reduced Gravity Office at Johnson Space Center Ellington for their guidance in executing the experiments during parabolic flights; Kelly Norwood, Dave Reed, April Spinale, Dave Cox, Matt Reagan, Trevor Murdoch of Kennedy Space Center for countless hours of support in these endeavors; and also Guy Etheridge, who constantly reminded us of the joy that can be found in doing your job well. This work was supported by NASA grants NNX07AH27G and NNX09AL96G to A.L.P and R.J.F.
Author Disclosure Statement
No competing financial interests exist.
Abbreviations
CBL, calcineurin B-like; DRRP, disease resistance–related protein; EIR1, ethylene insensitive root 1; NAM, no apical meristem; qRT-PCR, quantitative reverse transcriptase–polymerase chain reaction; TAIR, Arabidopsis Information Resource.
References
Supplementary Material
Please find the following supplemental material available below.
For Open Access articles published under a Creative Commons License, all supplemental material carries the same license as the article it is associated with.
For non-Open Access articles published, all supplemental material carries a non-exclusive license, and permission requests for re-use of supplemental material or any part of supplemental material shall be sent directly to the copyright owner as specified in the copyright notice associated with the article.