
Abstract
We present a comprehensive model of martian pressure-temperature (P-T) phase space and compare it with that of Earth. Martian P-T conditions compatible with liquid water extend to a depth of ∼310 km. We use our phase space model of Mars and of terrestrial life to estimate the depths and extent of the water on Mars that is habitable for terrestrial life. We find an extensive overlap between inhabited terrestrial phase space and martian phase space. The lower martian surface temperatures and shallower martian geotherm suggest that, if there is a hot deep biosphere on Mars, it could extend 7 times deeper than the ∼5 km depth of the hot deep terrestrial biosphere in the crust inhabited by hyperthermophilic chemolithotrophs. This corresponds to ∼3.2% of the volume of present-day Mars being potentially habitable for terrestrial-like life. Key Words: Biosphere—Mars—Limits of life—Extremophiles—Water. Astrobiology 11, 1017–1033.
1. Introduction
N
From our current state of knowledge, the limiting factors for terrestrial life can be summarized as (i) temperatures above ∼122°C (Kashefi and Lovley, 2003; Takai et al., 2008); (ii) low water activity with a w<0.6 (Grant, 2004; however, there may be the potential for active life in lower water activities as reported by Schulze-Makuch et al., 2011); and (iii) a combination of lack of nutrients and low water activity with temperatures below −20°C, the current minimum temperature for active life (Junge et al., 2004). The latter occurs in permafrost, arctic climates, and at altitudes above 10 km.
The apparent high-pressure limit to life beneath oceanic and continental crust seems to be a limit of observations, not of life (Jones and Lineweaver, 2010). There is theoretical discussion that liquids other than water could support different forms of life with unique biochemistries (Irwin and Schulze-Makuch, 2001; Bains, 2004; Benner et al., 2004; Schulze-Makuch and Irwin, 2006). For the purposes of this study, however, we have assumed that liquid H2O is the most plausible life-sustaining fluid for Mars.
In the present study, we developed a pressure-temperature (P-T) model of Mars and compared it to the P-T diagram of water to quantify the maximum possible extent of liquid water on Mars. We then superimposed the P-T conditions that are hospitable to terrestrial life to identify the potential liquid water environments on Mars that would be able to support terrestrial life. We also examined the large range in soil temperatures consistent with the shallow equatorial martian subsurface and the likelihood of liquid water in such environments.
2. The Pressure-Temperature Phase Diagram of Mars
In Fig. 1, martian environments, estimated from surface measurements (Table 1), modeled subsurface geotherms, and atmospheric lapse rate (see Table A1, Appendix A) are compared with the phase diagram of two types of liquid water relevant to Mars. Figure 1 shows regions of phase space where martian environments have the potential to contain liquid water. For example, it shows regions where there is Mars but no liquid water and where there could be liquid water (blue shading) but there is no Mars.
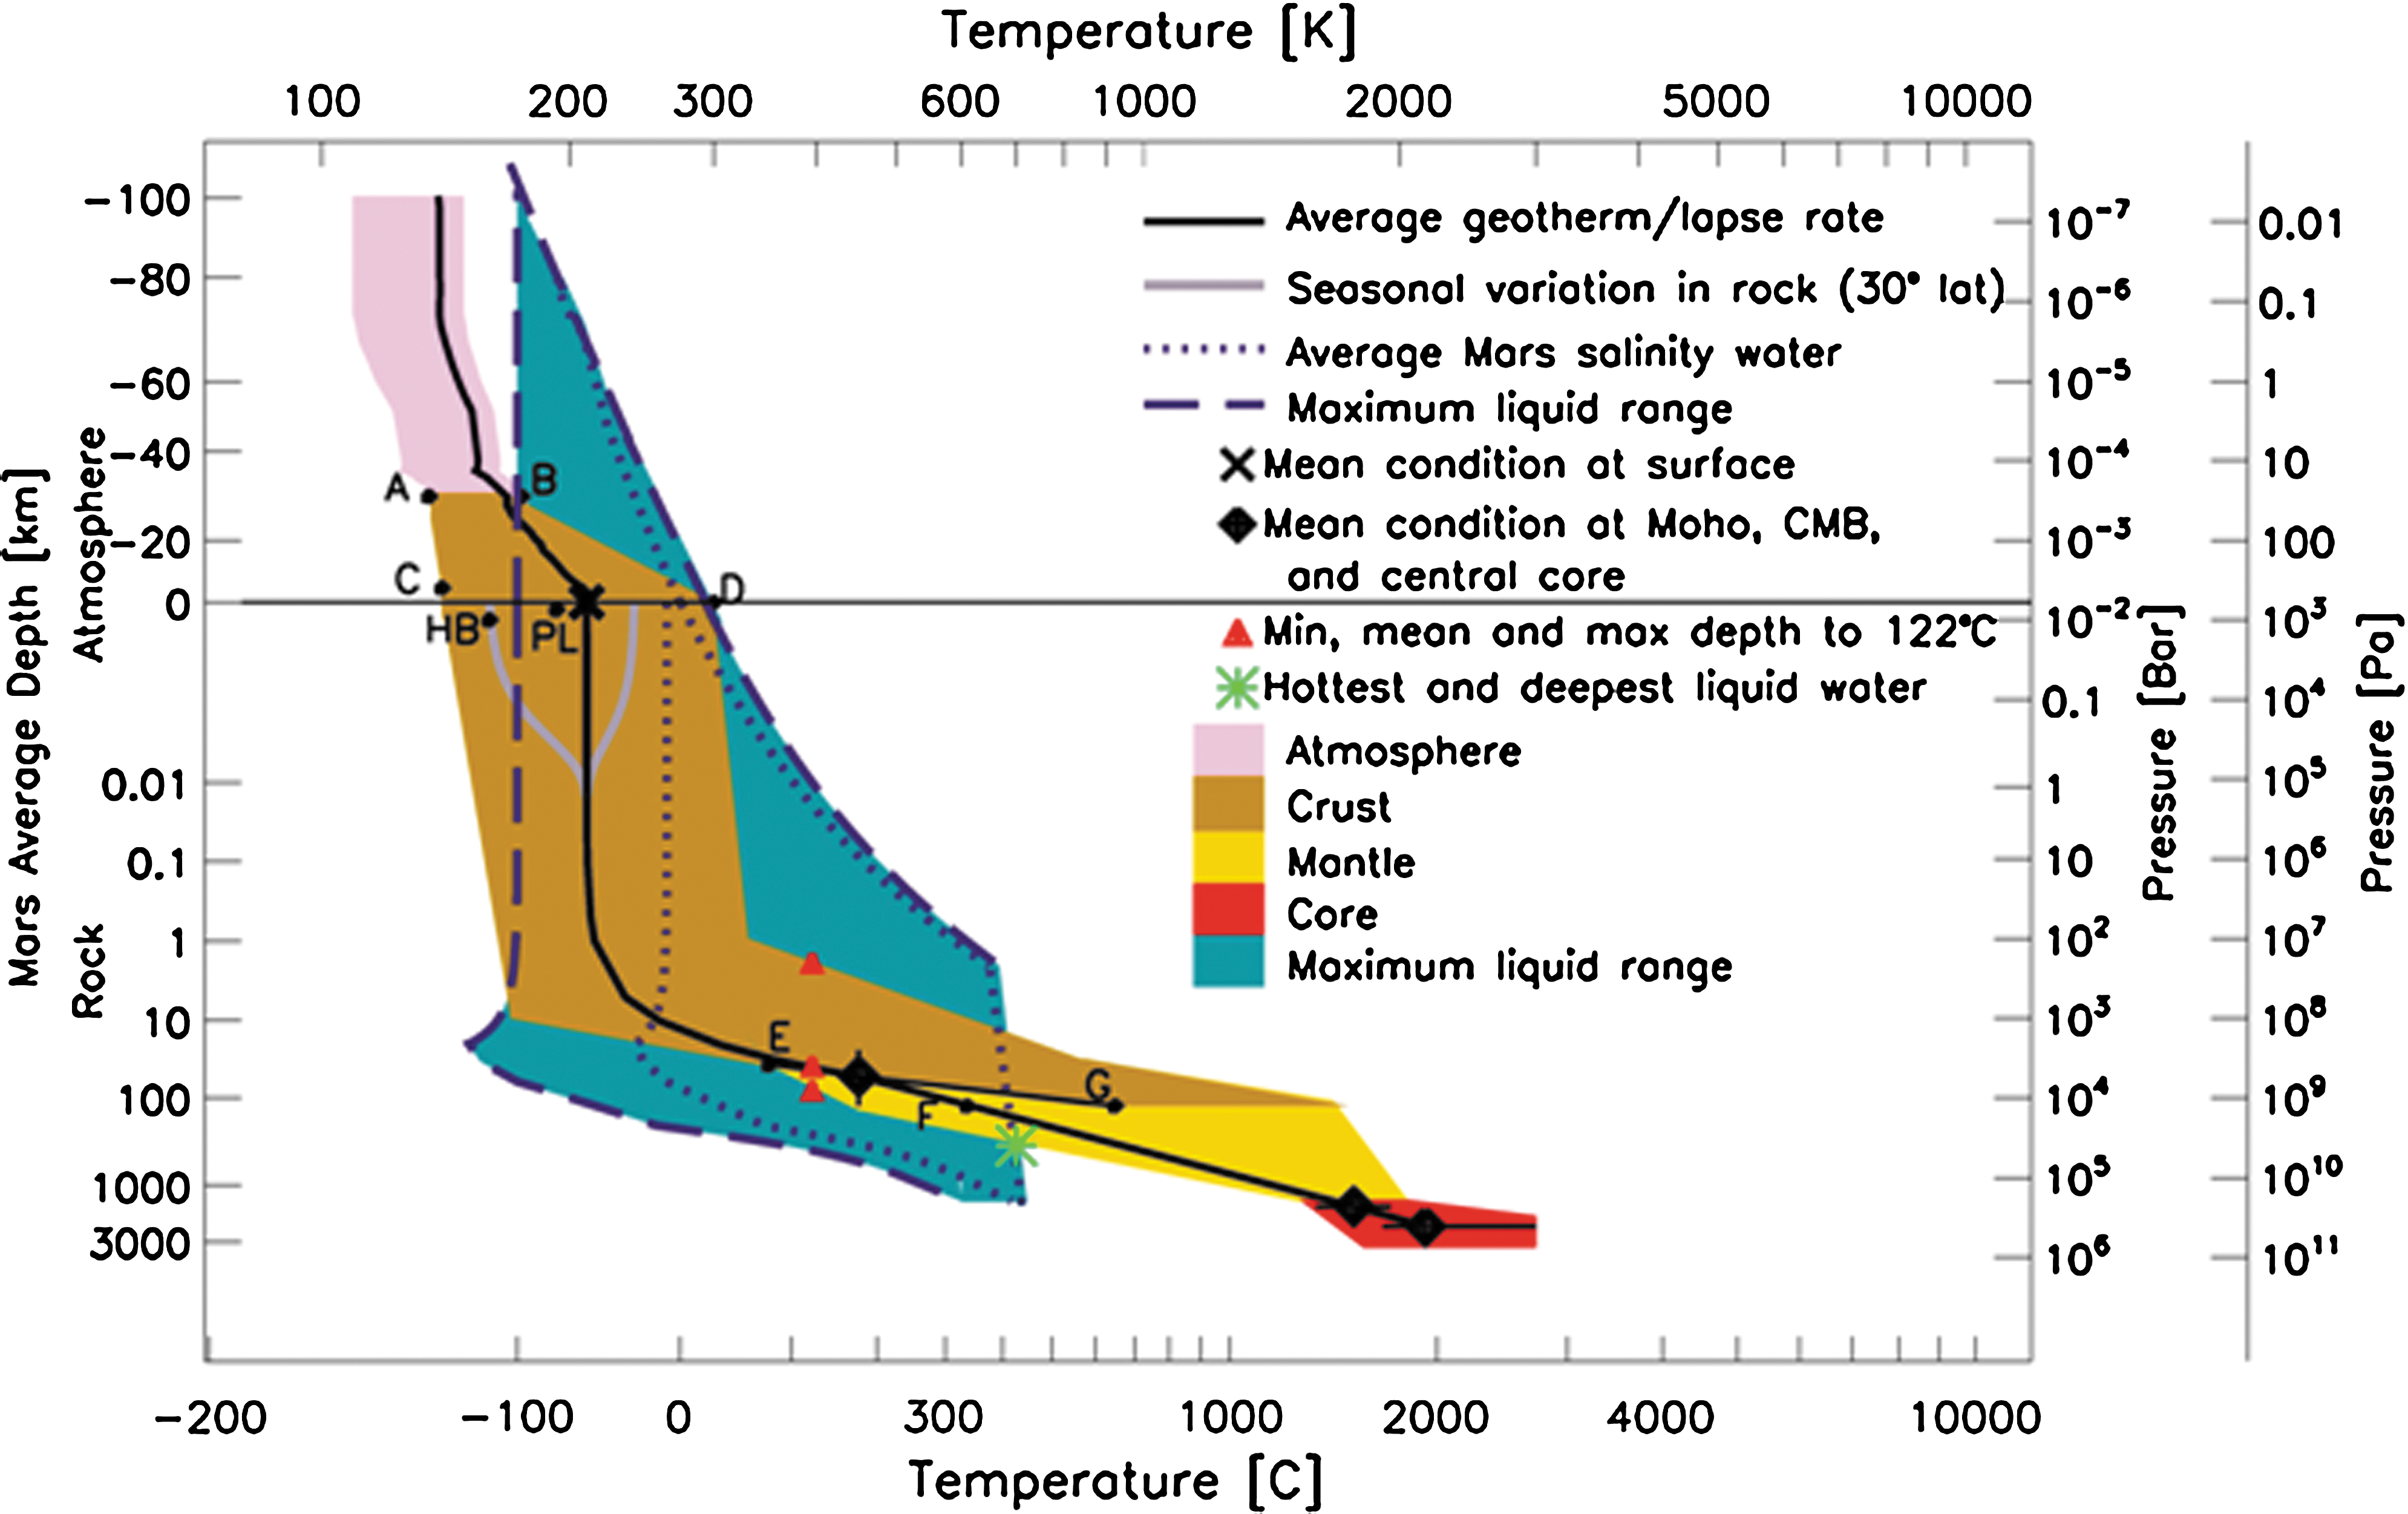
Mars and liquid water. Superposition of martian environments on the P-T diagram of two versions of martian water. “Average Mars salinity water” has a freezing point of −10°C, while “Maximum liquid range” has a freezing point of −100°C, and its phase space is shaded in blue. Mars' core, mantle, crust and atmosphere are colored separately. The geophysical model used to construct the P-T range of martian environments is described in Appendix A. Subsurface seasonal temperature variations in rock at absolute latitude 30° are shown (gray curves, see also Fig. 4 and Appendix C). The horizontal thin line at 0.006 bar is the average atmospheric pressure of Mars. The black cross on that line marks the average surface temperature, −63°C (210 K). Letters indicate the extreme P-T values listed in Table 1. For example, A and B represent the coldest and hottest days on the summit of Olympus Mons. HB and PL indicate the P-T conditions at Hellas Basin and the Phoenix lander, respectively. The black diamonds give the mean modeled conditions at the crust-mantle boundary (Moho), core-mantle boundary (CMB), and the center of the core (Tables 1 and A1). The green asterisk represents our estimate of the hottest and deepest possible liquid water on Mars at T∼427°C and P∼4×10⁴ bar, corresponding to a depth of ∼310 km. The red triangles indicate the intersection of the average martian geotherm and the minimum and maximum boundaries of phase space with 122°C.
Due to the lack of low latitude zero-elevation temperature measurements, we take the measurement made by the Opportunity rover at 3 km below the zero-elevation surface as the maximum surface temperature at zero elevation.
The majority of the geotherms used to construct the shaded crust region were “hot models” that are now less favored in the literature (see instead the references in Table 1 and Fig. 1). Thus although the Mars phase space incorporates both older and more recent models, the letters in Table 1 highlight our estimates of the most plausible extreme temperatures and pressures. Hence E appears near the boundary of the shaded region, and G is not at the maximum temperature of the phase space at its particular pressure.
“Average Mars salinity water” freezes at −10°C at the triple point and provides an estimate of the phase space of a likely martian brine that contains magnesium, iron, and calcium sulfates (Jagoutz, 2006; Tosca et al., 2008) at 0.4–8 % wt (Bibring et al., 2005; Gendrin et al., 2005; Yen et al., 2005; Marion et al., 2010); magnesium and iron carbonates (Tosca et al., 2008); and sodium chloride (total amount of salts in soil <10 mol/kg; Marion et al., 2009). Results from Mars Odyssey indicate that in some locations the fraction of magnesium sulfate salts in the soil may reach 30 % wt (Vaniman et al., 2004).
The “Maximum liquid range” is appropriate for the potentially concentrated briny inclusions and thin liquid films in ice and permafrost (Price, 2000; Davis, 2001; Möhlmann, 2008) beneath the martian surface (cf. Jones and Lineweaver, 2010, for Earth water). It has a freezing point depression of −100°C (Pearson and Derbyshire, 1974) at the triple point and is an estimate of the coldest possible liquid water on Mars (see Jones and Lineweaver, 2011). The details of our Mars model, including estimates of uncertainties and how the core (red), mantle (yellow), crust (light brown), and atmosphere (pink) were constructed, are described in Appendix A.
The phase space of terrestrial life is shown in Fig. 2 superimposed on the P-T diagram of Earth and of Mars. The current high-temperature limit for terrestrial life is ∼122°C (Kashefi and Lovley, 2003; Takai et al., 2008). The current low-temperature limit for active life is ∼−20°C (Junge et al., 2004) and might be more correctly understood as a limit due to low water activity (Grant, 2004; Tosca et al., 2008; Jones and Lineweaver, 2011). The low mean geothermal gradient in the martian crust (∼5 K/km compared to ∼25 K/km on Earth) and its variation (shown by the width of the phase model at a given depth) provide deep, cool environments not found on Earth (down to ∼10s of kilometers on Mars) that may be suitable for life (Pedersen, 2000; Chivian et al., 2008; Sherwood Lollar et al., 2009). Although there are empirical high- and low-pressure limits for terrestrial life, these are probably due to limited sampling rather than to fundamental limits of biochemistry (Jones and Lineweaver, 2010 and references therein). Figure 3 shows an extrapolation of the “Active life” and “Dormant life” regions to higher pressures. This is justified since the apparent high-pressure limit to life beneath oceanic and continental crust seems to be a limit of observations, not of life (Jones and Lineweaver, 2010). Active terrestrial life is limited to pressures above 0.3 bar; however, the limiting factor is more likely to be a lack of nutrients and water at high altitudes rather than pressure (Jones and Lineweaver, 2010). Thus, it is plausible that life on Mars could inhabit subsurface environments at low pressures <0.3 bar, provided that the temperature is above −20°C and liquid water is available with a high-enough water activity, and that life has a source of energy and nutrients. Some high-altitude dormant life conditions on Earth are reached in the shallow subsurface of Mars. Thus, we extrapolate the active and dormant life regions to both lower and higher pressures (still within the martian subsurface).
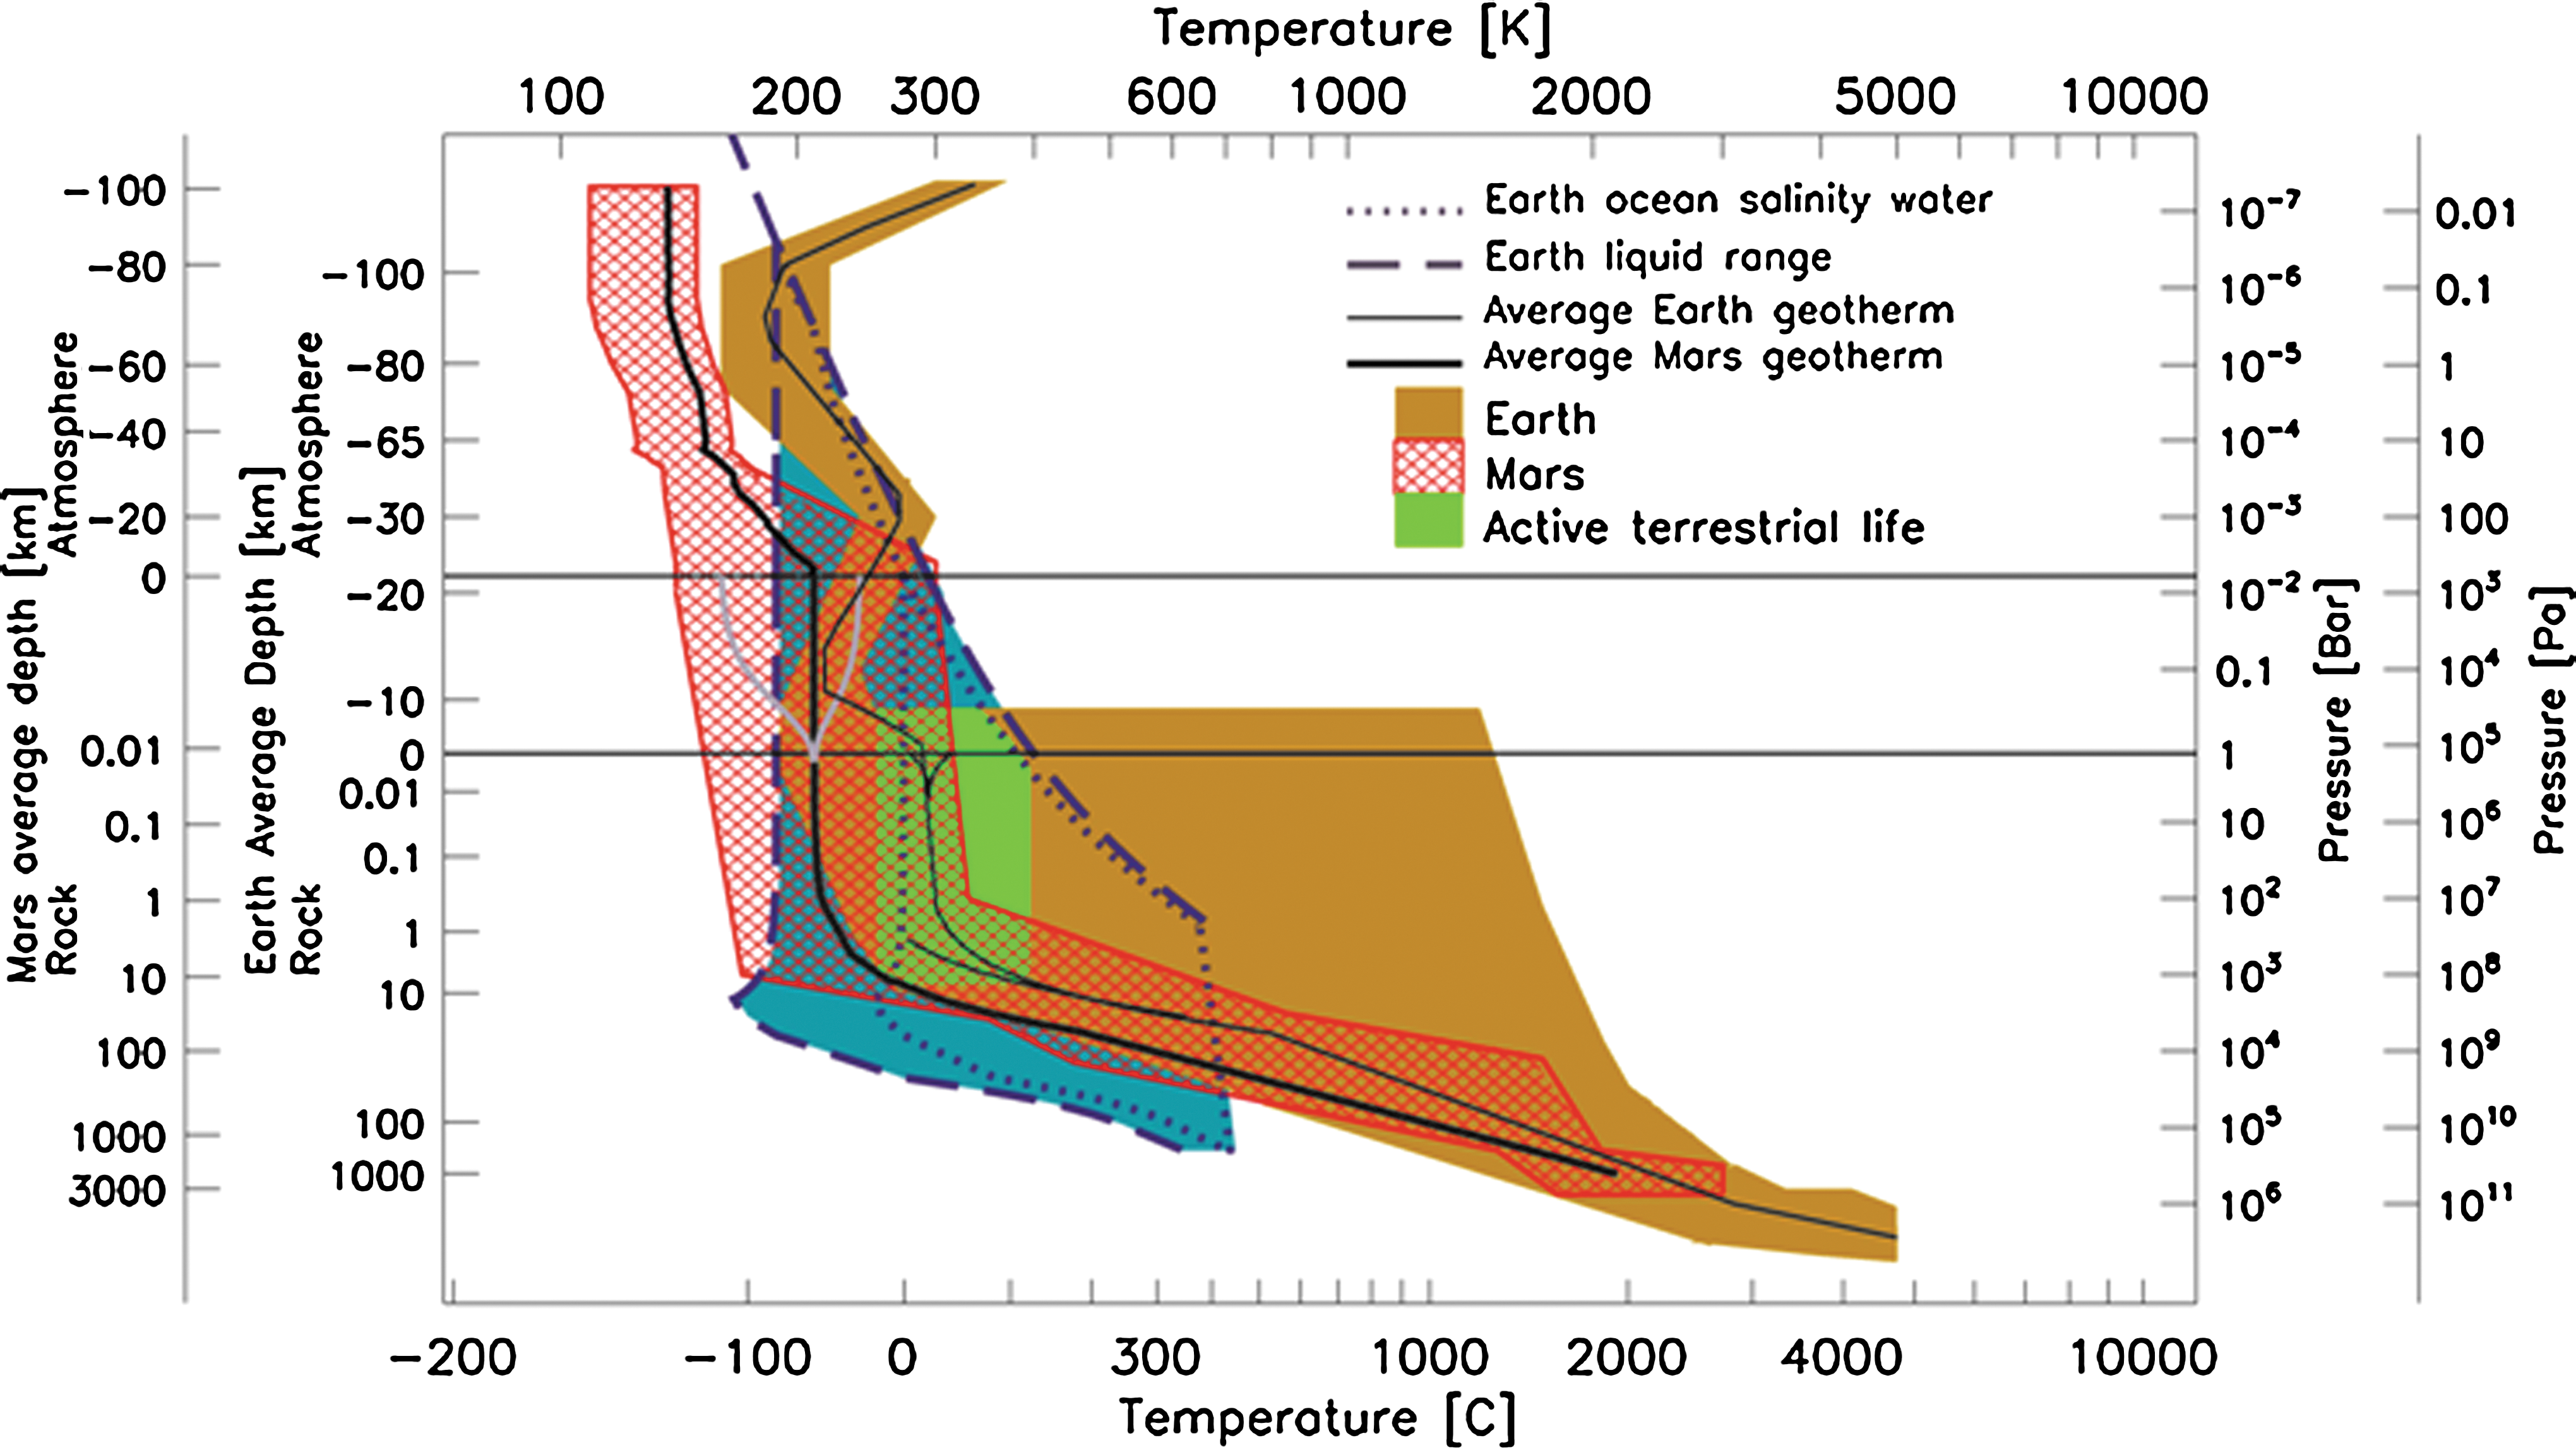
Mars, Earth, water, life. Superposition of four phase regions showing the extensive overlap of Mars with the inhabited regions of Earth. The Mars region is from Fig. 1. The Earth (brown), life (green), and water (blue) regions are taken from Fig. 5 in Jones and Lineweaver (2010). The mean geotherms through Earth (thin black line) and Mars (thick black line) are shown. Shallow mantle intrusions on Earth provide shallow, hot environments not found on Mars due to its low present-day geological activity. The annual subsubsurface temperature profile for martian rock at ∼30° absolute latitude is reproduced from Fig. 1 (gray curves). For comparison, an estimated terrestrial subsurface profile of seasonal temperature variation is also shown. The martian seasonal temperature variations penetrate deeper (skin depth of 3 m compared to 2.2 m for Earth rock) because of the larger winter-summer temperature difference and the longer martian year. As the maximum and minimum soil temperatures within a year are not equidistant from the average soil temperature, both shallow temperature profiles are asymmetric around the average.
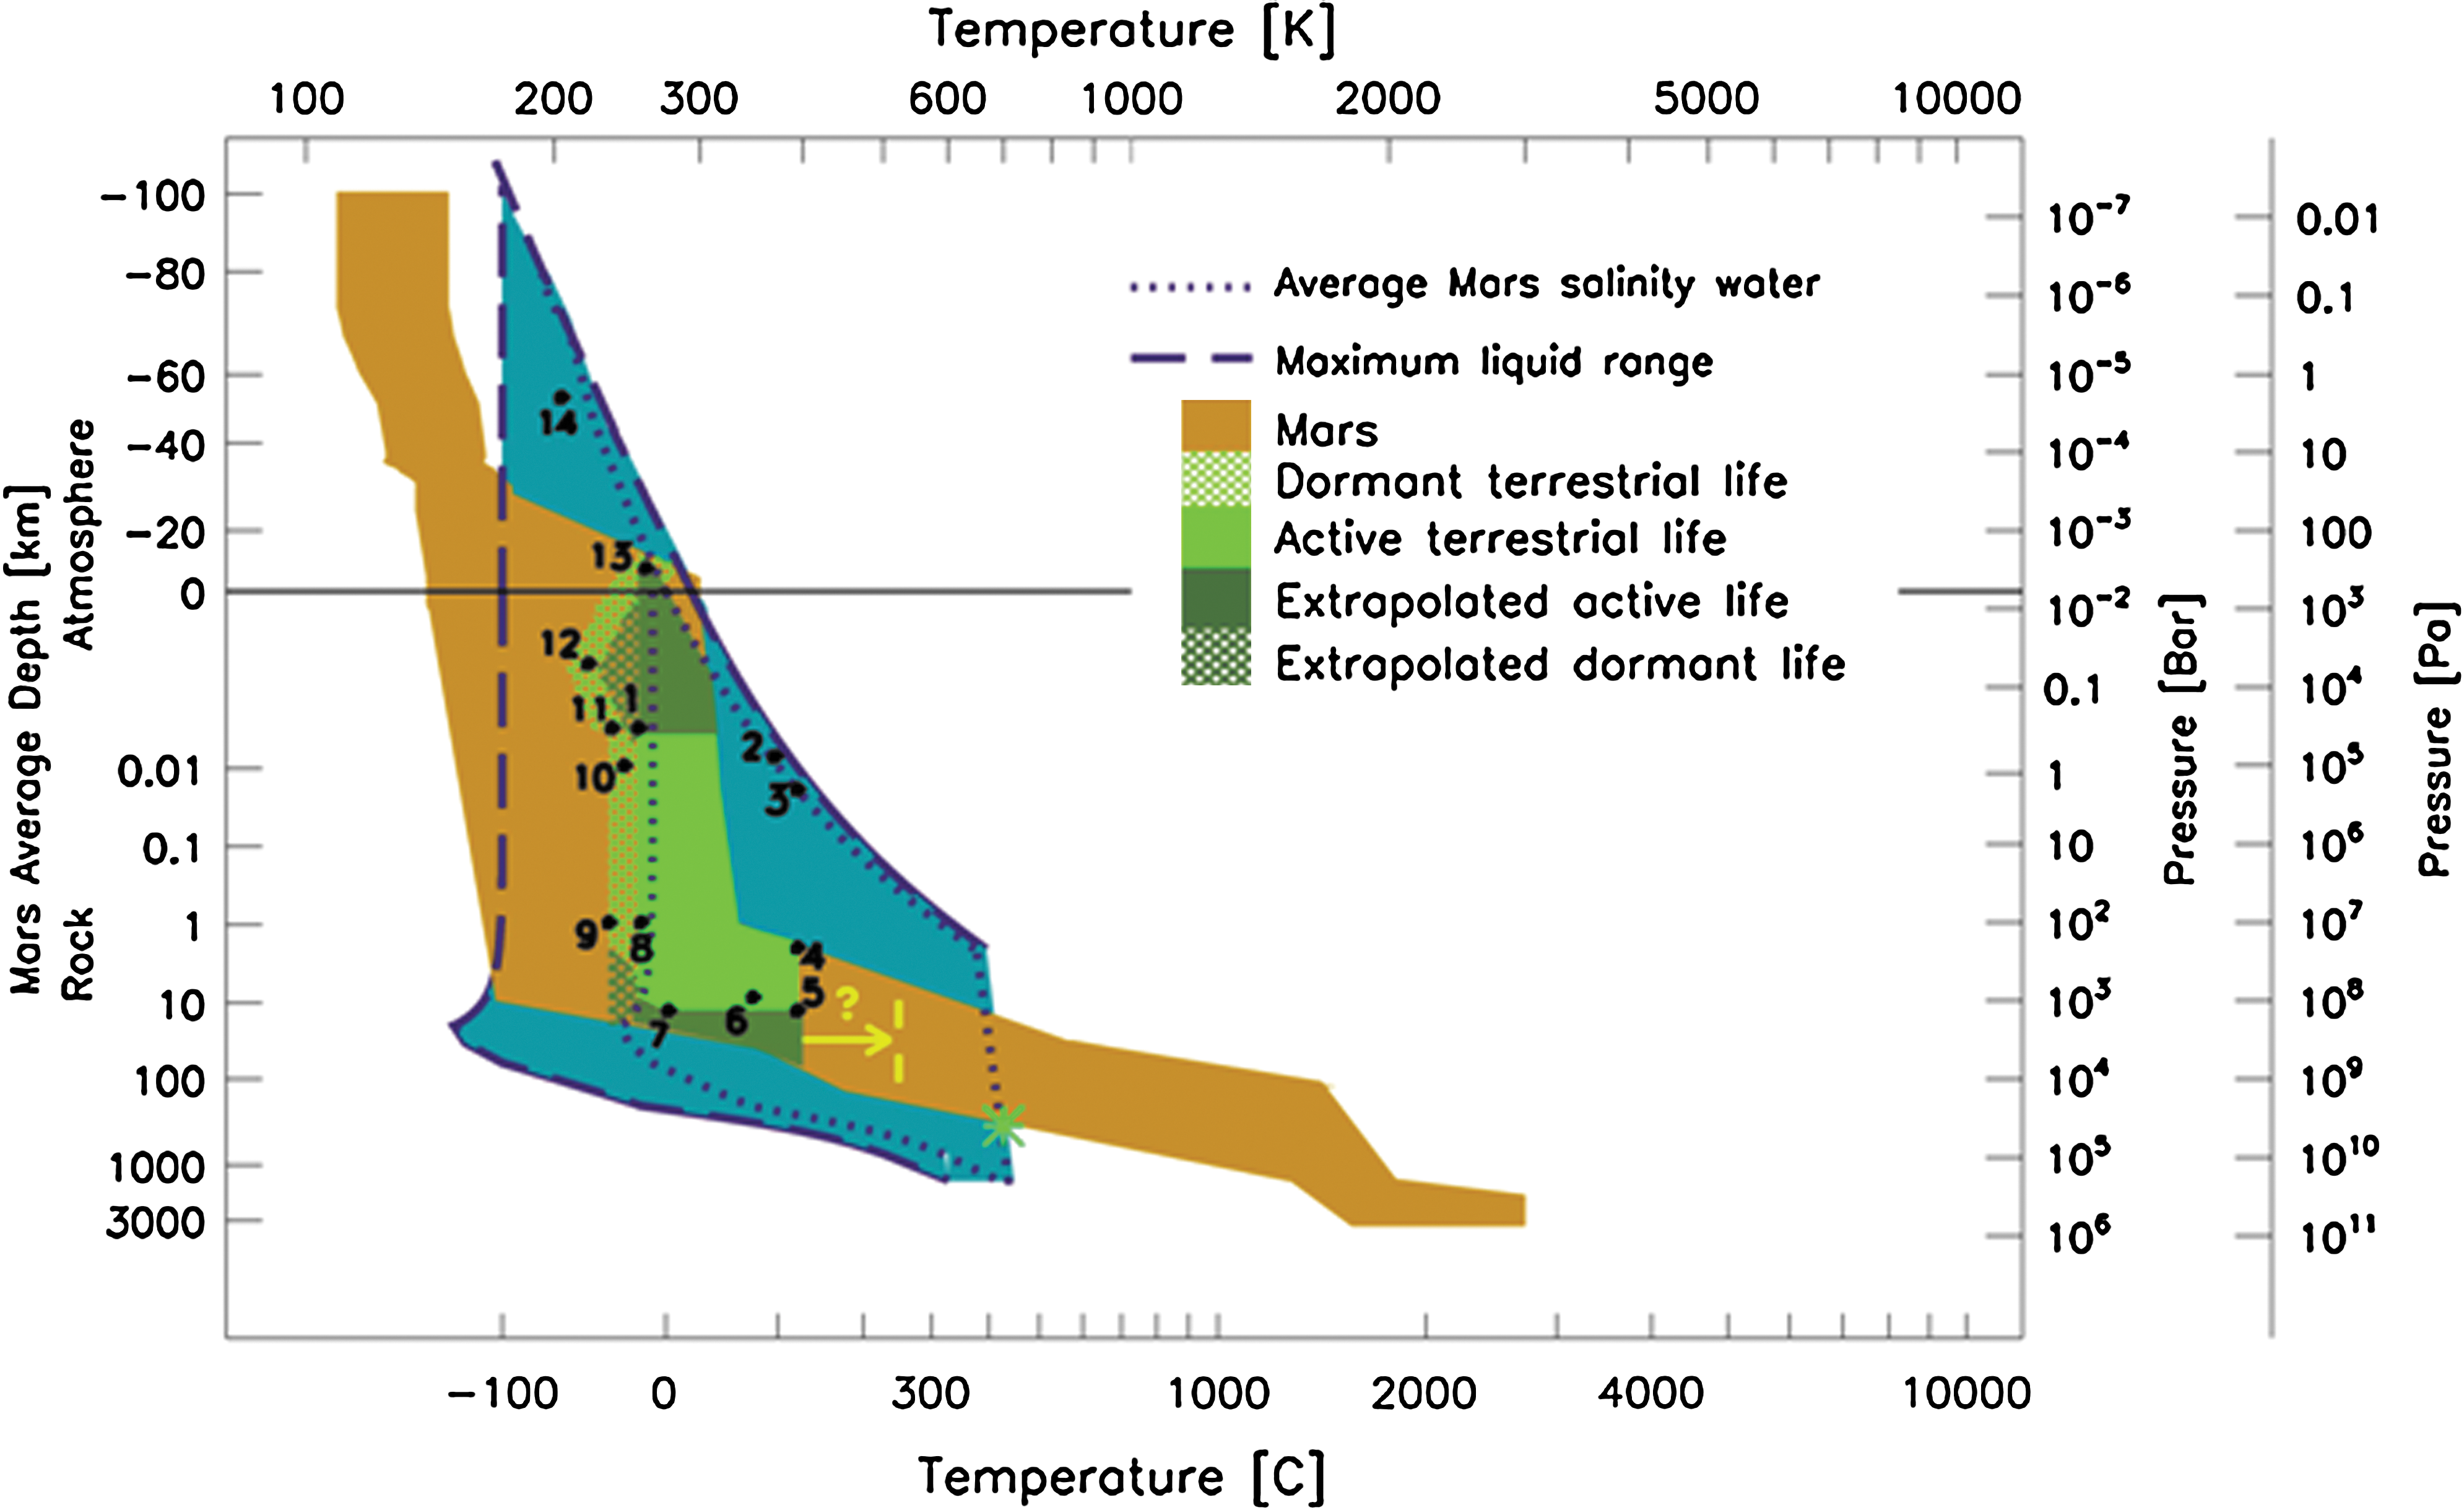
Phase model of the potential martian biosphere. For clarity, only the overlap of the light green “Active life” region from Fig. 2 with actual martian environments is shown. This light green region extends from a few meters to ∼10 km depth in the warmest subsurface regions of Mars. We assume T max=122°C is the maximum temperature compatible with life. Since apparent pressure constraints on terrestrial life are probably not fundamental, we have extrapolated the “Active life” region to higher and lower pressures (dark green). This widens the potential biosphere of Mars to the warmest briny water in the near subsurface and to a depth of ∼36 km. Numbers 1–8 in Fig. 3 circumscribe our estimate of the region occupied by active terrestrial life and are described in Table B1 in Appendix B (reproduced from Table 3 in Jones and Lineweaver, 2010). Some warm, ∼1 bar terrestrial environments do not exist in martian phase space, such as numbers 2–3. Numbers 9–14 and the light green area represent our estimate of the region occupied by dormant terrestrial life and are described in Table B2 (reproduced from Table 4 in Jones and Lineweaver, 2010). The question mark and the yellow arrow pointing from the current upper temperature limit of life (T life<122°C) to the vertical dashed yellow line at T=250°C represent the additional phase space of the biosphere if terrestrial life can extend to T=250°C.
From Fig. 1, the maximum possible depth of liquid water on Mars (at temperatures of ∼427°C) is ∼310 km, as it is the highest-pressure environment in the martian P-T space along the critical water line. The maximal possible extent of liquid water on Mars—from the surface to ∼310 km depth—indicates that, at most, ∼25% of the volume of Mars could support liquid water.
Comparing the martian phase space with that of active (Figs. 2 and 3) and dormant (Fig. 3) life shows extensive overlap. The maximum depth of the potential biosphere is determined by the depth at which temperatures exceed 122°C within the phase space of “average Mars salinity water.” From the mean geotherm in Fig. 1, temperatures of 122°C occur at a mean depth of ∼36 km (middle red triangle in Fig. 1). From the height of the shaded region of the martian phase space around this mean geotherm, temperatures of 122°C may occur as shallow as ∼6 km and as deep as ∼50 km (upper and lower red triangles in Fig. 1). This range of ∼6–50 km will be constrained as the deep geothermal gradients in Mars become known. Taking a mean depth of ∼36 km for the maximum extent of the potential biosphere of Mars, the potential biosphere could then occupy a shell of ∼3.2% of the volume of Mars. Considering that liquid water on Mars can extend to, at most, ∼310 km deep (Fig. 1), the potential biosphere corresponds to ∼31% of the volume of Mars with liquid water that may support life. In other words, at least ∼69% of the volume of Mars where liquid water could exist cannot support life, given our current best geothermal models. If life can survive temperatures of 250°C (e.g., in terrestrial hydrothermal vents, Martin et al., 2008), then the martian biosphere could extend to ∼61 km from the average geotherm in Fig. 1. At a depth of ∼7 km, the average Mars geotherm in Fig. 1 reaches the minimum temperature of active terrestrial life of −20°C. If water ice is present at these depths and there is sufficient pore space, liquid water can be expected as thin films or brine lenses.
Figure 4 presents an estimate for the annual range in shallow subsurface temperatures in a range of materials on present-day Mars. The potential biosphere of Mars (all the green shading in Fig. 3) extends from the surface in locations such as Hellas, Argyre, and absolute latitudes <30° where the partial pressures and temperatures allow water to be a liquid for several days during a martian year (Haberle et al., 2001), which makes the shallow soil potentially habitable (Wang et al., 2010). Figure 4 shows that the subsurface temperatures at equatorial latitudes are unlikely to become warm enough for life shallower than ∼5 m depth. At depths >5 m, the temperature may be >− 20°C in fines and dust. Generally, for liquid water to occur at these shallow depths it will be either a thin film coating grains or an extremely briny liquid within the pore space (e.g., liquid with a freezing temperature of −40°C could occur in the top 50 cm of coarse fines). The theoretical presence of liquid water in the “icy soil” of Fig. 4 on a diurnal and seasonal timeframe is supported by modeling results of Möhlmann (2010b).

Estimated maximum range in subsurface temperatures during a martian year at ∼30° absolute latitude. The freezing temperatures of average Mars salinity water (at −10°C) and maximum liquid range (at −100°C) are shown. The thermal skin depth (depth at which temperature fluctuations drop to 1/e of their surface value) is shown in brackets for each material. Below this depth, the geothermal gradient dominates subsurface temperatures and is determined by the ratio of the heat flow to the thermal conductivity of the material. Fines and duricrust have low thermal conductivities and so have large temperature gradients. Details are given in Appendix C.
3. Discussion
Studies of terrestrial organisms have shown that some psychrophiles show high survival rates in environments analogous to the martian surface and shallow subsurface. Studies of methanogens from Siberian permafrost in simulated pressure, temperature, atmospheric composition, and water vapor conditions of the martian surface in the midlatitudes found a 90% survival rate (Morozov et al., 2007). The methanogens utilized liquid water in the soil from adsorbed water vapor with a variable activity between 0.1 and 0.9. This study shows that the adaptations of microbes to survive in permafrost are well suited to the large diurnal variations in temperatures and water activity consistent with the shallow martian subsurface.
Figure 3 shows that there are environments in the subsurface of Mars that have pressure and temperature conditions that are hospitable to terrestrial life. There are also environments that may be hospitable to terrestrial life if we extrapolate to pressures outside the range where active life has been found in terrestrial environments, but remain within the range of Mars salinity water and temperatures between −20°C and 122°C (dark green regions).
3.1. Liquid water phase model
Figures 2 and 3 reveal that the potential martian biosphere (P-T conditions that allow for liquid water and are within both the phase space of active terrestrial life and the P-T conditions of Mars) may potentially be encountered at 5 m beneath the martian subsurface in equatorial latitudes (see Fig. 4). If liquid water is present over this depth range, it may be exposed to the atmospheric pressure, which would cause it to vaporize quickly. The shallow subsurface pressure gradient on Mars varies spatially due to variations in both overburden pressure and soil closure. Terrestrial soil can be permeable to the atmosphere for tens of centimeters before a sealing agent (e.g., salt) or an impermeable strata is encountered (e.g., Heard et al., 1988). On Mars, the situation may be similar. Freezing conditions can also cement soil together, and the abundance of very fine-grained particulates on Mars (dust) can effectively fill the pore spaces in the regolith (Hudson and Aharonson, 2008). It is, however, possible that the subsurface is permeable to the atmosphere through the top ∼10 m in regolith and rock. In this situation, any liquid water in the top ∼10 m would not be stable and would be lost to the atmosphere, with the rate of vaporization depending on the relative humidity (Sears and Moore, 2005) and water activity (Altheide et al., 2009).
At temperatures below 0°C, liquid water can exist as either a thin film or a brine with a freezing point <0°C. Including salts to estimate “average Mars salinity water” expands the regions where liquid water can occur. Modeling by Mellon and Phillips (2001) showed that a concentration of 15–40% of salts (sulfates, chlorides, bromides, carbonates, and nitrates) is sufficient to allow the melting of ground ice (or to maintain liquid water) in the top few meters of soil. Furthermore, Hecht (2002) concluded that it is possible for pure liquid water to form from ice-melt in shallow Sun-facing slopes at absolute latitudes ≥60°, in environments similar to the alcove bases of many martian gullies (Heldmann and Mellon, 2004; Heldmann et al., 2007). These results are similar to models by Marquez et al. (2005) and Christensen (2003), which showed that icy materials apparently connected with some gullies may generate shallow liquid water from solar heating within the top ∼20 cm of the subsurface. Deeper liquid water, >200 m below the martian surface, may be stable beneath dry, unconsolidated regolith with a low conductivity and a geothermal heat flux of 30 mW/m2 (Mellon and Phillips, 2001). This depth is consistent with the global average depth of the alcove bases of martian gullies. Gully alcove bases, indicative of the depth of the source fluid, vary between the surface to 2 km beneath the upper land surface at absolute latitudes ≥30° (Heldmann and Mellon, 2004; Heldmann et al., 2007).
The activity of subzero liquid water may be an important factor in whether it can be utilized by biology. The activity is defined as the ratio of the vapor pressure over supercooled liquid water (Koop, 2004) to the vapor pressure over ice (Schulze-Makuch and Irwin, 2008). The activity of supercooled liquid water is 0.82 at −20°C, 0.67 at −40°C, and 0.6 at −50°C (see Table 5 in Fennema, 1996, and references therein). In the presence of an ice phase (i.e., at temperatures below 0°C), the activity becomes independent of solutes and only depends on temperature (Koop et al., 2000). Möhlmann (2005) showed that a w of a thin film drops below 0.6 when the film is less than 3 water molecules thick, which occurs at temperatures less than ∼−20°C (Anderson and Tice, 1972; Jakosky et al., 2003). The decrease of activity of the film with further decreasing temperatures is not well known. A martian brine may have a freezing point anywhere between −10°C to −60°C, depending on which sulfate and chloride salts are present (Jagoutz, 2006; Chevrier and Altheide, 2008; Tosca et al., 2008; Chevrier et al., 2009; Marion et al., 2009) and on their relative ratios in solution. The water activity of brines decreases sharply with decreasing temperatures below zero (Morillon et al., 1999); however, the analytical relationship for each salt is not known. Magnesium and calcium chloride and magnesium sulfate have activity <0.35 at subzero temperatures (Table 1 in Jones and Lineweaver, 2011, and references therein), so they are not good candidates to support life. Salts such as magnesium nitrate and sodium bromide may also be able to support terrestrial life at temperatures as low as −30°C as the a w of the solution remains above 0.6; however, these salts may not be present on Mars (Jones and Lineweaver, 2011).
3.2. Pore space
Despite subsurface P-T conditions that allow water to be liquid, the existence of liquid water and life will depend on the availability of pore space. The maximum porosity at a given depth decreases with increasing depth as pore space becomes more restricted (Athy, 1930). Life may have a minimum pore space requirement; however, it is likely that the connectedness of pore space, which governs the flow of fluid, is more fundamental. On Mars, a minimum threshold for pore space would be achieved at a greater depth than on Earth given the lower overburden pressure (Mars has ∼1/3 of Earth's surface gravity). Pore space deforms at high temperatures of ∼400°C (Hyndman and Shearer, 1989, and references therein); hence, rocks that have experienced depths of ∼200 km on Mars would be expected to have no pore space (however, overburden pressure in combination with the low yield strength of rocks due to high temperature may effectively close pore space before these temperatures are reached). The closure depth of pore space for any particular rock type is poorly known; however, pore space in martian plutonic rocks would be expected to fall below 1% volume at depths greater than 40 km (less deep for basalts), which corresponds to ∼350 MPa (Abdulagatov et al., 2006). Appendix D provides a more detailed discussion of the dependence of pore space on depth.
The flow of fluid through material is controlled by its permeability—determined by the connectedness of the pore spaces and their size. Fluid can flow more easily through a material with large pores and good connectivity and also when fractures are present (Lee and Farmer, 1990; Wang et al., 2009). Permeability depends strongly on grain size, as coarse-grained rocks (e.g., sandstones) have larger pores and higher permeability (Hyne, 2001). Permeability is an important consideration for the subsurface, as it controls the flow of water, carbon dioxide, and nutrients (Gold, 1992; Pedersen, 1993). Depth is the strongest control on subsurface permeability; however, permeability strongly decreases at the brittle-ductile transition (Ingebritsen and Manning, 1999; ∼10–15 km depth on Earth) due to the decreased fracturing and porosity of the rocks at this depth. Although the permeability-depth variation on Mars is not known, it is likely that the martian subsurface (whether basaltic, plutonic, or ice-rich) is permeable down to 1 km depth. Below that, permeability may extend to a depth of ∼85 km, considering only compaction effects. The depth of the brittle-ductile transition, however, will strongly affect the permeability profile, and its depth will vary with rock composition and ice content and is not well known.
3.3. Potential biosphere phase model
Jones and Lineweaver (2010) quantified terrestrial liquid water environments that do not currently support life. One such environment was cold liquid water at temperatures below −20°C (the minimum temperature for active life—Junge et al., 2004) where liquid water exists as a brine or thin film. If the low activity limit of 0.6 for life is real, then terrestrial-like life on Mars may be restricted to liquid water environments above ∼−20°C. This estimate can be improved when the subzero activities of the salts mentioned above are better constrained. Temporary access to water at a tolerable low activity level may, however, be sufficient for life to thrive on Mars.
Although liquid water is known to be present at extremely low temperatures in soil, the thickness of the thin films present may also be a limiting factor for biology. The mass of unfrozen water in terrestrial permafrost below −20°C is 1% by weight (Rivkina et al., 2000). In these soils, bacterial cells are covered by thin films of water that allow for nutrients and waste exchange through diffusion in the films. This process, however, is limited by the thickness of the films, which depends on temperature (Rivkina et al., 2000; Jakosky et al., 2003). Rivkina et al. (2000) hypothesized that, as temperature and the thickness of the films decrease the diffusion, gradients will slow, and eventually the movement of nutrients and waste materials will cease. However, the temperature at which this will prevent active growth and metabolism is not known.
Even when water activity is not a limit, only extremely cold-tolerant organisms will be able to metabolize and grow at temperatures <−20°C, and chemical reactions will be slow. Experiments by Mazur (1980) on yeast identified that most cells remain unfrozen at −15°C, as the cell membrane is able to block the passage of ice crystals and of supercooled water in the cell. Intracellular fluid moves through the cell membrane from high- to low-activity water. This causes the remaining fluid in the cell to have a higher ion concentration, which further lowers its activity (Gunde-Cimerman et al., 2003). This process, caused by a water activity gradient, can cause irrevocable damage to the cell if the fluid freezes. The lowest activity in which a cell can survive the freezing process, however, is not known. Extracellular liquid water is, however, necessary for cell function and growth (Mazur, 1980), although there is increasing interest in determining whether water vapor can suffice given the daily variation and temporary saturation of water vapor on Mars (e.g., Möhlmann, 2005). Some terrestrial lichens may be able to survive on water vapor under martian conditions (de Vera et al., 2010) in a manner similar to that demonstrated by Atacama Desert cyanobacteria at high humidity (Wierzchos et al., 2011). Minerals with hygroscopic properties (able to attract moisture from the atmosphere) such as perchlorates (found by the Phoenix lander on Mars and in the Atacama Desert; Schulze-Makuch and Houtkooper, 2010) and hydrogen peroxide (Houtkooper and Schulze-Makuch, 2007) could be utilized by organisms to harvest water vapor through the process of deliquescence (observed in cyanobacteria; Davila et al., 2008).
Ultimately, life may be fundamentally limited by water activity (Gunde-Cimerman et al., 2003)—due to high concentrations of solutes and subzero temperatures. Psychrophiles may be able to remain active at temperatures down to −50°C if they utilize metastable supercooled liquid water; however, they will face the additional challenges of low-activity intracellular fluid and slow diffusion gradients.
Terrestrial psychrophiles and halobacteria that grow in low temperature, high salinity, and desiccated environments (e.g., permafrost and ice) may be well suited to the shallow martian subsurface (∼10s of centimeters) if liquid water is present (Horneck, 2000, 2008; Landis, 2001; Mancinelli et al., 2004; Pavlov et al., 2010). Deep subsurface anaerobic life (e.g., methanogens) beneath the martian cryosphere (∼kilometers depth) is also possible if liquid water and an energy source (e.g., the radiolysis of water; Chivian et al., 2008) are available (Boston et al., 1992; Szewzyk and Szewzyk, 1994). At temperatures above −20°C, films of liquid water adsorbed on grains in the soil may be several micrometers thick and have an activity above the currently assumed minimum of 0.6 for life (Jakosky et al., 2003; Möhlmann, 2004, 2008). Such an environment may be habitable to lithoautotrophic life, which can utilize thin films (Jepsen et al., 2007). Also subsurface brines may provide suitable habitats for organisms such as the active Cytophaga-Flavobacteria found 2.75 km deep within an Arctic ice core at −20°C (Junge et al., 2004).
The potential martian biosphere also identifies planetary protection regions (Chyba et al., 2006). If environments within the potential martian biosphere were contaminated by life on Earth, the conditions are hospitable to the survival and potential growth of terrestrial organisms, where liquid water with an activity above 0.6 is present. Environments identified as lying within the potential martian biosphere should be added to the list of currently designated special regions (including gullies, pasted terrain, etc.; Beaty et al., 2006) to prevent forward contamination. The identification of near-subsurface environments on Mars that have the potential for liquid water is relevant to NASA's Mars Science Laboratory (MSL) mission launched in November 26, 2011 (McCleese et al., 2003). Through a neutron spectrometer, MSL will have the capability to measure the concentration of adsorbed water (H2O) and hydrated minerals (OH) to ∼0.3 % wt accuracy in the top ∼1 m of martian soil (Litvak et al., 2008). The landing site at Gale Crater is located at low elevation and absolute latitude <27° (Golombek et al., 2011). Our results on the depth of the potential martian biosphere in absolute latitudes ≤30° support the astrobiological significance of the MSL landing site.
4. Conclusions
Given our current understanding of terrestrial life, the maximum possible depth of the martian biosphere is the 122°C isotherm. We have shown that there are subsurface environments on Mars to a depth of
Appendix A
The subsurface pressure and temperature gradient of any planet are proportional to each other and are related through density, conductivity, and heat production. This relationship determines the P-T space occupied by Mars.
A.1. Core
Mars' core extends from a depth of 1630–3390 km. The core size, composition, and temperature profile are estimated from Mars' polar moment of inertia (Folkner et al., 1997) measured from orbit. The moment of inertia indicates the distribution of mass within the planet (Barlow, 2008) and so can constrain the plausible combinations of core sizes and masses/densities. At the center, the core pressure in our model is 4.11×10¹⁰ Pa (Sohl and Spohn, 1997). Estimates for this pressure range predominantly between 3.8×10¹⁰ and 5×10¹⁰ Pa (with a low-pressure estimate of 2.4×10¹⁰ Pa by Fei and Bertka, 2005), which makes our choice a reasonable representation. Variation in estimates for the central core pressure is due to the poor constraints on the composition of the inner core, which results in significantly different geotherms (Gudkova and Zharkov, 2004). Core composition is estimated predominantly from the isotopic composition of SNC meteorites (Lodders and Fegley, 1998). Central core temperatures are modeled to lie between 1950 and 3000 K; however, recent modeling favors the cooler end of this range around 2000 K (Fei and Bertka, 2005; Connolly and Khan, 2006). Hence, we have used this value in our model. The estimates for Mars' core temperature are significantly less than that for Earth (5700 K), which highlights the advanced stage of cooling of Mars' core and the lower heat flow across the planet's surface. The central core and core-mantle boundary in Fig 1. have horizontal error bars describing the uncertainty in their temperatures.
For the core-mantle boundary (CMB), we have used a representative pressure of 2.3×10¹⁰ Pa (Sohl and Spohn, 1997). The model-dependent temperature estimates for the CMB range between 1650 and 1900 K, and we have adopted a representative CMB temperature of 1700 K, as this is favored by more recent “cool” models (Fei and Bertka, 2005; Verhoeven et al., 2005; Connolly and Khan, 2006). On Earth, the mantle-to-core density transition occurs within a thin layer characterized by a steeper geothermal gradient than either mantle or core. The same may be true of Mars. The phase of the present-day martian core is dependent on its exact mineralogy; however, a liquid core is consistent with both Mars' moment of inertia (Barlow, 2008) and with data on mineral transition experiments for the estimated core composition (Bertka and Fei, 1997). However, Mars exhibits only a very weak magnetic field, which indicates that it does not have an active dynamo; hence, its inner core must have either completely solidified or, if liquid, be in very slow motion (Longhi et al., 1992).
Between our chosen boundary values, the average geotherm within Mars' core is 0.74 K/km. This is comparable to the models for Earth's core geotherm (0.8 K/km). The temperatures and pressures along our average geotherm imply a liquid core for a model composition of iron and sulfur, with 14.2 % wt S (Fei and Bertka, 2005; the sulfur content can be varied while still remaining above the melting line). A Fe-Ni-S core would also be molten as the modeled geotherm is above the minimum eutectic.
A.2. Mantle
Mars' mantle extends from an average of ∼1630 km below the surface to the base of the martian crust. The upper boundary beneath the crust is poorly constrained by gravity and topography data, which indicate that the range of crustal thickness is ∼35–100 km (see discussion in Crust). We have used a representative depth of the martian Moho of 50 km under the surface (a reasonable average from Neumann et al., 2004; Wieczorek and Zuber, 2004). Using 2900 kg/m3 for the crustal density (Zuber, 2001), low gravity of 3.7 m/s2, and an average crustal geotherm of ∼4.5 K/km (McKenzie et al., 2002; Verhoeven et al., 2005) gives a pressure and temperature of 5.4×10⁸ Pa and 450 K, respectively, at the depth of the Moho. Some older estimates (including “hot models”) predict the crust-mantle boundary temperature between 1300 and 1700 K (Sohl and Spohn, 1997; Lodders and Fegley, 1998). These models, however, assume a thick 200 km crust, which is inconsistent with more recent high-resolution topography and gravity field data from Mars Global Surveyor. Given our CMB values, our chosen average Moho leads to a mantle geotherm of 0.85 K/km (Earth model mantle gradient 0.7 K/km—Jones and Lineweaver, 2010).
A.3. Crust
There has never been a direct estimate of the crustal heat flow of Mars; however, scaling of terrestrial values can be carried out under the assumption that smaller planetary masses have lower core and mantle temperatures and lower surface heat flow (Papuc and Davies, 2008). The net heat flow on Mars combines contributions from the secular cooling of the core and from the decay of radiogenic elements in the planet's crust and mantle (Hahn and McLennan, 2008). The present-day heat flow from radioactivity is estimated to be around 5 mW/m2 (Hahn and McLennan, 2008), with the estimates for the total heat flow ranging from 15 to 55 mW/m2 (Toksöz and Hsui, 1978; Solomon and Head, 1990; Hoffman, 2000; Andersen et al., 2002; Urquhart and Gulick, 2002).
Additional variation in the martian geotherm arises (as it does on Earth) due to the variation in thermal conductivity of different crustal materials on Mars (e.g., water and CO2 ice have a significantly lower conductivity than rock: James, 1968; Clifford, 1987; Mellon, 1996). Taking a range of 0.001–4.5 W/m/K for martian materials, combined with the variation in heat flow estimates, provides a range of geothermal gradients from 4×10⁴ to 5.5×10⁴ K/km. The extremely high geotherms correspond to layers of low-conductivity materials (sand and dust), which would only constitute a very thin layer on the martian surface (dust typically<5 m thick—Christensen, 1986; sand in martian dunes can form deposits tens of meters high—Bourke et al., 2006). For reference, terrestrial geotherms in rock (in the oceanic and continental crust) vary predominantly between 5 and 70 K/km. The variation in the crustal geotherm in rocks and ice leads to a range of Moho temperatures for a given crustal depth, as indicated by points E, F, and G in Fig. 1.
Present estimates of Mars' crustal thickness are based on indirect geophysical studies involving local relationships between gravity, topography, and geochemistry (Sohl et al., 2005). Estimates of crustal thickness range from 30 to 100 km (Zuber, 2001; Turcotte et al., 2002) with a global average of 50 km (Neumann et al., 2004; Wieczorek and Zuber, 2004). This is a considerably smaller range than earlier estimates (predating Mars Global Surveyor's revised topography and gravity results), which placed the thickest regions of the crust at 200 km with a typical value of 100 km (Sohl and Spohn, 1997; Zuber et al., 2000). Estimates of pressure within the crust (from mass overburden) assume an average crustal density within the range of 2700 kg/m3 (representative of andesitic-basaltic composition from Pathfinder measurements of soil-free rocks) to 3100 kg/m3 (from porous basaltic shergottites interpreted as martian crust samples; Britt and Consolmagno, 2003). Our pressure values for the base of the crust are based on a density of 2900 kg/m3 (McGovern et al., 2002; Turcotte et al., 2002) for crust <50 km thick and 3100 kg/m3 for up to 100 km thick crust (McGovern et al., 2002), leading to a range of (0.38–1.2)×109 Pa at the base of the crust. The Moho has both a vertical error bar describing the uncertainty in depth and a slanted error bar describing the uncertainty in temperature. The temperature error bar is slanted as a shallow Moho will generally have a lower temperature than a deep Moho.
The error bars at the Moho in Fig. 1 indicate that our modeled maximum crustal thickness (maximum Moho depth) is 100 km (points F and G; Sohl et al., 2005), with the maximum crustal temperature between 377°C (point F) and 650°C (point G). This range is consistent with a crustal geothermal gradient of 4–7 K/km as estimated for present-day Mars (McGovern et al., 2002, 2004) and giving the estimated maximum temperature of the martian Moho as 650°C (Zuber et al., 2000).
The martian heat flow dominates the subsurface geothermal gradient below ∼20 m depth (Pollack and Huang, 2000). Above this depth the temperature profile is dominated by solar heating, shown in Fig. 4. Heat flux can be converted to a geothermal gradient by using thermal conductivity (Stüwe, 2007; p 93) through
where Q is heat flow (W/m2), k is thermal conductivity (W/m/K) and dT/dr is the geotherm (K/km). Considering only the downward conduction of solar heat, the temperature at depth y beneath the surface is
where T
o is the surface temperature. We take the average surface temperature on Mars to be T
o=−63°C. As we are interested in the average depths to the extreme thermal limits on terrestrial life, we can use Eqs. 1 and 2 to model the depth at which T
max=122°C and T
min=−20°C are obtained:
which yields
With the average crustal geotherm on Mars dT/dr ∼5 K/km (see Table A1), we obtain y max=37 km and y min=9 km. These values represent an estimate of the average depths to the isothermal boundaries of subsurface life on Mars.
Appendix B
(See Table B1.)
Temperature and pressure from Hewitt and Jackson (2003).
Appendix C
Figure 4 presents the annual variation in shallow subsurface geotherms established by solar heating on present-day Mars, calculated from a one-dimensional heat-conduction model (Turcotte and Schubert, 1982, p 134). It is assumed that there is no heat source in the soil, which is most likely valid in the small depth range over which the model is applied. The downward conduction of thermal waves is dependent on the thermal diffusivity (m2/s) of the medium, given by
We follow the notation of Turcotte and Schubert (1982, chapter 4). Surface heat variations are modeled as sinusoidal curves, given by
where T
s is the temperature on the surface; T
o is the average surface temperature, ΔT is the amplitude of variation around T
o (e.g., ΔT=40 K in Fig. 4) and ω=2πf where f is the frequency (i.e., daily or yearly). Depth- and time-dependent subsurface temperatures are then given by
where y=depth beneath the surface; the skin depth dω=
(2κ/ω)1/2 where the thermal diffusivity κ=k/ρC, where ρ is density and C is specific heat capacity. Since the maximum and minimum of the cos term are +1 and −1, the envelope of the maximum and minimum temperatures around the average temperature, T
o+y dT/dr, at depth y are given by
and are plotted in Fig. 4.
The thermal diffusivities and skin depths used for each material in Fig. 4 are given in Table C1. This model is oversimplified, as the range of temperatures experienced by a material on the surface is dependent on its albedo. Hence, the surface temperature range experienced by dust and rock, for example, would not be the same (although it is shown as the same in Fig. 4). Mellon et al. (2000) showed that a difference of 0.2 in albedo (between 0.15 and 0.35) can result in a difference of ∼20 degrees in the maximum temperature experienced by the material. Hence, the surface temperature variation of each material should be scaled by its albedo to make our temperature model more accurate. In order of decreasing albedo on Mars, we expect dust>fines, H2O ice>icy soil>rock.
Appendix D
Athy (1930) described terrestrial pore space (porosity) as exponentially decreasing with depth due to increasing overburden pressure. Percentage porosity at a depth z (m) is given by
Permeability is related to porosity in a complex way that is not well known (Rezaee et al., 2006)—permeability decreases with increasing depth in porous media, and the relationship between permeability and porosity is modeled to be a power law (David et al., 1994). However, permeability can also vary widely at a given depth due to mineralogy, fracturing, grain cementation, and so on. (Wang et al., 2009). There is no general analytic function to describe the variation of permeability with depth. Permeability is highly anisotropic and heterogeneous (Saar and Magna, 2004), and in the terrestrial crust it can vary by 105 in a particular soil unit. The difference between a low-permeability material such as crystalline rock and a high-permeability material such as well-sorted gravels can be 16 orders of magnitude (Ingebritsen and Manning, 1999). Depth is the strongest control on subsurface permeability; however, it strongly decreases at the brittle-ductile transition (Ingebritsen and Manning, 1999; ∼10–15 km depth on Earth) due to the decreased fracturing and porosity of the rocks at this depth. Below the brittle-ductile transition, permeability is not a strong function of depth. A medium is considered “impermeable” if its permeability is<10−19 m2. This permeability value indicates that it would take 107 s (∼116 days) for 1 cm3 of gas or liquid (with a viscosity of 1 mPa s, consistent with liquid water at 20°C) to flow through a section of rock 1 cm thick with a cross section of 1 cm2, when the difference between the pressures on the two sides of the section is 1 atm (Wyckoff et al., 1933).
The permeability of the crystalline granitic rock of the continental crust is modeled with a power law function of k=10−14 z −3.2 (k in m2, z in km, z≤35; Manning and Ingebritsen, 1999). Saar and Magna (2004) corrected this function by adding an exponential decay function with a half-life of 170 m to better fit permeability shallower than 2 km (which was overestimated by the power law function). Below the brittle-ductile transition (mean depth of ∼12 km on Earth), the permeability can be equally well modeled by a constant of 10−18.5 m2, as it is effectively independent of depth (Manning and Ingebritsen, 1999). Permeability in crystalline rocks is generally through small numbers of interconnected fractures that provide fluid pathways (Huenges et al., 1997). Despite this analytic function for the permeability of the continential crust, measured values and the peremability-depth relationship can be significantly different. A borehole of the German Continental Deep Drilling Program at 9101 m depth encountered fluid-conducting rock with a permeability of ∼10−16 m2 at 103 MPa (Huenges et al., 1997), which is in good agreement with the modeled permeability at this depth of ∼10−17 m2. However, no clear depth dependence of permeability was observed in the granitic rocks in the borehole. From the above permeability function, the continental crust becomes impermeable at ∼35 km; however, it is essentially impermeable (modeled permeability of 10−18.5 m2) at the brittle-ductile transition at a mean depth of ∼12 km.
The permeability versus depth function in the oceanic crust (basalt) is modeled from the Costa Rica borehole 504B to be exponential k=0.11e −z/50×10−12 with a half-life of 34 m (k in m2, z in m; Anderson et al., 1985). This permeability is due to both connected pore space and fracture porosity. Anderson et al. (1985) showed that maximum permeability at a given depth (large uncertainties in measurement) roughly linearly decreased with increasing depth. It is not known whether the permeability versus depth function is representative of either oceanic crust in other locations or of pillow basalt layers in general. If the function can be extrapolated to greater depths, then the oceanic crust in the region of the borehole becomes impermeable at ∼700 m depth (Anderson et al., 1985).
Footnotes
Acknowledgments
We thank Chris McKay, Graziella Caprarelli, and other colleagues for useful discussions. We also thank two anonymous reviewers for helping us improve the clarity of this article. Eriita Jones acknowledges funding from an Australian Postgraduate Award and the Research School of Astronomy and Astrophysics (ANU).
Author Disclosure Statement
No competing financial interests exist for either Eriita G. Jones or Charles H. Lineweaver, or Jonathan D. Clarke.
Abbreviations
CMB, core-mantle boundary; MSL, Mars Science Laboratory; P-T, pressure-temperature.