




Abstract
Primitive photosynthetic microorganisms, either dormant or dead, may remain today on the martian surface, akin to terrestrial cyanobacteria surviving endolithically in martian analog sites on Earth such as the Antarctic Dry Valleys and the Atacama Desert. Potential markers of martian photoautotrophs include the red edge of chlorophyll reflectance spectra or fluorescence emission from systems of light-harvesting pigments. Such biosignatures, however, would be modified and degraded by long-term exposure to ionizing radiation from the unshielded cosmic ray flux onto the martian surface. In this initial study into this issue, three analytical techniques—absorbance, reflectance, and fluorescence spectroscopy—were employed to determine the progression of the radiolytic destruction of cyanobacteria. The pattern of signal loss for chlorophyll reflection and fluorescence from several biomolecules is characterized and quantified after increasing exposures to ionizing gamma radiation. This allows estimation of the degradation rates of cyanobacterial biosignatures on the martian surface and the identification of promising detectable fluorescent break-down products. Key Words: Mars—Life-detection instruments—Spectroscopic biosignatures—Photosynthesis—Endoliths. Astrobiology 11, 997–1016.
1. Introduction
T
These extreme environments on Earth provide meaningful analogues of potential sheltered niches on Mars that may also harbor biotic oases. Evaporitic salt encrustations, such as those formed by the drying up of martian lakes, may preserve biosignatures of past life or even support metabolically active “endoevaporitic” organisms (Rothschild, 1990). Surface ice in the martian poles may protect microorganisms from solar UV radiation but allow transmission of sufficient longer-wavelength light to allow photosynthesis, akin to terrestrial snow algae and cyanobacteria (Rothschild, 1990; Cockell and Raven, 2004). Similarly, pores and fractures in impact-shocked rocks might provide suitable microenvironments and UV screening for phototrophic microbes (Cockell et al., 2002). Microbial communities, supported by cyanobacteria primary producers, survive cryptoendolithically in some of the driest environments on Earth by colonizing porous rocks, such as in the Antarctic Dry Valleys (Friedmann and Ocampo, 1976; Friedmann, 1982, 1986; Porazinska et al., 2004; Pointing et al., 2009) or the hyperarid core of the Atacama Desert (Warren-Rhodes et al., 2006; Wierzchos et al., 2006).
Climatic conditions on Mars would hold surface life dormant for long periods, but during episodes of high obliquity the martian climate may improve sufficiently to allow localized thawing and active metabolism (Jakosky et al., 2003). Potentially extant microbial life, including phototrophs, on Mars could therefore have persisted in protected niches on the martian surface. Even if driven to extinction, the presence of past surface life could still be detectable by remnant biomarkers. The tetrapyrrole-based porphyrin structure within chlorophyll molecules is highly fluorescent, as described in much greater detail below, as well as being distinctively biogenic and preserving well (Eckardt et al., 1991; Villanueva et al., 1994; Suo et al., 2007). This porphyrin structure, along with phycocyanin, another component of the cyanobacterial photosynthetic system, has been identified as an attractive molecular biomarker target in the search for life on Mars (Parnell et al., 2007). The fluorescence-based technique investigated here could be applied to surveying for niches of extant phototrophs, or their preserved biomolecules, in martian evaporitic deposits, ice, or cryptoendolith-hosting rocks.
1.1. Fluorescence-based detection
Absorption of light by many organic molecules is often followed by relaxation of electronic excited states via emission of fluorescence. The excitation and emission spectra are characteristic of different molecules, so fluorescence-based instrumentation can be used to both localize and identify organics. Fluorescence-based detection systems have proved themselves to be sensitive and discriminatory and have been used in terrestrial applications to assess pollution (JiJi et al., 1999; Alberts and Takács, 2004; Cory and McKnight, 2005), identify potentially pathogenic or toxic microorganisms in environmental water or food preparation (Patra and Mishra, 2001; Hua et al., 2007; Sohn et al., 2009; Ziegmann et al., 2010), and detect trace biomolecules or microbial life in glacial (Rohde and Price, 2007) and Antarctic ice (Storrie-Lombardi and Sattler, 2009), Antarctic sandstone (Nadeau et al., 2008), and the Atacama Desert (Weinstein et al., 2008).
One of the proposed techniques for surveying for evidence of organic molecules or, potentially, organisms on the surface of Mars is to utilize fluorescence (Griffiths et al., 2008; Storrie-Lombardi et al., 2008, 2009; Weinstein et al., 2008; Storrie-Lombardi and Sattler, 2009; Muller et al., 2009). Two distinct modes of mutually supportive instrumentation have been proposed for the detection of organics or remnant microorganisms on Mars: (i) devices able to rapidly survey for possible biosignatures and (ii) devices capable of scrutinizing putative targets selected by the survey equipment with a high degree of sensitivity and precision. Examples of the second include gas chromatography–mass spectroscopy (e.g., aboard Mars Science Laboratory, Mahaffy, 2008; and ExoMars, Evans-Nguyen et al., 2008; Goesmann et al., 2009) or antibody-based organic molecule detection (e.g., Life Marker Chip; Sims et al., 2005). The latter more discriminatory instrumentation is required for a confident discovery, but survey devices can offer target selection without sample contact, preparation, or destruction, and maintain functionality throughout mission lifetime without consuming irreplaceable resources such as solvents or reagents. Endogenous (intrinsic) fluorescence can be excited and detected directly for cellular small metabolites and pigments without necessitating the application of exogenous (extrinsic) fluorescent probes, such as DAPI for DNA. It is in this role as a surveying instrument for organics and organisms that excited fluorescence has been proposed for future missions exploring the surface and near subsurface (i.e., with drilling equipment, such as the ESA ExoMars rover; Vago et al., 2006). A long-wavelength UV light source (365 nm LED) is included on the Mars Science Laboratory MAHLI (Mars Hand Lens Imager) instrument (Edgett et al., 2009) and mounted on the rover's robotic arm turret. These two LEDs, which are positioned either side of the camera lens, will provide illumination for nighttime fluorescence images at a scale equivalent to the hand lens commonly employed by a field geologist.
1.2. Martian surface ionizing radiation environment
Any region of the martian surface or near subsurface we will have access to in the foreseeable future by way of robotic or even human missions will have been exposed to an ionizing radiation field for a substantial period. The martian surface, which, unlike Earth, receives negligible shielding from an atmosphere or global dipolar magnetic field, is unprotected from the flux of cosmic rays. These are composed of solar energetic particles that are transiently accelerated by flares and coronal mass ejections from the Sun, and galactic cosmic rays that are accelerated by supernovae to very high energies but with a peak flux much lower than that of solar energetic particles (Amsler et al., 2008a). When they strike shielding material, such as the terrestrial atmosphere or martian surface, these energetic particles produce extensive cascades of deeply penetrating secondary radiation (Amsler et al., 2008b). On Mars, this ionizing radiation field penetrates 2–3 m underground, which is far deeper than penetration by UV radiation, so cosmic rays represent one of the primary hazards for any putative microbiology in the martian near surface (Pavlov et al., 2002; Dartnell et al., 2007a, 2007b). Previous modeling work has determined that the averaged ionizing radiation dose rate on the martian surface from cosmic rays (both solar energetic protons and galactic cosmic rays) is around 160 mGy/year (Dartnell et al., 2007a), which is diminished beneath 1–1.5 m of rocky shielding to around 30 mGy/year (McKeever et al., 2003; Dartnell et al., 2007a, 2007b). Deeper in the martian subsurface, the radiation environment becomes dominated by radionuclide decay at around 0.4 mGy/year (below about 4.5 m depth in ice-bearing regolith; Dartnell et al., 2007a). However, the photosynthetic lifestyle of cyanobacteria, for example, requires that they reside near the surface for access to sunlight; thus on Mars, organisms such as these would be exposed to much more irradiation from cosmic rays than the radionuclide contribution.
Ionizing radiation is a major threat to the survival of microbial life, the persistence of detectable biosignatures, and the operation of spacecraft equipment and biosignature detection instrumentation (Dartnell, 2011). The longest drill proposed for an upcoming mission is the 2 m long drill on ESA's ExoMars rover (Vago et al., 2006), so unless a rover can gain access to the crater floor or ejecta blanket of a recent impact, or to deeper subsurface material recently brought to the surface (such as the putative frozen sea that is believed to have been disgorged onto the plains of Elysium only 5 million years ago; Murray et al., 2005), any martian material accessible for inspection will have been irradiated by the energetic cosmic rays for a substantial period of time. This especially affects the search for biosignatures of photosynthetic life comparable to the cyanobacteria that inhabit martian analog sites on Earth, such as those of the Antarctic Dry Valleys (Friedmann and Ocampo, 1976; Friedmann, 1982, 1986; Porazinska et al., 2004; Pointing et al., 2009) or the hyperarid core of the Atacama Desert (Warren-Rhodes et al., 2006; Wierzchos et al., 2006). As explained above, the very nature of the phototrophic lifestyle means that such organisms would necessarily be exposed on the surface.
In this initial study, we assessed the degradation of detectable cyanobacterial biosignatures, including the reflectance spectrum from photosynthetic pigments and fluorescent emission from several cellular components, after experimental exposures to high doses of ionizing radiation to simulate the effects of long periods on the martian surface.
1.3. Cyanobacteria phycobilisomes and fluorescence
Cyanobacteria are prokaryotic microorganisms that can survive autotrophically from energy generated by light-capture and oxygenic photosynthesis, in a manner similar to that of eukaryotic algae and multicellular plants. Indeed, the chloroplast organelles of eukaryotic photoautotrophs are believed to have been derived from a cyanobacterial ancestor by primary endosymbiosis (reviewed by Gould et al., 2008). Cyanobacteria improve the efficiency of their light harvesting through the use of antenna assemblages called phycobilisomes (PBS) that transfer the collected excitation energy to chlorophyll in the photosystem reaction centers (reviewed by Glazer, 1985, and MacColl, 1998). Knowing the structure of the PBS and its excitation energy transfer pathway is crucial to understanding the degradation pattern of the cyanobacterial fluorescence signature after irradiation.
The PBS are multiprotein complexes that form regular arrays on the cytosolic surface of the photosynthetic thylakoid membrane (Glazer, 1988b). They harvest light of 500–650 nm, including importantly the solar spectral range that is poorly absorbed by chlorophyll (MacColl, 1998), and in a healthy organism, they transfer this absorbed energy to chlorophyll and thus to the photosystem reaction centers to improve the efficiency of photosynthesis (Anderson and Grossman, 1990).
The component units of the PBS are phycobiliproteins, which are composed of open-chain tetrapyrrole chromophores called bilins that are covalently bound to polypeptide chains. These proteins hold the bilins in an extended state for maximal absorption in the visible spectrum (MacColl, 1998). The bilin prosthetic groups function as the visible light-harvesters of the PBS and are highly fluorescent (Glazer, 1988a). The phycobiliproteins are a major component of cyanobacterial cells and are thought to account for up to 24% of the dry weight and well over half the total soluble protein (Glazer, 1988b).
The physical structure of the PBS has been studied in different cyanobacteria by electron microscopy (Ajlani et al., 1995) and is composed of a core of cylinders surrounded by a fan of radiating rods. The specific structure of the PBS in Synechocystis sp. PCC 6803 was elucidated by Elmorjani et al. (1986), as shown in Fig. 1 in schematic form.

(
The Synechocystis PBS core is made up of three cylinders with each core cylinder composed of a stack of four discs, the major biliprotein within which is allophycocyanin (APC). Radiating out from the PBS core in a hemidiscoidal array are six rods (Glazer, 1985), which in Synechocystis are composed of only three discs of the biliprotein phycocyanin (PC; Elmorjani et al., 1986; Arteni et al., 2009). Phycocyanin is a bluish-colored chromophore, and it is for this attribute the cyanobacteria are so named (and were formerly known as blue-green algae). In other cyanobacterial species, the distal end of the PBS rods can contain discs of further biliprotein chromophores, such as phycoerythrin (PE) or phycoerythrocyanin (PEC) (Ajlani et al., 1995). These additional rod biliproteins endow some cyanobacterial species with the capability for chromatic adaptation, shifting their photosynthetic absorption spectrum to tune it to the spectral quality of the ambient light, such as at differing depths in the water column, by varying the ratio of chromophores in the PBS rods (e.g., Palenik, 2001).
The organization of the phycobiliprotein components within the PBS is always in the order of their light absorption maxima; PE (peak wavelength of absorption, λabs=∼500–550 nm) or PEC (peak λabs=570 nm) at the distal tip of the rods, PC (peak λabs=620 nm) in the middle, and APC (peak λabs=650 nm) in the core of the antenna, closest to the photosystems embedded in the thylakoid membrane. The energetic link between the PBS core and chlorophyll a (both peak λabs=680 nm) is provided by two polypeptides, aB and Lcm (both peak λabs=670 nm), which act as the terminal emitters of the PBS (Lundell et al., 1981; Glazer, 1985; MacColl, 1998).
Linker polypeptides bind the component discs to each other, attach the six radial rods to the tricylindrical core, and fix the entire PBS structure to the thylakoid membrane (Ajlani et al., 1995). These linker proteins are non-chromophoric and function to mediate assembly of the PBS and fine-tune the spectroscopic attributes of the phycobiliproteins and thus the energy transfer process (Lundell et al., 1981; Glazer, 1985; MacColl, 1998). The Lcm is the largest polypeptide in the cyanobacterial PBS and is so called as it was discovered to
Surplus energy not passed along the energy transduction pathway or lost through radiationless relaxation (such as photochemistry or conversion to heat; Clayton, 1980) is emitted as fluorescence (Glazer, 1989; Keränen et al., 1999) at wavelengths characteristic of the different photosynthetic fluorophores. Phycocyanin has a peak in fluorescence at an ex/em pairing of around 615/650 nm (Schirmer and Vincent, 1987; Glazer, 1988a), and chlorophyll a in cyanobacteria has absorption peaks at around 440 and 680 nm, and emits fluorescence at 685 nm (Yentsch and Phinney, 1985; Keränen et al., 1999; Erokhina et al., 2002). Time-resolved fluorescence emission spectroscopy has shown that in healthy wild-type cyanobacterial cells light energy absorbed by the PBS is passed to the photosystem reaction centers along the following transduction pathway: PC rods→APC core→PBS terminal emitters→chlorophyll a (Glazer 1985), as depicted in Fig. 1. Energy transfer along this pathway through the PBS is unidirectional and achieves an efficiency of over 90% (Glazer, 1989).
In addition to emission from the photosynthetic pigments, cyanobacteria also exhibit fluorescence from the aromatic amino acid tryptophan, with a peak at an ex/em pairing of around 280/340 nm (Du et al., 1998; Vivian and Callis, 2001). The emission maximum of a tryptophan residue is sensitive to its local environment within the protein (primarily due to water exposure of the chromophore) and ranges from 308 to 355 nm (Vivian and Callis, 2001).
These major cyanobacterial fluorophores are summarized in Table 1.
1.4. Excitation-emission matrices
A full representation of the pattern of fluorescence intensity, as a function of both excitation and emission wavelength, is provided by an excitation-emission matrix (EEM). It is important that the generation and interpretation of such data representations are understood. Figure 2 displays a representative EEM of the fluorescent response exhibited by the cyanobacterium Synechocystis sp. PCC 6803. This EEM was generated for the control sample of this irradiation experiment, as detailed in the Method section. Briefly, multiple emission spectra are recorded from the target as the excitation wavelength is incremented from UV through visible. This stack of emission spectra as a function of excitation wavelength constitutes a three-dimensional datacube: a matrix of excitation-emission-intensity points. A meaningful way of visually representing this information-rich EEM datacube is as a contoured landscape of emission intensity, with fluorescent peaks located at specific coordinates in the excitation-emission parameter space, as shown in the three-dimensional plot in Fig. 2a. A clearer visualization is to flatten this landscape into a two-dimensional plane, with the height of peaks indicated through the color coding of emission intensity and plotting contour lines of iso-intensity, as shown in Fig. 2b. This method for presenting the complete EEM has the advantage that peaks are not obscured behind one another from the plotting perspective, and it represents a clear excitation-emission map of a sample's fluorescent response.
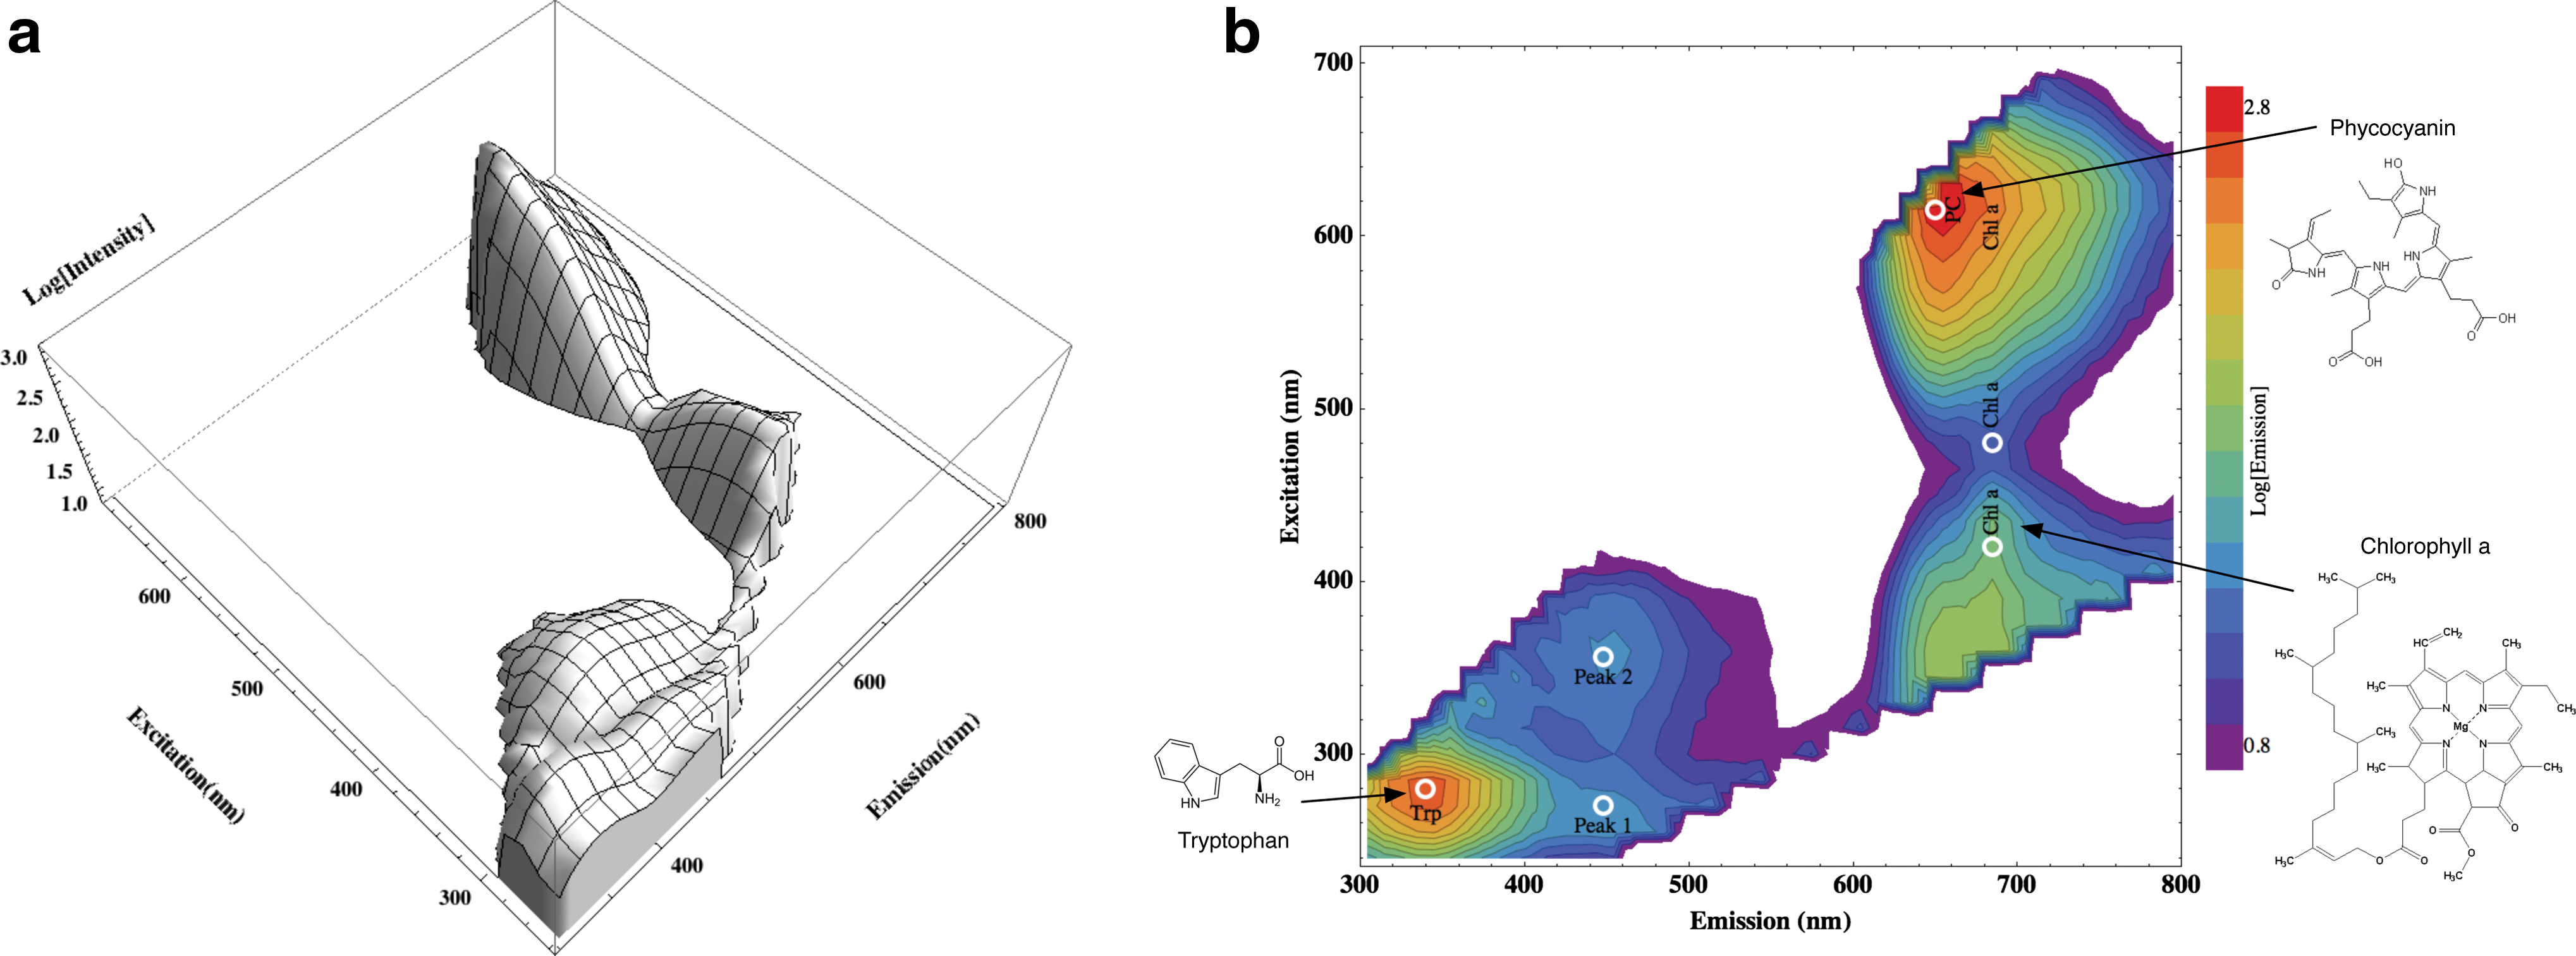
Example of the fluorescence excitation-emission matrix (EEM) generated for cyanobacteria. (
Such EEMs are interpreted as follows. Due to scattered excitation light, EEMs exhibit a diagonal ridge of high intensity with equation y=x and a similar intense line with equation 2y=x from the first harmonic of the scattered excitation light permitted through the spectrometer diffraction grating. Only emission measured from the sample within these boundaries on the EEM is relevant, and these excluded regions have been blanked out in all displayed EEMs.
Figure 2 shows several prominent fluorophores in Synechocystis, labeled at their characteristic ex/em pairing as listed in Table 1. The fluorescence spectrum of chlorophyll a has several features, shown in Fig. 2 at ex/em pairings of 420/685, 480/685, and 605/685 nm. Peak 1 and 2 at λem≈450 nm are believed to be due to cellular breakdown products, as treated in the Discussion. Both phycocyanin and chlorophyll also fluoresce, although less efficiently, after excitation from UV wavelengths, and produce the combined fluorescent feature around 360/670 nm in Fig. 2. The white circles indicate the ex/em pairs at which the changes in fluorescence with irradiation were measured for different fluorophores. The molecular structures indicated for these major cyanobacterial fluorophores show them all to be aromatic; the delocalized π bond electrons make such molecules efficient absorbers of UV and visible light.
Here, for the first time, the reflectance and fluorescence characteristics of the cyanobacterium Synechocystis sp. PCC 6803, which represent potentially detectable biosignatures, are analyzed as they are modified and degraded by ionizing radiation. This cyanobacterial strain is not considered extremophilic. Synechocystis sp. PCC 6803, however, is commonly used as a model organism for physiological and genetic studies of photosynthesis and, in 1996, was the first photoautotrophic organism to have the nucleotide sequence of its entire genome determined (Kaneko and Tabata, 1997). The photosynthetic machinery of Synechocystis sp. PCC 6803, the PBS, PSI, and PSII, are all shared with other cyanobacteria, and this strain of Synechocystis will exhibit a comparable fluorescence response to hardier environmental strains. Furthermore, Synechocystis sp. PCC 6803 possesses only one kind of phycobiliprotein in the rods of its PBS, phycocyanin, which simplifies the interpretation and analysis of the measured fluorescence response. This cyanobacterium also does not produce scytonemin, a sheath pigment that screens the cell from UV, which would have hampered interpretation of the changing fluorescence pattern with irradiation. In addition, Synechocystis sp. PCC 6803 has a relatively fast doubling time, can be grown easily in phototrophic liquid culture, and is a unicellular rod-shaped bacterium that does not form strands or cyanobacterial mats that would hinder sample homogeneity. For these reasons, we selected Synechocystis sp. PCC 6803 as the representative cyanobacterium for analysis.
2. Method
2.1. Sample preparation and irradiation
Synechocystis sp. PCC 6803 was cultured to high cell density in BG11 liquid growth medium (Castenholz, 1988) with a photon flux of 46 μE/m2/s in a photosynthesis incubator (Innova 4340, New Brunswick Scientific, St. Albans, UK) at 25°C with constant agitation of 130 rpm for 1 week. The optical density at 600 nm (OD600) of the resultant culture was determined by a cell density spectrophotometer (WPA Biowave CO8000). The Synechocystis cell density, which yields the greatest measured fluorescence response with the instrument setup described hereafter (a trade-off between concentration of cellular fluorophores and scattering or re-absorption of emission), was previously determined to be at OD600=0.5 (Dartnell et al., 2010b), corresponding to a Synechocystis cell density of 2.4×10⁸ cells/mL (determined by hemocytometer count). This culture was thus prepared by centrifuging at 15,000g for 10 min (Eppendorf centrifuge 5804R) and resuspending the cell pellet in BG11 to produce a suspension with an optical density 3.5 times greater than this analytical target to account for the sample dilution required between irradiation and analysis. It had already been determined that the BG11 growth medium produces no fluorescent emission of its own (Dartnell et al., 2010b).
One-milliliter samples of the concentrated cell suspension were pipetted into 2.0 mL borosilicate clear glass vials (2-CV, Chromacol, purchased through Fisher Scientific; sterilized by autoclaving). These were stoppered with 11 mm polyethylene snap caps (11-PEC1, Chromacol). These polyethylene caps are not thermostable, so they had been sterilized by 5 h exposure to 254 nm UV lamps. Samples prepared for room-temperature irradiation were stored overnight at 4°C and transported to and from the irradiation facility chilled on ice. Samples prepared for low-temperature irradiation were rapidly frozen in a bath of ethanol and dry ice, stored overnight in a −80°C freezer, and transported on dry ice.
The ionizing radiation exposures were carried out at the cobalt-60 radionuclide gamma-ray source at Cranfield University, Shrivenham, UK. Distance from the cylindrical source determines the dose rate of the sample exposure, so the sample vials were precisely positioned along the circular arc about the cobalt-60 rods that yields a 10 kGy/h dose rate. One vial of frozen cyanobacteria was irradiated to 80 kGy at −80°C by being secured upright within a thin-walled polystyrene box with dry ice packed behind (so as to minimize shielding of the gamma rays). Vials were removed after 3, 6, and 8 h of irradiation to produce samples with total exposures of 30, 60, and 80 kGy. The accuracy of doses delivered to samples is±5%, which includes error in the timing of the exposure, positioning of the sample, and dosimetry. Control samples (0 kGy exposure) were prepared and transported alongside the irradiation vials but stored for the duration of the exposure outside the irradiation room. Further details of the irradiation procedure used are given in Dartnell et al. (2010a).
After gamma-ray exposure, the 1 mL cell solutions were pipetted from the irradiation vials and diluted with BG11 to produce samples with OD600=0.5 for the below analyses. Sample analyses were conducted in the order fluorescence, absorbance, reflectance but will be presented in a different sequence in the following Results and Discussion sections.
2.2. Analysis
2.2.1. Fluorescence
The fluorescent emission of samples was measured with a Perkin Elmer LS55 fluorescence spectrometer (Perkin Elmer, Cambridge, UK). This instrument consists of a pulsed xenon arc lamp light source, excitation and emission scanning monochromators, a sample compartment with a cuvette holder, and a photomultiplier tube detector. Three-milliliter liquid samples were pipetted into a 1 cm UV-C quartz cuvette (Fisher, Loughborough, UK) and placed in the sample holder. First, the excitation spectrum (240–705 nm) for fluorescent emission at 685 nm was recorded at 500 nm/min scan speed with an excitation slit width of 8 nm and emission slit width of 5 nm. Second, data for a full EEM were collected as follows. Emission spectra were recorded between 300 and 800 nm, with data points logged every 0.5 nm at a scan speed of 1000 nm/min. The excitation wavelength was incremented in 15 nm steps between 240 and 705 nm, which produced a total of 32 emission spectra for each sample. With these settings, data acquisition required around 25 min per sample.
The complete fluorescence data set collected for each sample is thus a three-dimensional datacube, composed of emission intensity measurements at 32,000 excitation-emission wavelength combinations. To smooth the recorded emission spectra and reduce the computational demands required for subsequent processing and plotting of the complete EEM, emission spectra were averaged into bins 10 nm wide.
Excitation-emission matrices were generated from the acquired datacube by data transformation and analysis computer code, which was written by the lead author in Mathematica 7.0 (Wolfram Research, Champaign, USA). The emission profile is presented on a Log10 scale and displayed with rainbow color coding and 15 contour lines. The appropriate range for color coding of the fluorescence intensity was determined from the emission intensity histogram, as explained in Dartnell et al. (2010b).
2.2.2. Absorbance
The absorption spectrum of each cell sample in a 3 mL cuvette was measured at room temperature by using a U-3310 spectrophotometer (Hitachi) with a wide-angle photomultiplier tube detector suitable for cell absorption spectra and a monochromator slit width of 2 nm. A second cuvette with distilled water served as the reference sample, with absorption calibrated to this reference at 750 nm (where light scattered by cells dominates). Absorbance was recorded between 400 and 750 nm at 1 nm intervals with a scan speed of 300 nm/min.
2.2.3. Reflectance
Cell suspensions were concentrated by centrifugation and resuspension in 1 mL of phosphate buffer solution, and reflectance spectra measurements were carried out at room temperature with the optical multichannel detection system described by Ruban and Horton (1992). In brief, 150 μL of each sample was pipetted onto white filter paper and placed in the sample compartment ∼45° to the probing reflectance light. Data acquisition was performed with a Jarrel-Ash monochromator (Monspec 27) coupled with a 1024 channel silicon photodiode detector (Model 1455). The data analysis was performed by EG&G PARC optical multichannel analyzer OMA-Vision software, which recorded reflectance between 520 and 820 nm. The mean accumulation time was 60 s. Spectral resolution was 1 nm. All sample spectra were subtracted from that recorded for a filter paper blank wetted with distilled water to remove spectral features of the paper itself. Spectra are normalized to the control spectrum at a wavelength of 740 nm, where differences are primarily due to light scatter.
3. Results
Figure 3 shows a photograph of the cyanobacterial samples after irradiation at room temperature, which were pipetted from the irradiation vials into 15 mL Falcon tubes before dilution for analysis. Irradiation exposure increases from left to right, with the greatest dose (80 kGy) compared against the control sample rightmost. The photograph clearly shows a considerable diminution in color saturation as well as a change in hue of the original green color of the cyanobacterial cells with increasing ionizing radiation exposure.
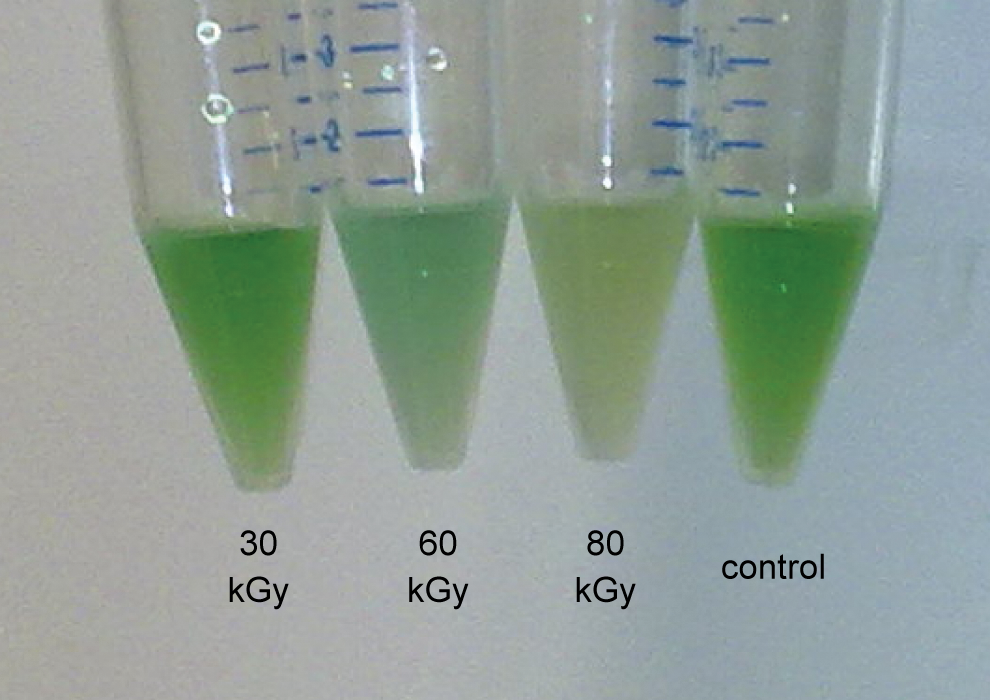
Photograph showing the cyanobacterial samples after increasing exposures to gamma radiation, with the greatest dose compared against the unirradiated control on the right. Considerable reduction in the color saturation of cellular pigments is observed with ionizing radiation. Color images available online at
This eyeball observation is recorded quantitatively in the red-end reflectance spectra between 600 and 760 nm shown in Fig. 4. The unirradiated control sample shows the distinctive spectral features characteristic of cyanobacteria. The dip in reflectance at 680 nm is due to the red peak in chlorophyll absorption, and the dip around 620 nm is due to phycocyanin absorption. Figure 4 shows a substantial degradation of these spectral features with increasing radiation exposure. The reflectance spectrum from the 30 kGy irradiated sample was lost to experimental error and is not shown here. The chlorophyll reflectance feature appears to be more sensitive to radiation degradation than does that of phycocyanin.

Cyanobacterial red-end reflectance spectra between 600 and 760 nm as a function of ionizing radiation exposure. The clear trend is toward smoothing of reflectance spectral features; the same radiation-induced bleaching of cellular pigments seen in Fig. 3. Most notable is the eradication of the red edge of chlorophyll at 680–700 nm. a.u., arbitrary units.
Of particular note is the prominent spectral red edge of chlorophyll, the steep jump in reflectance over 680–700 nm, which is largely eradicated by the highest radiation dose studied here. This red edge in reflectance is a potential biosignature and is treated in much greater depth in the Discussion. The long wavelength reflectance spectrum (600–760 nm) of cyanobacteria exposed to 80 kGy of gamma radiation shown here is essentially flat without prominent spectral features, which accounts for the pale, bleached tint of the irradiated sample shown in Fig. 3.
Figure 5 (top) displays the absorption spectra generated for the four samples, with peaks due to phycocyanin and carotenoids and both red and blue absorption features of chlorophyll at the wavelengths indicated. The spectral features from these cyanobacterial pigments can all be seen to degrade substantially with the radiation exposure. In particular, the reduction in the absorption peak from carotenoids appears to reach a maximum over the course of this experiment, with no further decrease possible between the 60 and 80 kGy exposures. However, a precise assessment of the absolute absorption decrease from pigment destruction by radiation is not possible. The absorption spectra of cell suspensions exhibit a general rise toward shorter wavelengths (i.e., blue) due to increasing light scatter from the cells. If this component from cell scatter is assumed to increase linearly with decreasing wavelength, intersecting the spectra at 750 nm and the absorption minimum at 525 nm, as shown by the blue line in Fig. 5 (top), then a correction for cell scatter can be made by subtracting this linear function from the recorded absorption spectra.
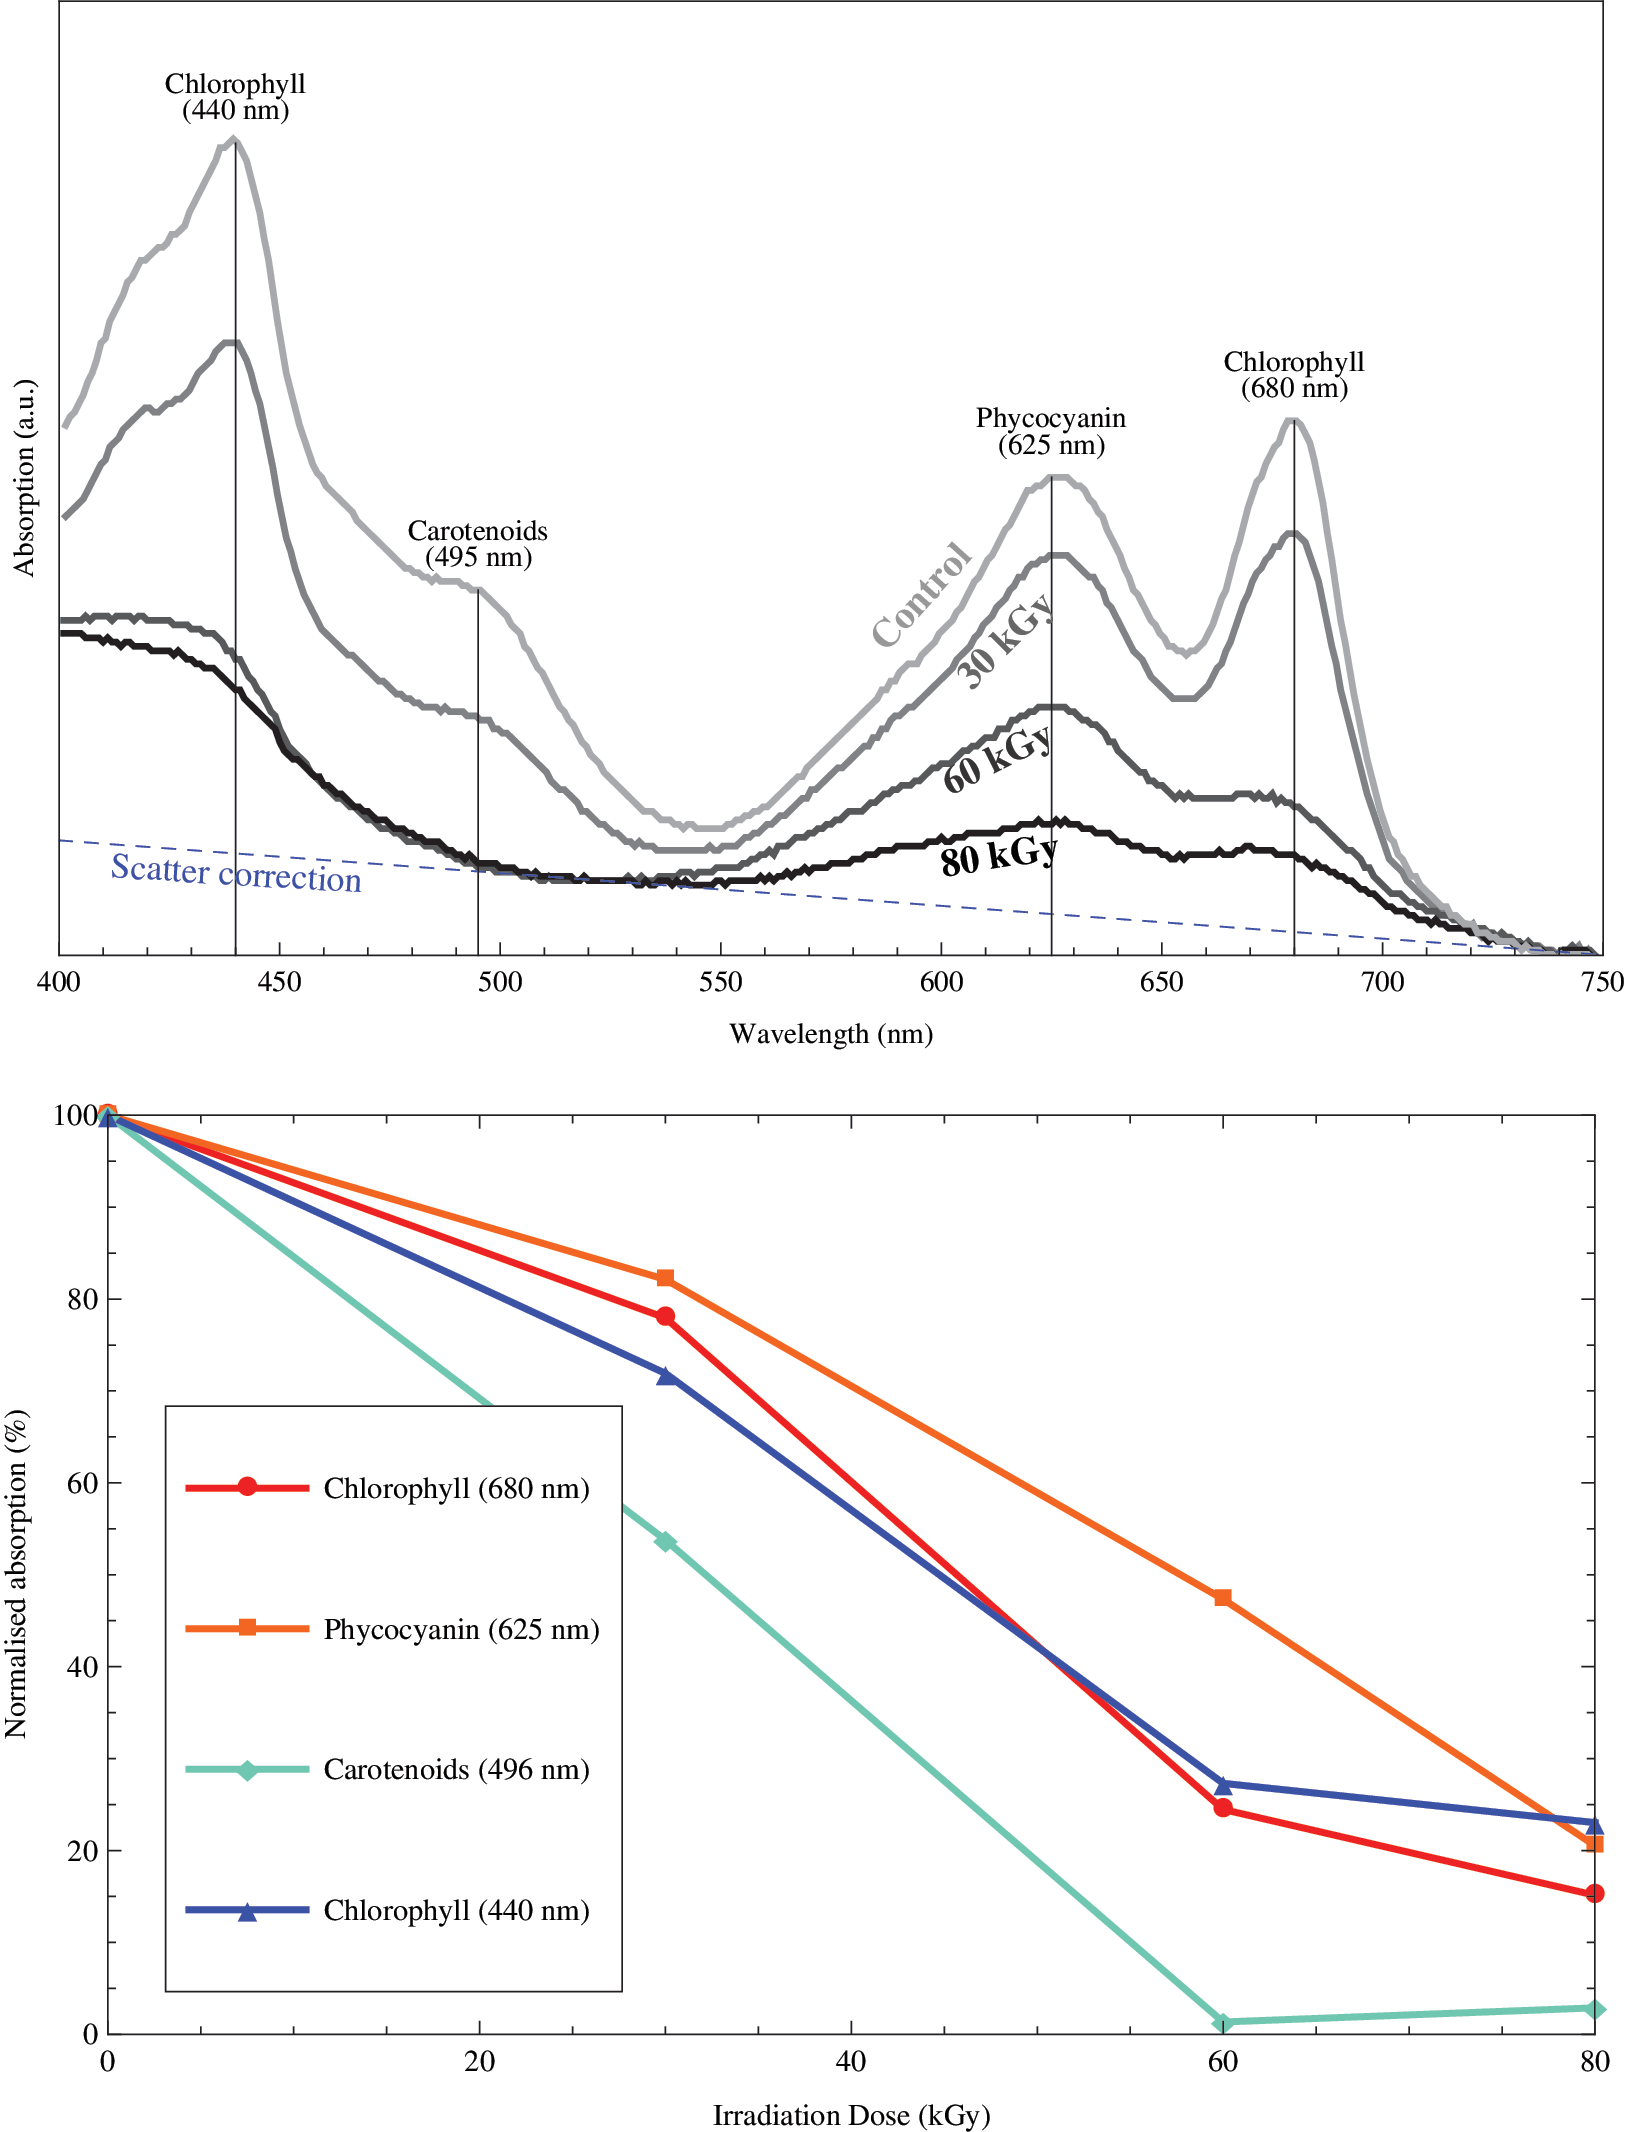
(Top) Cyanobacterial absorbance spectra between 400 and 750 nm as a function of ionizing radiation exposure. Absorbance spectral features of chlorophyll (with peaks in both the red and blue), phycocyanin, and carotenoids are labeled. The increasing light scattering by cells at shorter wavelengths is fitted by the blue dashed line, and this is subtracted from the absorbance values of the four labeled spectral features. (Bottom) The change in absorbance as a function of irradiation dose exhibited by the three cyanobacterial pigments (chlorophyll measured at both 440 and 680 nm). Color images available online at
The percentage degradation of these four pigment spectral features as a function of radiation dose, accounting for a linear increase in cell scattering at shorter wavelengths, is plotted in Fig. 5 (bottom). Each line is normalized to the absorption measured for the control sample. As was evident from the spectra shown in Fig. 5 (top), carotenoids seem to be rapidly destroyed by ionizing radiation, with their absorption feature no longer detectable by 60 kGy of ionizing radiation. The red and blue absorption features of chlorophyll (peaking at wavelengths of 680 and 440 nm, respectively) decline in general agreement with each other to roughly 20% of the signal of the unexposed cyanobacteria and, like the carotenoids, exhibit a plateau in radiation degradation after 60 kGy. The absorption peak of phycocyanin at 625 nm is seen in Fig. 5 (bottom) to be the most robust against irradiation, as it experiences the shallowest gradient of degradation but still exhibits only around 20% of the original signal by 80 kGy. The implications of these results will be discussed in detail later.
The left-hand column of Fig. 6 presents the EEMs of fluorescence exhibited by the cyanobacteria after increasing radiation doses, each color-coded to the same emission intensity log scale. The right-hand column displays the change in fluorescence between each exposed sample and the unirradiated control, color-coded on a linear scale with diminishing fluorescence shown in blue and increases in red. Each panel is labeled with the major cyanobacterial fluorophores in excitation-emission space.

(Left column) Excitation-emission matrices (EEMs) of the cyanobacterial fluorescence response after increasing doses of ionizing radiation (color-coded to log of fluorescence intensity). Cyanobacterial fluorophores labeled as in Fig. 2. Panel d (80 kGy exposure) is annotated with marker lines and arrows to indicate the blue-shifting of the wavelength of photopigment peak fluorescence. (Right column) EEMs showing the change in fluorescence (linear scale) between each exposed sample and the unirradiated control, clearly showing the increase (red) and decrease (blue) in emission from different cyanobacterial fluorophores during radiation-induced degradation. Stark diagonal features are artifacts of scattered excitation light. Individual panels are labeled a–g for referencing in the main text. Color images available online at
A marked decrease in fluorescence from tryptophan can be observed with increasing exposure, and a decline is also seen in emission from chlorophyll after excitation at around 400 nm. The peak in fluorescence around λex=600 nm from phycocyanin and chlorophyll can be seen at first to increase with irradiation, but it then decreases dramatically by 80 kGy exposure. While the broad ridge of emission around 685 nm from chlorophyll excited at about 400 nm decreases with radiation exposure, the peak of emission can also be seen to move toward longer wavelengths. By 80 kGy, the 685 nm emission peak has been blue-shifted to 650 nm (indicated in panel d of Fig. 6 with white dashed lines). A similar shifting of fluorescent emission to shorter wavelengths is not observed with the tryptophan peak (ex/em pairing of 280/340 nm). Panel f, displaying the change in fluorescence by 60 kGy irradiation, shows a slight increase in fluorescence at ex/em pairing 370/650 nm, which disappears by 80 kGy when a decrease in all phycocyanin and chlorophyll fluorescent features is observed (panel g). An increase in fluorescence is also observed in two peaks at λem=450 nm with excitation maxima around 270 and 350 nm, labeled Peak 1 and Peak 2, respectively.
The change in emission from these major cyanobacterial fluorophores over irradiation is plotted in Fig. 7. The emission intensity from tryptophan, phycocyanin, chlorophyll a, and Peak 1 and Peak 2 are recorded at the peak fluorescence ex/em pairings indicated with white circles in Fig. 2b and normalized to the emission intensity exhibited by the unirradiated control sample (panel a in Fig. 6). The fluorescence from chlorophyll a is taken as mean of the emission measured at ex/em pairings 420/685 and 480/685 nm.

The change in emission from five cyanobacterial fluorescent features as a function of increasing ionizing radiation exposure, normalized to the unirradiated control. Fluorophore labels and excitation-emission pairings of peak fluorescence as indicated in Figs. 2 and 6. Peak 1 and Peak 2 are believed to be due to accumulating cellular degradation products.
Tryptophan fluorescence can be seen to experience a monotonic decline to only 10% of the unirradiated intensity, and chlorophyll fluorescence down to 13%, by 80 kGy. Phycocyanin is seen to almost double fluorescent emission after 60 kGy exposure before declining to 50% by 80 kGy. Both the Peak 1 and Peak 2 fluorescent features are initially substantially enhanced by ionizing radiation and reach a maximum of over 10 times and 8 times their unirradiated intensity, respectively, after 60 kGy, before they begin to decline again.
To investigate more closely the radiation degradation of the phycobilisome (PBS) with ionizing radiation, Fig. 8 shows the emission spectra of the control and three irradiated samples from excitation at 585 nm, the wavelength at which cyanobacterial absorption is primarily from phycocyanin (e.g., Yu et al., 1999). These emission spectra represent horizontal slices at 585 nm through the EEMs presented in the left-hand column of Fig. 6, superimposed onto the same axes. Due to the changes in fluorescence intensity from phycocyanin induced by radiation exposure, as presented graphically in the right-hand column of Fig. 6 and plotted in Fig. 7, these four plots have been normalized to the same peak height. Also, due to the shifting of peak fluorescence to shorter wavelengths from radiation damage, as mentioned above under Fig. 6, the curves have been re-centered to a peak wavelength of 654 nm. These simple transformations allow a comparison of the shape of the fluorescent spectrum with increasing radiation exposure. A distinct shoulder in the spectrum, due to chlorophyll emission, is seen in the unirradiated control, as highlighted in Fig. 8 between 672 and 687 nm, which is absent in the 30 kGy and all subsequent irradiated samples.

Fluorescence emission spectra of unirradiated control and three exposed samples from excitation at 585 nm, the wavelength at which cyanobacterial absorption is primarily from phycocyanin (e.g., Yu et al., 1999). Spectra normalized to peak of control sample. The shoulder in the spectrum, highlighted in gray, is due to emission from the PBS terminal emitter and is absent by 30 kGy exposure. Color images available online at
To assess the radioprotection effect of exposure at low temperature, a cyanobacterial sample was also irradiated to 80 kGy frozen at −80°C. Figure 9 shows the percentage change in emission from the major cyanobacterial fluorophores when comparing room-temperature and frozen irradiations. The numerical labels give the factor by which room-temperature sample emission differed from that of the frozen samples. The decrease in fluorescence from tryptophan and chlorophyll was between about 3 and 30 times greater in the room-temperature sample than the −80°C exposure. The increase in Peak 1 and Peak 2 fluorescent features was between about 10 and 20 times higher in the room-temperature irradiation. For phycocyanin, the cold irradiation was still showing an increase in fluorescence after 80 kGy and had not yet begun to decline with increasing dose (as with the room-temperature irradiation shown in Fig. 7).

Comparison between the percentage change in emission of several cyanobacterial fluorophores after 80 kGy ionizing radiation at room temperature and frozen at −80°C. For each pair-wise comparison the factor between the room-temperature value and −80°C is given.
4. Discussion
The results presented in this initial study track the molecular degradation of cyanobacterial cells and the erasure of potential biosignatures after exposure to increasing doses of ionizing radiation. Three analytical techniques were employed: reflectance, absorbance, and fluorescence spectroscopy. Reflectance and fluorescence could both potentially be used for scanning the martian surface rocks for cyanobacterial cells (as explained below). Absorption spectra would not be used directly in biosignature detection but are a valuable analytical technique for monitoring the degradation of cellular pigments. The absorbance spectra are sensitive to the concentration of pigments and not their coupling into chains of excitation transference, so they provide complementary data to the fluorescence EEMs also considered here. The first half of this section will consider the data yielded by all three spectroscopic techniques in combination and the progression of cyanobacterial degradation by ionizing radiation that they reveal. The implications of these results for the prospects of detecting cyanobacterial biosignatures will then be discussed.
4.1. Cyanobacterial degradation by ionizing radiation
A detailed account of the cyanobacterial cellular destruction from ionizing radiation can be inferred by combining information yielded by all three spectroscopic analytical techniques presented here: reflectance, absorbance, and fluorescence. Figure 10 is a graphic summary of the increasing disassembly of the PBS structure and molecular degradation by ionizing radiation, as supported by these results.
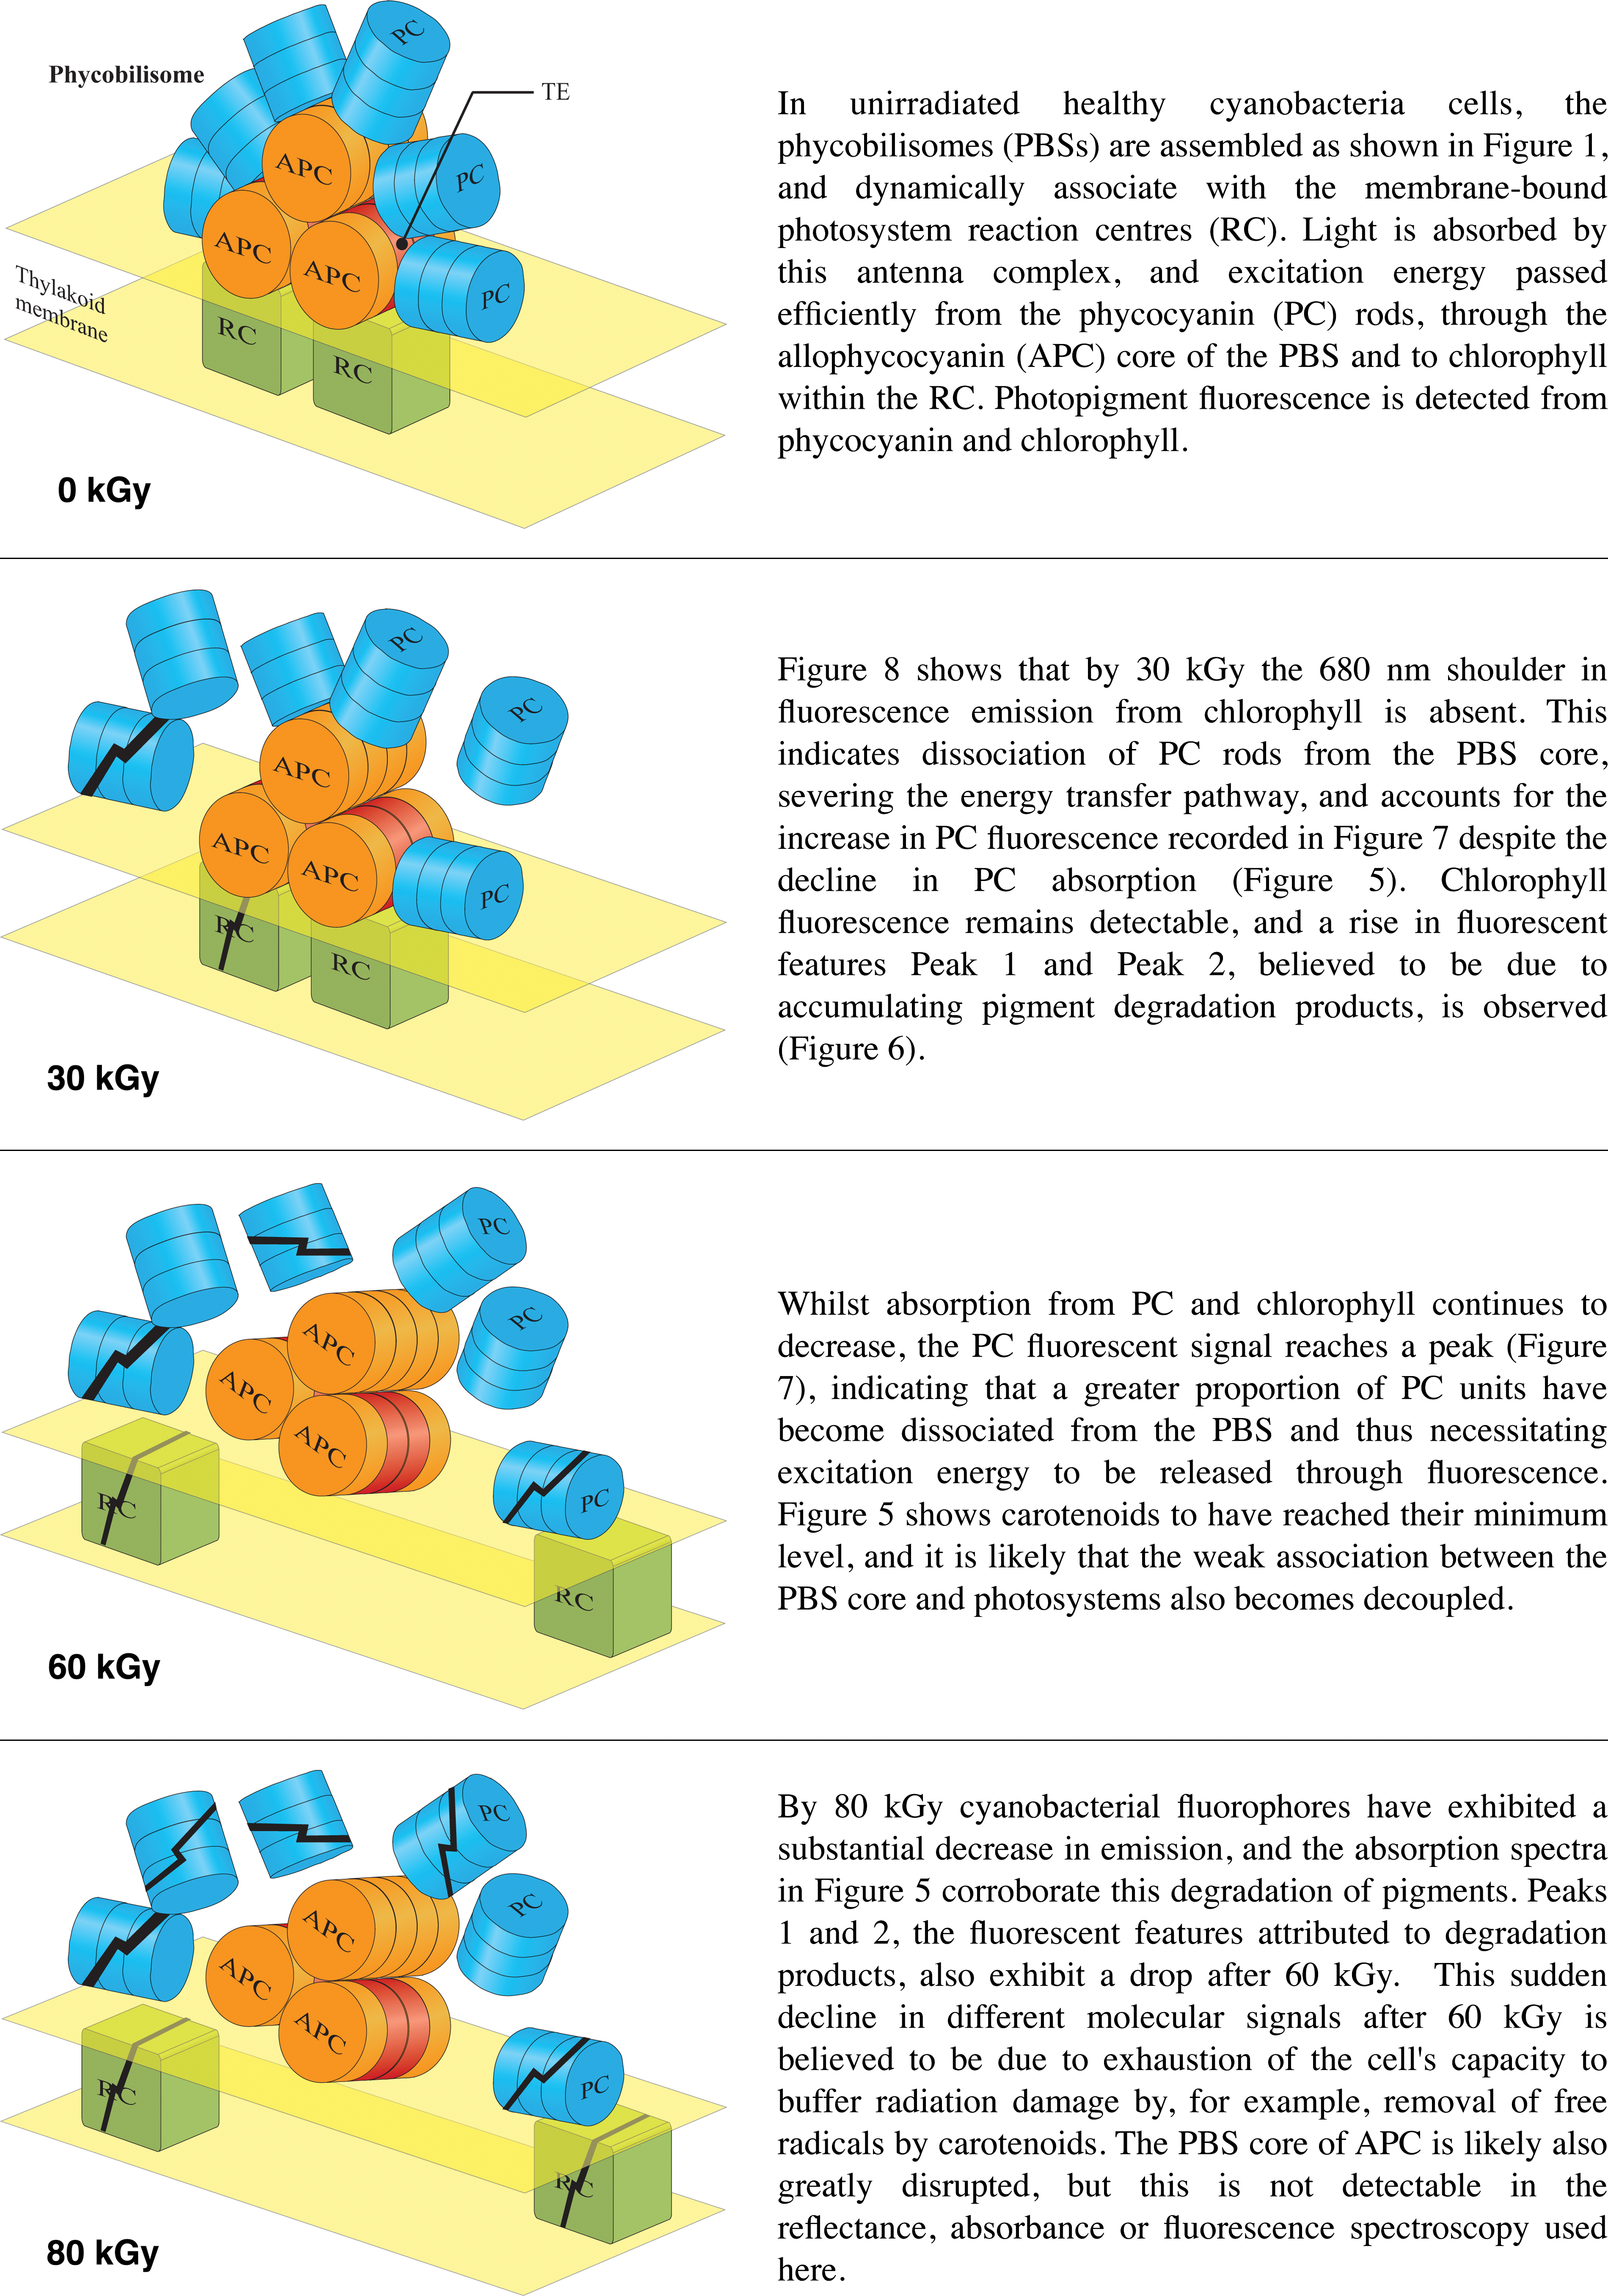
Sequence of schematic diagrams illustrating the progression of radiation-induced damage to cyanobacterial photosynthetic machinery, as deduced by this study and explained fully in the Discussion. Color images available online at
The unirradiated control cyanobacterial cells contain a population of intact PBS that dynamically associate and dissociate with the thylakoid membrane-bound photosystems. The energy transfer pathway is operational and efficiently passes excitation energy from the phycocyanin rods, through the PBS core, to chlorophyll in the photosystems. Fluorescence is observed from these photopigments, as well as the protein-bound tryptophan, as shown in Fig. 2.
It can be seen in Fig. 8 that, after 30 kGy of ionizing radiation, the 680 nm shoulder feature from chlorophyll in the fluorescence spectrum is absent. This suggests that the reaction centers are no longer receiving energy transferred from the PC rods. The reflectance (Fig. 4) and absorbance (Fig. 5) spectra, however, both indicate that PC has undergone only minimal degradation by 30 kGy (Fig. 5 shows more than 80% PC absorbance remaining); thus the reason for a drop in excitation energy reaching the reaction centers is not due to the destruction of PC pigment. In fact, fluorescent emission from PC is shown in Figs. 6 and 7 to have substantially increased.
The loss of the 680 nm shoulder in the emission spectrum and increase in PC fluorescence are both explained by decoupling of the energy transfer pathway illustrated in Fig. 1 between PC and the APC core of the PBS. PC decoupled from the energy transfer pathway is forced to emit the excitation energy it absorbs as additional fluorescence. These results indicate that by 30 kGy either a significant fraction of the population of PBS have completely lost their fan of PC rods or in most PBS a significant fraction of the PC units have dissociated.
As well as partial degradation of the PC pigment, Fig. 5 shows both red and blue absorption peaks of chlorophyll to have diminished (to 78% and 71%, respectively). While these absorption spectra show chlorophyll to have been measurably degraded by 30 kGy of radiation, and the energy transfer pathway from PC to chlorophyll is already showing signs of having been decoupled, as discussed above, Fig. 7 shows no decrease in chlorophyll fluorescence at this point. This could be due firstly to radiation damage to the electron transport chain in the photosystem preventing transfer of excitation energy and thus producing an increase in chlorophyll emission (similar to the Kautsky effect; Maxwell and Johnson, 2000), which would result in maintenance of the chlorophyll fluorescence despite the decrease in chlorophyll absorption. Secondly, chlorophyll fluorescence is quantified here as the average of the intensity measured at λex=420 and 480 nm (as indicated in Fig. 2) to avoid signal swamping from the large phycocyanin fluorescence peak at λex=615 nm. At these shorter wavelengths, chlorophyll is directly absorbing the excitation light itself or absorbing it via carotenoids in the PBS (i.e., the blue peak in the cyanobacterial absorbance spectrum in Fig. 5) rather than the accessory pigments of the PBS, so chlorophyll fluorescence at these ex/em pairings of the EEM (Figs. 6 and 7) is not due to the excitation energy transfer pathway.
Figures 6 and 7 also show the intensification of fluorescence peaks at ex/em coordinates 270/448 and 356/448 nm, labeled here as Peak 1 and Peak 2, respectively. Fluorescence is evident at these ex/em pairings in the unirradiated control sample, but the signal from these two emission features increases significantly with 30 kGy irradiation. Alterations in fluorescence yield at an ex/em pairing of ∼350/450 nm (very close to Peak 2) in metabolically active cells are generally the result of alteration in redox state or production rates of NAD(P)H. Both nicotinamide adenine dinucleotide phosphate (NADP) and nicotinamide adenine dinucleotide (NAD) participate in electron transfer during photosynthesis (Matthijs et al., 1984; Steigenberger et al., 2004). NADH (the reduced form of NAD) donates electrons via the plastoquinone-cytochrome redox complex, and NADPH (the reduced form of NADP) donates electrons to the thylakoid membrane via a dehydrogenase. Pure NADPH has been shown to exhibit an absorption maximum at 340 nm and a maximum of emission at ∼462 nm, but the emission peak shifts to 440 nm when measured in intact microorganisms (Duysens and Amesz, 1957; Palmer et al., 2003). The absorption maximum of the oxidized form, NADP, is shifted to much smaller wavelengths, ∼220 nm (De Ruyck et al., 2007). NADH exhibits a strong fluorescence signal with an excitation maximum at 350 nm and emission peak at 450 nm, whereas the oxidized form, NAD+, does not fluoresce (Kirkpatrick et al., 2005).
In Synechocystis PCC 6803, changes in ambient lighting can produce significant changes in NADPH fluorescence as a function of redox state of the cell. In dark-adapted organisms, exposure to red light produces an initial rapid increase in fluorescence followed by a brief dip in signal strength and then a slower more sustained increase. The changes are interpreted as an initial light-driven rapid NADP reduction phase followed by a period of slower NADPH oxidation by the Calvin cycle (Mi et al., 2000).
Gamma irradiation of Synechococcus PCC 7942 to 1.5 kGy produces a 20-fold increase in intracellular reactive oxygen species that triggers a generalized metabolic response to oxidative stress in any surviving cells (Agarwal et al., 2008). In Synechocystis PCC 6803, a critical metabolic response to oxidative stress is an increase in production of two NADPH-dependent glutathione peroxidase-like proteins, essential antioxidants for the protection of membranes against lipid peroxidation (Gaber et al., 2001, 2004; Latifi et al., 2009). So cellular recovery from radiation-induced oxidative stress involves cycling between reduced and oxidized forms of NAD and NADP and thus changes in fluorescence at an ex/em pairing of ∼350/450 nm. This is very close to Peak 2, observed here to increase over irradiation (as seen in Fig. 6). However, even the lowest ionizing radiation exposure used in this degradation study, 30 kGy, is substantially greater than that sufficient to sterilize the Synechocystis sample (Domain et al., 2004) and even to sterilize a population of the most radiation-resistant organism known, Deinococcus radiodurans (0.0001% survival after 15 kGy; Battista et al., 1999). For this reason, changes in cyanobacterial fluorescence at ∼350/450 nm observed here are not believed to be due to metabolic recovery processes of surviving cells.
In this case, Peak 1 and Peak 2 are believed to be due to cellular degradation products caused by the ionizing radiation, probably derived from phycocyanin or chlorophyll. The molecular structures of phycocyanin and chlorophyll are highly tuned to absorb and re-emit light, which makes them efficient components of the light-harvesting machinery of this photosynthetic organism and thus also intense fluorophores when that excitation energy cannot be dissipated. Radiolytic damage to the rigid molecular structure of either fluorophore would cause a blue-shift in the emission to shorter wavelengths, as explained below.
The common biochemical pathway by which chlorophyll is broken down in senescent leaves and fruit to yield colorless and nonfluorescent tetrapyrrole catabolites has been well characterized (Kräutler, 2008; Moser et al., 2009b). More recently, intense blue fluorescence appearing in halos around dark spots on ripening bananas (Moser et al., 2008, 2009a), and accumulating in the senescent leaves of bananas (Banala et al., 2010) and the Peace Lily (Kräutler et al., 2010), have been studied by spectrofluorometry and the molecules responsible identified by high-performance liquid chromatography and nuclear magnetic resonance.
These fluorescent chlorophyll catabolites (FCCs) are intermediates of chlorophyll degradation and are not normally seen in the enzymatically carefully controlled pathway of chlorophyll breakdown in other fruit or leaves (Moser et al., 2008). The FCCs observed in halos on ripening banana skin are particularly persistent and intense, with fluorescence emission peaking near 450 nm and absorption maxima near 317 and 358 nm (Moser et al., 2008). Blue-shifting of emission maximum, that is, from active chlorophyll (∼685 nm) to FCCs (∼450 nm), is caused by changes to the molecular structure such as loss of aromatic rings or conversion of a linear ring system to nonlinear, and reduction in the number of conjugated bonds in a chain (Coble, 1996). The ex/em peak of these FCCs corresponds very well with the fluorescent characteristics of Peak 2 discovered here. Thus, it is believed that the increase in Peak 1 and 2 fluorescent features during irradiation of cyanobacteria is due to the accumulation of chlorophyll radiolytic-degradation products, although further work is needed to confirm this. Some small degree of degraded chlorophyll products is seen in the control sample (panel a in Fig. 6).
After a dose of 60 kGy of gamma rays, the cyanobacteria show even greater signs of molecular degradation. The reflectance and absorbance features of chlorophyll and phycocyanin are both substantially diminished, and absorbance from carotenoids has reached a plateau at its minimum level. It is difficult to quantify the precise absolute percentage decrease in the concentration of the different pigments from the absorption spectra series presented in Fig. 5 because of the rise of the absorbance spectra at shorter wavelengths due to increasing cellular scatter. However, it is clear that the carotenoids (absorption feature at 495 nm) are degraded most rapidly by the ionizing radiation, and the plateau in the graph that shows change in carotenoid absorption (Fig. 5) implies that this pigment has been completely degraded by 60 kGy. This is believed to be due to the antioxidant function of carotenoids and the efficiency with which they react with and remove reactive oxygen species and free radicals (Krinsky, 1989; Edge et al., 1997). Such chemically reactive oxidizing agents are produced by the radiolysis of water and diffuse through the cell (Baumstark-Khan and Facius, 2001). Carotenoids thus serve as the first line of defense in protecting a cell against the oxidizing products of radiation and so are themselves rapidly destroyed.
Figure 5 also shows a significant reduction in the population of phycocyanin after 60 kGy (reduced to only around 50% of its initial absorbance). However, Figs. 6 and 7 show that phycocyanin fluorescence in fact reaches a peak after 60 kGy. This indicates a continuing decoupling of the energy transfer pathway, with a greater proportion of the undamaged phycocyanin unable to pass its excitation energy and so emitting fluorescence. The concurrent increase in fluorescence in the Peak 1 and Peak 2 emission features supports the hypothesis that these represent breakdown products of fluorophores in the PBS.
Figure 6 documents another interesting trend in cyanobacterial fluorescence during irradiation. Panels e and f show an emission peak growing up to 60 kGy of irradiation, around an ex/em pairing of around 370/650 nm—at a slightly shorter emission wavelength than that marked for chlorophyll. The arrows drawn on panel d, after 80 kGy exposure, indicate the shift in peak emission to about 650 nm. There are two possible interpretations of this observed radiation-induced modification to cellular fluorescence.
First, this feature may be due to the fact that chlorophyll is degraded by irradiation more rapidly than phycocyanin, as indicated by the absorption spectra data in Fig. 5. Chlorophyll and phycocyanin emit at similar wavelengths, around 650 and 685 nm, respectively (see Fig. 1), so their fluorescence peaks largely combine. A greater relative degradation rate of chlorophyll will result in a net shift of the combined fluorescence “hump” shifting to shorter wavelengths. This effect is accentuated by the fact that phycocyanin is an intrinsically more intense fluorophore than chlorophyll. Thus, as irradiation acts to sever the excitation energy transfer pathways in the population of PBS, emission from phycocyanin increases relative to chlorophyll, and the net effect is a shift in the peak fluorescence toward 650 nm.
The second possibility is that the emergence of the fluorescence feature at ex/em pairing 350/650 nm in panels e and f of Fig. 6 represents the accumulation of degradation products generated by irradiation. Radiolysis of large pigments like chlorophyll may break several bonds and cause a relaxation of the molecular structure, which would result in blue-shifting of emission as explained above. Thus, this emerging emission feature may complement Peaks 1 and 2 as signatures of the accumulation of cellular breakdown products as the cyanobacteria are degraded by ionizing radiation, although further work would be needed to confirm this hypothesis.
In normal cells, the PBS migrate rapidly across the thylakoid membrane, so the complex between the PBS and photosystem reaction centers, which are bonded by linker polypeptides in the basal cylinders of the APC core, is only transient (Mullineaux et al., 1997). With such an unstable association between the PBS core and the photosystem, it is likely that the PBS core also becomes decoupled from the membrane-embedded photosystem, as illustrated in Fig. 10.
By 80 kGy, Fig. 5 shows the absorption from chlorophyll (both red and blue peaks) to have reached a plateau at around 20% of the unirradiated value, with phycocyanin declining to a similar level. All the fluorescent features also exhibit a marked decrease (Fig. 7), with tryptophan and chlorophyll reduced to between 10% and 20% of their original emission; and phycocyanin fluorescence, after peaking at 60 kGy to almost twice the unirradiated level, is also substantially decreased by 80 kGy. As the PBS is disassembled by radiolytic damage, the bilins lose their rigid structure so that radiationless relaxation comes to dominate and fluorescence emission drops (Glazer, 1989). Peaks 1 and 2, the emergent fluorescent features attributed to the accumulation of irradiation breakdown products, also exhibit a sharp decrease after 60 kGy.
The reason for this sudden decline in almost all the cellular fluorophores shown in Fig. 7 is believed to be due to exhaustion of the cell's capacity to buffer radiation damage after 60 kGy, for example by removal of free radicals by carotenoids. As already discussed, the absorption spectra in Fig. 5 indicate that carotenoids are essentially absent by 60 kGy, and beyond this threshold cellular components receive no protection from reactive oxygen species produced by radiolysis or Fenton reactions within the damaged cell.
The fluorescence signal of tryptophan exhibits simpler behavior over the 80 kGy irradiation range than other cellular fluorophores. Tryptophan fluorescence declines monotonically with irradiation (Fig. 7) and does not exhibit any apparent behavior of shifting to shorter emission wavelengths (Fig. 6). Tryptophan is a smaller fluorescent molecule than phycocyanin or chlorophyll (see Fig. 2), so when its structure is damaged by radiation, and of most significance the aromatic moiety, it may exhibit a simple shutoff of fluorescence. This is in contrast to the larger molecular structures of chlorophyll or phycocyanin, with multiple ring moieties, which are able to exhibit a more complex pattern of fluorescence change upon damage, including loss of molecular rigidity and thus relaxing of fluorescent emission to shorter wavelengths. As the population of tryptophan fluorophores is irradiated, this will produce a steady decrease in overall observed emission intensity. In addition, tryptophan fluorescence is quenched by water molecules (Chen and Barkley, 1998), so with increasing radiation-driven fragmentation and denaturation of proteins, a greater proportion of tryptophan residues comes into contact with water, and fluorescence decreases.
4.2. Cyanobacterial biosignatures on Mars
Figure 4 shows that the reflectance spectral features of phycocyanin and chlorophyll are readily eroded by ionizing radiation, quantifying the increasing pigment bleaching seen in the photograph in Fig. 3. This is significant for the potential detectability of photosynthetic microbes on Mars—the red edge in chlorophyll reflectance has been proposed as a promising biosignature to search for photosynthetic life.
The red edge is produced by absorption of red light by chlorophyll contrasting against strong reflectance of longer-wavelength, near-IR light. This contrast is further enhanced in vascular plants due to high scattering of near-IR by refraction between mesophyll cells and air spaces inside the leaf (Kiang et al., 2007), so the red edge is particularly pronounced in the reflectance spectrum of terrestrial vegetation (Kiang et al., 2007; Cockell et al., 2009). As can be seen in Fig. 4, the red edge begins at 680 nm where chlorophyll a peaks in absorbance, and the reflectance plateaus around 710–740 nm. All photosynthetic organisms except for purple bacteria exhibit a red edge, although this edge is weaker in lichens and bacteria, but no red edge exists in the reflectance spectra of mineral substrates, such as basalt, hematite, or quartz (Kiang et al., 2007). This distinctive reflectance spectra feature, therefore, could potentially be used to identify localized regions on the exposed faces of martian rocks that may host near-surface photosynthetic communities.
The Pathfinder (Smith et al., 1997), the twin Mars Exploration Rovers (Bell et al., 2003), and the Mars Science Laboratory (Malin et al., 2005) missions have all used filter wheels for multispectral imaging. The filters currently proposed for the ExoMars stereo PanCam filter wheel are based on Beagle 2 heritage (Griffiths et al., 2005, 2006), but they are optimized for discrimination between martian minerals (Cousins et al., 2010). Detection of the red edge spectral feature of chlorophyll reflectance might be achieved by using the ratio of intensity measured in channels near 670 and 720 nm of Mars rover multispectral images of rocks or ice. For example, Horath et al. (2006) reported the identification of endolithic cyanobacteria in exposed dolomite rocks in the Alps, using in situ reflectance spectroscopy (through an optic fiber coupled to a spectrometer) and the distinctive red edge from chlorophyll. This current study, however, finds that the red edge feature of chlorophyll is essentially erased by 80 kGy of gamma radiation at room temperature.
The irradiation results reported here are also important in informing the selection of the optimum excitation and emission wavelengths for a fluorescence-based instrument for biosignature surveying and the detection of localized cyanobacteria hypoliths or endoliths on the martian surface. Cyanobacterial pockets in the Mars analog site of the Atacama Desert core are spatially isolated and widely dispersed, sometimes only millimeters from lifeless surroundings (Warren-Rhodes et al., 2006), so fluorescence surveying could potentially pinpoint promising locations to target with more sensitive and discriminatory instruments. Intense fluorescent emission from phycocyanin and chlorophyll in the wavelength range of 650–700 nm presents a good target, and the short-wavelength re-emission from tryptophan would also be detectable with a suitable UV-sensitive instrument. Optimum excitation and emission wavelengths for detecting a fluorescence biosignature of cyanobacteria were discussed by Dartnell et al. (2010b). The results presented here elucidate the substantial decrease in tryptophan and photopigment fluorescence due to radiolytic destruction. A further fluorescent feature that is therefore worth consideration is the accumulating radiolytic breakdown products themselves. Emission at around 450 nm after excitation at 270 or 350 nm (Peak 1 or 2) is shown in Figs. 6 and 7 to increase with irradiation, and such a degradation feature may also be expected from remnant photosynthetic cells exposed to cosmic radiation on the martian surface.
Another key environmental parameter of the martian surface is the low temperature. The majority of the exposure experiments reported here were conducted at room temperature so that the progressive modification and deterioration of cyanobacterial biosignatures due to ionizing radiation could be quantified without freeze-thaw damage as a complicating factor. Low temperatures are, however, known to reduce the effect of irradiation due to restricted diffusion of free radicals and other oxidizing radiolytic products, and thus result in a decrease in the efficacy of the indirect mechanism of radiation damage (Dartnell et al., 2010a, and references therein, for discussion on the temperature dependency of the biological response to irradiation).
The room-temperature results presented here therefore represent an upper limit to the rate of change of fluorescence with ionizing radiation on Mars. For the purposes of determining degradation rates of biosignatures specific to martian surface conditions, it is important to ascertain the degree of protection offered by irradiation at low temperatures. To this end, fluorescence spectroscopy analysis was also conducted on cyanobacteria that had been exposed to 80 kGy of gamma rays while frozen at −80°C, a temperature characteristic of the martian surface at midlatitudes (Carr, 1996). Figure 9 shows a comparison of these results for frozen irradiation against that performed at room temperature.
The situation is complicated by the complex pattern of changes in fluorescence exhibited by the irradiated cyanobacteria. For example, as discussed above, decoupling of the excitation energy transfer pathway as well as the accumulation of radiolytic breakdown products produces an initial increase in the detected emission from phycocyanin and Peaks 1 and 2, before greater doses produce a net deterioration in the signal. The fluorophores shown by Fig. 7 to exhibit a simple decline in emission, tryptophan, and chlorophyll show between about 3 and 30 times less signal degradation when irradiated at −80°C, as seen in Fig. 9.
Previous modeling work has determined that the averaged ionizing radiation dose rate on the martian surface from cosmic rays (both solar energetic protons and galactic cosmic rays) is around 160 mGy/year (Dartnell et al., 2007a), which means that a total exposure of 80 kGy is received within half a million years. A comparison of these modeling results with the low-temperature experimental irradiation conducted here reveals that, after being exposed frozen on the martian surface for half a million years, the fluorescence signal from cyanobacterial chlorophyll would be reduced by 5% and tryptophan by 35%. Assuming a roughly linear radiolytic degradation of fluorescence, which Fig. 7 shows to be a reasonable assumption for these two fluorophores, especially for tryptophan emission, the signal is degraded to 1% of its initial intensity after 10 million years for chlorophyll and 1.4 million years for tryptophan.
These figures are calculated for cyanobacteria exposed to the unshielded martian surface cosmic ray flux, but for an endolithic microbial community sheltered under a rocky overhang 1–1.5 m thick (yet receiving sufficient scattered sunlight for periods of photosynthesis), the dose rate is reduced substantially to around 30 mGy/year (McKeever et al., 2003; Dartnell et al., 2007a, 2007b), consequently yielding biosignature degradation rates around 5 times slower. However, depending on the initial localized cyanobacterial population and emission detection threshold of the instrument, fluorescence biosignatures of cyanobacteria exposed on the martian surface will become erased by cosmic radiation.
Cyanobacteria are an ancient terrestrial lineage and colonize many Mars analog locations on Earth such as the Antarctic Dry Valleys and the Atacama Desert. While it could be argued that the photosynthetic machinery of martian photoautotrophs may closely resemble that of terrestrial cyanobacteria, through convergent molecular evolution or common descent (i.e., cross transfer of biospheres through lithopanspermia), this need not be true for photopigment fluorescence to represent a promising avenue for martian biosignature detection. Any solar photosynthetic system would be expected to be optimized for visible light absorption and subsequent transfer of this excitation energy to reaction centers. Harnessing sunlight to power redox transformations and generate a proton gradient for biochemical energy transduction or reduction of electron carriers for driving subsequent carbon fixation may be a universal feature of life. The function of such a photosystem is improved by the greater light collection cross section and spectral coverage offered by antenna pigments (Vermaas et al., 2008), which absorb short-wavelength photons and transfer this excitation energy to other pigments in a succession of complex molecules with excitation and emission spectra tuned to each other, such as the PBS and photosystem complex of terrestrial cyanobacteria. The rate and thus efficiency of energy transfer from one chromophore to another is dependent on the degree of spectral overlap between the fluorescent emission of the donor and the absorption of the acceptor (Frank et al., 1997). So even martian photosynthesizers with different, independently derived, light-collection machinery would still be expected to exhibit fluorescence and with a conspicuously large Stoke shift between excitation and eventual re-emission, that is, red fluorescence from a short-wavelength excitation light source. This makes fluorescence surveying an attractive technology for detecting any photoautotrophs. As this study has shown, however, photopigment fluorescence, as well as reflectance spectral features, are reduced by cosmic rays on the martian surface, and this will limit the window of opportunity for detection.
Footnotes
Acknowledgments
The research leading to these results has received funding from the European Community's Seventh Framework Programme (FP7/2007-2013) under grant agreement n° 241523 PRoViScout
Author Disclosure Statement
No competing financial interests exist for any of the authors.
Abbreviations
APC, allophycocyanin; EEM, excitation-emission matrix; FCCs, fluorescent chlorophyll catabolites; NAD, nicotinamide adenine dinucleotide; NADP, nicotinamide adenine dinucleotide phosphate; PBS, phycobilisomes; PC, phycocyanin; PE, phycoerythrin; PEC, phycoerythrocyanin.