
Abstract
Motivated by the increasingly abundant evidence for hypersaline environments on Mars and reports of methane in its atmosphere, we examined methanogenesis in hypersaline ponds in Baja California Sur, Mexico, and in northern California, USA. Methane-rich bubbles trapped within or below gypsum/halite crusts have δ13C values near −40‰. Methane with these relatively high isotopic values would typically be considered thermogenic; however, incubations of crust samples resulted in the biological production of methane with similar isotopic composition. A series of measurements aimed at understanding the isotopic composition of methane in hypersaline systems was therefore undertaken. Methane production rates, as well as the concentrations and isotopic composition of the particulate organic carbon (POC), were measured. Methane production was highest from microbial communities living within gypsum crusts, whereas POC content at gypsum/halite sites was low, generally less than 1% of the total mass. The isotopic composition of the POC ranged from −26‰ to −10‰. To determine the substrates used by the methanogens, 13C-labeled methylamines, methanol, acetate, and bicarbonate were added to individual incubation vials, and the methane produced was monitored for 13C content. The main substrates used by the methanogens were the noncompetitive substrates, the methylamines, and methanol. When unlabeled trimethylamine (TMA) was added to incubating gypsum/halite crusts in increasing concentrations, the isotopic composition of the methane produced became progressively lower; the lowest methane δ13C values occurred when the most TMA was added (1000 μM final concentration). This decrease in the isotopic composition of the methane produced with increasing TMA concentrations, along with the high in situ methane δ13C values, suggests that the methanogens within the crusts are operating at low substrate concentrations. It appears that substrate limitation is decreasing isotopic fractionation during methanogenesis, which results in these abnormally high biogenic methane δ13C values. Key Words: Carbon isotopes—Methane—Evaporites—Guerrero Negro—Life in extreme environments. Astrobiology 12, 89–97.
1. Introduction
T
Methanogens, those microbes that produce methane, are anaerobic archaea. They are able to use only a limited number of substrates in the production of methane, with the two main methane-producing pathways being the reduction of CO2 by hydrogen gas (hydrogenotrophic methanogenesis) and the assimilation of acetate (acetotrophic methanogenesis). Sulfate reducers generally out-compete methanogens for these substrates (hydrogen and acetate) based on thermodynamic considerations (e.g., Froelich et al., 1979), which is why methane production in sediments tends to occur below the depth of sulfate penetration.
Under conditions of high sulfate concentrations, methanogens can get around the competition with sulfate reducers and produce methane to some extent by using noncompetitive substrates, those substrates that are not used by sulfate reducers, such as the methylamines, methanol, and dimethylsulfide (King et al., 1983). The use of noncompetitive substrates is thought to be of greater importance in hypersaline environments (Oremland et al., 1982), both because of the high concentrations of sulfate found in these environments and the abundance of noncompetitive substrate precursors. For example, glycine betaine, an osmolyte used by organisms such as cyanobacteria in hypersaline environments (Reed et al., 1984), can be rapidly transformed to trimethylamine (King, 1984), which provides a ready supply of substrate for methanogens. Similarly, methanol is also readily available in hypersaline environments due to the bacterially mediated breakdown of pectin (Ollivier et al., 1994).
One way to gain information on methane production pathways is through stable isotope analysis (Conrad, 2005). Methane produced through methanogenesis (biogenic methane) tends to have δ13C values <−50‰, with CO2 reduction producing methane in the range of ∼ −110‰ to −60‰, and acetate assimilation in the range of ∼ −70‰ to −50‰ (Whiticar, 1999). Although less is known about the isotopic composition of methane produced from the noncompetitive substrates, the work that has been done with cultured methanogens (Krzycki et al., 1987; Summons et al., 1998; Londry et al., 2008) suggests that the isotopic composition of the methane produced from both the methylamines and methanol would be more depleted in 13C than methane produced from either acetate or CO2/H2. Methane produced through the transformation of organic matter at high temperatures and pressures (thermogenic methane) tends to have δ13C values >−50‰. (Whiticar, 1999).
Since the isotopic composition of the methane also depends on the isotopic composition of the starting material (the substrates), the magnitude of this isotopic effect for methanogenesis can be described by its fractionation factor, α:
where δ13Csubstrate is the stable carbon isotopic composition of the substrate, and δ13Cmethane is the stable carbon isotopic composition of the methane produced from that substrate (Conrad, 2005). Fractionation factors for methane production tend to increase from acetate (∼1.01 to 1.03) to dimethylsulfide (∼1.04 to 1.05) to CO2 and trimethylamine (∼1.05 to 1.07) to methanol (∼1.07 to 1.09) utilization (Whiticar, 1999; Conrad, 2005).
Methane production rates and carbon isotopic composition of methane produced, as well as released in the form of bubbles, were measured at a number of hypersaline ponds in northern California and Baja California Sur that range in salinities from 55 parts per thousand (ppt) to about 300 ppt. In addition, 13C-labeled substrates were added to incubation vials to determine substrates used by the methanogens and to relate that information back to the isotopic composition of the methane. Since we did not obtain the isotopic composition of the substrates in situ, we report apparent fractionation factors (Chanton et al., 2005; Conrad, 2005), using the δ13C value of particulate organic carbon (POC) as a proxy for all substrates (Potter et al., 2009).
2. Study Sites
Samples were obtained from the Alviso region of the Don Edwards National Wildlife Refuge in northern California, USA, and from the Exportadora de Sal salterns in Guerrero Negro, Baja California Sur, Mexico (Fig. 1). The Don Edwards National Wildlife Refuge, which consists of approximately 23,000 acres and over 30 ponds, is located in South San Francisco Bay and had been used for salt production. The United States Fish & Wildlife Service, current manager of the refuge, is in the process of restoring the area back into wetlands. Two sites, Pond 15 and Pond 23, were sampled in January 2010 and August 2010. At Pond 15 (∼120 ppt salinity), a very thin, soft microbial mat was present on top of black mud that extended to a depth of 8–10cm. Below this, gray mud became the dominant sediment. Pond 23 (∼300 ppt salinity) was capped by a gypsum and halite crust. This crust had endolithic microbial communities present (i.e., endoevaporitic mats), as indicated by the green and pink coloring within the crust, and overlaid black, sulfur-rich mud.
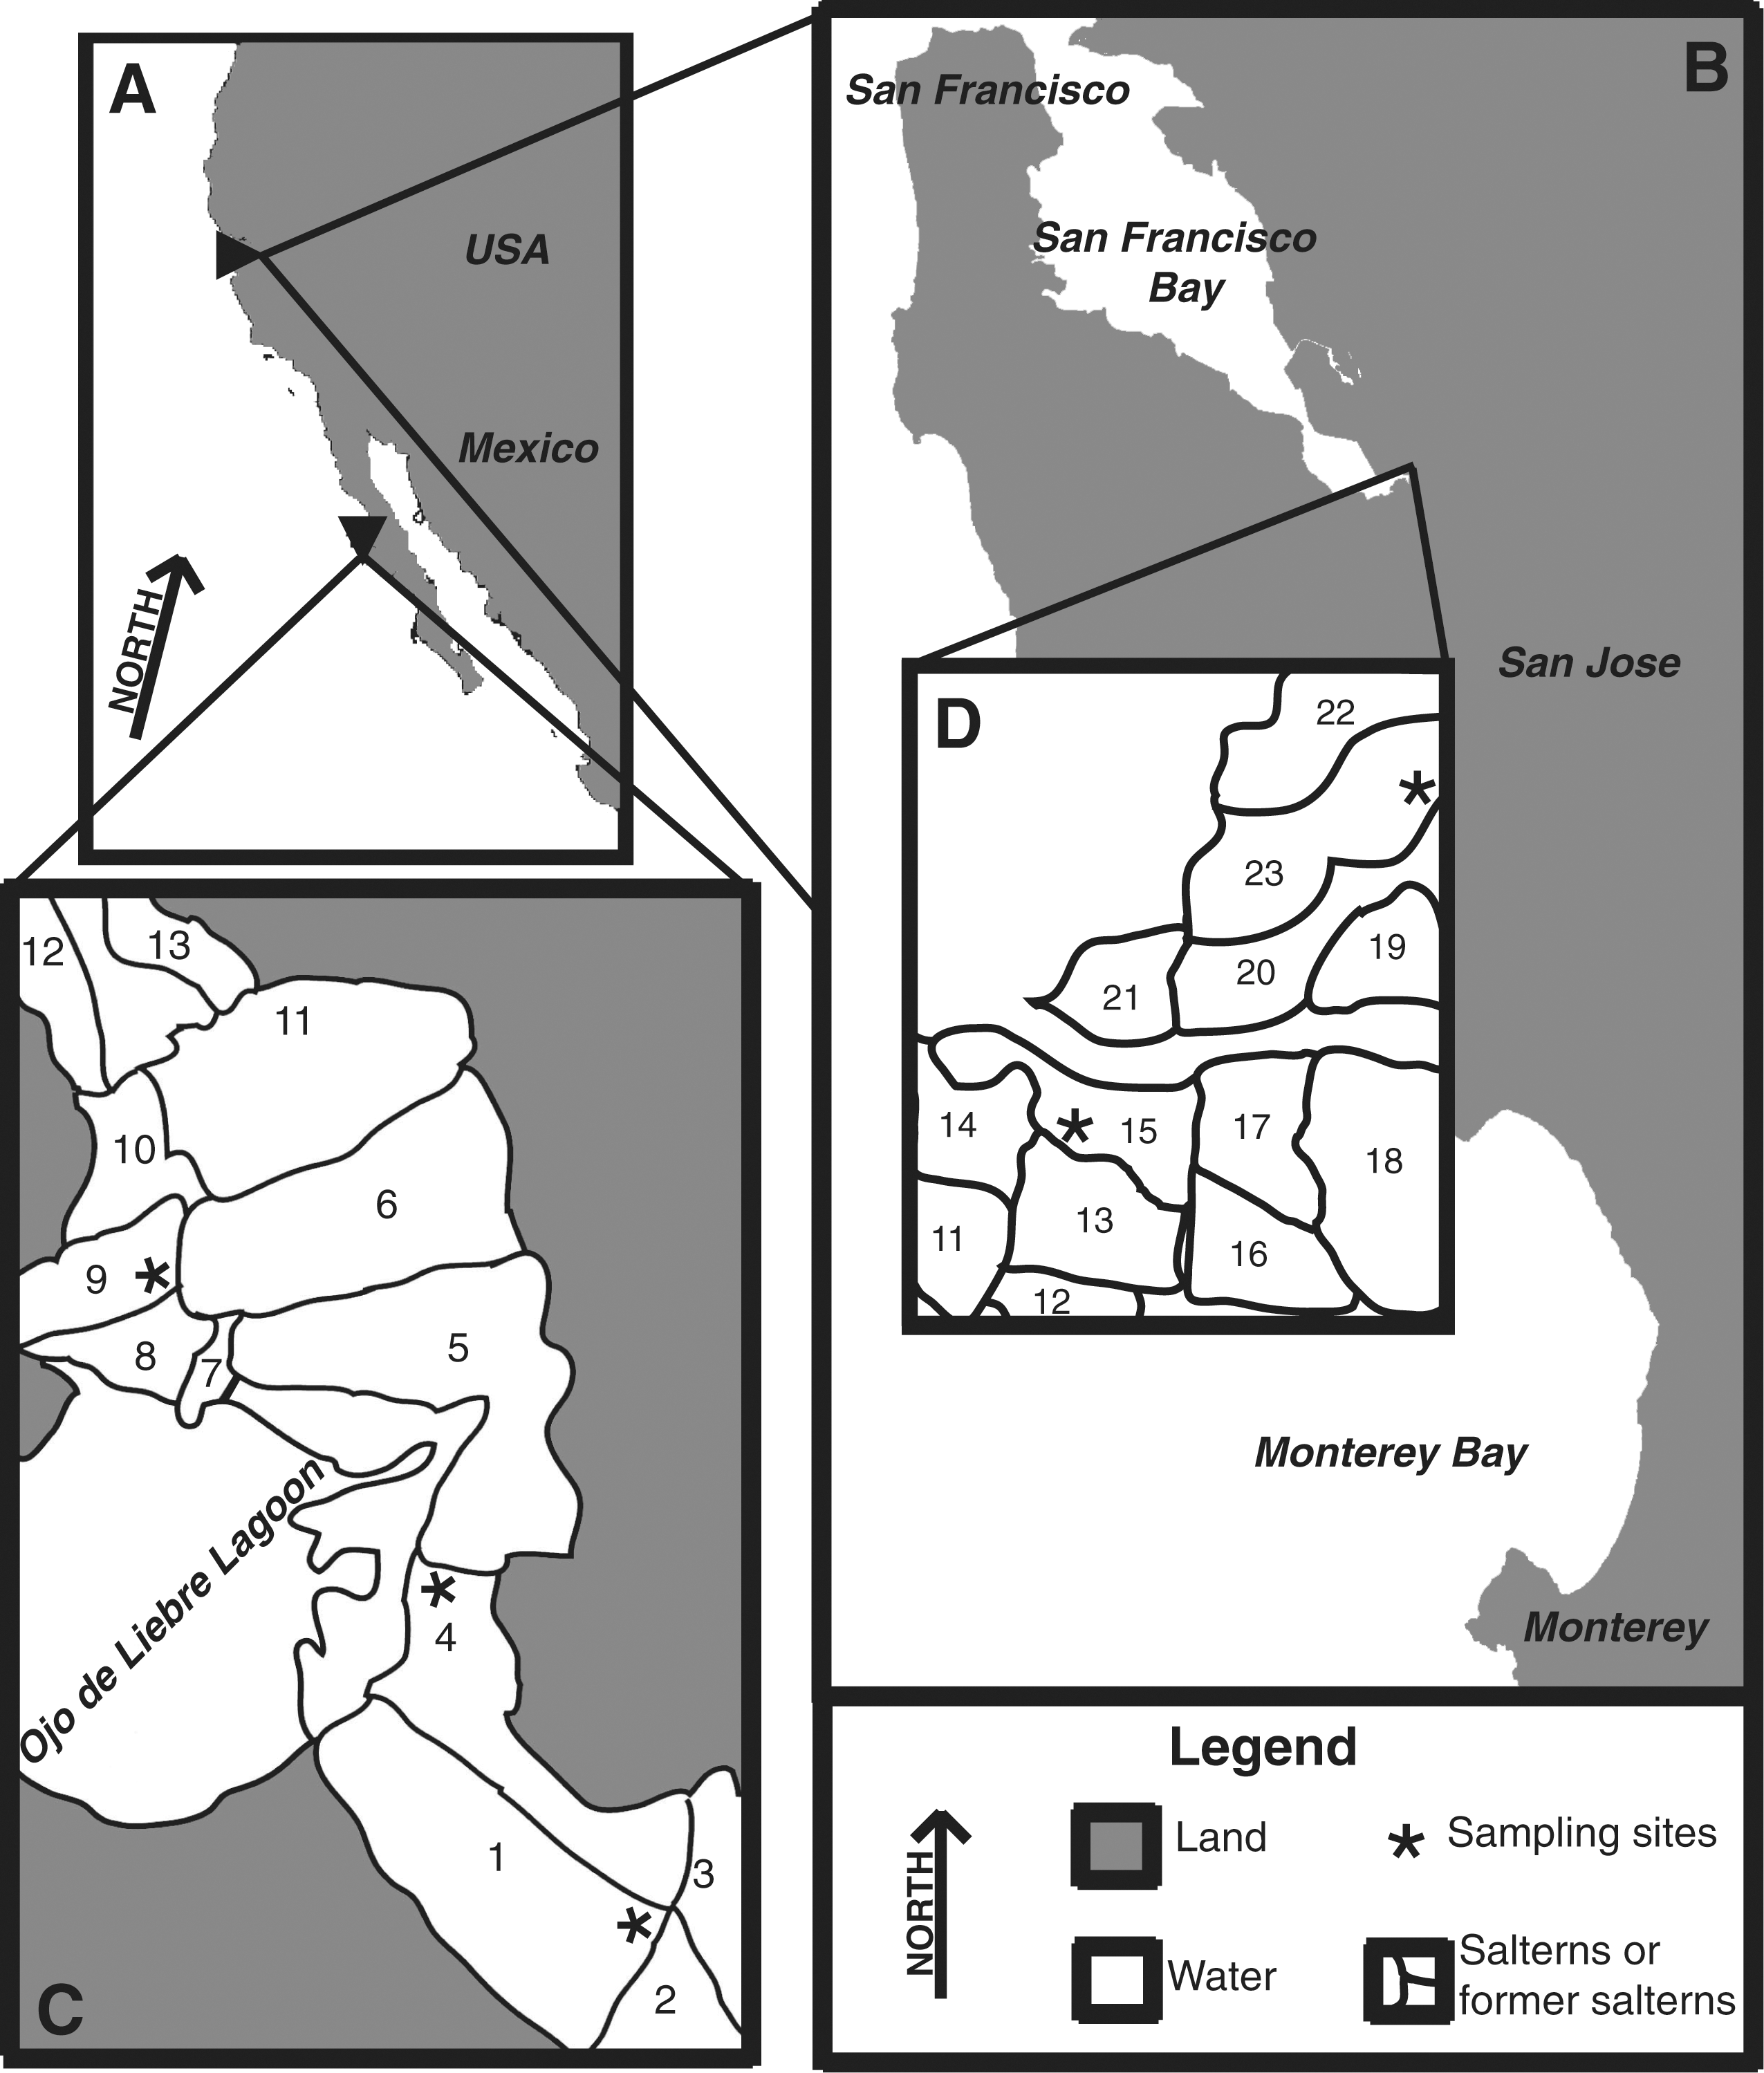
Maps of the northern California and Guerrero Negro study sites. The triangle pointing right in (
At the other site sampled, the Exportadora de Sal salterns in Guerrero Negro, salt is produced by evaporating seawater supplied from the Pacific Ocean via the Ojo de Liebre Lagoon. The water moves by gravity flow until saturation with NaCl is reached (Shumilin et al., 2002). This process takes place over the span of 13 ponds, with pond numbers increasing with increasing salinity. Areas 1, 4, and 9 of Exportadora de Sal were sampled in March and October 2009. Thick, soft, well-laminated microbial mats were found at Areas 1 (∼55 ppt salinity) and 4 (∼90 ppt salinity). Area 9 (∼190 ppt salinity) was capped by a gypsum crust, which was also populated with an endoevaporitic mat. This crust overlaid gypsum rubble, surface tan mud, and deeper black sand.
3. Methods
Samples of soft mat and crust/sediment were obtained from each of the sites (Ponds 15 and 23 from Don Edwards and Areas 1, 4, and 9 from Guerrero Negro). In addition, overlying water to be used in incubations was also obtained from each site. Salinity of the overlying water was determined with a handheld refractometer. Methane-rich bubbles were collected in triplicate (at least) at all sites except Area 4 of Guerrero Negro; no bubbles were observed at this site. The bubbles were collected by either breaking through the gypsum/halite crust or perturbing the soft mat and sediments and trapping the released bubbles in a capped, inverted funnel. The bubbles were then transferred with a gas-tight syringe to an evacuated serum vial.
Methane production rates from soft mat and crust/sediment samples were determined from incubations of slurries in serum vials. In the case of Areas 1 and 4, the upper 1–3 cm of the soft microbial mat was used. At Pond 15, the thin microbial mat was homogenized with the upper 8–10 cm of black mud. Short cores (∼10 cm) of crust and sediments were obtained from Pond 23 and homogenized. Area 9 was subsampled into the top gypsum crust, underlying gypsum rubble, and the surface tan mud (upper ∼8 cm) and deep black sandy sediment (∼8 to ∼20 cm) below. The crust and rubble were broken into small pieces before incubating, while the sediment intervals were homogenized. The rubble of Area 9 was sampled in both March and October 2009, while the crust was sampled only in October 2009 and the sediments only in March 2009. Approximately 10–20 g of the various samples from the sites were placed in 38 mL serum vials with 10 mL of deoxygenated (N2-purged) corresponding site water to make the slurries. After capping with blue butyl rubber stoppers, the headspace was flushed with N2 to remove any O2. The samples were incubated in the dark in the lab at room temperature (∼22°C). In situ water temperatures averaged 21±1°C and 27±3°C for March and October, respectively, at the Guerrero Negro sites, and 13±1°C and 32±8°C for January and August, respectively, at the Don Edwards sites (Table 1). Since temperatures within these shallow ponds vary substantially, both diurnally and seasonally, no attempt was made to mimic in situ temperatures with the incubations. Methane concentration in the vial's headspace was measured through time; three to seven time points were used to determine the production rate. Incubations lasted anywhere from about a week to a month, depending on the rate of increase of methane within the headspace.
Error estimates (either standard deviations or half the range) are presented in parentheses.
n.d.=not determined.
Since most of the methane at Area 9 was produced within the gypsum crust and rubble, it was assumed that the bubbles collected from the site did not come from the sediments.
Because of the concern that methane could increase in the headspaces of the incubation vials due to physical de-gassing from the crusts, killed controls were used. At Guerrero Negro, a high concentration of sodium hydroxide [made up in site water to yield 0.1 M NaOH final concentration (∼ pH 13)] was used to kill the microbes in the Area 9 crust and Area 9 rubble incubations. At Don Edwards, 5% paraformaldehyde (diluted down from 20% in site water) was used.
To determine the substrate(s) used by the methanogens in these environments, 99% 13C-labeled substrates [trimethylamine (TMA), monomethylamine (MMA), methanol, acetate, and bicarbonate] obtained from Sigma-Aldrich were added to incubation slurries, and the evolved methane was monitored for 13C content. MMA was used for the March 2009 sampling trip to Guerrero Negro; TMA was used for all later trips. The 13C-labeled bicarbonate was added to a final concentration of 10 μM in the slurry. Previous analyses of dissolved inorganic carbon concentrations within the soft microbial mats of Guerrero Negro were approximately 2–8 mM (Potter et al., 2009), so this small addition of 13C-labeled bicarbonate would not substantially change the total concentration of dissolved inorganic carbon. However, in situ concentrations of TMA, MMA, methanol, and acetate at these sites are unknown, so a range of substrate concentrations (0.1, 1, and 10 μM final concentration) was used. Individual incubation vials received one substrate at one concentration (in triplicate), and so a suite of 33 vials, including the controls with no added substrate, was used for each site. Production rates from the 13C-amended incubations were also determined by measuring methane concentration in the vial headspace over time. It was assumed that, if the substrate additions at these concentrations did not increase methane production over the controls, then the pool of substrate was not substantially increased by the 13C-labeled addition.
Additional incubation experiments were conducted with samples collected from Pond 23 of Don Edwards in January and August 2010. Incubation vials were set up similar to those used for production measurements (∼10–20 g crust/sediment with 10 mL deoxygenated site water). TMA (at −40‰) was added at increasing concentrations (10, 100, and 1000 μM final concentration). The isotopic composition of the evolved methane was measured after incubating for 7–10 days.
The stable isotopic composition of the methane from bubbles and incubations was determined by using a gas chromatograph interfaced with a ThermoQuest Finnegan Delta Plus isotope ratio mass spectrometer. When methane concentrations were not high enough for direct injections (∼1000 ppm), cryofocusing with ethanol and liquid N2 traps were used to amplify the signal (Rice et al., 2001).
The δ13C values and concentrations of the POC of the soft microbial mats and crust/sediments from each site were also determined, following the method of Hedges and Stern (1983). Triplicate subsamples of the same materials used in the methane incubation experiments were used for POC analyses. These samples were dried, crushed with a mortar and pestle, and any inorganic carbon was removed with 10% HCl. Samples were then re-dried and analyzed with an elemental analyzer connected to a ThermoQuest Finnigan Delta Plus XL isotope ratio mass spectrometer. Acetanilide and dextrose were used as standards for both concentrations and isotopic values.
4. Results
There was a significant change in the physical structure of the microbial mats that corresponded to salinity. At sites with salinities below about 120 ppt, soft microbial mats occurred; at sites with salinities above about 180 ppt, evaporitic crusts of gypsum and halite occurred containing endoevaporitic mats. The POC content of these crusts was low (Table 1). Associated with this change in mat structure was a change in the stable isotopic composition of the methane (both the bubbles collected at the sites, as well as the methane produced during incubations). At sites with soft microbial mats (lower salinities), the isotopic composition of the methane was much lower, by approximately 10‰ to 20‰, than methane produced at the higher salinities (Table 1). At the higher-salinity sites, the isotopic composition of the methane falls outside the range generally considered to be biogenic (∼−110‰ to −50‰; Whiticar, 1999).
Interestingly, there was no systematic change in methane production across the salinity gradient. Relatively high methane production rates were measured at both low-salinity (Area 1) and high-salinity ponds (Area 9). In fact, the highest methane production rates occurred within the endoevaporitic mats of the gypsum crust site of Area 9 (Fig. 2). The lowest rates of methane production were also observed at Area 9, in the sediments (Table 1). Using a strong NaOH solution for the killed controls (a common practice in most environments) at Guerrero Negro was not entirely successful (Table 1), although methane production was reduced 15- to 25-fold. High pH can be effective at stopping the growth of many types of microorganisms; however, those microbes capable of living under conditions of hypersalinity appear to be more tolerant of high pH (Jones et al., 1998). Switching to a 5% solution of paraformaldehyde at the Don Edwards sites was successful at stopping methanogenesis (Table 1).
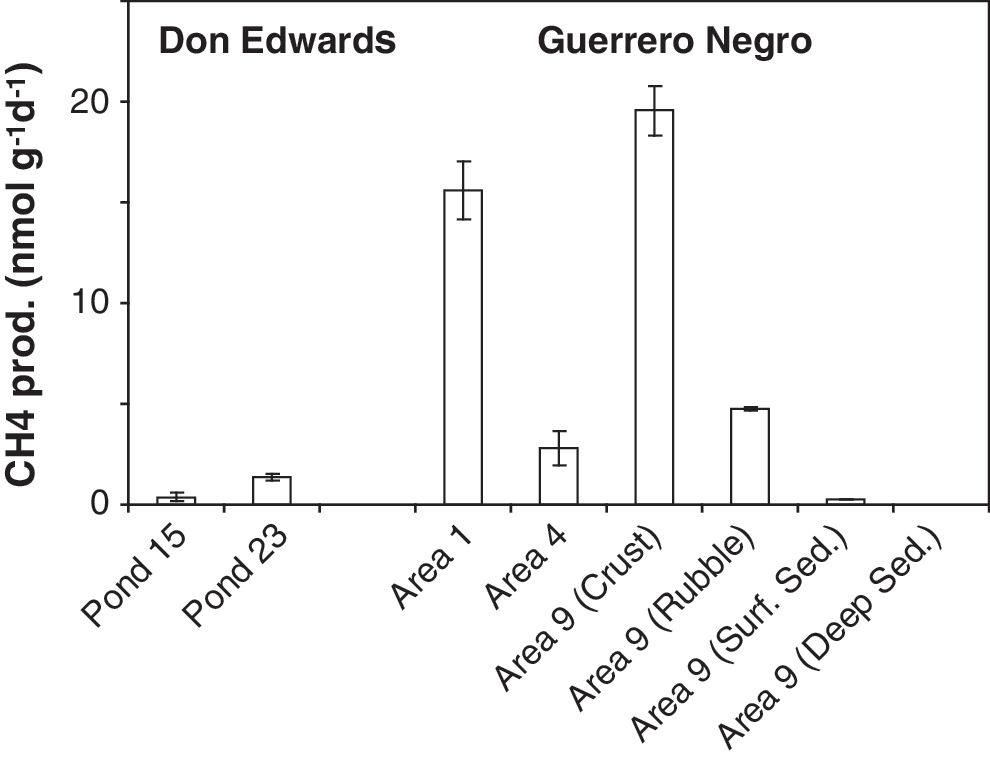
Methane production rates from sites at Don Edwards National Wildlife Refuge (Ponds 15 and 23) and the hypersaline sites in Guerrero Negro (Areas 1, 4, and 9). Rates were averaged across sampling times.
When 13C-labeled substrates were added to incubation vials, both the methylamines (MMA and TMA) and the methanol produced substantially 13C-enriched methane at all sites, with the methane from the methylamines becoming more enriched in 13C than the methane produced from the 13C labeled methanol (Fig. 3). This enrichment in the methane indicated that these substrates were being taken up and used by the methanogens. This occurred even with the Area 9 sediments. Although we observed no statistical increase in methane in the headspaces of the incubation vials in the deep sediments of Area 9 (Table 1), some methanogenesis had to have occurred, as 13C-labeled methane was measured after incubating with MMA and methanol. The more common methanogenic substrates, acetate and bicarbonate, did not appear to be utilized for methane production at any of the sites, including the sediments of Area 9.
Isotopic composition of methane produced from the incubation of 13C-labeled substrates at a final concentration of 1 μM, except for bicarbonate, which was added to a final concentration of 10 μM. The control (open), acetate (horizontal lines), and bicarbonate (hatched) bars are plotted against the lower axis, while the TMA (gray) and methanol (black) bars are plotted against the upper axis. Values for TMA for Ponds 15 and 23 of Don Edwards are printed above the TMA bar since they are off scale. Data for the Don Edwards ponds were obtained in January 2010, while Areas 1 and 4 from Guerrero Negro are combined data from March and October 2009. The Area 9 data (both crust and rubble) were obtained in October 2009.
Because of the possibility of stimulating methane production by the addition of relatively low concentrations of labeled substrates, the production rates were monitored in vials with added 13C-labeled substrates. Methane production measurements determined from these samples showed no stimulation (Fig. 4); the production rates were similar to the controls. Because there was no stimulation, it was therefore assumed that the total concentration of each of the substrates was not substantially increased by the 13C addition and that the 13C-labeled substrate uptake and use by the methanogens was indicative of what was occurring in situ.
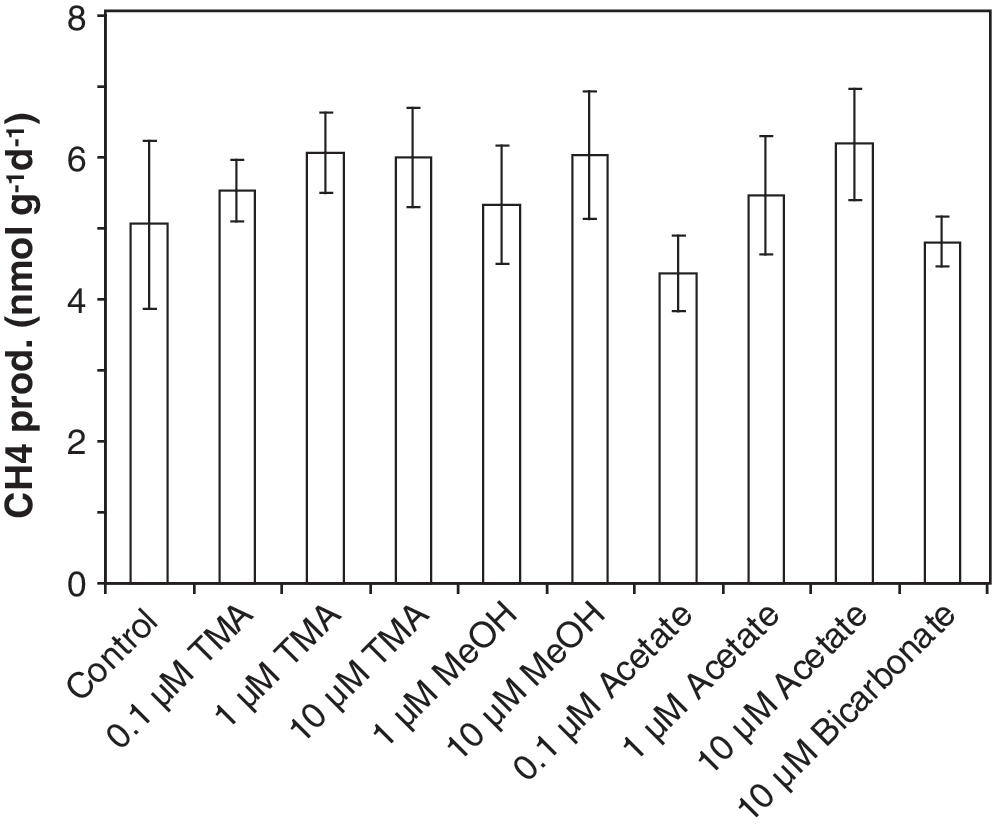
Methane production measurements from the gypsum rubble of Area 9, sampled in October 2009. The other sites were similar; the methane production from incubations with added substrates was comparable to that of the control. MeOH=methanol.
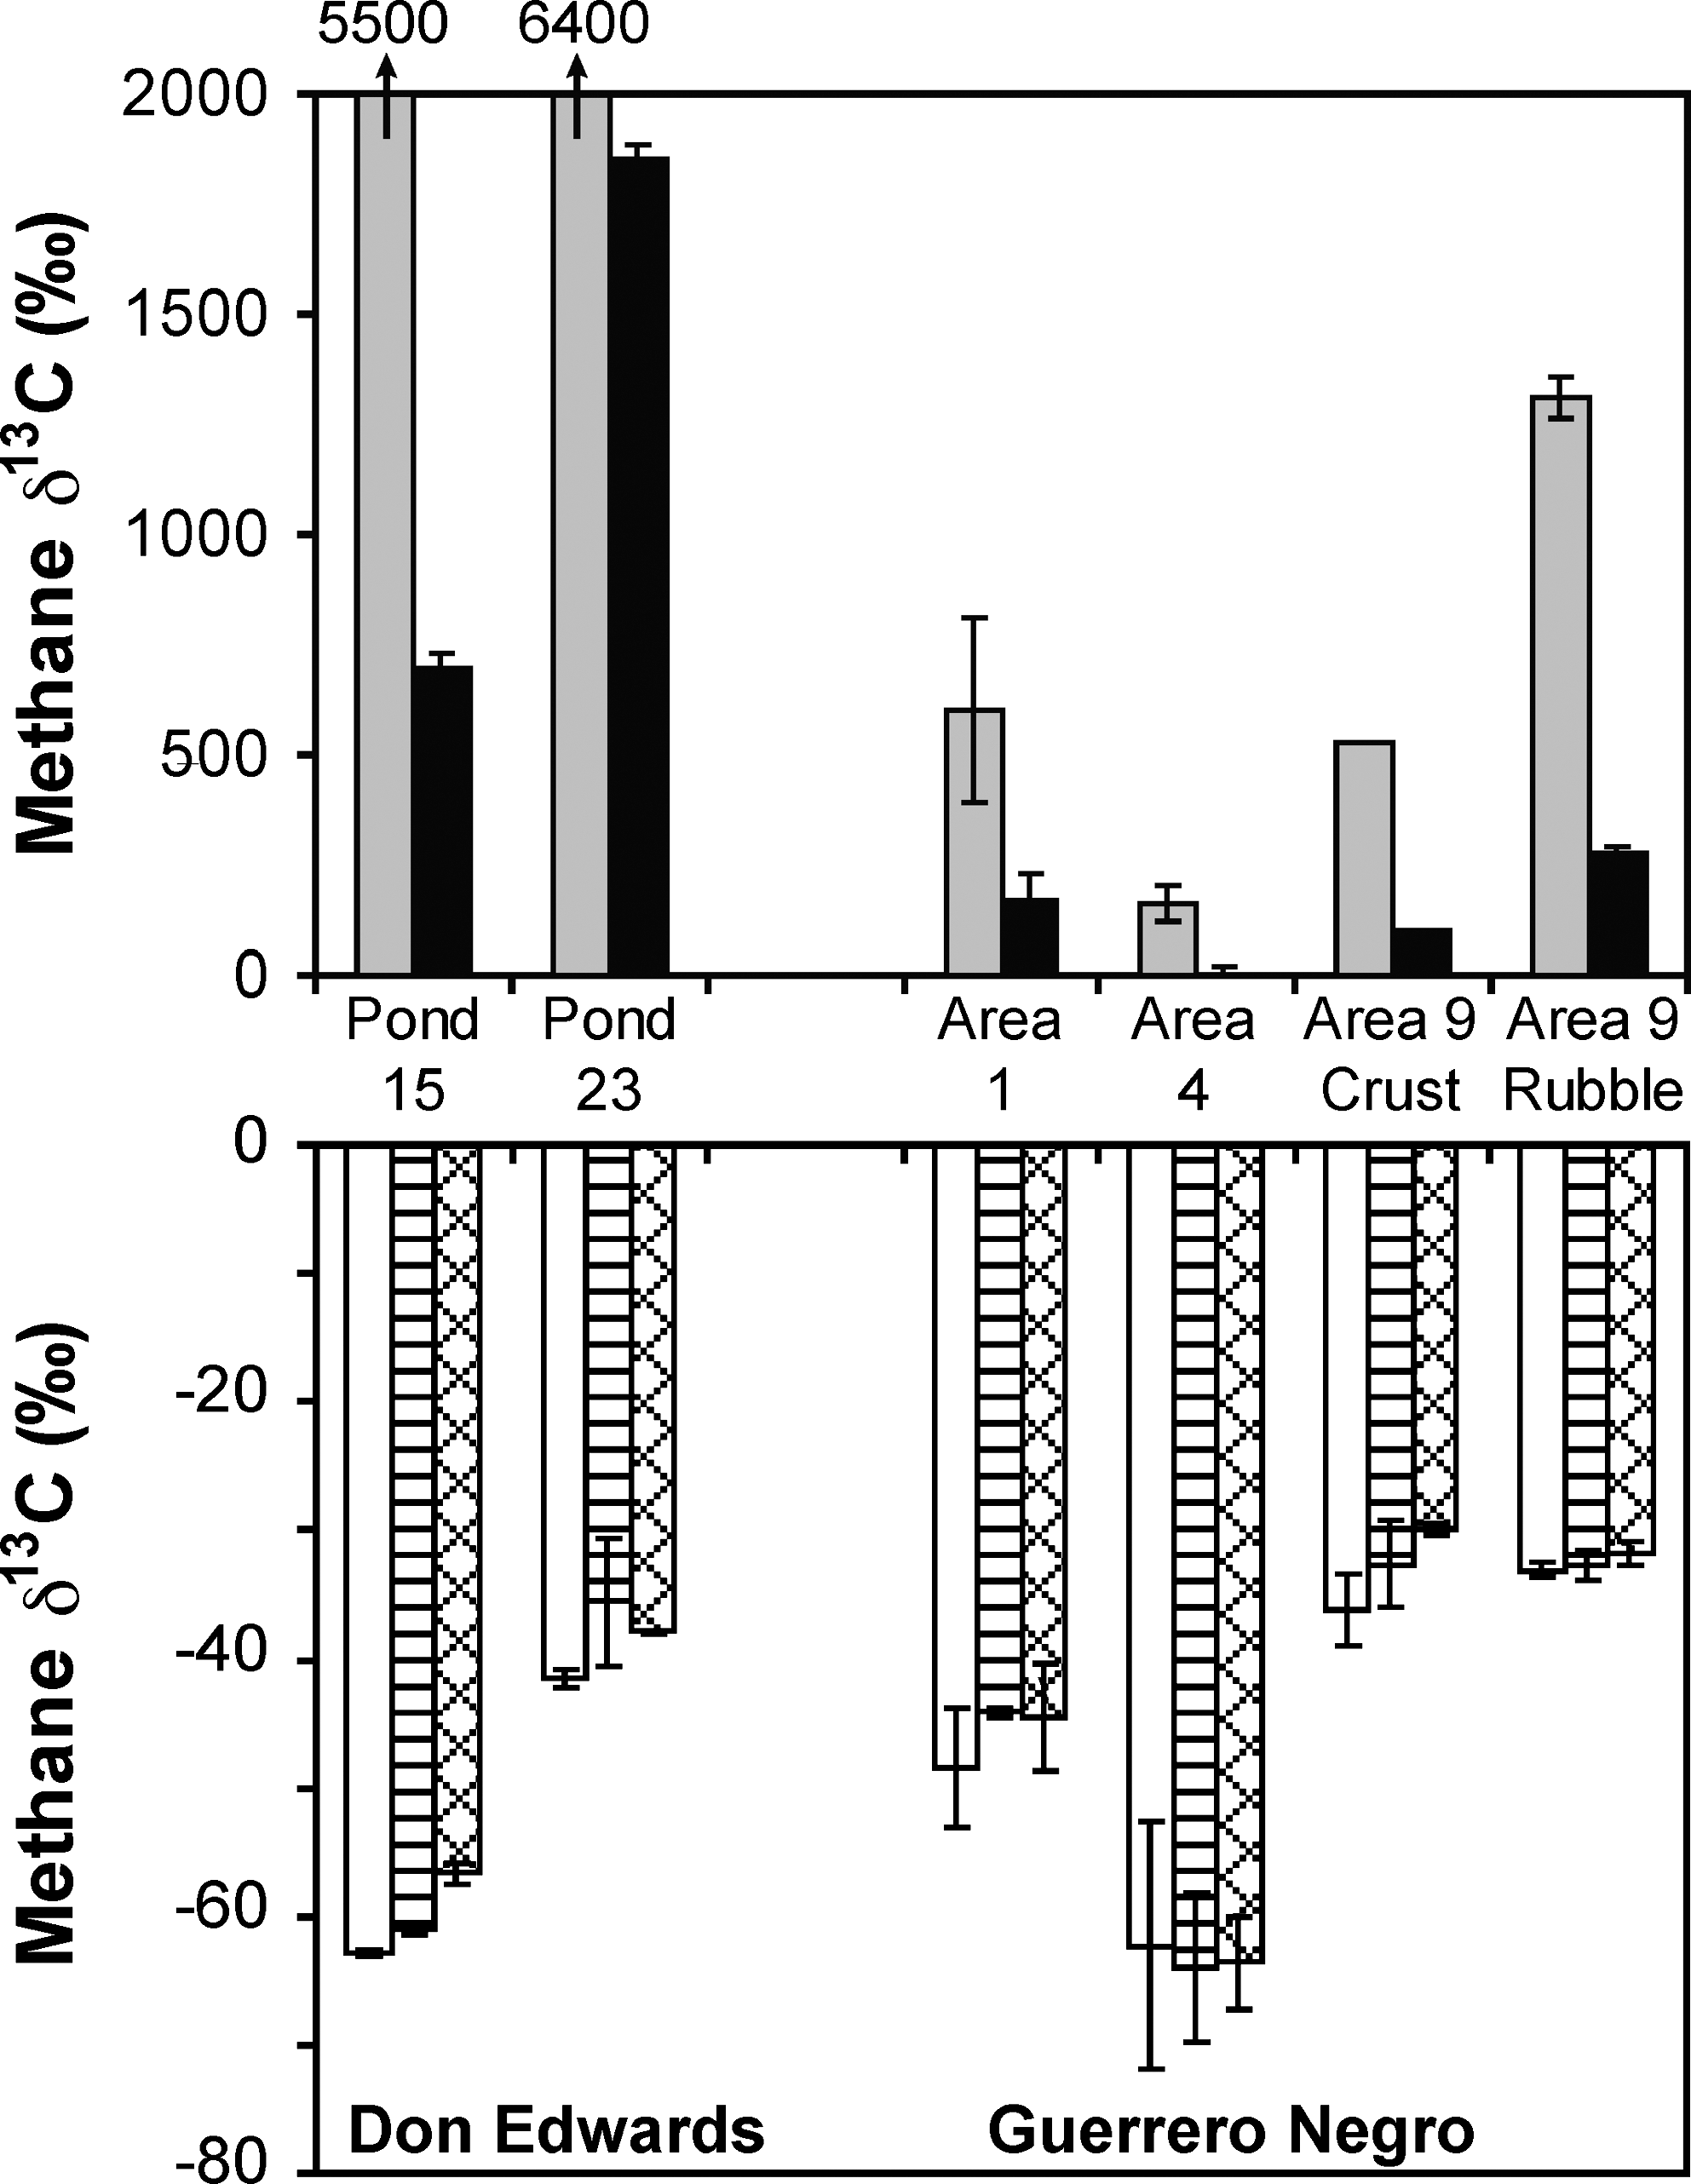
The POC δ13C values were fairly consistent across sites (Fig. 5a), ranging from −14.7‰ to −10.3‰ at the Guerrero Negro sites and −25.8‰ to −19.7‰ at the Don Edwards sites (Table 1). The POC content of the sites, however, varied as a function of salinity, mirroring inversely the methane isotope values (Fig. 5). The percent POC was higher at the lower-salinity sites where methane δ13C values were lower, and the percent POC was lower at the higher-salinity sites where methane δ13C values were higher (Fig. 5b). Lowest POC concentrations and highest methane δ13C values were found at sites that contained endoevaporitic mats. When averaged POC and methane δ13C values for each site were used, apparent fractionation factors ranged from 1.02 to 1.05 (Fig. 6).
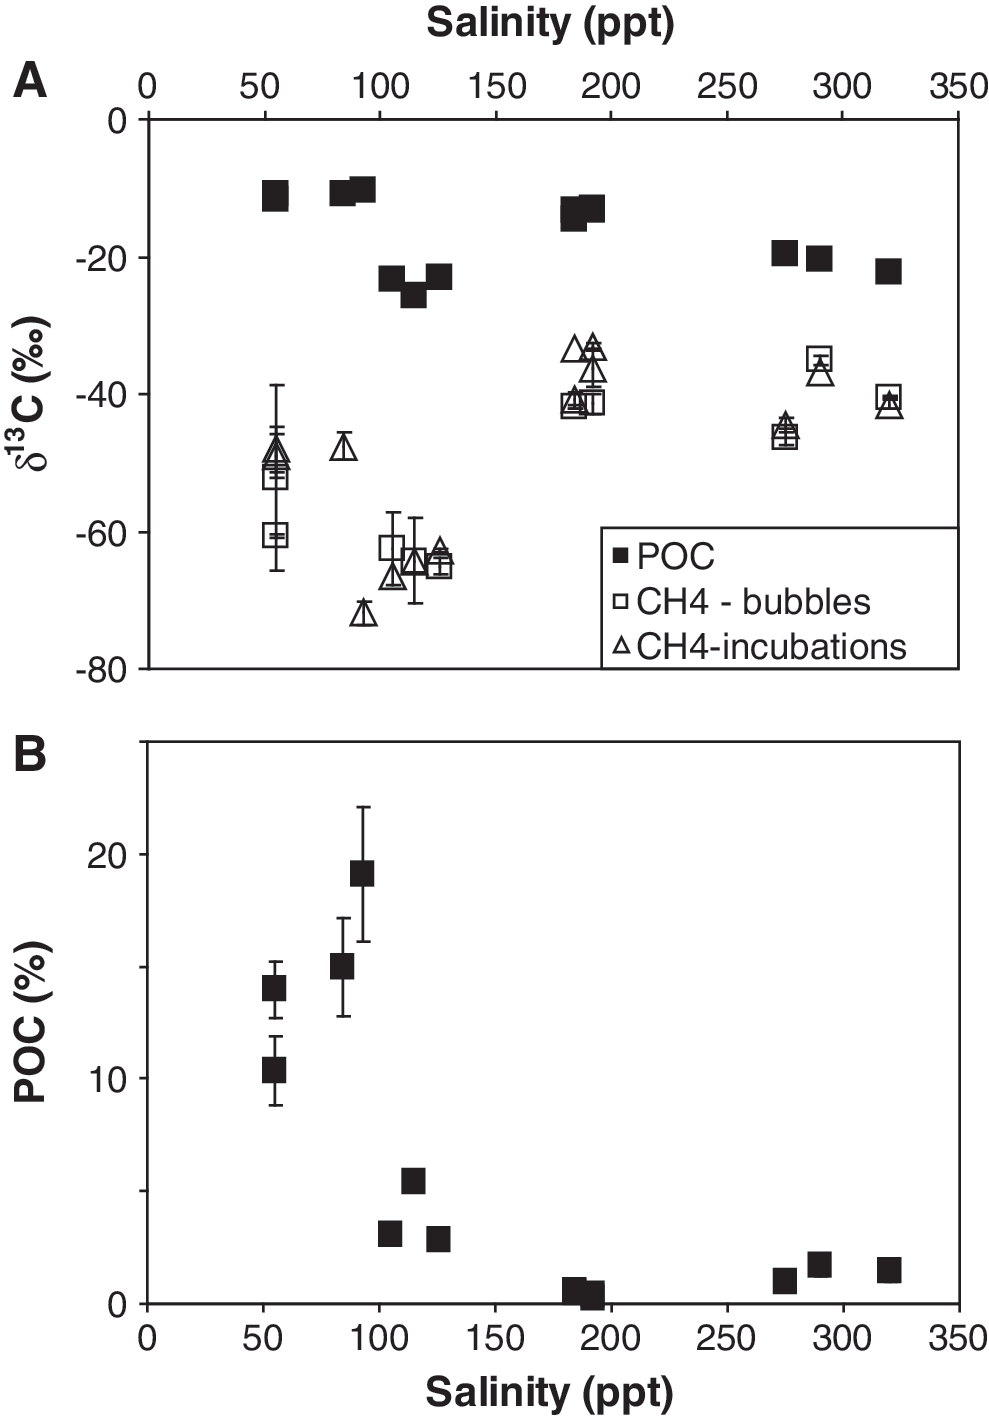
Stable isotopic composition of POC and methane (both bubbles and produced in incubations) (
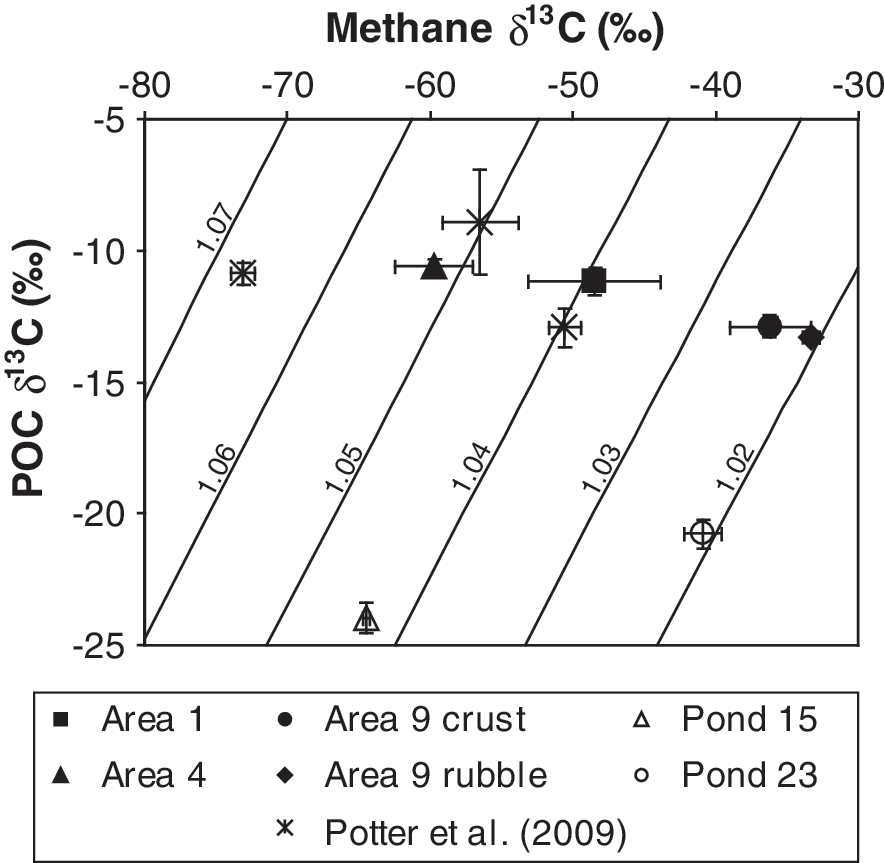
Averaged POC δ13C values plotted against the averaged δ13C values of methane produced during incubations for each site. The diagonal lines represent fractionation factors equal to the corresponding numbers (i.e., 1.07, 1.06, 1.05, 1.04, 1.03, and 1.02). Included in the figure are the data from Potter et al. (2009).
For the TMA addition experiments conducted at Pond 23 of Don Edwards, the isotopic composition of the evolved methane became progressively lower with increasing amounts of TMA (Fig. 7). When 100 and 1000 μM TMA were added to the samples, the isotopic composition of the methane produced resembled the isotopic composition of typical methane from fresh or marine wetlands (i.e., within the “biogenic” region).
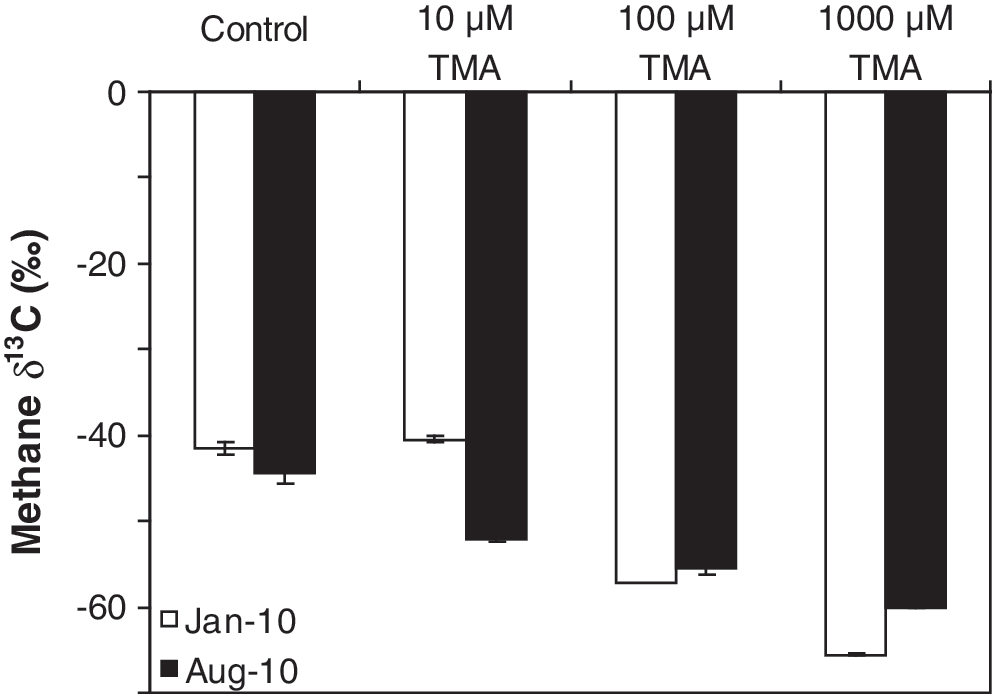
Stable isotopic composition of methane produced from Pond 23 of the Don Edwards National Wildlife Refuge with increasing concentrations of TMA. The isotopic composition of the added TMA was −40‰.
5. Discussion
Methane that is as enriched in 13C as that observed at the high-salinity sites is generally thought to be either thermogenic in origin or biological methane subjected to methane oxidation. Both of these scenarios are unlikely for the hypersaline environments described here. Biological methane production is occurring within the incubation vials with the demonstrated release of 13C-labeled methane from 13C-labeled methylamines and methanol. When either 0.1 M NaOH or 5% paraformaldehyde was added to incubation vials as killed controls, production slowed drastically or ceased (Table 1), which again indicates the biogenicity of the produced methane.
Methane oxidation is also unlikely, as it results in the residual methane becoming enriched in both heavier isotopes, 13C and 2H, through the preferential uptake by methanotrophs of the lighter isotopes, 12C and 1H (Coleman et al., 1981). Although the methane released from the high-salinity sites is 13C-enriched, when the stable hydrogen isotopic values (δD values) of the methane were determined, no enrichment in 2H was found (Tazaz et al., 2009). In addition, methane oxidation has not been detected in hypersaline environments (Conrad et al., 1995; Bebout et al., 2004), probably as a result of the low salinity tolerances of methane-oxidizing bacteria (Oren, 1999, 2002). Neither oxidation nor thermogenic origins can account for the high methane δ13C values observed at these sites in both Guerrero Negro and Don Edwards.
At all sites, methane was produced from noncompetitive substrates, as determined from the 13C-labeling experiments (Fig. 3). Because of the high sulfate concentrations at these sites, the use of these noncompetitive substrates is not surprising; it is likely that sulfate-reducing bacteria at the sites out-compete the methanogens for available acetate and H2. Beyond the competition with sulfate-reducing bacteria, salinity tolerances of known methanogens also favor the use of noncompetitive substrates under high salt conditions (Oren, 2002). While no evidence of them was observed at our field sites, hydrogenotrophic and acetotrophic methanogenesis have been reported at a hypersaline mud volcano site in the Mediterranean Sea, although methylotrophic (both methylamine and methanol) methanogenesis occurred throughout the sediment column and was the only significant source of methane in the shallow sediments (Lazar et al., 2011).
In addition to labeled substrate addition experiments, phylogenetic studies of methanogens in which molecular methods are used, such as methyl coenzyme M reductase
A range of apparent fractionation factors for methane production (1.02–1.05) was determined at the ponds of Guerrero Negro and Don Edwards (Fig. 6). Previous work at the Guerrero Negro ponds (Potter et al., 2009) suggested that differences in the apparent fractionation factors were due to changing methanogenic pathways (i.e., different substrates) as the ponds became more saline. However, incubations of labeled substrates, along with phylogenic studies, have shown that similar substrates, namely, the methylamines and methanol (Fig. 3), are used at all sites. Evidently, the different apparent fractionation factors are not caused by changing substrate use.
The use of trimethylamine and methanol as substrates should have produced methane on the order of 50–90‰ lower than the substrates themselves (fractionation factors of 1.05–1.09), based on culture studies (Krzycki et al., 1987; Summons et al., 1998; Londry et al., 2008). If the POC δ13C values are indicative of the substrates' values, then the methane produced at all the Guerrero Negro sites (average POC δ13C=−12.2‰) should have been between about −100‰ to −60‰; the methane at the two Don Edwards sites (average POC δ13C=−22.7‰) should have been between about −110‰ to −70‰. This was not the case. Instead, methane δ13C values produced at all sites ranged from −72‰ to −33‰ (Table 1), with the highest values produced from the endoevaporitic mats.
As noted above, POC concentrations were inversely correlated with methane δ13C values (low POC concentrations at sites with high methane δ13C values). Based on this correlation, it was hypothesized that the methanogens are operating under conditions where substrates are limited. This hypothesis was tested by the TMA addition experiments conducted with samples collected from Pond 23 of Don Edwards in January and August 2010. The resultant δ13C value of the methane produced got progressively lower with increasing amounts of TMA (Fig. 7), which is what would be expected if substrate limitation was occurring. When the higher concentrations of TMA were added to the samples, the isotopic composition of the methane produced falls within the biogenic region (Whiticar, 1999). This progressive lowering of methane δ13C values with increasing amounts of added substrate supports the hypothesis that the methanogens living in these endoevaporitic mats are substrate-limited in situ and so do not fractionate the methane carbon isotopes to the fullest extent possible.
Methanogens living at the Lost City hydrothermal vent system, located in the North Atlantic (Kelley et al., 2001, 2005), have also been described as being substrate-limited (Bradley et al., 2009). However, these authors were not able to use the high δ13C values of the methane (−13.6‰ to −8.8‰) within the vent fluids (Kelley et al., 2005) to support their claim, since the majority of the methane at Lost City is produced abiologically during serpentinization reactions (Bradley and Summons, 2010). Instead, they relied on the very high δ13C values, ranging from −2.9‰ to +6.7‰, of isoprenoidal diethers, which are indicative of methanogens (Bradley et al., 2009). These measurements of the isoprenoidal diethers were particularly useful in that they showed that methanogens were present, in an environment where most of the methane is abiogenic, and that they were operating under substrate limitation.
At both of these environmental sites (hypersaline ponds and hydrothermal vents), the methanogens operate under substrate-limited conditions and are not able to fractionate the methane carbon isotopes to the full extent seen in culture with unlimited substrate exposure. The isotopic composition of the methane (or lipids) produced more closely resembles the isotopic composition of the substrate, which results in unusually high methane (or lipid) δ13C values, despite high fractionation factors associated with the substrates. Environmental factors other than substrate limitation, such as temperature, pressure, microorganisms present, and so on (Blair et al., 1993; Botz et al., 1996; Summons et al., 1998; Whiticar, 1999; Conrad, 2005; Takai et al., 2008), can also result in fractionations that differ from culture studies, which underscores the need to understand the main variables that affect the isotopic fractionation of methane in natural environments.
6. Conclusions
Biogenic methane production was observed at the hypersaline sites studied, with highest production rates occurring within the endoevaporitic mat of the gypsum crust of Area 9 at Guerrero Negro. At these hypersaline sites, the noncompetitive substrates, methylamines (MMA/TMA) and methanol, were the preferred methanogenic substrates. Given published fractionation factors (and assuming POC and these substrates had similar stable isotopic values), these substrates should have resulted in methane isotope values from about −110‰ to −60‰. Instead, values of −72‰ to −33‰ were measured, with the lower (13C-depleted) values coming from the organic-rich soft microbial mat sites and the higher (13C-enriched) values from the organic-poor sites with gypsum/halite crusts containing endoevaporitic mats. The isotopic values of methane produced at the crust sites ranged from about −40‰ to −30‰, which falls outside the range generally considered to be biogenic. It was hypothesized that these high δ13C values were due to substrate limitation, and this hypothesis was supported by experiments. When progressively more substrate was added to a sample, the isotopic composition of the methane got progressively lower and resembled that of methane from fresh or marine wetlands. Such substrate limitation for methanogens resulting in abnormally high biogenic methane δ13C values may be characteristic of these endoevaporitic mat communities. Methane isotope data returned from Mars missions, particularly from those regions characterized by high chloride-containing minerals, should be evaluated in light of these results. High methane isotopic values outside the range generally considered to be biogenic due to substrate limitation in the martian environment could produce false negative results. The use of methane to ethane (plus propane) ratios (e.g., Bernard et al., 1976) along with isotopic analyses may help to determine biogenicity.
Footnotes
Acknowledgments
We would like to thank Adrienne Frisbee and Angela Detweiler for assistance in the field and lab, and the Exportadora de Sal de C.V. and the U.S. Fish and Wildlife Service for allowing continued access to the study sites. Financial support from the NASA Exobiology program and the University of Missouri's Research Board and Council is gratefully acknowledged.
Author Disclosure Statement
No competing financial interests exist.
Abbreviations
MMA, monomethylamine; POC, particulate organic carbon; ppt, parts per thousand; TMA, trimethylamine.