
Abstract
Although a large fraction of the world's biomass resides in the subsurface, there has been no study of the effects of catastrophic disturbance on the deep biosphere and the rate of its subsequent recovery. We carried out an investigation of the microbiology of a 1.76 km drill core obtained from the ∼35 million-year-old Chesapeake Bay impact structure, USA, with robust contamination control. Microbial enumerations displayed a logarithmic downward decline, but the different gradient, when compared to previously studied sites, and the scatter of the data are consistent with a microbiota influenced by the geological disturbances caused by the impact. Microbial abundance is low in buried crater-fill, ocean-resurge, and avalanche deposits despite the presence of redox couples for growth. Coupled with the low hydraulic conductivity, the data suggest the microbial community has not yet recovered from the impact ∼35 million years ago. Microbial enumerations, molecular analysis of microbial enrichment cultures, and geochemical analysis showed recolonization of a deep region of impact-fractured rock that was heated to above the upper temperature limit for life at the time of impact. These results show how, by fracturing subsurface rocks, impacts can extend the depth of the biosphere. This phenomenon would have provided deep refugia for life on the more heavily bombarded early Earth, and it shows that the deeply fractured regions of impact craters are promising targets to study the past and present habitability of Mars. Key Words: Asteroid—Impacts—Subsurface biosphere—Subterranean environment—Geobiology. Astrobiology 12, 231–246.
1. Introduction
Although the consequences of impacts for a surface biota have been studied, the influence of impacts on the deep subsurface biosphere have not. Impact events might be predicted to have both deleterious and beneficial effects on the deep subsurface biosphere. Deleterious effects could include sterilizing effects of a thermal excursion caused at the site of the impact by the kinetic energy of the impactor and the biologically disruptive effects of the shock waves produced (Kring, 1997). The beneficial effects of an impact could include (1) an increase in the permeability and porosity of target materials (observed in the surface environment; Cockell et al., 2005) caused by impact-induced pressurization and heating; (2) an increase in the flow of nutrients and redox couples to biota through faults and fractures generated in the impact collision; (3) an improvement of water availability caused by cavity formation and the associated hydrologic depression (observed in the surface environment; Ashton and Schoeman, 1983; Cremer and Wagner, 2003); (4) the mixing of lithologies, which would create steep geochemical gradients and potentially more favorable redox environments for life; (5) the formation of a hydrothermal system, which, once cooled below the upper temperature limit for life, could offer an aqueous habitat (Osinski et al., 2001; Osinski, 2005; Versh et al., 2006); and (6) the introduction of new nutrients into the crater cavity, for example, from outside the impact zone in the case of a tsunami (Smelror and Dypvik, 2006).
The study of the subsurface of impact structures can provide new insights into the effects of catastrophic geological disturbance on the deep biosphere in general and the processes and rates of recovery. Little is known about how long it takes the deep biosphere to recover from catastrophic disturbance. Impact craters that have formed in relatively recent geological time (tens of millions of years or less) provide an outstanding opportunity to explore the disruption and recovery of subsurface life.
In 2005 and 2006, the Chesapeake Bay impact structure (CBIS) was drilled by the International Continental Drilling Program (ICDP) and the United States Geological Survey (USGS) (Gohn et al., 2006, 2008). The impact structure was formed in the late Eocene about 35.3 million years ago (Horton and Izett, 2005) in a shallow marine environment (water depth <350 m) that was underlain by a few hundred meters of lower Tertiary and Cretaceous sediments on Neoproterozoic and Paleozoic basement. The crater has a diameter of ∼85 km and lies in the Atlantic margin of Virginia, USA (Fig. 1) (Horton et al., 2005a). It has a ∼900 m high central uplift surrounded by a central crater (∼40 km diameter), which is itself surrounded by an annular trough and an outer region of fractured rock that contains irregular, concentric, and radial faults. The structure is one of the best-preserved examples of a large marine impact (Poag et al., 1992, 1999, 2004; Powars et al., 1993; Koeberl et al., 1996; Powars and Bruce, 1999). The crater-fill rocks and sediments, and their constituent minerals and microfossils, contain evidence of the impact origin of the structure and its environmental consequences (Edwards and Powars, 2003; Horton et al., 2005b; Jackson et al., 2006; Lee et al., 2006; Edwards et al., 2009a).
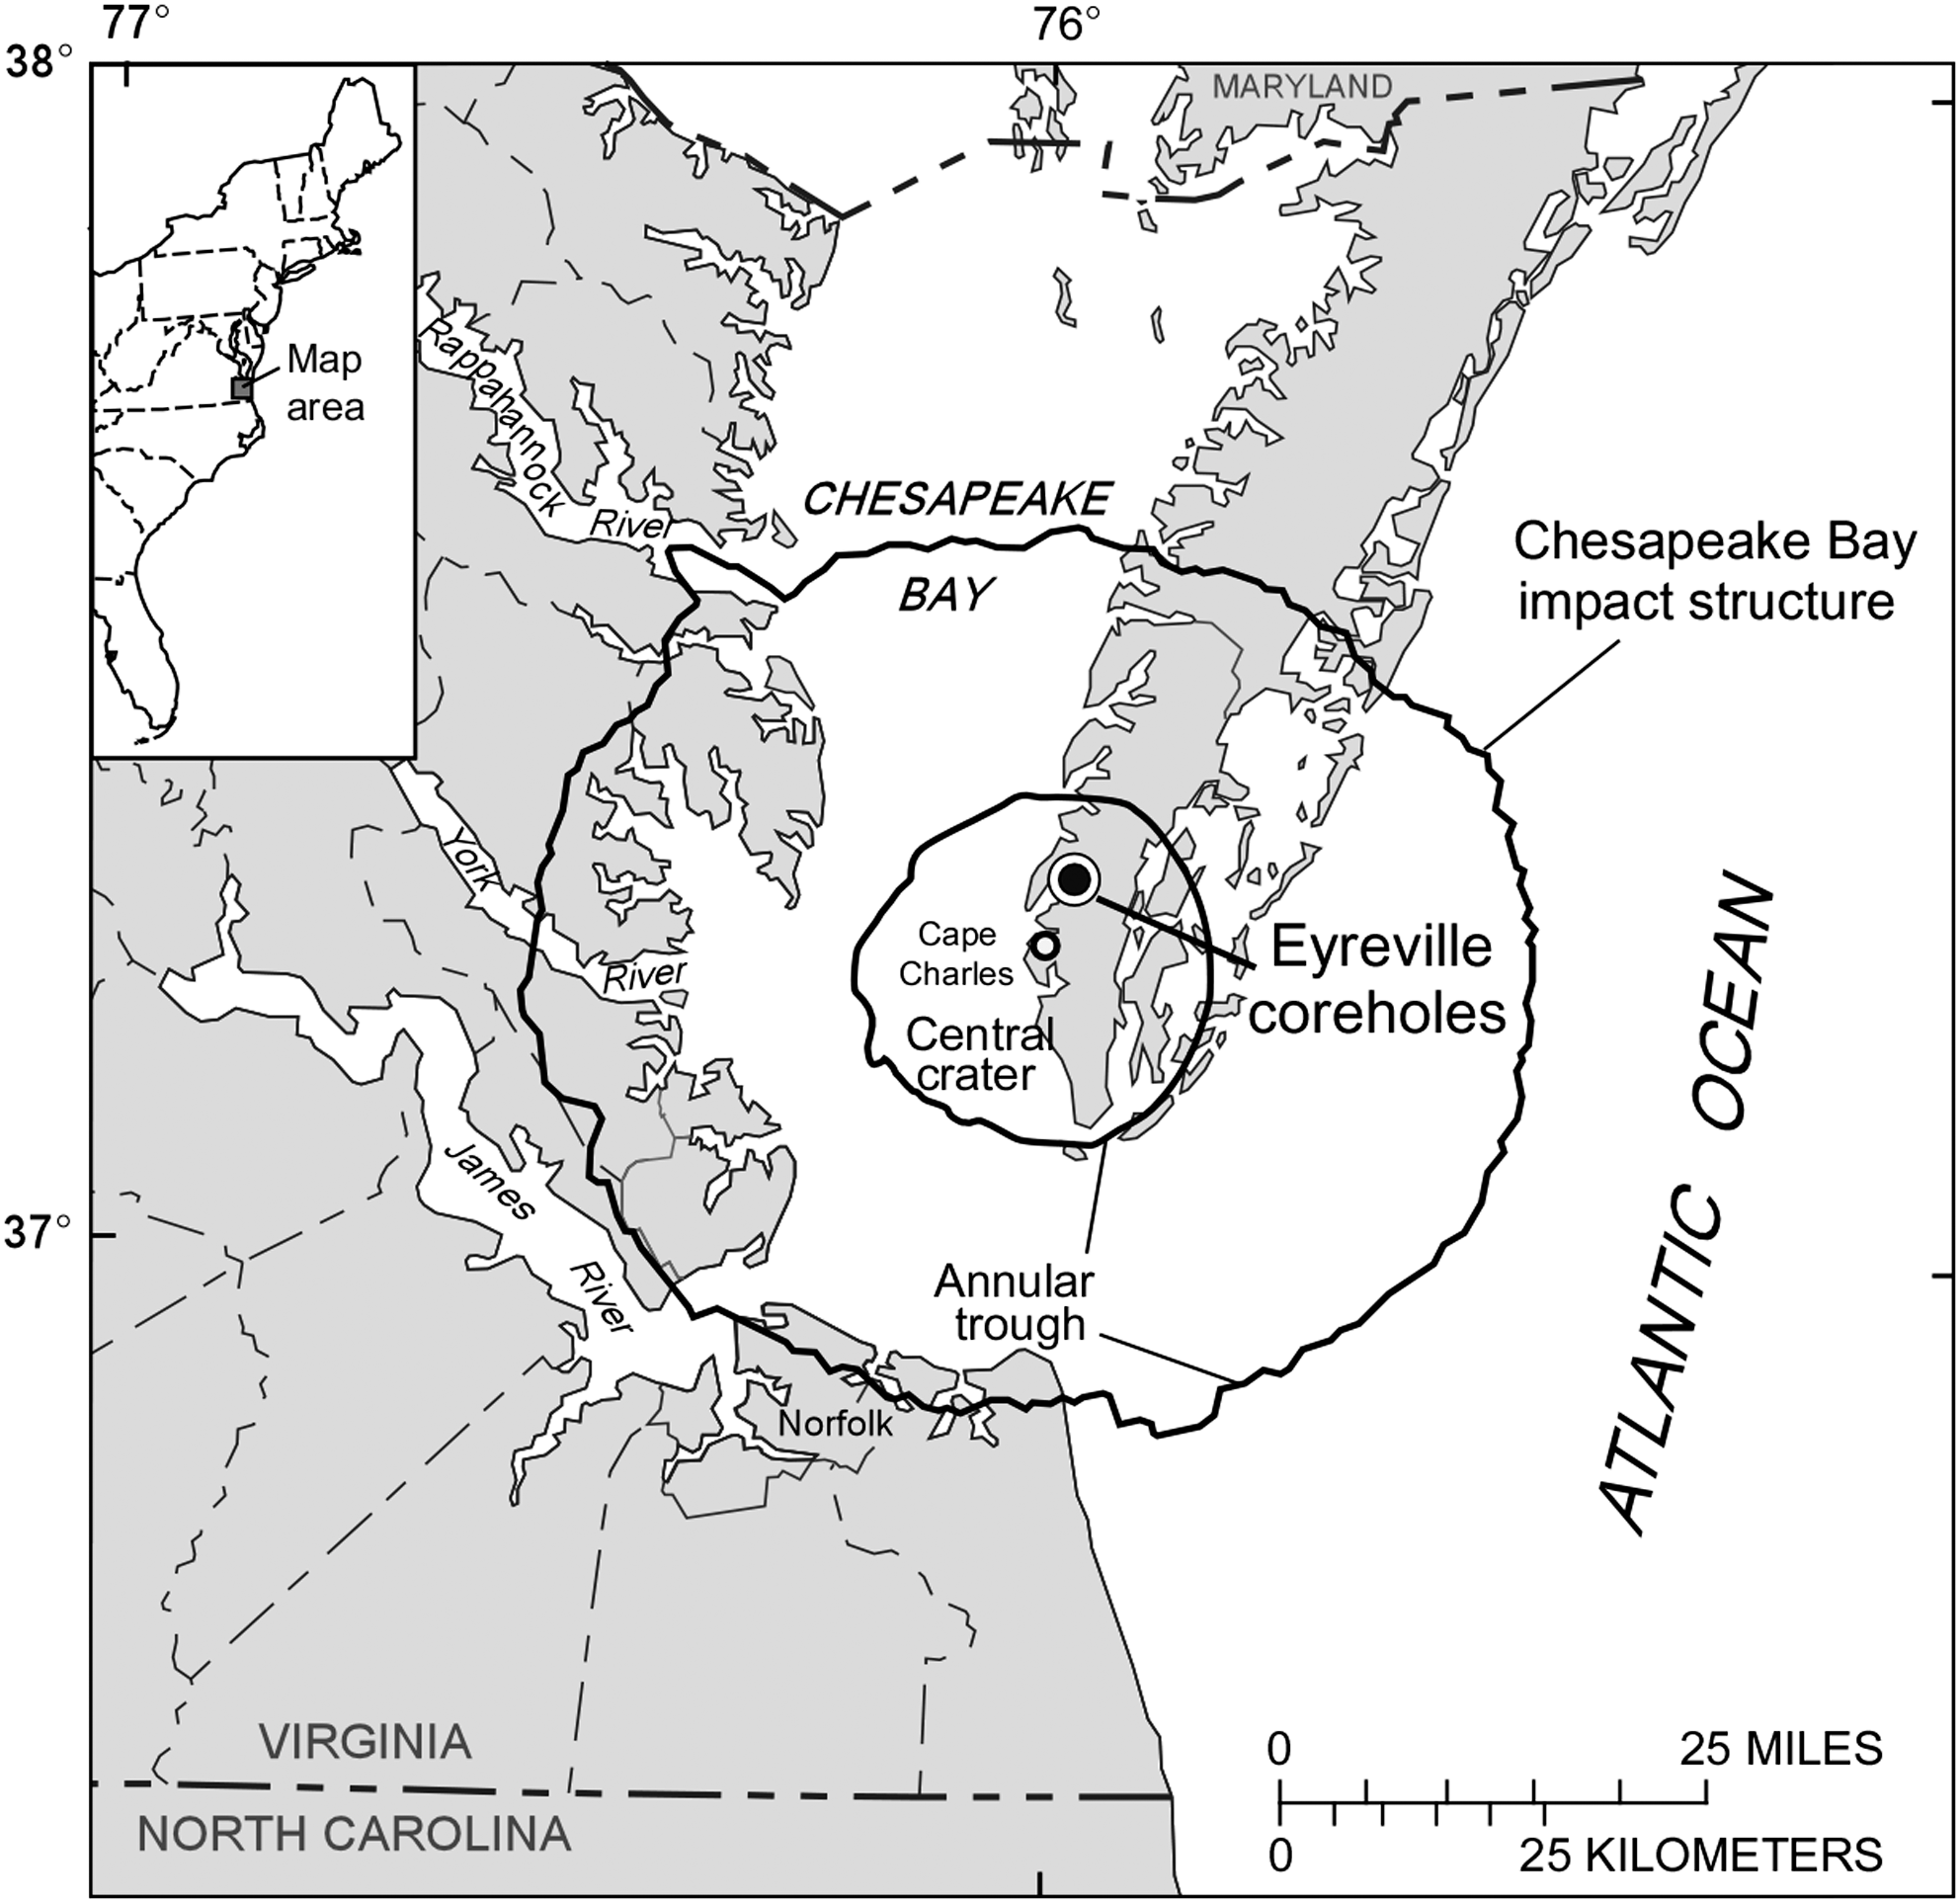
Location of the CBIS. Map of impact structure in relation to eastern USA (inset), showing drill site.
We describe microbiological data obtained from the CBIS and discuss implications for our understanding of the effects of asteroid and comet impacts on the deep subsurface biosphere.
2. Materials and Methods
2.1. Samples
Three coreholes (A, B, and C) in the same location were drilled into the CBIS to a composite depth of 1.766 km at Eyreville Farm, in Northampton County, Virginia, USA (Fig. 1). The Eyreville drill site is located approximately 9 km from the center of the structure. Edwards et al. (2009a, 2009b) and Horton et al. (2009) described the cored rocks and sediments, the geological columns, and the stratigraphy and lithology. In general, the composite section includes (base to top) basement-derived metamorphic and igneous rocks (1766.3–1551.2 m depth) with minor impact-breccia dikes, a succession of polymict impact breccias and associated rocks (1551.2–1397.2 m) with melt-rich suevites and impact melt rocks above 1474.1 m, quartz sand with lithic boulders and blocks (1397.2–1371.1 m), a granite megablock (1371.1–1095.7 m), sediment breccias and sediment megablocks (1095.7–443.9 m), and post-impact sediments (443.9–0 m).
2.2. Contamination assessment
During the drilling operations and recovery of core samples, stringent contamination controls were applied to obtain material for microbiological studies (Gronstal et al., 2009). Five methods for contamination assessment were used to select core subsamples for subsequent analyses as described in detail previously (Gronstal et al., 2009). Some of these methods are similar to those previously applied to the recovery of marine deep subsurface cores (Gronstal et al., 2009). During the drilling process, drilling mud was infused with a perfluorocarbon gas chemical tracer (halon) to monitor penetration of the mud into cores. Bags containing fluorescent microspheres (0.518±0.01 μm) of a similar size to microorganisms were introduced into the core-capture device and used to mimic the ability of contaminant cells to enter the samples through fractures in the core material during recovery. Dissolved organic carbon (DOC) in pore waters from cores was examined with excitation emission matrix spectroscopy. DOC signatures from core samples were then compared to the unique DOC signatures of drilling mud to detect contamination of core interiors. Direct-injection, negative-electrospray ionization mass spectrometry was used to analyze the acidic polar components in pore water collected from the core subsamples and samples of the drilling fluid (Rostad and Sanford, 2009). Specific ions unique to the drilling fluid were identified in the mass spectral fingerprints and were used to determine whether infiltration of drilling fluid and contamination of the aqueous samples had occurred. Finally, microbial 16S rDNA clone libraries were obtained on samples of the drilling mud so that a set of potential microbial contaminants could be identified and then compared to species cultured from core samples. The enumeration samples were evaluated for contamination based on the DOC drilling fluid signature and the presence/absence of fluorescent microspheres (Gronstal et al., 2009).
2.3. Enumeration of microorganisms
The enumeration of microorganisms was carried out with subcores obtained from retrieved core sections in a sterile hood with aseptic techniques. Eighty-eight samples were obtained at ∼10–30 m intervals, depending upon core retrieval and the ability to select consolidated sediment for enumeration. Samples of sediment were removed from the interior of core samples with sterile spatulas after cores were broken in two with a sterile chisel. For each depth, two separate samples were collected to improve statistical confidence. Enumeration samples were stored in 4% formalin in phosphate-buffered saline (PBS) and refrigerated at 4°C prior to counting. Suspended sediment samples were filtered onto black 0.2 μm polycarbonate filters, following mild sonication to remove organisms from sediment particles. The DNA-binding dye DAPI (4′,6′-diamidino-2-phenylindole 2HCl) (Sigma Chemicals, Gillingham, Dorset, UK) was used to stain samples. For each of the two samples acquired from each depth, two separate samples for enumeration were prepared and enumerated. A minimum of 50 fields of view per sample were counted under epifluorescence microscopy on a Leica DMRP microscope (Leica Microsystems, Wetzlar, Germany), so that a total of at least 200 fields of view were counted for each depth. The numbers reported are the mean values. For DAPI staining, organisms were observed with use of an excitation filter with a bandpass of 340–380 nm (filter cube A) and an emission filter with long-band cutoff >425 nm. The number of organisms was calculated per gram of dry weight of sediment. Negative controls comprised of sample bottles that contained formalin without added sediment were also examined. The detection limit of the method is relatively high because the volumetric conversion factor for calculating cells per gram is high (Kallmeyer et al., 2008). For example, a count of 2–3 cells total in 200 fields of view leads to enumeration estimates ≤104 cells/g. We accept a detection limit here of 104 cells/g.
Regressions were calculated on double-log transformed data with a weighted least-square approach (Sokal and Rohlf, 1995).
2.4. Most probable numbers
Most probable number (MPN) counts were carried out for heterotrophic microorganisms. Starting inoculations of media were obtained by adding a defined mass of sediment samples to 10 mL of media in pre-autoclaved 15 mL Hungate tubes. Dilutions were then obtained by transferring 1 mL of enrichment culture into 9 mL of sterile growth media. Serial dilutions were then performed until a 10−7 dilution was obtained. MPN studies were performed with heterotrophic medium, as described by Stevens (1995), which was the most successful media for producing enrichment cultures. MPNs were performed on core samples at depths of 250.5, 366.6, 571.1, 1568.5, and 1608.8 m. Inoculations were incubated at 37°C for samples at 571.1 m or less and at 60°C for the two deep samples (1568.5 and 1608.8 m) (a temperature extrapolated based on the deepest core temperature measured; Fig. 2). Growth was verified by epifluorescence microscopy by using DAPI, Syto 9, and Sybr Green I staining every second week for a period of 3 months.

Stratigraphy, geophysical, and geochemical data shown alongside microbial enumeration data through the Chesapeake impact structure core. The solid horizontal line marks the transition between post-impact sediments (above) and the crater (below). Dotted lines mark major lithological transitions in the crater. The microbiological enumerations are split between those above the granite megablock (A) and those below (B). TDS, total dissolved solids. Color images available online at
Most probable number counts were also carried out on hydrogenotrophic sulfate reducers, methanogens, and acetogens. Analysis was carried out as above with liquid medium (Widdel and Bak, 1992) that contained (g/L): NaCl, 20; KCl, 0.7; NH4Cl, 0.2; and KH2PO4, 0.2. The medium was autoclaved and afterward allowed to cool to room temperature under a N2:CO2 (9:1 v/v) atmosphere. Solutions of 1.5 g/50 mL CaCl2·2H2O, 10.6 g/50 mL MgCl2·6H2O, and 0.517 g FeCl2·4H2O in 10 mL HCl (10 mM) were prepared under a N2 atmosphere, autoclaved separately, and added to the cold medium. In addition, 2.5 g/30 mL NaHCO3 autoclaved under CO2 atmosphere was added as a buffer. Vitamin solutions were prepared and added as described by Abildgaard et al. (2004). If necessary, pH was adjusted to 7.2–7.4 with sterile HCl solution (1 M). Acetate was added as an organic carbon source from a sterile stock solution to give a final concentration of 1 mM. The medium was filled into 50 mL sterile screw-capped bottles. Sulfate reducer MPNs contained 20 mM of sulfate, and the acetogen MPNs contained 10 mM of BES (2-bromoethanesulfonic acid), a specific inhibitor of methanogens. All media contained resazurin as an oxidation indicator. After inoculation, the tubes were sealed and the headspace was flushed with a mixture of H2 and CO2 (9:1).
2.5. Microbial culturing
A variety of microbial media were used to attempt to enrich or isolate bacteria from samples. The following media types were used (designation of media name in this study and citation): heterotrophic media (Het Med DH, D'Hondt et al., 2004; Het Med 1, Stevens, 1995; a modified R2A medium, Finster et al., 2009); iron-reducing media (IR Med DH, D'Hondt et al., 2004); sulfate-reducing media (SR DH, D'Hondt et al., 2004; SR Med 2, Pfennig et al., 1981; PM, Postgate, 1963; Postgate and Campbell, 1966); humic substances medium (obtained from USGS); neutrophilic iron-oxidizer medium (IO Med, Straub et al., 1996, 2004); and methanogen enrichment media (MEM, Ni and Boone, 1991; Kendall and Boone, 2006). Media were inoculated with sediments (0.5 g to 1 g) from chosen depths either in Hungate tubes or rubbed capped 100 mL glass bottles with 20–50 mL of media. NaCl concentrations in the media were adjusted for any given depth to correspond to the concentrations recorded in the core (Sanford et al., 2009). Cultures were incubated at selected temperatures, which were based on corehole temperature measurements (Fig. 2). Cultures from depths greater than 1100 m were incubated at temperatures of 45°C or 50°C. Isolations were accomplished by serial dilutions.
Experiments were also carried out with heterotrophic enrichment cultures in which ∼1 mL of Het Med 1 was added to ∼5 g of core sample material and inoculated as above. The rationale for this approach was to reduce dilution of the core material to a minimum (so that salinity and other nutrients and elements were approximately maintained at levels found in the core material) but to supply a source of organic carbon and additional nutrients and vitamins. Het Med 1 was prepared with the addition of (per liter) 0.05 g peptone, 0.05 g tryptone, 0.1 g yeast extract, 0.05 g Na-acetate, 0.05 g formate and 0.05 g lactate, and 0.1 g casamino acids as carbon sources. The enrichment cultures were purged with a 90% N2/5% CO2/5% H2 headspace and incubated for 3 months at selected temperatures as described above. Headspace gas was replenished every 3 weeks. At the end of the incubation, the DNA was extracted and examined by DGGE and 16S rDNA clone library analysis as below.
2.6. Experiments on the use of redox couples from the crater core material
Core material from a depth of 997.7 m that exhibited microbial abundance below detection limits was used to cultivate an inoculum of heterotrophic isolates CBIC 16-1 (a Jonesia sp. from 571.0 m depth), CBIC 19-1 (a Bacillus sp. from 643.4 m depth), and CBIC 45-1 (a Trichococcus sp. from 1568.6 m depth) to determine whether the material had low biomass because its physical or chemical characteristics prevented growth or because there was a lack of organisms able to make use of the available energy. Cells were washed in ddH2O. They were added at a concentration of 1×10⁴ cells/mL to 0.5 g of sediment material with ∼1 mL of ddH2O added to create a slurry. Cells were incubated at the selected temperatures as described above for 4 weeks and cell counts performed by enumeration with DAPI as above.
2.7. 16S rDNA analysis of bacterial isolates and enrichment cultures
DNA was obtained from enrichment cultures and isolates by extraction with the FastDNA SPIN Kit for soil (Q-Biogene, Cambridge, UK). Bacteria 16S rDNA was amplified from enrichment culture extracts with a semi-nested protocol. The first round of amplification was performed with primers pA and pH (Bruce et al., 1992). Each 50 μL reaction contained 1 μL template, 0.2 μM primers, 200 μM dNTPs (New England Biolabs, Hertz, UK), 2.5 U Taq DNA polymerase, 1.5 mM MgCl2, and 1×PCR buffer (200 mM Tris-HCl (pH 8.4), 500 mM KCl) (Invitrogen, Paisley, UK). Cycling was performed as follows: 94°C for 5 min, twenty cycles of 94°C for 1 min, 55°C for 40 s, and 72°C for 40 s; followed by 72°C for 10 min. The second-round amplification mixture was similar to the first, with the exception of primers pA and com2 (Schwieger and Tebbe, 1998), each at a concentration of 0.4 μM. One microliter of unpurified product from the first-round amplification was used as template under the following cycling conditions: 94°C for 5 min, thirty-five cycles of 94°C for 30 s, 54°C for 30 s, and 72°C for 30 s; followed by 72°C for 10 min. Products were resolved on 1% agarose, ethidium bromide stained, and gel purified (GFX PCR DNA and Gel Band Purification Kit, GE Healthcare Bio-Sciences Ltd.). Purified products were cloned into pCR4-TOPO vector and transformed into chemically competent Top10 cells (Invitrogen, Paisley, UK). Sequencing was performed with primer pA (Molecular Cloning Laboratories, CA, USA).
Isolates from enrichment cultures were identified with primers for the 16S rRNA gene. The following primer sets for the bacterial 16S rRNA gene were employed in this work: pA, pH, com2 (above), com1 (Schwieger and Tebbe, 1998), 27f, 1100r, 1387r, 1492r (Lane, 1991), 43f (van der Gast and Thompson, 2004), 63f (Marchesi et al., 1998, 2001), 519f (Lane et al., 1985), 1392r (Stahl and Amann, 1991).
2.8. Denaturing gradient gel electrophoresis
Denaturing gradient gel electrophoresis (DGGE) was used to visualize the diversity of enrichment cultures from core material. PCR amplification for DGGE was performed by using a nested approach; for the first round, identical conditions to those described above for cloning were used, though the template concentration was doubled. Second-round amplification was performed with primers 338 (Muyzer et al., 1993) and com2, the former primer also containing a 40 bp GC-clamp at the 5′ end. Amplification mixtures were as described earlier, with 2 μL first-round product as template and 0.4 μM of each primer. The thermal cycling protocol was as described above for the pA-com2 primer set. One hundred and fifty nanograms of unpurified PCR product was resolved on a 6% polyacrylamide gel containing a gradient of 30–70% denaturant, where 100% is defined as 7 M urea and 40% (v/v) formamide. The gel was run with a D-Code Universal Mutation Detection System (Bio-Rad) at 75 V for 18 h in 1XTAE at 60°C. Bands were visualized with SybrGreen 1 and, where possible, excised and resuspended in sterile distilled water before subjecting to PCR and DGGE as above. Products that migrated to the original band position were sequenced with com2.
2.9. Nucleotide sequence accession numbers
The partial 16S rDNA sequences of the isolates and clones from enrichment cultures were deposited in GenBank (accession numbers HM240267 to HM240284).
2.10. Functional and genus-specific gene analysis
DNA from approximately 1 g subcores was extracted from seven core depths by two methods, according to manufacturer's instructions: extraction with the Ultraclean Soil DNA kit (Mo Bio Laboratories, Carlsbad, CA, USA) and the stool extraction kit (Qiagen Inc., Valencia, CA, USA). Whole genome amplification was then performed with the Repli-G WGA mini kit (Qiagen Inc., Valencia, CA, USA). A positive drilling fluid control and a negative no-template control were included in these reactions. Whole genome amplification products were purified by using Mo Bio spin columns (Mo Bio Laboratories, Carlsbad, CA, USA) and served as template for quantitative PCR.
Real-time quantitative PCR reactions were performed in a Stratagene MX3000P (Agilent Technologies, Santa Clara, CA, USA) to assess the abundance of the following organisms of interest with the primer sets indicated in Table 1: Geobacter, sulfate-reducing bacteria, and methanogens. Reactions were performed with the Quantitect SYBR green PCR kit (Qiagen Inc., Valencia, CA, USA) and 0.6 μM final primer concentration, with melting curves performed at the end of each reaction to ensure product integrity. Cycling conditions were 40 cycles at the Quantitect manufacturer-recommended cycling temperatures and times with one modification. The fluorescence reading was taken after extension followed by a post-extension heating step at the temperature indicated in Table 1. Plasmids containing the gene of interest were used as quantitation standards and were prepared by cloning PCR products into the pcR2.1 plasmid with the Topo TA cloning kit (Invitrogen, Carlsbad, CA, USA). DNA from the samples at the following depths was examined (m): 571.1, 643.5, 942.9, 997.7, 1085.4, 1391.9, 1568.6.
2.11. Fluorescent in situ hybridization
Fluorescent in situ hybridization (FISH) was used to test for the presence of bacteria in the deep fractured material of the crater. Core material from depths of 1568.6–1608.7 m was examined. The FISH analyses were performed as detailed by Manz et al. (2000). Before microscopic analysis, hybridized slides were washed with buffer (20 mM Tris-HCl, 0.01% SDS, 88 mM NaCl), rinsed with distilled water, air-dried, and then mounted in antifading glycerol medium (Citifluor AF2, Citifluor Ltd., London, UK) (Manz et al., 2000). EUB338 I-III, a universal 16S rDNA eubacterial probe, was used to target all bacteria (Daims et al., 1999). The probe EUB338 was 5′-labeled with the indocarbocyanine dye Cy3 (Red fluorescence, CyDye, Amersham Pharmacia Biotech Europe, Freiburg, Germany) from Biometra (Göttingen, Germany). A negative control for nonspecific binding was also prepared with a Cy3-labeled primer NON-EUB338, which has the complementary (antisense) sequence to probe EUB338. A positive control after the hybridization was also performed by staining with DAPI. For this procedure, 100 μL of 3 μg/mL DAPI solution was added to the hybridized slides before incubating for 10 min at room temperature. The slides were then rinsed with water and air-dried. This procedure was used to discern whether the signal observed by FISH corresponded to microorganisms. Microscopic observations were performed by epifluorescence microscopy as previously described by Manz et al. (2000). The epifluorescence microscope was a wide-field Zeiss Axioplan microscope (Oberkochen, Germany) equipped with a high-pressure mercury arc lamp (HBO 50, Zeiss) and Zeiss filter no. 15 (excitation 546 nm, dichroic mirror 580 nm, suppression 590 nm), which corresponds to the excitation and emission maxima of the Cy3 fluorochrome.
2.12. X-ray diffraction
An INEL X-ray diffraction (XRD) system with a curved position-sensitive detector was used for analysis. A pattern-stripping technique utilizing mineral standards was used to determine a complete modal mineralogy for all phases present in abundances >1 wt % (Cressey and Schofield, 1996; Howard et al., 2009). The powdered crater-fill samples were packed in circular aluminum wells with a volume of 180 mm3 and analyzed for up to 1 h in order to minimize pattern noise. For quantification, patterns from phase-pure standards or polyphase standards representing the best structural match to the material in the crater-fill samples (i.e., mixed-layer phyllosilicate standards) were selected from the databank, matched against the polyphase crater-fill pattern, and then subtracted to leave a residual. The process was repeated for all identified phases until a residual of zero counts was reached. To determine the weight fraction, pattern-fit proportions for each phase were corrected for relative differences in X-ray absorption.
3. Results
3.1. Contamination control
Forty-seven samples for culturing and genomic analysis were collected throughout the core. With the use of selection criteria described by Gronstal et al. (2009), 21 of the total 47 samples were chosen for microbial culturing work, and a subset were used in the studies described here.
3.2. Enumerations
Eighty-eight enumeration samples were obtained at ∼10–30 m depth intervals. Enumerations were expressed as mean counts for each depth (cells per gram dry weight of material) (Fig. 2). Comparisons of the cell enumerations were also made with previous subsurface data from the ultra-oligotrophic South Pacific Gyre (D'Hondt et al., 2009) and a compilation of cell counts from previous Ocean Drilling Program (ODP) expeditions (Legs 112, 128, 135, 139, 146, 155, 160, 161, 164, 168, 169, 177, 180, 185, 190, 201) (Cragg et al., 1990, 1995a, 1995b, 1997, 1998, 1999, 2000, 2003; Cragg, 1994; Cragg and Parkes, 1994; Taylor et al., 1999; Mather and Parkes, 2000; Wellsbury et al., 2000, 2001, 2002; Moore et al., 2001) (Fig. 3). CBIS data were calculated as cells per gram of dry weight of material. To make a comparison with these other data, we assumed the density of the material in the CBIS to be 2.7 g/cm3 and recalculated the data accordingly. The actual density will vary with lithology and depth, but variations in the density will not significantly alter the comparisons since differences in cell numbers occur across orders of magnitude.
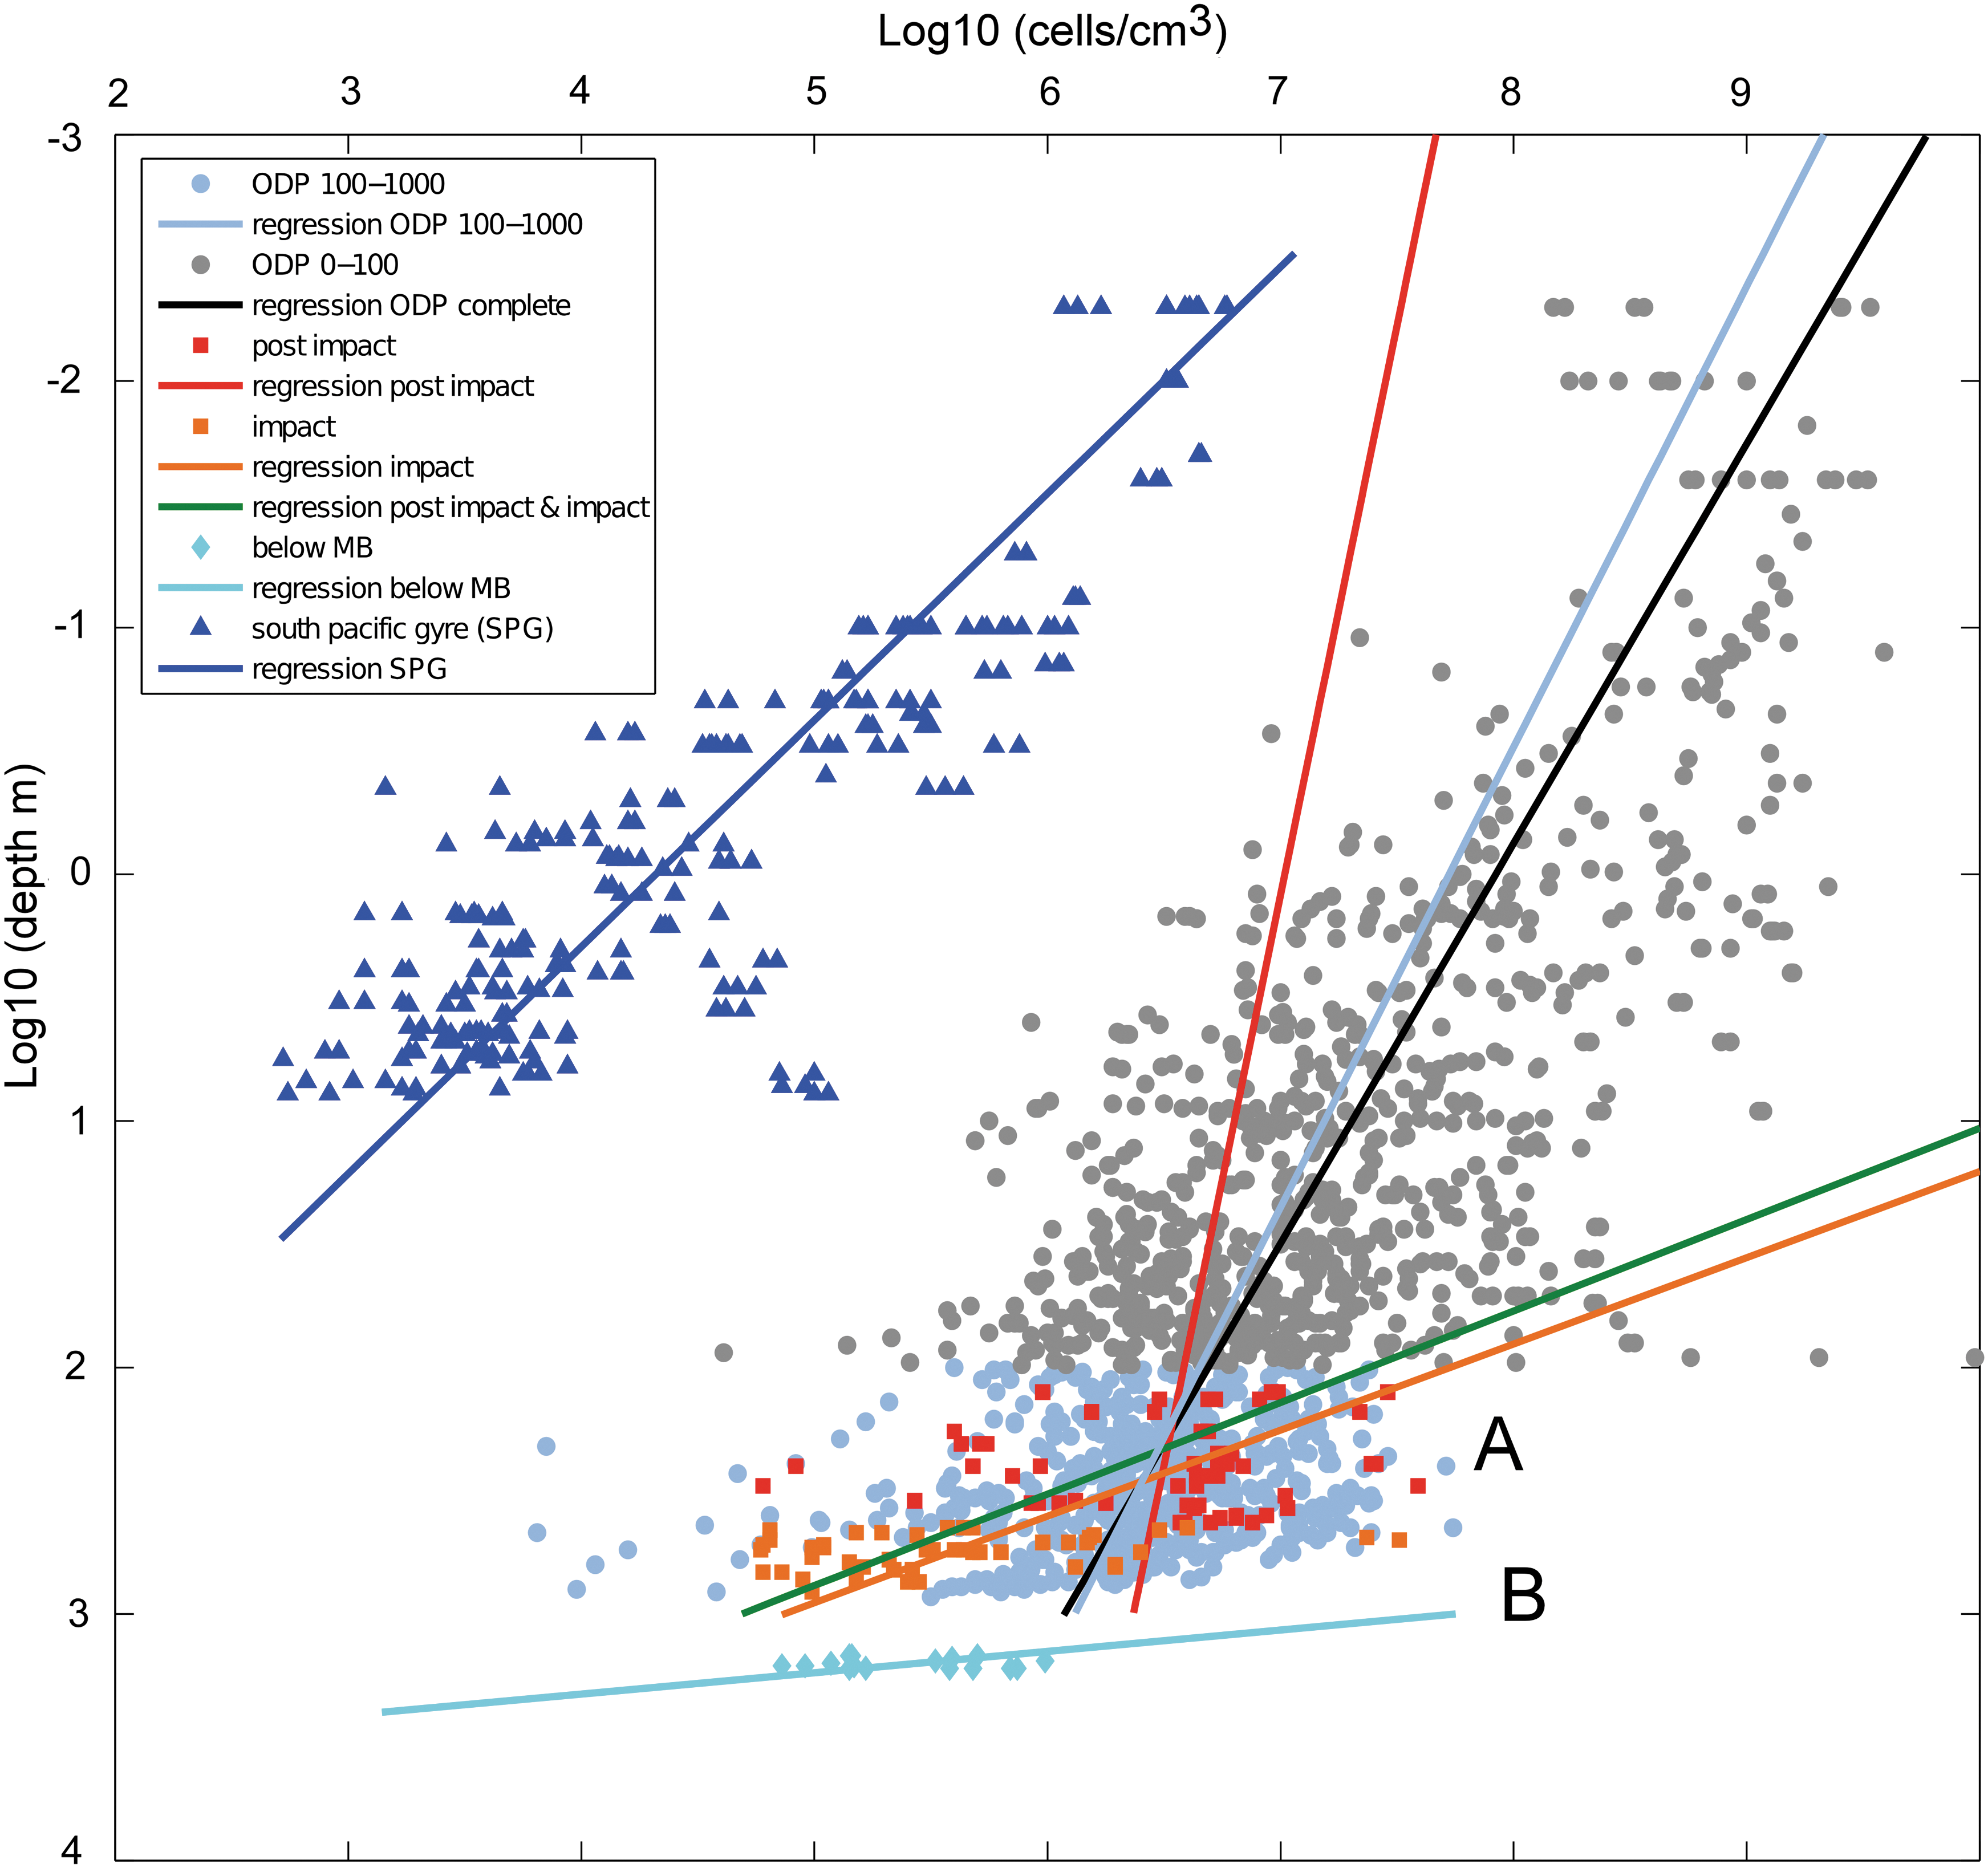
Microbial enumerations through the CBIS. Enumerations in the CBIS shown as log depth (m) versus log cell enumerations against data from the ultra-oligotrophic South Pacific Gyre (D'Hondt et al., 2009) and a compilation of cell counts from 16 previous ODP legs. As Chesapeake Bay data were enumerated as cells per gram of dry weight of material, they were converted to cubic centimeters by dividing by 2.7, assuming this to be the density of the material. MB means megablock and refers to the granite megablock. (A) and (B) indicate cell populations above and below the granite megablock, respectively.
3.3. Most probable numbers
Samples from the post-impact sediments (5E, 8E), crater-fill sediments interpreted to be ocean resurge deposits (16E), and the deep fractured zone of the crater (45E, 46E) were examined for heterotrophic MPNs. The MPN as a percentage of DAPI counts is shown in Table 2. The samples at 250.5 m depth did not yield growth. No growth was obtained in MPNs for hydrogenotrophic sulfate reducers, methanogens, and acetogens.
3.4. Microbial culturing
Both single-species isolation and enrichment cultures were used to isolate microorganisms from the Chesapeake impact structure core material.
Single species isolates were obtained from different depths in the crater (Table 3). Some of these organisms have a closest phylogenetic affiliation with spore-forming genera (e.g., Bacillus and Clostridium spp.). Some of the isolates have a closest phylogenetic affiliation with organisms previously reported from salty/briny environments, for example, CBIC16-2I, which affiliates with Exiguobacterium previously described from salt mines, and CBIC19-1I, which affiliates with Bacillus species from a marine aquaculture system. No iron-oxidizing, humic-acid utilizing, iron-reducing or sulfate-reducing organisms were isolated.
In cases where there are multiple organisms with the same percentage similarity, the genus name is given and the accession number of the first one listed in GenBank.
A diversity of organisms was obtained in enrichment cultures, which were subsequently identified by DNA extraction and 16S rDNA. Table 4 shows the composite data and GenBank accession numbers obtained from enrichment cultures.
The GenBank sequence designation starts with the sample number and then the sequence number followed by EC (enrichment culture), i.e., CBIC5-1EC is sequence number 1 from sample 5 (corresponding depths shown in table).
Sequences with the suffix ECD are bands excised from DGGE gels and sequenced.
Conspicuous sulfate reduction was observed in enrichment cultures from samples CBIC5 and CBIC8. Samples turned a dark black color after 1 month of incubation, and there was an evident smell of hydrogen sulfide gas from the tubes. No other enrichment cultures exhibited evidence of sulfate reduction.
As with cultured isolates, some of the sequences obtained in enrichment cultures were closely affiliated with organisms associated with saline or briny environments such as CBIC8-1EC (Halobacterium spp.). Some sequences belonged to organisms (e.g., Paracoccus spp.) that have previously been reported from deep-ocean sediments. The deep fractured zone of the crater yielded sequences of heterotrophs. We did not obtain methanogens or iron-reducing microorganisms from enrichment cultures.
3.5. Experiments on the use of redox couples from the crater core material
Core material from 997.7 m from the impoverished zone in the impact structure was able to sustain growth of the selected isolates. After 4 weeks, all isolates exhibited net growth measured by microscopic cell enumerations (data not shown).
3.6. Functional and genus-specific gene analysis
Geobacter-specific primers gave a positive amplification result at 942.9 and 1568.6 m. Neither dsrB nor mcrA primers yielded a conclusive positive result at any depth. All three primers yielded a positive result for drilling mud (material examined from mud used during core recovery at the 643.5 m depth sample).
3.7. Fluorescent in situ hybridization
Fluorescent in situ hybridization revealed the presence of bacteria (staining orange/red) in the deep fractured zone of the crater (Fig. 4), which also stained with DAPI. Microorganisms were visualized on rock fragment surfaces and were abundant in the material, consistent with enumeration data.
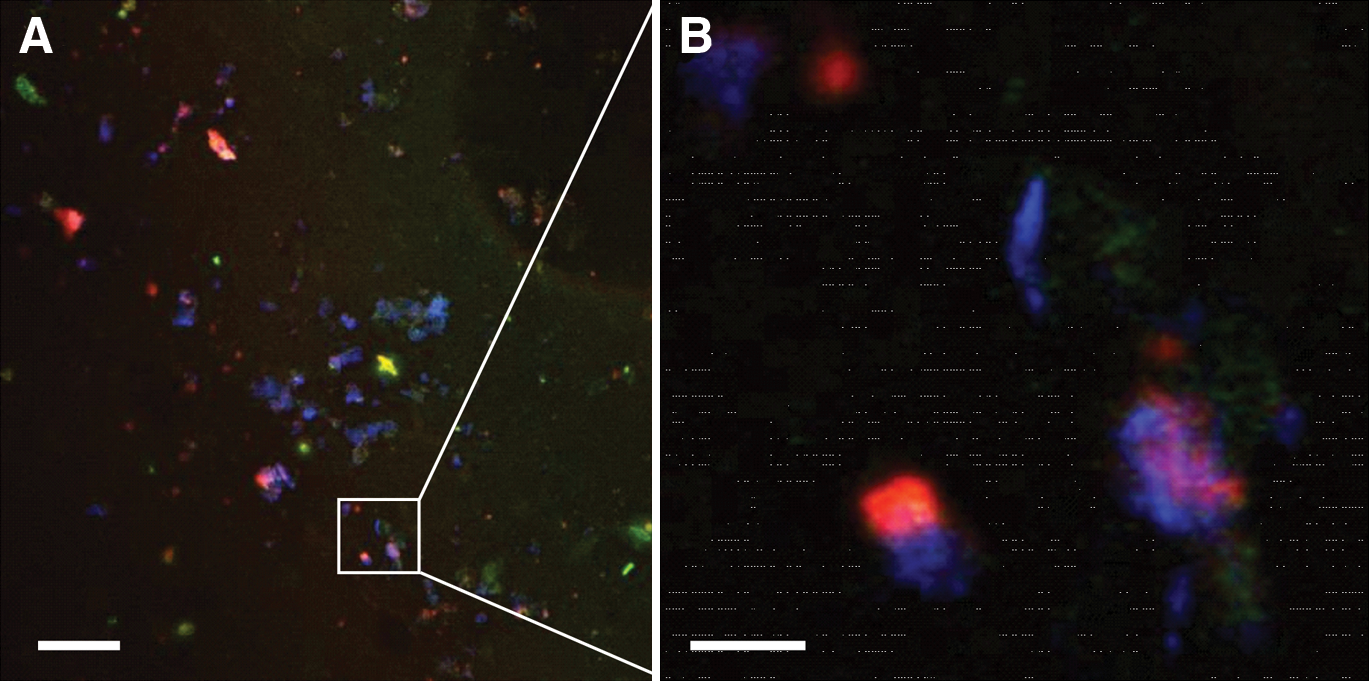
Fluorescence in situ hybridization of cells in the deep subsurface of the CBIS. FISH carried out on samples from 1568 m depth in the CBIS. Selected binding to eubacteria (red) and co-staining with the general DNA binding dye DAPI (4′,6′-diamidino-2-phenylindole 2HCl) (blue) shown. (
3.8. X-ray diffraction
X-ray diffraction data are shown in Table 5. The data exhibited large variations, consistent with the expected variability in the highly mixed intra-crater impact breccias (including suevites), avalanche deposits, and resurge sediments.
Some additional samples in proximity to samples used in microbial analysis are shown.
4. Discussion
The project to drill the CBIS offered the first opportunity to investigate the effects of an asteroid or comet impact on the deep subsurface biosphere with robust microbiological contamination control. It provided an opportunity to investigate the effects of sudden geological disturbance on the deep biosphere and the processes and rates of subsequent recovery.
Despite the great scatter over 2–3 orders of magnitude at any depth, the enumeration data show an overall decline in numbers from 127–867 m through the upper zone of post-impact and impact sediments and sedimentary crater-fill deposits, which is qualitatively consistent with previously studied marine environments (e.g., Parkes et al., 1994; D'Hondt et al., 2004). Quantitatively, the data in the upper sections of the core exhibit differences from data previously recorded in marine sites. The double-log-transformed data (Fig. 3) show two notable characteristics.
First, the data show greater scatter and a much more rapid decline of cell abundance with increasing depth as compared to marine cell counts (Fig. 3, Table 6). Normal marine cell count records usually fall within plus or minus half an order of magnitude from a linear regression line (e.g., Morono et al., 2009), whereas the Chesapeake Bay data scatter by up to 3 orders of magnitude. Still, a general trend of decreasing numbers with increasing depth can be observed. Chapelle et al. (1987) observed a similar decline in cell abundances measured on samples from a series of noncontiguous cores of unconsolidated coastal plain sediments collected from within the Patapsco aquifer at a site 20–25 miles west of the outer rim of the crater. The samples come from geological provinces similar to the CBIS, from recent to Lower Cretaceous, but were retrieved from a shallower core hole (<200 m). The samples contained lignitic organic matter but had very low concentrations of DOC (0.4–1 mg/L).
There are distinct geochemical differences between the post-impact and impact sediments (Fig. 2). Although not as obvious, there are also differences in cell abundance between the two sections. Maximum values around 5×10⁷ cells cm−3 can be found over the entire post-impact depth interval, whereas minimum values decrease from 106 cells cm−3 at the top to 5×10⁴ cells cm−3 at the bottom. Scatter therefore increases with depth, from about 1.5 orders of magnitude at the top to almost 3 orders at the base, which leads to a low correlation coefficient (r 2=0.004). Cell counts in the impact sediments show an opposite trend with regard to scatter. Minimum values remain around 7×10⁴ cells cm−3 throughout this depth interval, but maximum values drop from >107 cells cm−3 to slightly over 105 cells cm−3. This massive variability in scatter plus the small decrease in cell abundance with depth results in a low correlation coefficient (r 2=0.10). However, when combining the cell counts from both sections, the general trend of a rapid decline with depth becomes much clearer, which is also reflected in the higher, but still not strong, correlation coefficient of the regression (r 2=0.42), which exhibits a decrease with depth (slope −2.7) that is much stronger than the regression through the ODP data (slope −0.62).
This high scatter is in contrast to the ODP counts. For the entire ODP database, which contains ∼25 cores, the combined counts show a relatively good correlation with depth (r 2=0.52), although correlations for individual cores is usually much better (>0.8). For better comparison with the Chesapeake data, we limited the ODP database to the 100–1000 meters below seafloor depth range. Over this 1 log unit depth interval, the counts scatter by plus or minus one order of magnitude and decrease by less than an order of magnitude, which results in a low correlation coefficient (r 2=0.05). Despite the low correlation coefficient, the regression is very similar to the total ODP count regression, just with a lower correlation coefficient.
We interpret the high scatter in the Chesapeake Bay counts as an effect of the variable lithology within the crater-fill sediments. Scatter is particularly large in the crater-fill sediments interpreted as resurge and intercalated avalanche deposits. The observed variations in microbial abundance between 444 and 867 m are likely to be linked to abrupt changes in lithologies caused by different source impact material mixed during oscillations of the ocean resurge and coeval avalanches into the crater cavity (Powars et al., 2007; Gohn et al., 2009; Ormö et al., 2009) immediately following the impact. Changes in mineralogy in our samples, shown by XRD, are primarily related to variations in quartz, feldspar, and clay components. In other subsurface environments, variability in cell abundances at depth has been observed and correlated with lithological changes (Inagaki et al., 2003) or shifts in interstitial water geochemistry (D'Hondt et al., 2004; Biddle et al., 2005; Parkes et al., 2005).
Second, the decline in cell abundance we observed was steeper than previously observed in marine environments. Despite the considerable scatter, the regression through the cell counts above the granitic megablock clearly exhibits a different trend than that indicated by the ODP data (Fig. 3, Table 6). Comparison with marine sites or other terrestrial sites, however, would be unlikely to yield similar results. Most of the rocks and sediments in the impact structure below the post-impact sediments were laid down in a time period of the order of 15–18 min (Collins and Wünnemann, 2005; Collins et al., 2008) in an event that heated and mixed materials, which yielded a very different environment than that which results from the slow and sequential deposition of sediments over millions of years. Nevertheless, when compared with slowly deposited marine sediments, the slightly higher cell abundance at the top of the post-impact sediments and the much steeper decline with depth, considered alongside the high DOC and sulfate concentrations that persist within the structure (Fig. 2), suggest that the microbial community may still be responding to the effects of the impact and the input of nutrients and redox couples into the impact cavity about 35.3 million years ago. Consistent with observations of high sulfate, we observed sulfate reduction at two depths (250.5 and 366.6 m) from conspicuous formation of sulfide and production of H2S in enrichment cultures, but we did not observe sulfate reduction in any other enrichment cultures deeper in the sequence, which is consistent with negative quantitative PCR results for dsr genes, despite high sulfate concentrations within the core.
The porosity of the materials is unlikely to contribute to the observed changes in abundance since porosities throughout the post-impact sediments do not show a large decline with depth. High porosities are not required for microbial communities to be sustained in the deep subsurface, provided pores are sufficiently interconnected to allow for the flow of nutrients and redox couples (Frederickson et al., 1997). The general decline in cell number in other samples (both deep marine sediments and the coastal plain sediments) is correlated to a decrease in available carbon at depth. However, DOC concentrations in the CBIS substantially exceed those found in most other environments. DOC availability appears to be high throughout the core (>16 mg/L) (Sanford et al., 2009). TOC is only high in the interval 200–400 m, where it can exceed 1.36% by weight, and at 1671 m, where it is the highest in the core (2.22%; Sanford et al., 2009).
The gradient of increasing salt concentration may be an important factor in the steep decline in cell numbers. The volume of brine in the structure suggests that it is a pre-impact relic that was never flushed out due to the low hydraulic conductivity (Sanford, 2003, 2005; Gohn et al., 2008). Salinity concentrations throughout the impact sections exceed that of seawater (almost reaching 2 times that of seawater between 800 and 1100 m) (Poag, 1999; Sanford et al., 2004, 2009; McFarland and Bruce, 2006). High salt concentrations generally inhibit microbial growth (Grant, 2004). The isolation and enrichment data show, however, that some indigenous microorganisms can grow at the salt concentrations found in the impact structure and that many of them belong to phylotypes previously associated with saline environments such as Halobacterium and Exiguobacterium spp. Thus, the chemical conditions established by the impact event affect the physiology of the deep subsurface microbial communities even today.
Consistent with previous terrestrial deep subsurface studies, enrichment cultures yielded limited numbers of organisms (Colwell et al., 1997), and the MPN analysis showed that in heterotrophic media the maximum percentage that was enriched was 0.1% of the population, though it was usually much lower. We isolated a large number of Firmicutes. Subsurface environments have previously yielded isolates or sequences of Bacillus (e.g., Zheng and Kellogg, 1994; Boone et al., 1995; Chandler et al., 1998; Kanso et al., 2002; Wang et al., 2005; Batzke et al., 2007; Feng et al., 2007) and Clostridium species (Szewzyk et al., 1994; Greene et al., 2004).
Above the granite megablock, microbial abundance between 867 and 1096 m was generally below the detection limits of the methods we used. The hydrologic data suggest that the permeability of this section is low and that water within the section is a relic of the immediate post-impact environment (Sanford, 2005; Sanford et al., 2009). Our data are consistent with a scenario that might include sterilization of the section by impact-induced heating (either directly or as a result of vertically advected heat from the suevites and impact melt rocks) (Sanford, 2005; Malinconico et al., 2009). This interval has remained biologically impoverished since the impact. This hypothesis is supported by our experiments that showed the growth of isolates in material from the impoverished zones in the crater. The experiments showed that it is not the chemical conditions within the material that inhibit growth but that the material has not been colonized. Nevertheless, microbial enumerations showed that some parts of the section are colonized. This is consistent with the isolation of a novel Tessaracoccus sp. (Finster et al., 2009) in this section of the crater. Actinobacteria have previously been reported from the deep subsurface (Blakwill et al., 1997; Crocker et al., 2000; Brown and Blakwill, 2009).
The hypothesis that a disruption about 35.3 million years ago could alter the supply of redox couples and nutrients to the present-day biota is supported by work in other deep subsurface sites. For example, Tseng and Onstott (1997) estimated that the time for water to reach the subsurface strata they examined in the Taylorsville rift basin (at 2.8 km depth) was 50–180 million years. Boone et al. (1995) recovered organisms from the Taylorsville basin, and based on ground-water modeling, they calculated that the organisms were probably introduced 140–200 million years ago and have since been isolated. Although the Taylorsville basin is lithologically very different from the Chesapeake impact structure, the data qualitatively provide evidence for hydrologic isolation and long-term viability of deep subsurface organisms in terrestrial environments less than 150 km from the impact site.
Paleo-pasteurization of subsurface communities has been proposed in other sites. For example, Adams et al. (2006) and Larter et al. (2006) suggested that the good preservation of subsurface oil in the west of the Peace River tar sands, Alberta, Canada, is the result of the oil being heated to 84±4°C ca. 85–90 million years ago. They suggested that above 80°C the oil would have been pasteurized, which would explain the lack of degradation observed in its constituent hydrocarbons. Their data are consistent with the idea that regions of the deep subsurface can be sterilized and remain that way for tens of millions of years.
The hypothesis that the region of the crater in which water has not been flushed out could remain biologically depauperate is supported by some simple diffusion estimates. Fenchel (2008) calculated the diffusion coefficient of motile bacteria in sediment to be ∼1×10⁻⁹ m2/s. The time it would take for microorganisms from the post-impact seafloor now buried at 444 m depth to travel ∼0.65 km to the lower parts of the resurge deposits at 1096 m depth would therefore be ∼13 million years. In reality, microorganisms will not achieve this motility in the deep subsurface due to the low permeability of the material and the lower diffusion coefficients of nonmotile organisms. The time to achieve geochemical equilibrium once microorganisms do reach these depths would be even greater. These calculations show that it is reasonable to observe that the deep subsurface is still perturbed by a major disturbance ∼35 million years ago.
In addition to evidence of impact-induced impoverishment of the deep biosphere, the enumeration data exhibit evidence for impact-induced formation of deep subsurface habitats. Below the granite megablock in the region that corresponds to suevite and fractured schist and pegmatite rock, there is an increase in cell abundance. Thus, this zone potentially exhibits evidence for impact-induced improvement of the deep subsurface habitat for life. In the lower part of the zone, breccia veins and dikes are locally present with associated fracture networks caused by impact. The material in this zone was probably subjected to sterilizing temperatures in the impact-induced hydrothermal system that occurred after impact (Sanford, 2005) or by heating from melt rocks. The quantity of melt phases in the upper part of the zone suggests an average temperature at the time of deposition of >350°C (Malinconico et al., 2009). Microorganisms must have been reintroduced after temperatures within the structure dropped below the upper temperature limit for microbial growth (<113°C; Böchl et al., 1997; <121°C; Kashefi and Lovley, 2003). Although there is no evidence to support regional lateral advection, microorganisms could have gradually diffused in from nearby clasts that were not sterilized or may have been carried in by compaction-driven vertical advection from the permeable schist and pegmatite region below (Sanford et al., 2009). We do not have corresponding enumeration data for the unaltered material at this depth outside the crater, but Chapelle et al. (1987) observed cell abundances of 103 cells/g in sediment similar to the target material in this zone and at depths corresponding to Cretaceous sediments.
The drop in salinity in some parts of this zone compared to the higher regions of the structure suggest movement of freshwater into the fractures. We did not enrich iron-reducing organisms, but quantitative PCR indicated that the presence of Geobacter species and the Fe2+ concentrations at this depth, which can exceed 5 μmol/g sediment (Sanford et al., 2009), suggest the occurrence of iron reduction. No methanogens were cultured from this depth, which would suggest an environment where there is no production or availability of the H2 required for methanogenesis. Further, the absence of methanogens is consistent with the lack of detection of mcrA genes.
These data have implications for our understanding of life on early Earth and its possible existence elsewhere. They provide the empirical support for the hypothesis that, on Archean Earth, when the impact frequency was much higher than today, impacts would have improved refugia for subsurface life to escape the effects of subsequent bombardments (Sleep and Zahnle, 1998; Abramov and Mojzsis, 2009) by fracturing deep rocks and extending the depth of the subsurface biosphere.
These data suggest that the deeply fractured regions of martian impact structures may be preferential locations to investigate the habitability of the deep subsurface of that planet. Deep drilling into fractured zones of impact structures, analogous to the region of enhanced microbial growth we observed in the Chesapeake structure, would be an effective way to answer the question of whether the subsurface of Mars ever harbored conditions conducive to life. As impact ejecta can be used to sample the subsurface of Mars for astrobiological prospecting (Cockell and Barlow, 2002), the data show that material sampled from the deep subsurface of Mars in impact ejecta might have sampled deeply fractured zones with habitable conditions.
Footnotes
Acknowledgments
We acknowledge support from the ICDP, USGS, Carlsberg Foundation, and the NASA Astrobiology Institute. Funding for J.K. was provided through the “Verbundvorhaben GeoEnergie” and for J.R. through the German Excellence Initiative. The use of brand names does not imply endorsement by USGS.
Abbreviations
CBIS, Chesapeake Bay impact structure; DGGE, denaturing gradient gel electrophoresis; DOC, dissolved organic carbon; FISH, fluorescent in situ hybridization; ICDP, International Continental Drilling Program; MPN, most probable number; ODP, Ocean Drilling Program; USGS, United States Geological Survey; XRD, X-ray diffraction.