
Abstract
The atmospheric pressure on Mars ranges from 1–10 mbar, about 1% of Earth pressure (∼1013 mbar). Low pressure is a growth-inhibitory factor for terrestrial microorganisms on Mars, and a putative low-pressure barrier for growth of Earth bacteria of ∼25 mbar has been postulated. In a previous communication, we described the isolation of a strain of Bacillus subtilis that had evolved enhanced growth ability at the near-inhibitory low pressure of 50 mbar. To explore mechanisms that enabled growth of the low-pressure-adapted strain, numerous genes differentially transcribed between the ancestor strain WN624 and low-pressure-evolved strain WN1106 at 50 mbar were identified by microarray analysis. Among these was a cluster of three candidate genes (des, desK, and desR), whose mRNA levels in WN1106 were higher than the ancestor on the microarrays. Up-regulation of these genes was confirmed by quantitative reverse transcription–polymerase chain reaction (qRT-PCR) analysis. The des, desK, and desR genes encode the Des membrane fatty acid (FA) desaturase, the DesK sensor kinase, and the DesR response regulator, respectively, which function to maintain membrane fluidity in acute response to temperature downshift. Pressure downshift caused an up-regulation of des mRNA levels only in WN1106, but expression of a des-lacZ transcriptional fusion was unaffected, which suggests that des regulation was different in response to temperature versus pressure downshift. Competition experiments showed that inactivation of the des gene caused a slight, but statistically significant, loss of fitness of strain WN1106 at 50 mbar. Further, analysis of membrane FA composition of cells grown at 1013 versus 50 mbar revealed a decrease in the ratio of unsaturated to saturated FAs but an increase in the ratio of anteiso- to iso-FAs. The present study represents a first step toward identification of molecular mechanisms by which B. subtilis could sense and respond to the novel environmental stress of low pressure. Key Words: Bacillus—Evolution—Simulated martian atmosphere—Laboratory simulation experiments—Molecular biology. Astrobiology 12, 258–270.
1. Introduction
Microorganisms have difficulty coping with low pressure, and a threshold of 25 mbar has been reported below which common spacecraft contaminant microorganisms are not capable of growth (Schuerger and Nicholson, 2006). To test whether Earth microbes could evolve the ability to grow at reduced pressure, we previously reported the isolation of a Bacillus subtilis strain, WN1106, from a culture grown at low pressure for 1000 generations, which had evolved increased fitness at 50 mbar when compared to its ancestral strain, WN624 (Nicholson et al., 2010). To uncover the molecular mechanisms that underlie the adaptation of B. subtilis to enhanced growth at low pressure, we examined transcription microarrays and compared the evolved and the ancestral strains propagated at either Earth atmospheric pressure (1013 mbar) or hypobaric (50 mbar) conditions (S.M. Waters, J.A. Robles-Martínez, P. Fajardo-Cavazos, and W.L. Nicholson, unpublished). Among numerous genes that were found to exhibit a higher steady-state mRNA level during hypobaric growth in the evolved strain as compared with the parental strain was a cluster of three genes (des, desk, and desR), the products of which are involved in the maintenance of membrane fluidity in response to temperature downshift in B. subtilis (Aguilar et al., 1998, 2001; Cybulski et al., 2002). The des gene encodes the sole fatty acid (FA) desaturase in B. subtilis, whereas desK and desR encode a membrane-embedded sensor kinase DesK and its cognate cytoplasmic response regulator DesR, respectively. When the DesK protein senses decreased membrane fluidity in response to lowered temperature, it phosphorylates DesR. In turn, DesR in its phosphorylated form is a positive activator of des transcription, and the Des enzyme desaturates the acyl chains of membrane phospholipids, which thus increases membrane fluidity at decreased temperature (Aguilar et al., 2001). Activation of the des-desKR system is considered an acute response to temperature downshift; long-term adaptation to changes in membrane fluidity at different temperatures in B. subtilis appears to be determined not by membrane FA desaturation but by the ratio of anteiso- versus iso-forms of FAs in the membrane (reviewed in de Mendoza et al., 2002; Zhang and Rock, 2008).
Alteration of membrane fluidity by changes in the ratio of unsaturated:saturated membrane phospholipids has also previously been implicated in microbial adaptation to growth at high pressure (Fang and Bazylinski, 2008; Kato et al., 2008). These observations prompted us to investigate the possible role that des might play in adaptation to growth at low pressure. In this communication, we analyzed the changes in des gene expression and membrane FA composition associated with growth under low pressure. In addition, the contribution of des expression to the fitness of evolved strain WN1106 was investigated with a des knockout strain and pairwise competition experiments.
2. Materials and Methods
2.1. B. subtilis strains used
The B. subtilis strains used in this work are listed in Table 1. Strains M19 (amyE::des-lacZ cat) and AKP4 (Δdes::kan) were generous gifts from the laboratories of Ivo Konopásek and Diego de Mendoza, respectively (Table 1). To construct strains to measure β-galactosidase activity from the des promoter, chromosomal DNA extracted from strain M19 was used to transform competent cells of ancestral strain WN624 and 50 mbar evolved strain WN1106 to obtain strains WN1216 and WN1217, respectively (Table 1). In a like manner, with the use of donor DNA extracted from strain AKP4, Δdes::kan deletion-insertion mutants were introduced into strains WN624 and WN1106, which resulted in strains WN1256 and WN1257, respectively (Table 1). Methods for chromosomal DNA isolation and transformation of competent B. subtilis cultures have been described in detail previously (Boylan et al., 1972; Cutting and Vander Horn, 1990).
Abbreviation: →, transformation with chromosomal DNA.
2.2. Media and growth conditions
For all experiments, Luria-Bertani (LB) liquid or agar medium (Miller, 1972) was used and supplemented when appropriate with the following antibiotics at the indicated final concentrations: spectinomycin (Spc), 100 μg/mL; chloramphenicol (Cm), 5 μg/mL; or kanamycin (Kan), 5 μg/mL. All liquid cultures were incubated at 27°C with moderate rotary shaking (∼150 rpm) unless otherwise indicated. Cells were grown under four different regimes: (i) Earth-normal atmospheric pressure (1013 mbar) and composition (∼78% N2 and ∼21% O2) (hereafter called “standard” conditions); (ii) Earth atmospheric composition but at 50 mbar pressure (hereafter called “low-pressure” conditions); (iii) an environmental growth chamber (Richards et al., 2006) supplied with a mixture of 99% N2 and 1% O2 at 1013 mbar (hereafter called “low-oxygen” conditions); or (iv) 25 mL screw-cap tubes filled to the top with LB medium and incubated without shaking at 1013 mbar (hereafter called “low-aeration” conditions). Vacuum control for low pressure was supplied by a pumping system (KNF Neuberger, Trenton, NJ, USA) fitted with 0.22 μm in-line air filters. Optical density (OD) was measured with a Klett-Summerson colorimeter fitted with the No. 66 (red, 660 nm) filter (Note: for purposes of comparison, 100 Klett units=1 OD660).
2.3. RNA isolation
Cells from 10 mL aliquots of cultures grown under standard, low-pressure, or low-oxygen conditions were harvested rapidly by centrifugation in a microfuge and frozen at −20°C. Total RNA was extracted with the RiboPure-Bacteria kit (Ambion/Applied Biosystems), following the manufacturer's protocol. The concentration and purity of RNA in each solution obtained was measured by UV absorbance at 260 and 280 nm (Sambrook and Russell, 2001).
2.4. Microarray experiments
Separate cultures of strains WN624 and WN1106 were grown under standard, low-pressure, or low-oxygen conditions. Equivalent amounts of exponential-phase cells were harvested and total RNA isolated as described above. Cy-3 or Cy-5 labeled cDNAs were prepared from the total RNA preparations and used to probe 15,000-feature custom B. subtilis microarrays (Agilent) at the University of Florida Interdisciplinary Center for Biotechnology Research. Log2-transformed data were subjected to LOESS and quantile normalization, and the false discovery rate was determined by the method of Benjamini and Hochberg (1995). Gene induction or repression ratios of ≥3-fold (n=4; P≤0.05) were considered as significant. A detailed description of the microarray analysis and the accession numbers for their data sets will be submitted for publication elsewhere (Waters et al., unpublished data).
2.5. Quantitative reverse transcription–polymerase chain reaction (qRT-PCR)
Oligonucleotide primers (Sigma) used in qRT-PCR experiments are listed in Table 2 and further indicated for each experiment. By using the specified primer pairs and 0.5 μg of total RNA isolated as described above, cDNAs were generated and amplified with the SuperScript III Platinum SYBR Green One-Step qRT-PCR kit (Invitrogen), following the manufacturer's recommended protocol. Reactions were performed and monitored in a MiniOpticon real-time PCR detection system (Bio-Rad). For des mRNA and the desK and desR cistrons of desKR mRNA, individual standard curves were generated by using template concentrations within the linear dynamic range of the assay as described previously (Fajardo-Cavazos et al., 2010). Threshold cycle (CT) values obtained were used to calculate the number of molecules functioning as templates in each assay. After each qRT-PCR experiment, melting curve analysis was performed to confirm the identity of the expected products.
The number in each name denotes the nucleotide position in the sequences of B. subtilis des, desK, or desR, starting from each gene's translational start codon, and corresponds with the 5′-terminal nucleotide of each primer. F, forward; R, reverse.
2.6. Beta-galactosidase assays
Cells in 1 mL samples of culture were harvested by centrifugation, and β-galactosidase assays were performed as described previously (Nicholson and Setlow, 1990). Beta-galactosidase activity was expressed in Miller units (Miller, 1972).
2.7. DNA sequencing
To obtain the nucleotide sequence of the des-desKR region from strains WN624 and WN1106, ∼50 ng of purified chromosomal DNA (Cutting and Vander Horn, 1990) was used as the template for amplification by PCR with the primer pairs des-192F and des+794R; des+594F and desK+822R; desK+629F and desR+374R; and desR+177F and desR+710R (Table 2). PCR reactions were performed as described previously (Benardini et al., 2003) in a PTC-200 thermal cycler (MJ Research), with 35 cycles of denaturation for 1 min at 95°C, annealing for 2 min at 55°C, and elongation for 3 min at 72°C. After a final incubation for 10 min at 72°C, the PCR products were purified with a Qiaquick PCR purification kit (Qiagen), and the purified products were sequenced at the University of Florida Interdisciplinary Center for Biotechnology Research.
2.8. Competition experiments
Determinations of relative fitness of strains under various environmental conditions were carried out by pairwise competition experiments as described previously (Nicholson et al., 2010; Maughan and Nicholson, 2011). Briefly, strains to be compared pairwise were grown separately overnight in liquid LB medium containing the appropriate selective antibiotic and then mixed in equal volumes and diluted 1:100 into 10 mL of nonselective liquid LB medium. Each mixed culture was grown at 27°C overnight either at 1013 mbar (standard pressure), 50 mbar (low pressure), or 1013 mbar (low aeration). At daily intervals the mixed cultures were, diluted again 1:100 into fresh LB medium, and growth was repeated under the same conditions. Before each daily dilution step, an aliquot was removed from each mixed culture, diluted serially 10-fold in phosphate-buffered saline (PBS; 10 mM potassium phosphate, pH 7.4, 150 mM NaCl), and plated on LB medium containing the antibiotic appropriate to each input strain. After overnight incubation at 37°C, colonies were counted, and the colony-forming units of each strain was calculated. All competition experiments were carried out in duplicate mixed cultures. A selection coefficient, S, was calculated from each competition as S=[ln(R t /R t−1)]/t, where R is the ratio of the number of bacteria of the test strain to the number of bacteria the reference strain, and t is the number of generations (Dykhuizen, 1990). The relative fitness of each test strain was calculated from the selection coefficient as described previously (Woods et al., 2011).
2.9. Fatty acid (FA) analysis
Bacteria were grown in 100 mL of liquid LB medium for 24 h at 27°C at either 1013 or 50 mbar. Cells were harvested by centrifugation and resuspended in either 1 mL (50 mbar cultures) or 4 mL (1013 mbar cultures) of PBS. One-milliliter aliquots were collected by centrifugation and stored frozen at −20°C until FA analysis. Whole-cell FAs were extracted and converted to FA methyl esters (FAMEs) as follows: frozen cells were thawed at 4°C and transferred to glass culture tubes covered with Teflon-lined caps. Saponification of FAs was achieved by adding 1.0 mL of 15% sodium hydroxide in 1:1 aqueous methanol to cell preparations, vortexing, heating mixtures at 100°C in a circulating water bath for 5 min, followed by a second vortexing step and further heating for 25 min at 100°C. Methylation of FAs was achieved by the addition of 2 mL of 1:0.85 mixture of 6 N hydrochloric acid in methanol to the samples, vortexing and heating at 80°C in a circulating water bath for 10 min, followed by rapid cooling in ice. The resulting FAMEs were extracted from the solution by adding 1.25 mL of a 1:1 (v/v) mixture of methyl tert-butyl ether and hexane and placing the tubes on a rotary mixer for 10 min. The top organic phase was collected from each sample and washed with 3 mL of 1.2% NaOH, then transferred to a gas chromatography (GC) vial for analysis. FAMEs were separated by GC with the MIDI system (Microbial I. D. Inc., Newark, DE, USA). The GC system consisted of an HP 6890 gas chromatograph (Hewlett-Packard, Wilmington, DE, USA) with a flame ionization detector and HP 3365 ChemStation software. Individual FAME peaks were identified and reported as percent of total.
2.10. Statistical analyses
All experiments were performed in at least duplicate, and the number of replicates is indicated for each experiment in the results section. Kaleidagraph version 3.6.2 (Synergy Software, Reading, PA, USA) was used for statistical calculations and analyses. Differences with P values ≤0.05 were considered statistically significant.
3. Results
3.1. Identification of des-desKR by microarray analysis
To identify genes that exhibit altered expression at low pressure, ancestral strain WN624 and low-pressure-evolved strain WN1106 were grown overnight under standard, low-pressure, or low-oxygen conditions. Total RNA obtained from each culture was used for microarray analysis of gene expression, which indicated at low pressure an increased level of mRNAs for the closely linked des gene and desKR operon. Figure 1 shows the ratio of des, desK, and desR mRNA levels in strain WN1106 relative to those in WN624 under the different conditions tested. At standard conditions, no significant difference was detected in des, desK, or desR mRNA levels between WN624 and WN1106. However, under low-pressure conditions the mRNA levels of all three genes were ∼5–8 fold higher in WN1106 than in WN624 (Fig. 1). A 20-fold lowering of the atmospheric pressure in a vessel (from 1013 to 50 mbar) would reduce the partial pressure of oxygen, hence the concentration of oxygen dissolved in liquid, by a factor of 20 (Nicholson et al., 2010). This could cause indirect induction of gene expression via the anaerobic response (Nakano and Zuber, 2002) rather than by low pressure per se (Nicholson et al., 2010). Therefore, a microarray comparison of strains WN624 and WN1106 grown under low-oxygen conditions was also performed. No significant difference was observed in the mRNA ratios of des, desK, or desR in the two strains grown under low oxygen compared to standard conditions (Fig. 1). The results indicated that strain WN1106 was not simply responding to a low partial pressure of oxygen in the medium.
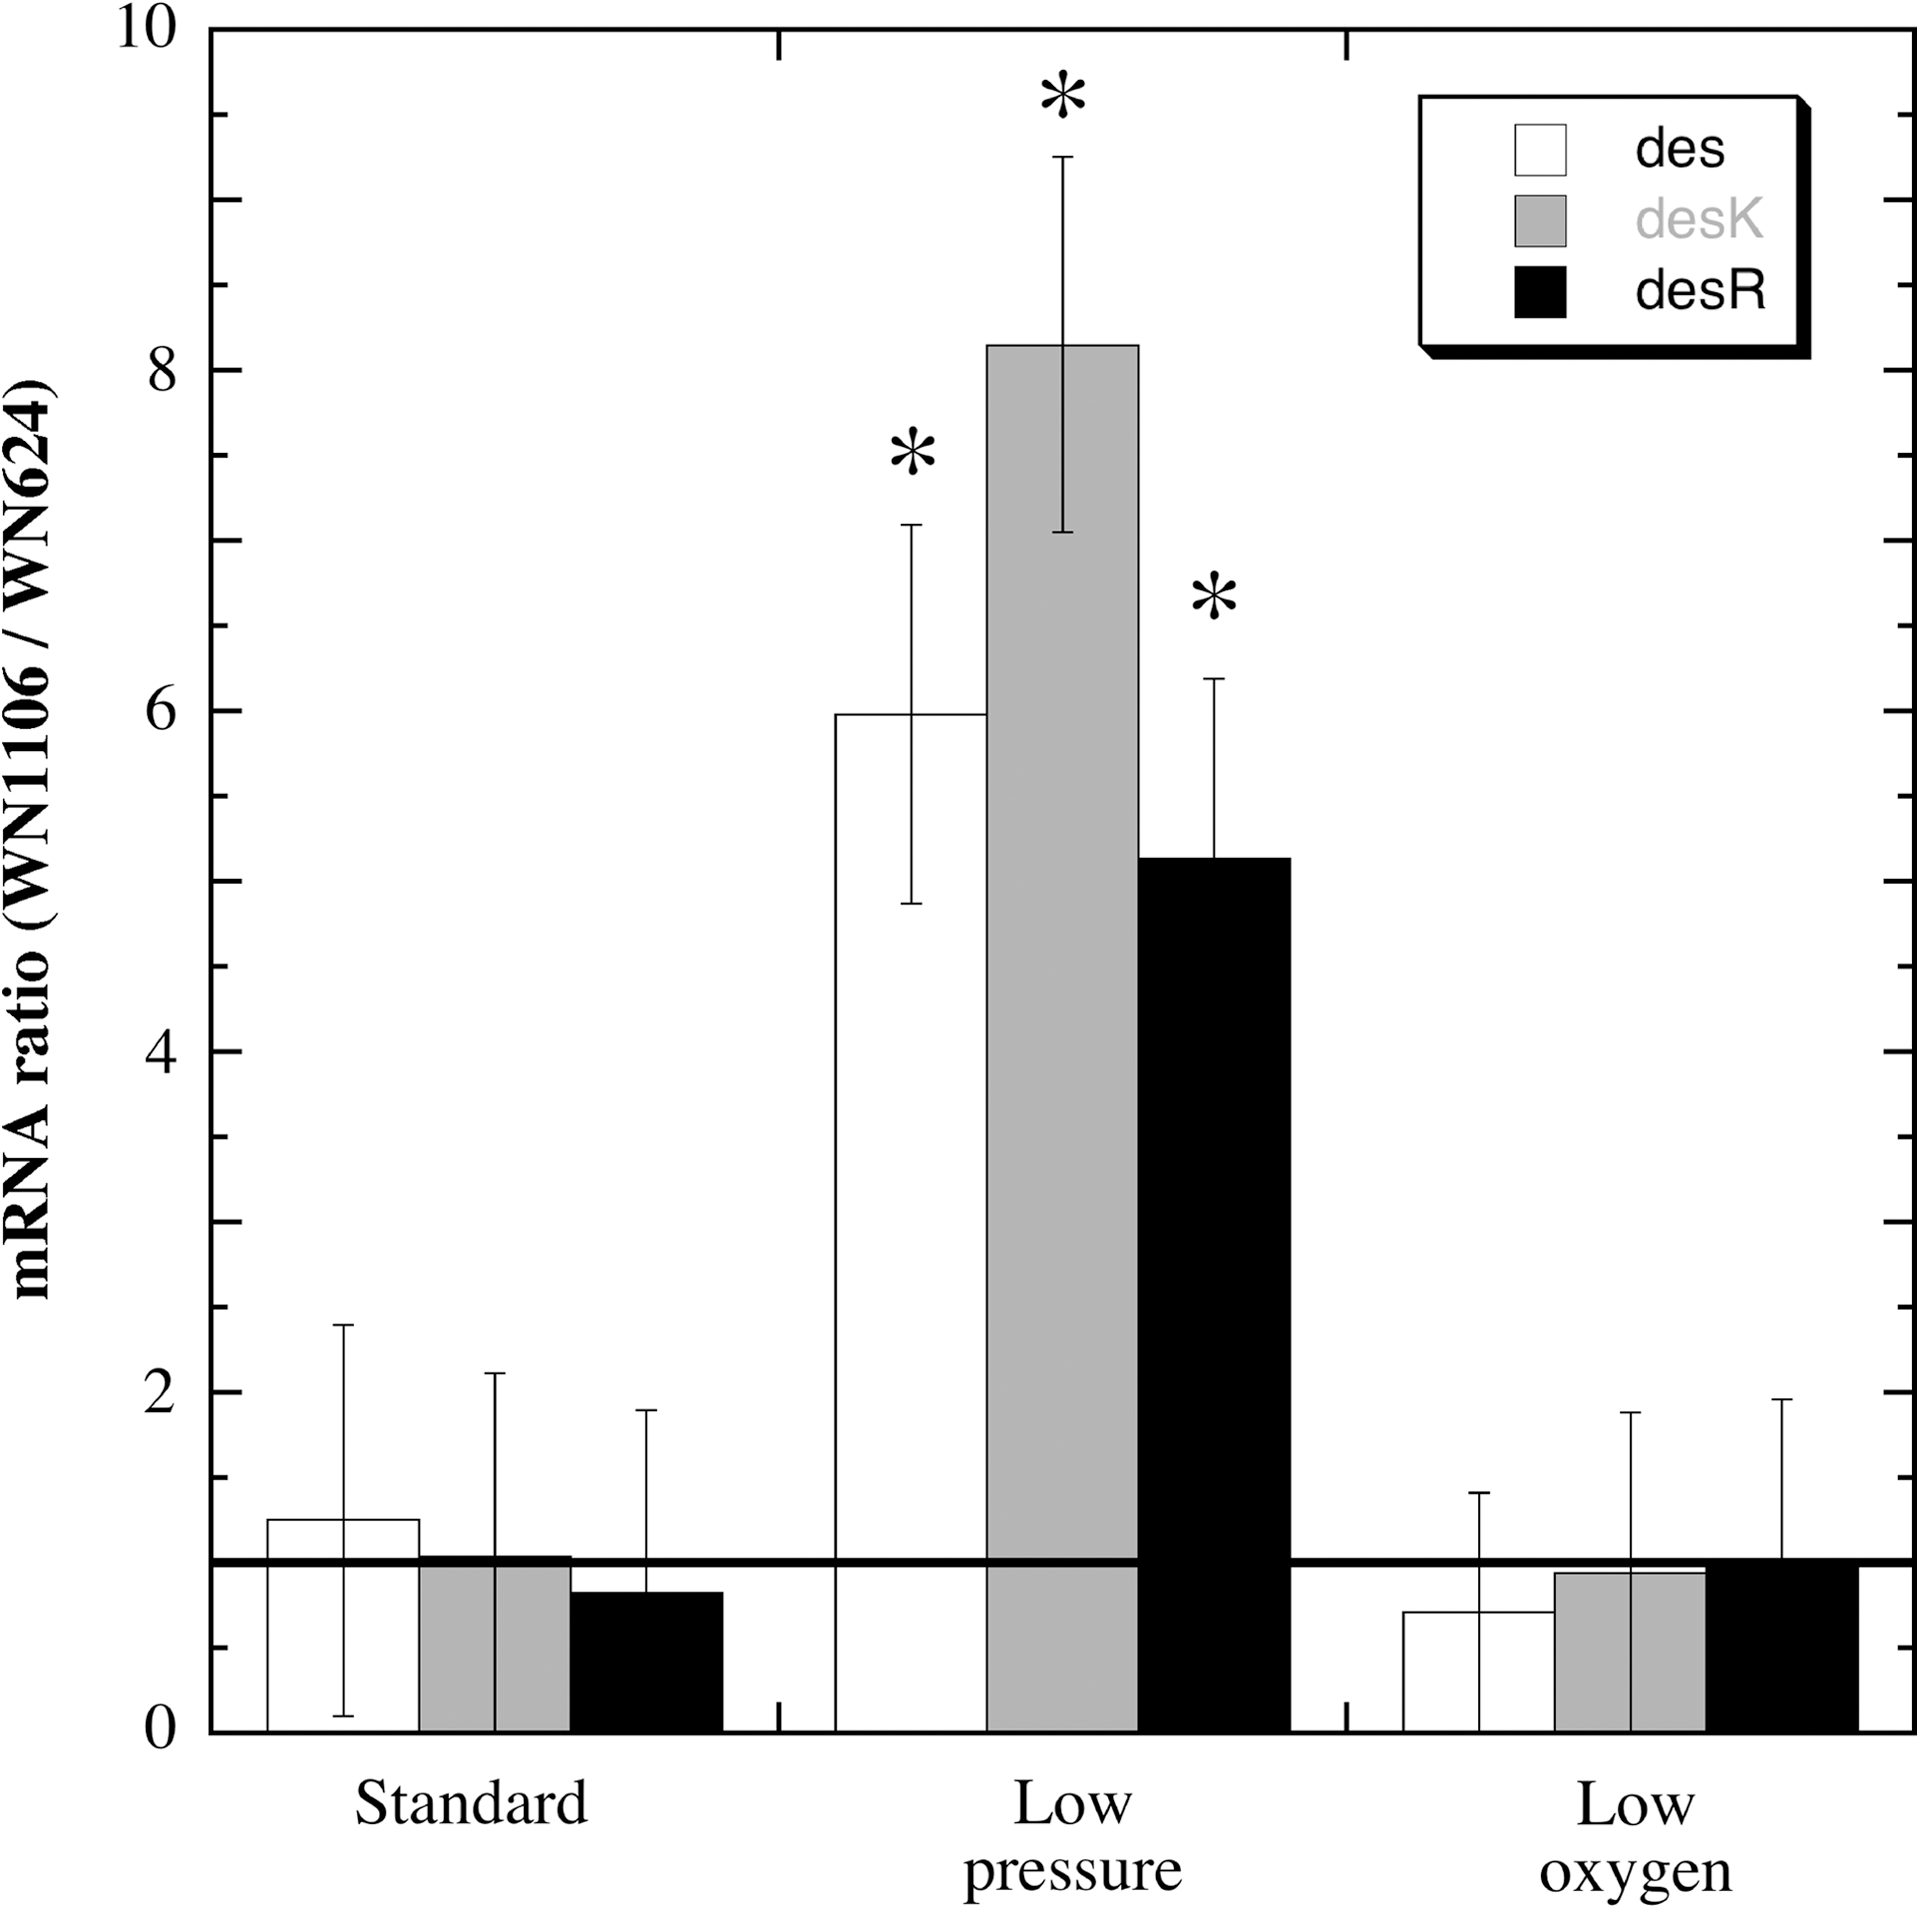
Microarray analysis of mRNA levels of des (open bars), desK (shaded bars), and desR (black bars). Depicted is the ratio of low-pressure-evolved strain WN1106 mRNA to ancestral strain WN624 mRNA at the three growth conditions tested. Data are averages±standard deviations (n=4). The horizontal line indicates a ratio of 1.0. Asterisks denote mRNA ratios that were significantly different (P≤0.05) when compared to standard conditions.
3.2. Confirmation of microarray results by qRT-PCR
To validate the gene expression results obtained by microarray analysis, mRNA levels were measured by the independent technique of qRT-PCR. Total RNA isolated from strains WN624 and WN1106, cultured as described above for microarray analyses, and the primer pair des+594F and des+794R were used in qRT-PCR to measure des mRNA. To measure mRNA from the bicistronic desKR operon, two separate qRT-PCR reactions were performed by using primer pair desK+629F and desK+822R for amplification of the desK cistron and primer pair desR+177F and desR+374R for amplification of the desR cistron. Figure 2 shows the ratio of des and desKR mRNA levels in strains WN1106 and WN624, grown at the same conditions as used in the microarray experiment but determined by qRT-PCR. As seen in the microarray experiment, qRT-PCR revealed that des, desK, and desR transcripts were significantly higher at 50 mbar in strain WN1106 as compared with WN624 (Fig. 2). In contrast, under standard atmosphere or at low-oxygen conditions, no significant difference in mRNA ratios was observed between strains WN1106 and WN624 (Fig. 2). Although the data in Fig. 1 and Fig. 2 are in agreement regarding the effect of low pressure versus low oxygen on des-desKR mRNA levels, note that the ratios of the low-pressure effect between WN1106 and WN624 as measured by microarray (5–8 fold) and qRT-PCR (35–3000 fold) both increased, but by different magnitudes. Both the microarray and qRT-PCR data indicate that the increased des-desKR mRNA levels in low-pressure-evolved strain WN1106 were likely due to low pressure itself and not due to a lowered partial pressure of O2 induced by vacuum.
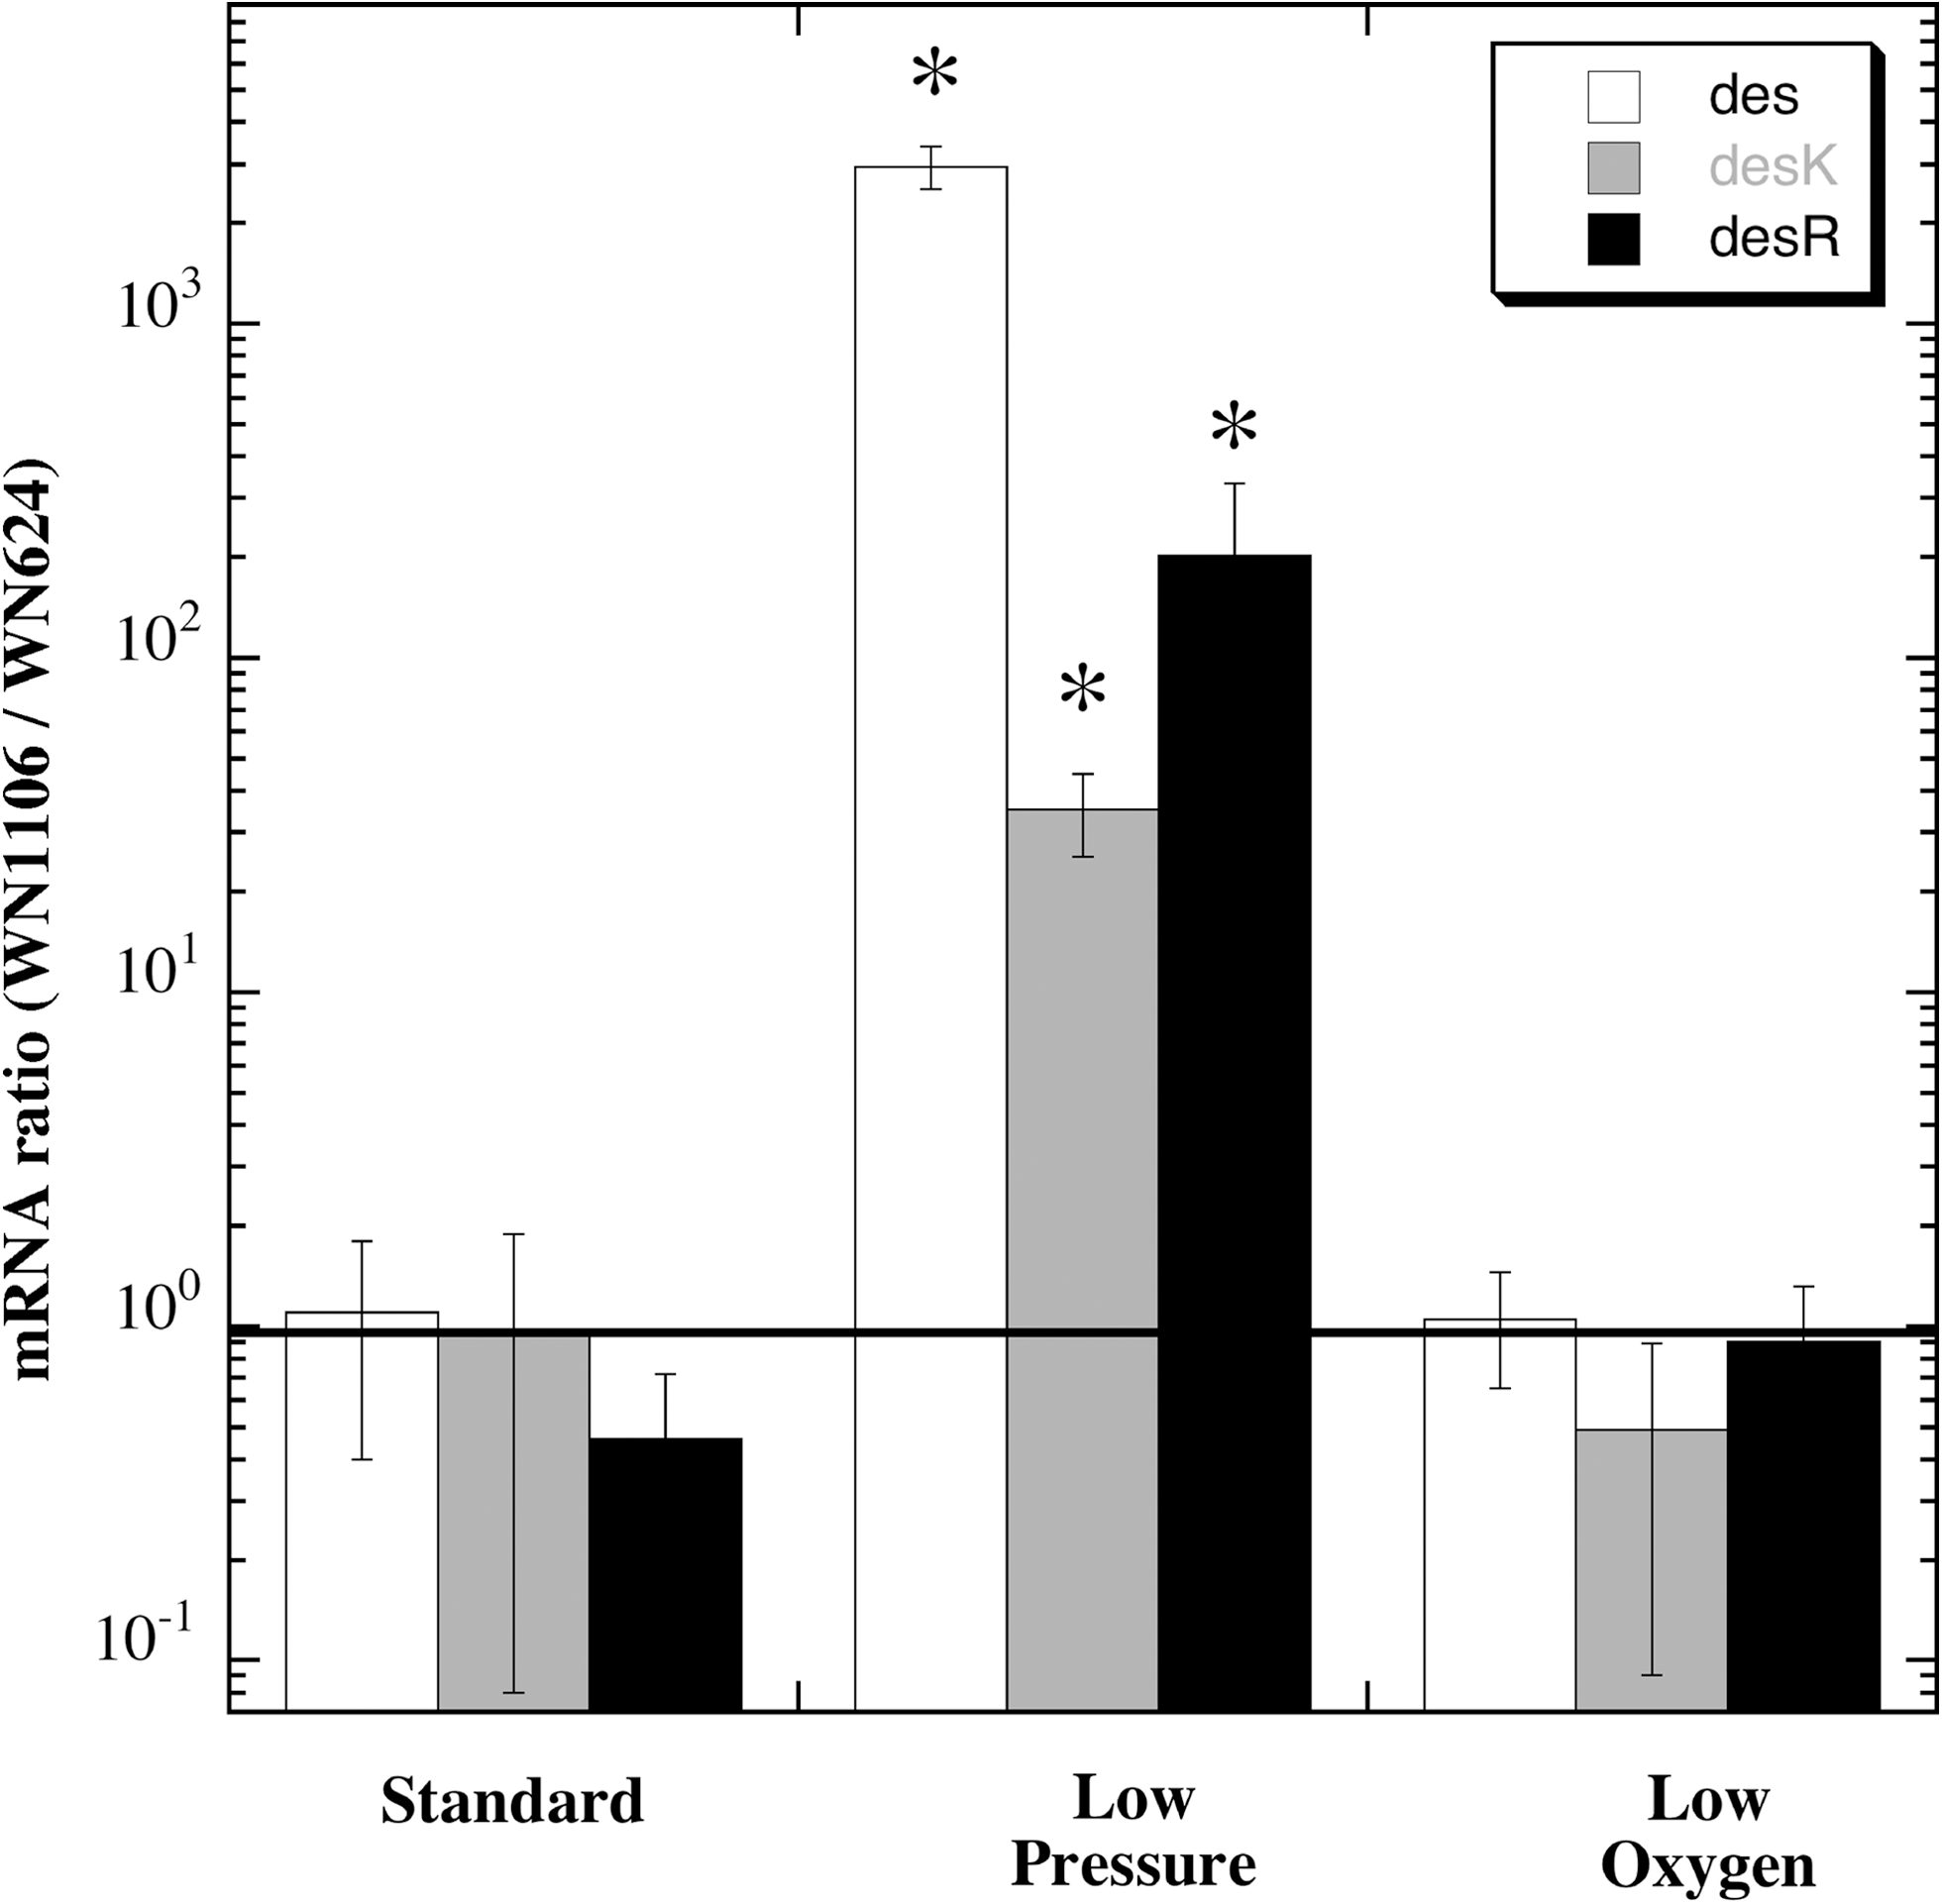
Analysis by qRT-PCR of mRNA levels of des (open bars), desK (shaded bars) and desR (black bars). Depicted is the ratio of low-pressure-evolved strain WN1106 mRNA to ancestral strain WN624 mRNA at the three growth conditions tested. Data are averages±standard deviations (n=4). The horizontal line indicates a ratio of 1.0 (i.e., 100). Asterisks denote mRNA ratios that were significantly different (P≤0.05) when compared to standard conditions.
3.3. Response of des-lacZ to pressure downshift
The molecular circuitry of des transcriptional activation by the DesK-DesR two-component system in response to temperature downshift has been studied in detail (Aguilar et al., 1998; Cybulski et al., 2002; Beranová et al., 2008, 2010; reviewed in de Mendoza et al., 2002). To test the possibility that des expression also responds to pressure downshift, a transcriptional des-lacZ reporter fusion was integrated at the amyE locus of strains WN624 and WN1106. The resulting strains, WN1216 and WN1217, respectively, were used to monitor des transcription by measuring β-galactosidase activity.
To ensure that the des-lacZ fusion responded appropriately in our strains, we first tested the ability of strains WN1216 and WN1217 to respond to a temperature downshift (Fig. 3). In both strains 1216 and 1217, the des-lacZ fusion behaved essentially identically, that is, the steady-state level of β-galactosidase expression was higher at 27°C than at 37°C, and the des-lacZ fusion was induced ∼10-fold by temperature downshift (Fig. 3). The only difference noted between strains 1216 and 1217 was an ∼2-fold difference in the absolute magnitude of des-lacZ expression under all conditions tested (Fig. 3A, 3B). The data are consistent with previous observations of des-lacZ response to temperature (Aguilar et al., 2001) and indicate that the temperature control aspect of the des-desKR system had remained intact during low-pressure evolution of strain WN1106.
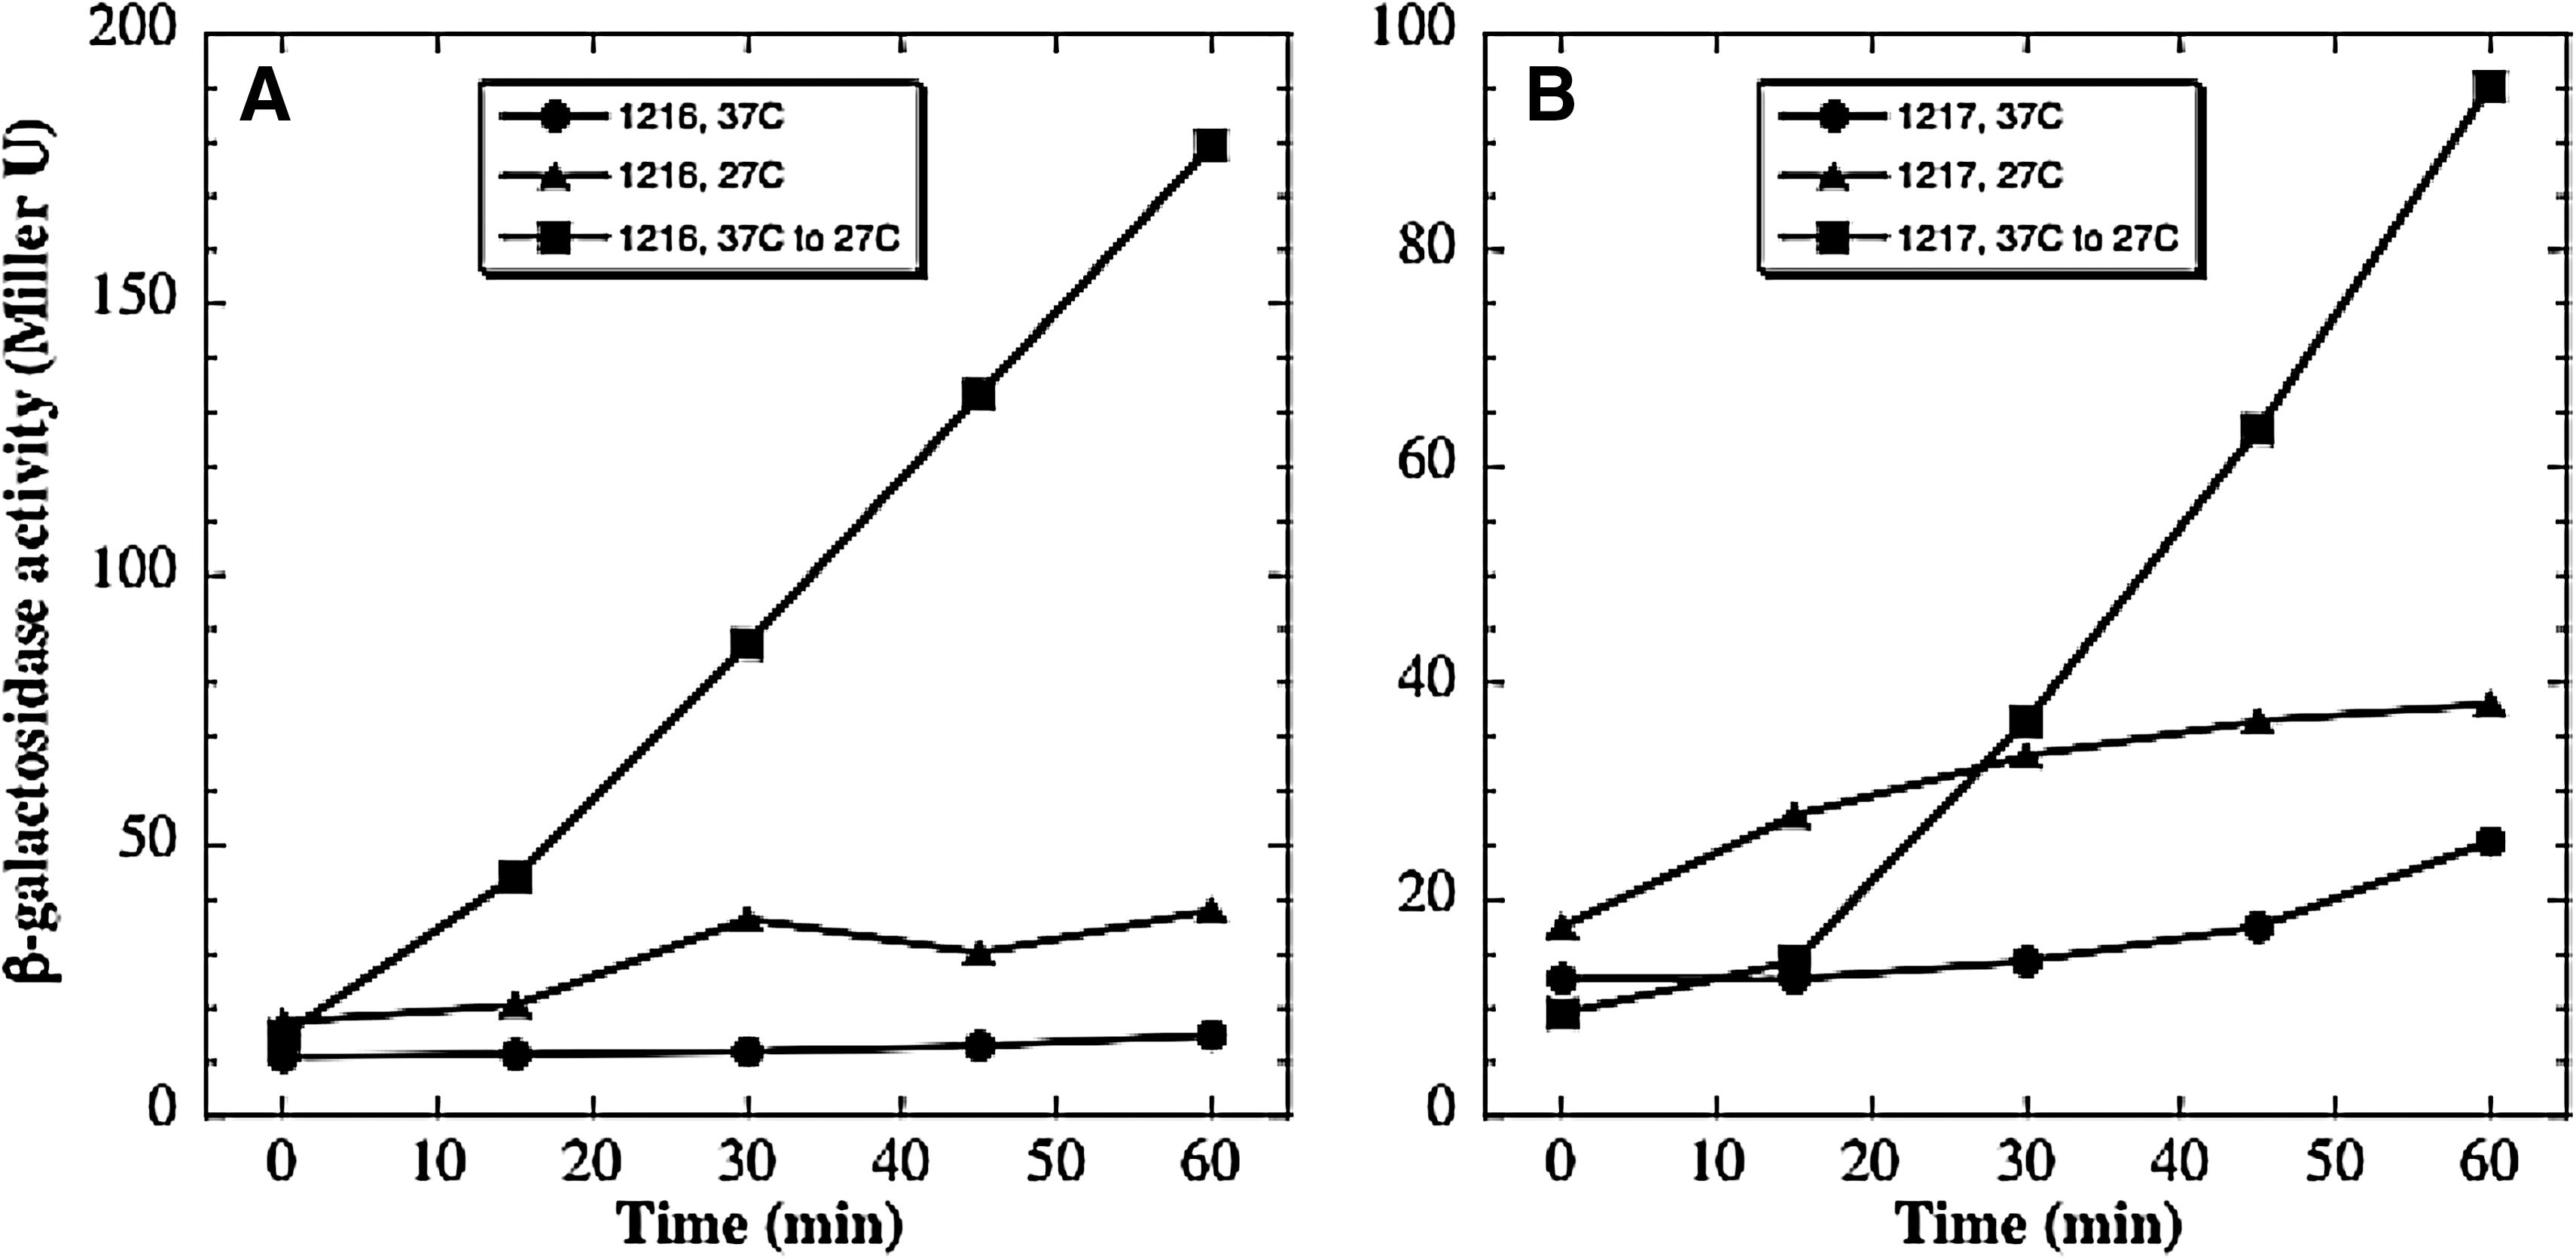
Temperature response of β-galactosidase activity encoded by the des-lacZ fusion in ancestral vs. low pressure-evolved strains. Strain WN1216 (ancestor) (
Next, to monitor the response of des-lacZ to low pressure, strains WN1216 and WN1217 were cultivated at 27°C and 1013 mbar to mid-exponential phase and subjected to a pressure downshift to 50 mbar for 90 min. The samples were then harvested both for assay of β-galactosidase activity and for total RNA isolation for qRT-PCR (Fig. 4). If des-lacZ expression were reflective of des mRNA levels, then it would be expected that β-galactosidase activity would have been much higher at low pressure in WN1217 than in WN1216 (Figs. 1 and 2). However, the results showed no significant induction of des-lacZ expression in either strain (Fig. 4), which indicates that the des-lacZ fusion was not induced at low pressure, in contrast to its clear induction at low temperature (Fig. 3). From aliquots of the same samples, qRT-PCR was performed with the primer pair des+594F and des+794R. When des mRNA levels were measured, a significant increase in the expression of des mRNA was detected at 50 mbar only in low-pressure-evolved strain WN1217 (Fig. 4), consistent with earlier observations from the microarrays (Fig. 1) and qRT-PCR experiments (Fig. 2). In addition to the above pressure-shift experiment, we also measured des-lacZ encoded β-galactosidase and des mRNA levels in strains WN1216 and WN1217 after overnight incubation under standard and low-pressure conditions and obtained essentially the same results as presented in Fig. 4 (data not shown).
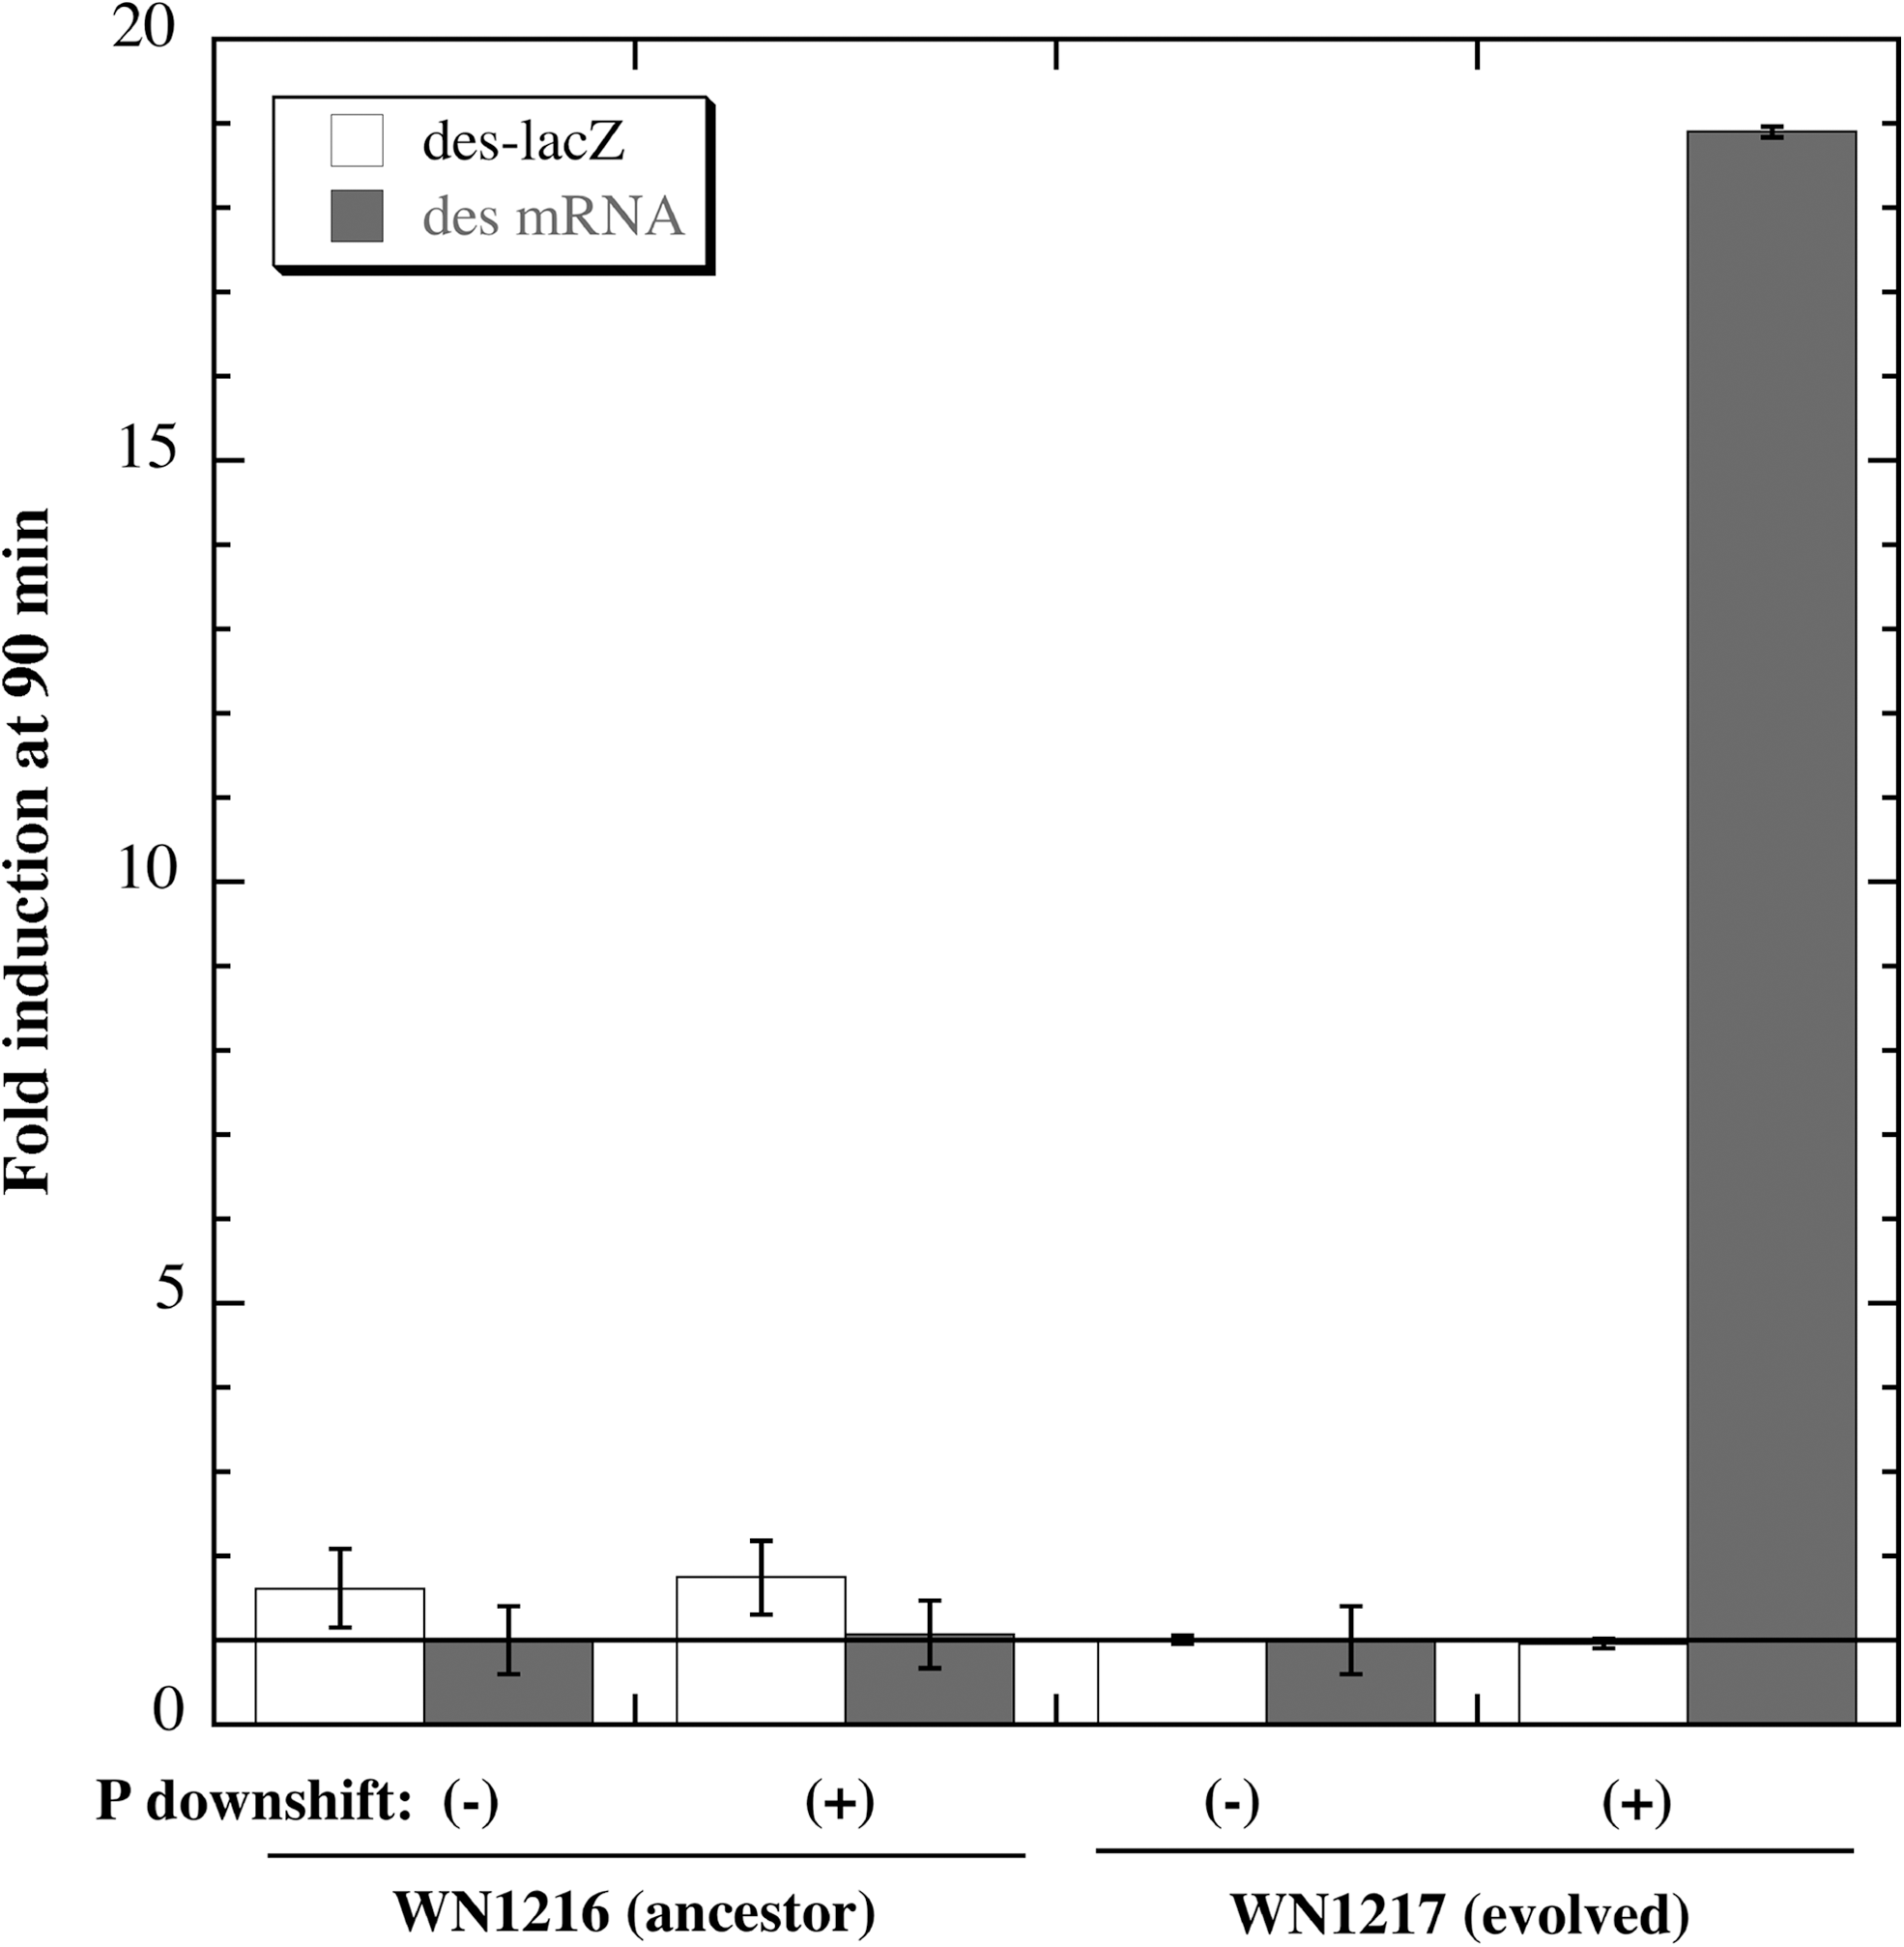
Response of des-lacZ fusion expression (open bars) and des mRNA levels (shaded bars) 90 min after a pressure (P) downshift from 1013 to 50 mbar in ancestral strain WN1216 and low-pressure-evolved strain WN1217. Data are averages±standard deviations (n=2). Strains WN1216 and WN1217 were producing 98 and 102 Miller units of β-galactosidase, respectively, at time zero of the experiment.
3.4. DNA sequencing of des-desKR region
All experiments thus far have indicated that des was expressed differently in the evolved strain than in the ancestral strain when growth occurred under hypobaric conditions (50 mbar). The possibility that mutational changes occurred in the regulatory region of the des gene or in the downstream desKR operon was explored by nucleotide sequencing. The sequences of the des-desKR genes and surrounding regions were found to be identical in strains WN624 and WN1106 (data not shown), and their sequences were identical to the corresponding published des-desKR sequence of the reference strain B. subtilis 168 genome (GenBank accession number NC_000964). Thus, the difference in regulation at low pressure observed between ancestral strain WN624 and low-pressure-evolved strain WN1106 was not due to a mutation in any of the coding sequences or cis-regulatory elements of the des gene or the desKR operon.
3.5. Decreased fitness of WN1106 at low aeration
It was previously shown by competition experiments that low-pressure-evolved strain WN1106 had gained a fitness advantage at 50 mbar over ancestral strain WN624 (Nicholson et al., 2010). However, lowering the pressure in the headspace above a culture also results in lowering of the partial pressure of dissolved O2 in the growth medium; thus it is possible that WN1106 could also have adapted to low oxygen, rather than (or in addition to) low pressure per se (Nicholson et al., 2010). Microarray and qRT-PCR experiments indicated that des mRNA in WN1106 was up-regulated by low pressure but not by low oxygen (Figs. 1 and 2). To determine whether increased fitness of strain WN1106 at low pressure may have resulted from adaptation to low-oxygen conditions during hypobaric growth, we performed competition experiments between the ancestral strain WN628 and low-pressure-evolved strain WN1106 under standard, low-pressure, or low-aeration conditions at 27°C (Fig. 5). In confirmation of previous observations (Nicholson et al., 2010), strain WN1106 was not significantly more fit than strain WN628 under standard conditions (relative fitness of 1.015±0.095) but was significantly more fit under low-pressure conditions (relative fitness of 1.255±0.02). In sharp contrast, competition under low aeration resulted in a significantly decreased relative fitness of strain WN1106 compared to WN628 (0.88±0.1) (Fig. 5). Thus, the enhanced fitness gained by low-pressure-evolved strain WN1106 did not appear to involve an adaptive response to low-pressure-induced oxygen limitation.
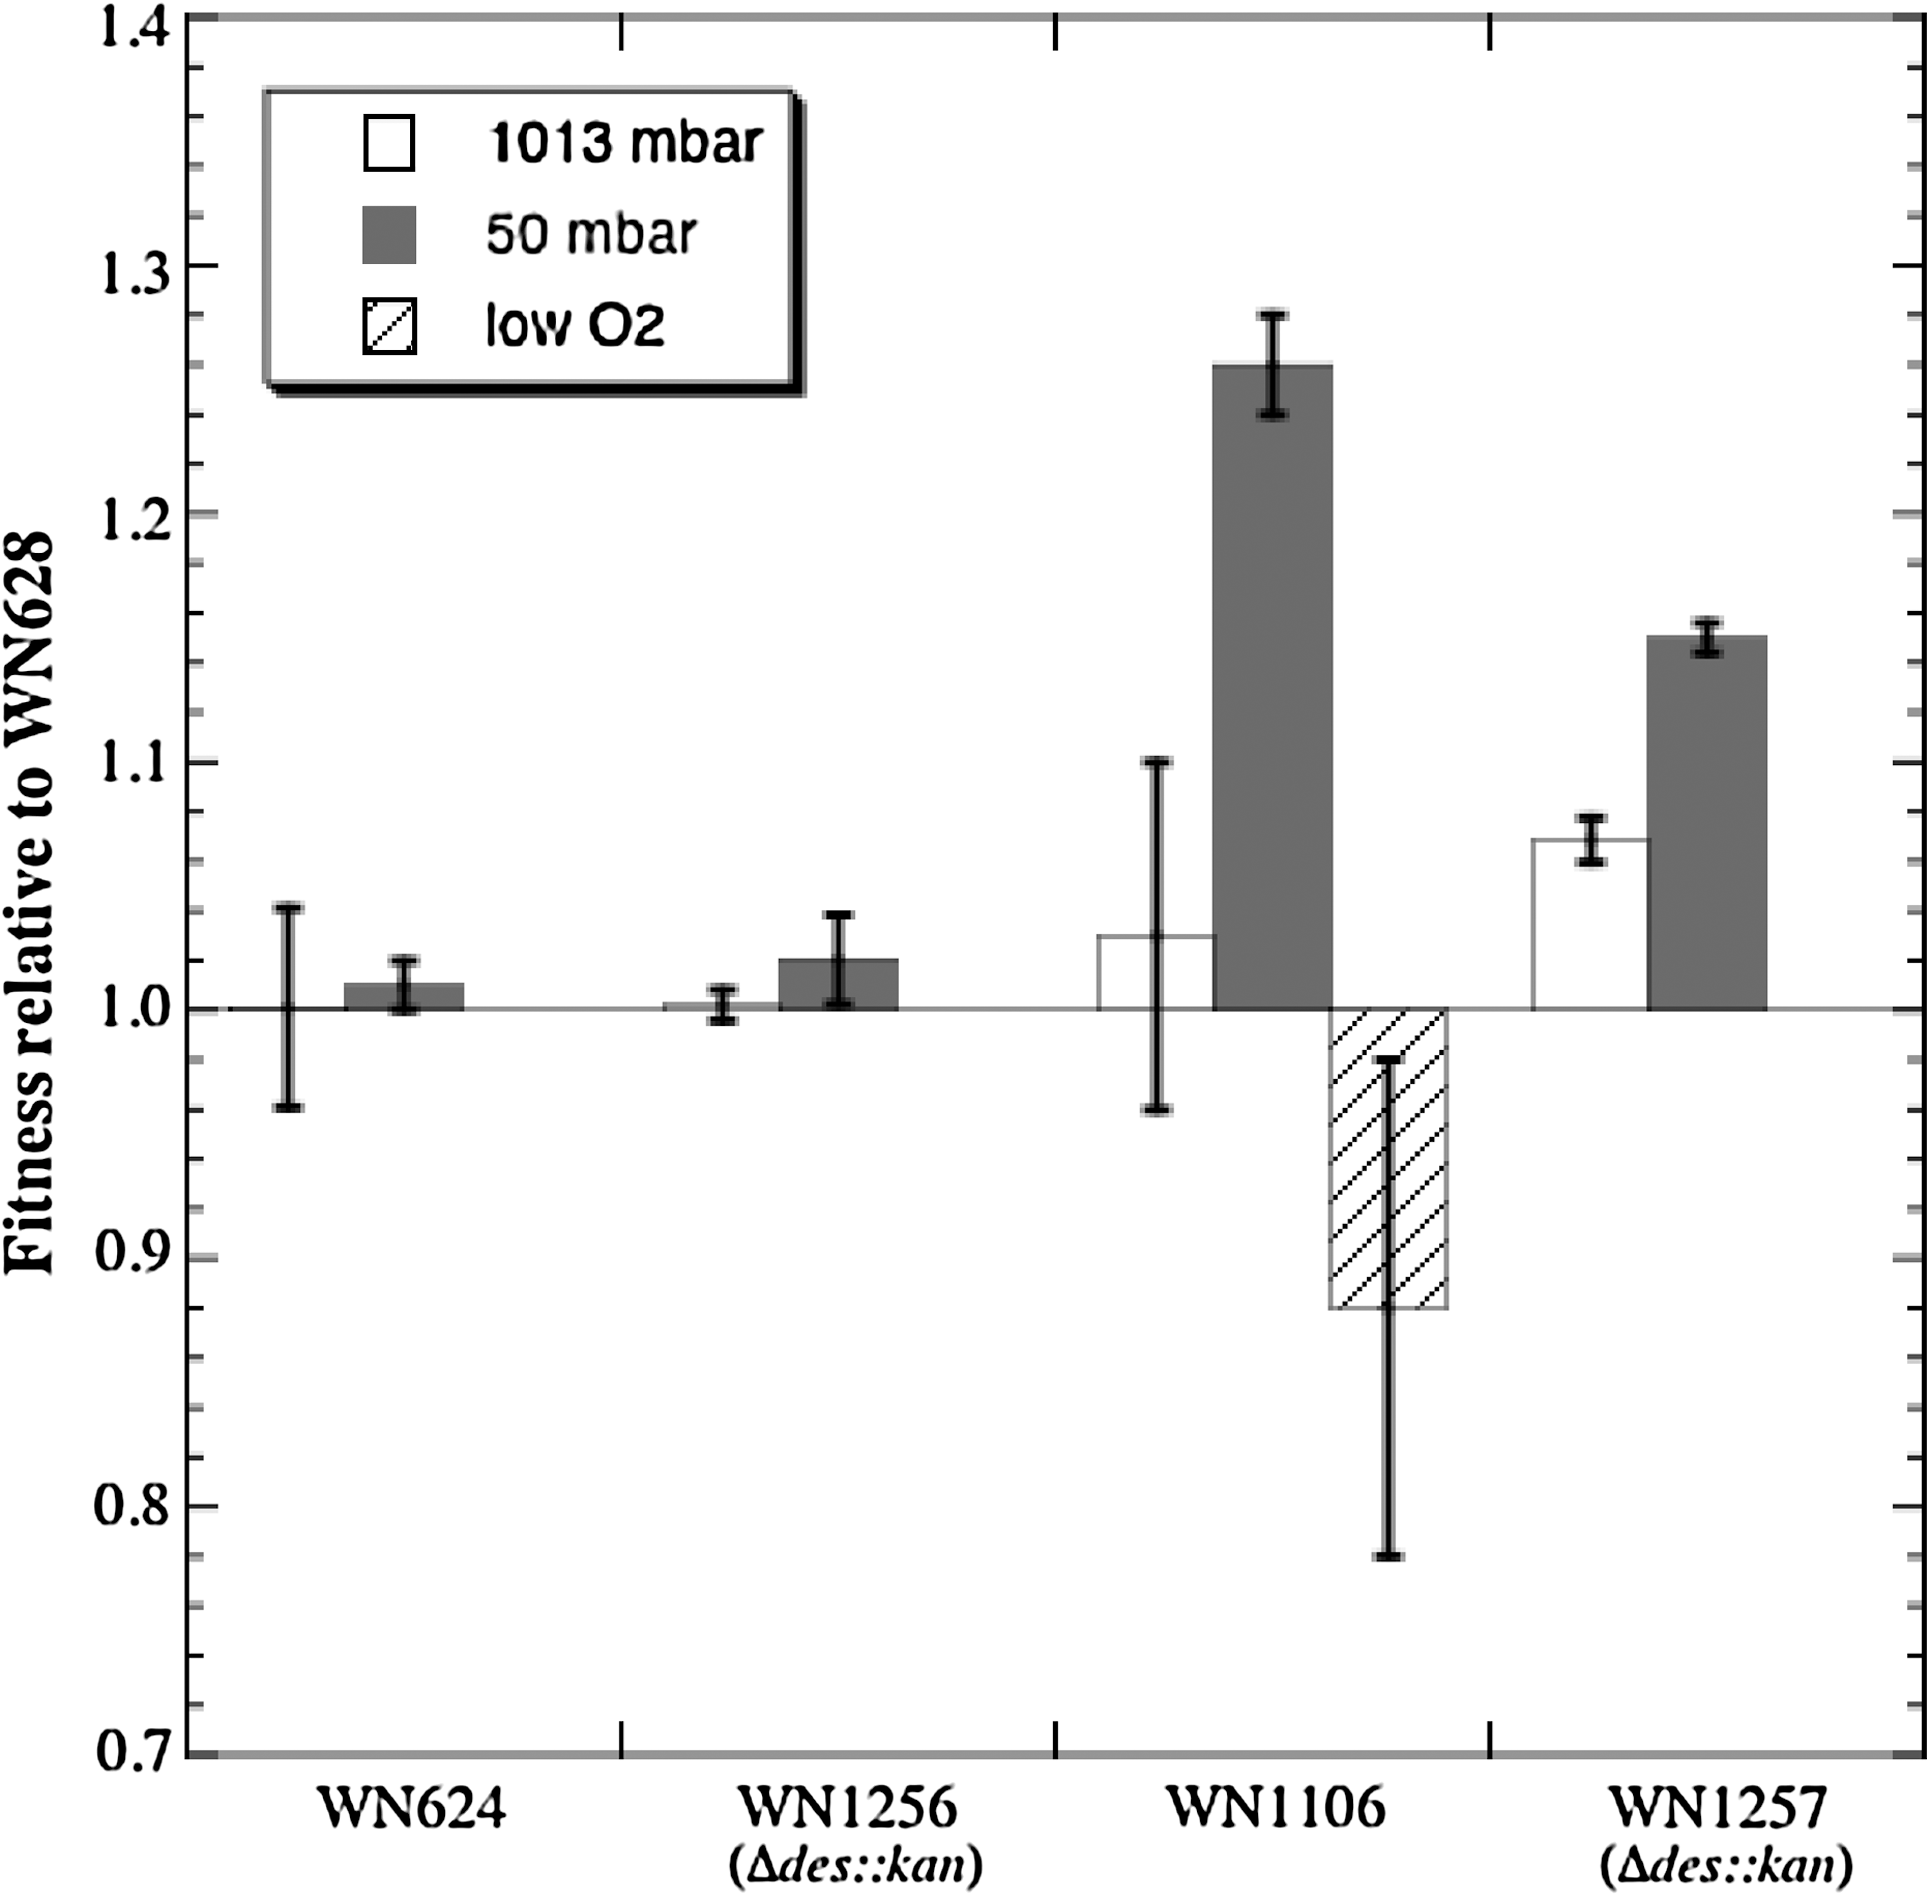
Determination of strain fitness relative to ancestral strain WN628 by competition experiments. Competitions of different strains vs. WN628 at standard (1013 mbar; open bars), low pressure (50 mbar; shaded bars), or low aeration (low O2; hatched bars). Strains used were WN624 (ancestor), WN1256 (WN624 carrying Δdes::kan), low-pressure-evolved strain WN1106, and WN1257 (WN1106 carrying Δdes::kan). See text for details. Data are averages±standard deviations (n=4).
3.6. Fitness of strains carrying des knockout mutations
Finding that the regulation of the des operon at 50 mbar was different in the low-pressure-evolved WN1106 strain than in the ancestral strain WN624 (Figs. 3 and 4) pointed to the possibility that the des gene might itself convey a fitness advantage at low pressure. To determine the specific biological importance of des in hypobaric growth, we moved a deletion mutation inactivating the des gene (Δdes::kan) from B. subtilis strain AKP4 into ancestral strain WN624 and low-pressure-evolved strain WN1106, creating strains WN1256 and WN1257, respectively (Table 1), then conducted competition experiments at either standard or low-pressure conditions. For purposes of comparison, all strains were competed against the reference ancestral strain WN628. First, as a control, ancestral strain WN628 was competed against its congenic strain WN624; as expected, strain WN624 showed no relative fitness advantage over strain WN628 at either standard (1.005±0.04) or low-pressure (1.01±0.01) conditions (Fig. 5). Next, competition was performed between strain WN628 and strain WN1256 (i.e., WN624 Δdes::kan). Again, the results indicated that knockout of the des gene did not significantly alter the relative fitness of ancestral strain WN1256 at either standard or low-pressure conditions (Fig. 5). As has already been well established (Nicholson et al., 2010; Fig. 5), strain WN1106 outcompeted strain WN628 at low pressure (1.255±0.02) but not under standard conditions (1.05±0.06) (Fig. 5). The next competition experiment was to determine whether inactivation of des altered the fitness advantage of strain WN1106 at low pressure. Therefore, strain WN628 was competed against strain WN1257 (i.e., WN1106 Δdes::kan). Inactivation of des in strain WN1257 lowered its competitive advantage over WN628 at low pressure from 1.255±0.02 to 1.15±0.01 (Fig. 5); this difference in fitness was highly significant by ANOVA (P<0.0001). However, inactivation of des in strain WN1257 did not completely abolish the fitness advantage of strain WN1106 at low pressure (Fig. 5).
3.7. Membrane FA analysis of B. subtilis 168 grown at lowered pressures
It has been observed that high pressure results in more ordered packing of membrane FAs, hence a decrease in membrane fluidity (Braganza and Worcester, 1986); thus, microbial adaptation to high pressure involves replacement of saturated membrane FAs with monounsaturated species (Bartlett et al., (2008). Conversely, low pressure results in the opposite effect (i.e., increasing disordered FA packing, hence membrane fluidity); thus, microbes would be expected to respond to low pressure by altering membrane FA composition to reduce the fluidity of their membranes. Because we were interested in how membrane FA composition responds to growth at low pressure, we grew the reference lab strain B. subtilis 168 in liquid LB medium at 27°C at several pressures—1013, 200, 100, 75, 50, and 25 mbar—and then quantified its membrane FA composition at each pressure. Several interesting trends were noted (Fig. 6). First, the percentage of unsaturated FAs, the product of Des activity, decreased as pressure decreased, from 2.4% of total at 1013 mbar to an undetectable level at 50 mbar (Fig. 6), presumably due to the oxygen dependence of Des enzymatic activity (Altabe et al., 2003). Concomitantly, saturated straight-chain FAs increased as pressure decreased, from 1.6% of total at 1013 mbar to 4.3% of total at 50 mbar, and a dramatic 15.7% of total FAs at 25 mbar (Fig. 6). However, the majority of membrane FAs in B. subtilis consisted of iso- and anteiso-branched-chain species (Fig. 6). As pressure decreased from 1013 to 50 mbar, the anteiso-branched-chain FAs increased from 48% to 56% of total FAs, and iso-branched-chain species decreased from 48% to 39% of total (Fig. 6). Thus, B. subtilis 168 mounted two apparently conflicting responses to low pressure regarding membrane FA composition and membrane fluidity.
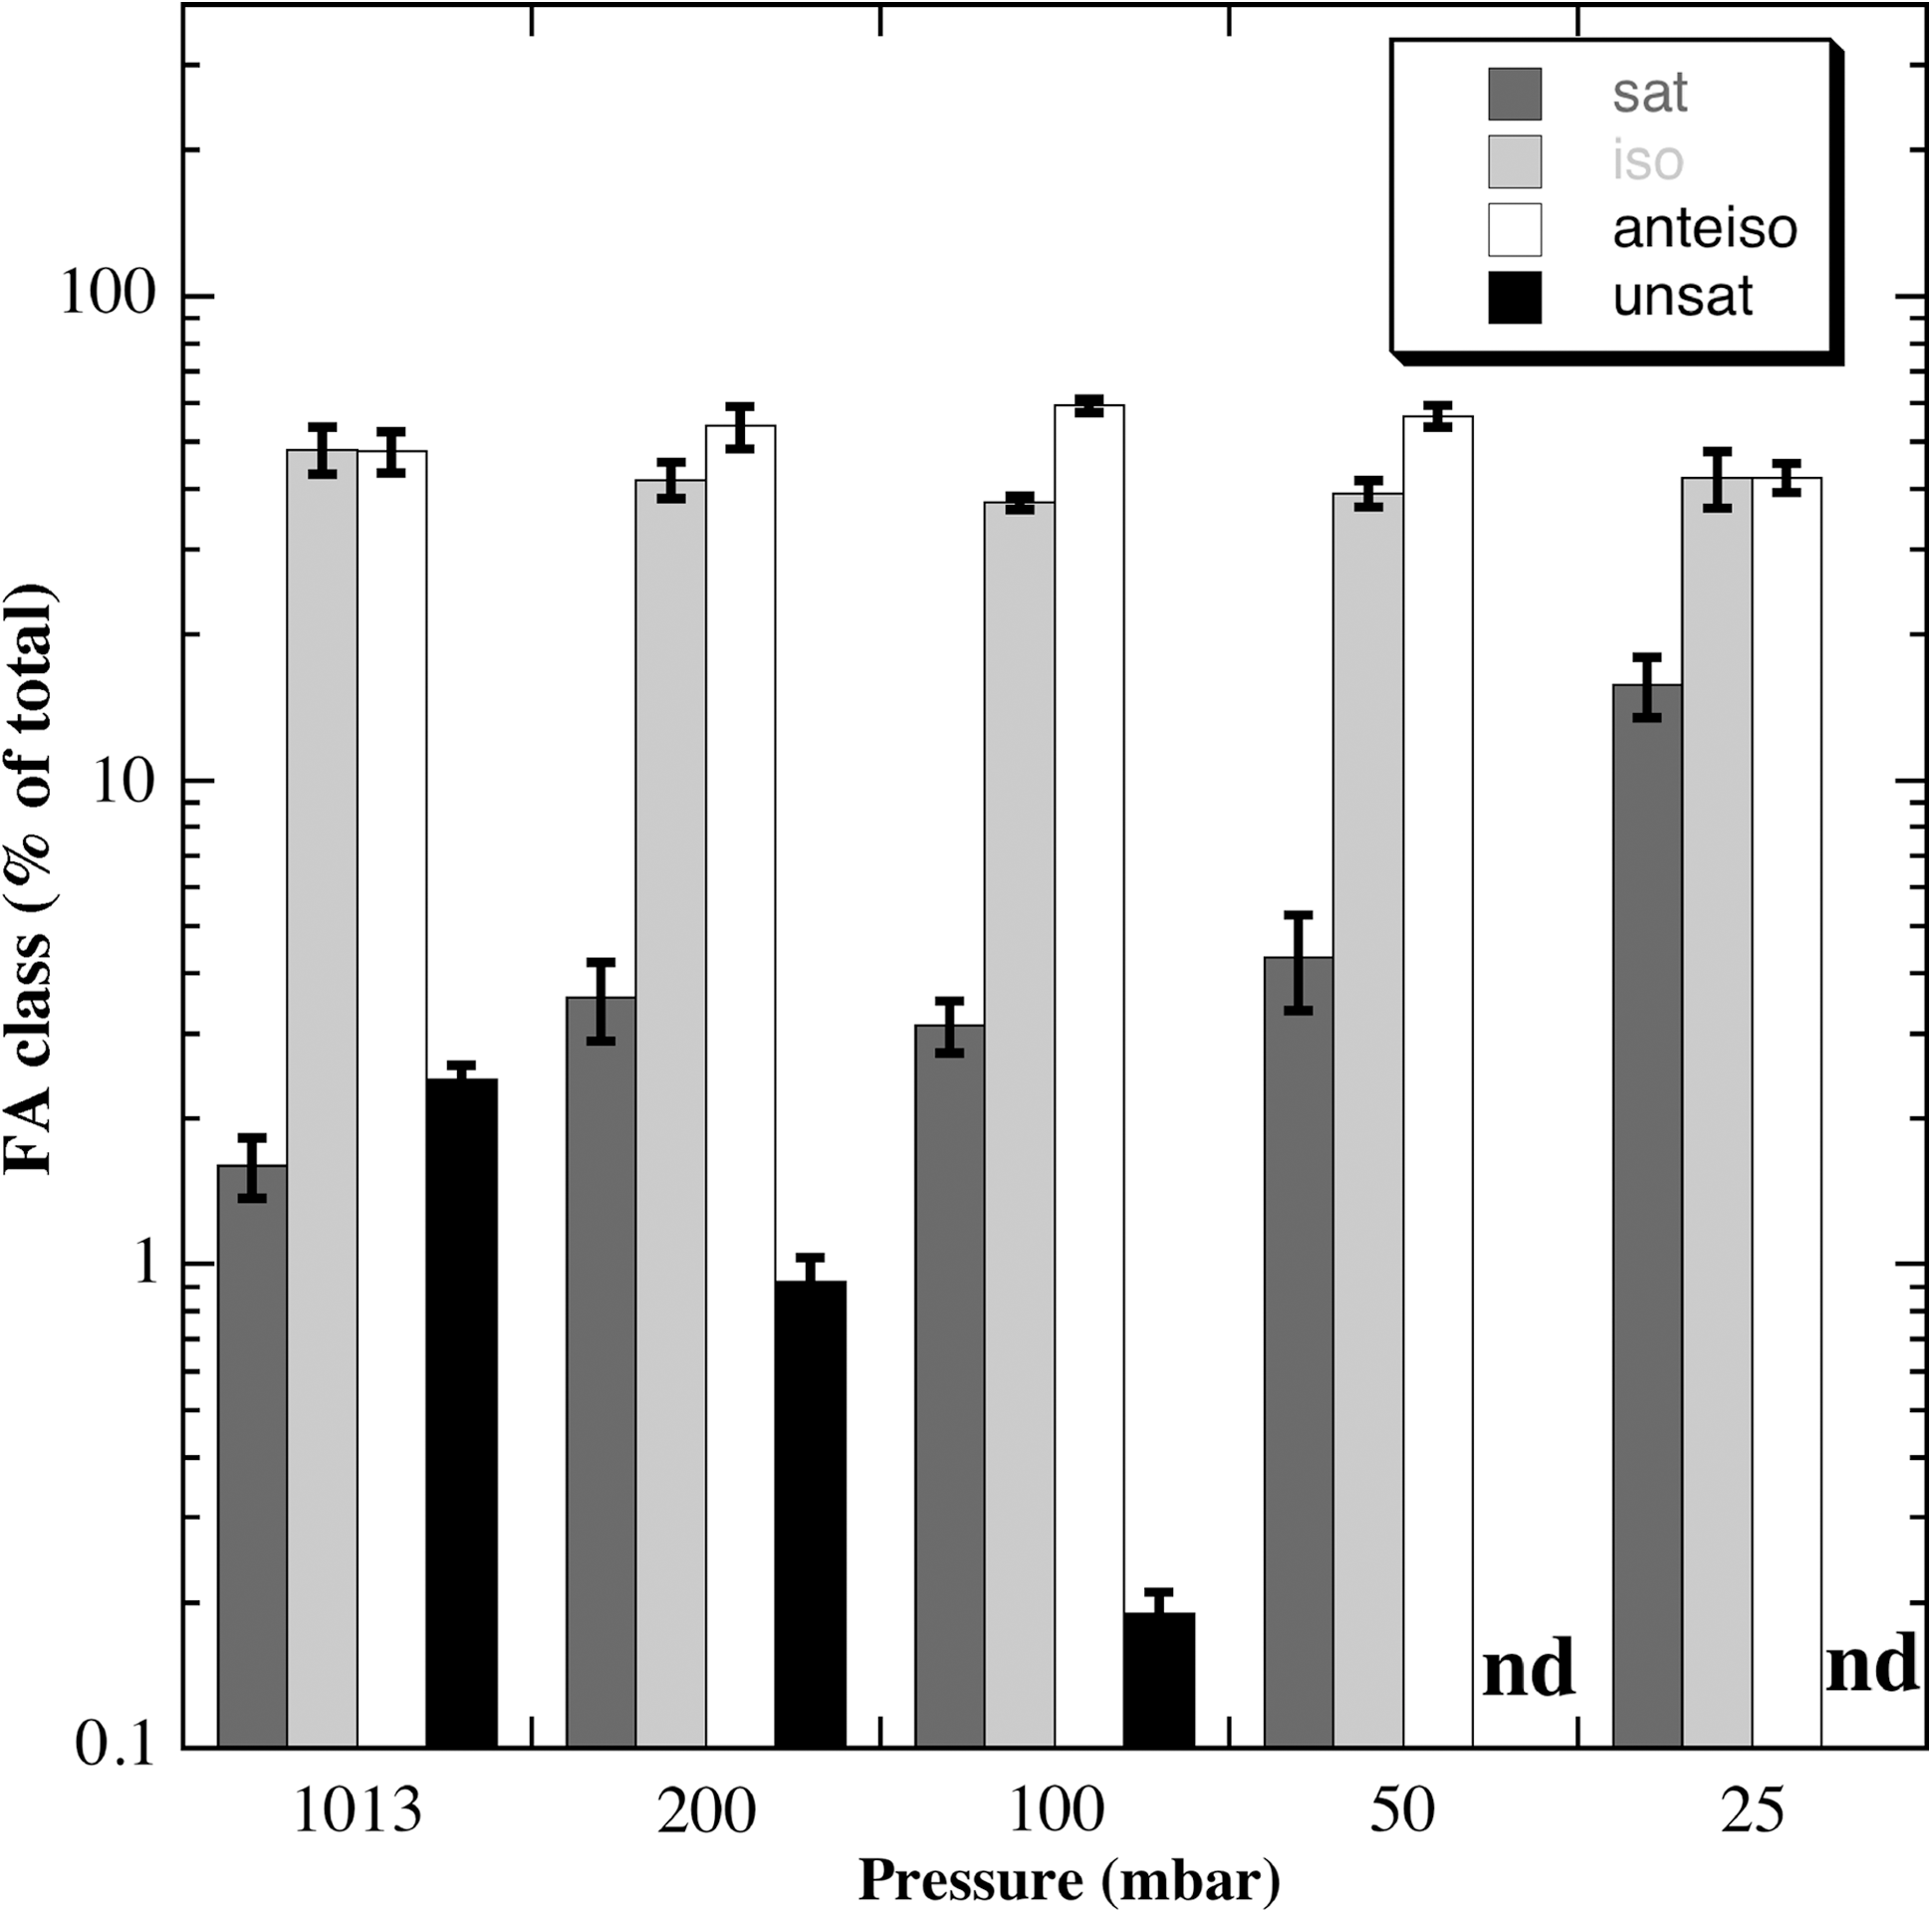
Membrane FA levels of B. subtilis strain 168 grown in LB medium at different pressures, shown as percent of total. Shown are the four major classes of FAs: straight-chain saturated (sat; dark gray bars); iso-branched-chain (iso; light gray bars); anteiso-branched-chain (anteiso; white bars); and unsaturated (unsat; black bars). Data are averages±standard deviations (n=3). nd, not detected.
3.8. Membrane FA composition of WN624 and WN1106
The observation that the des-desKR genes were differently regulated in strains WN624 and WN1106 under low pressure (Figs. 1 –4) prompted us to determine their membrane FA profiles when grown at 1013 or 50 mbar. In addition, as a control the membrane FA profile of strain WN1256 (Δdes::kan) was also obtained. Figure 7A represents the percentages of the major membrane FA species encountered in the three strains of B. subtilis analyzed.
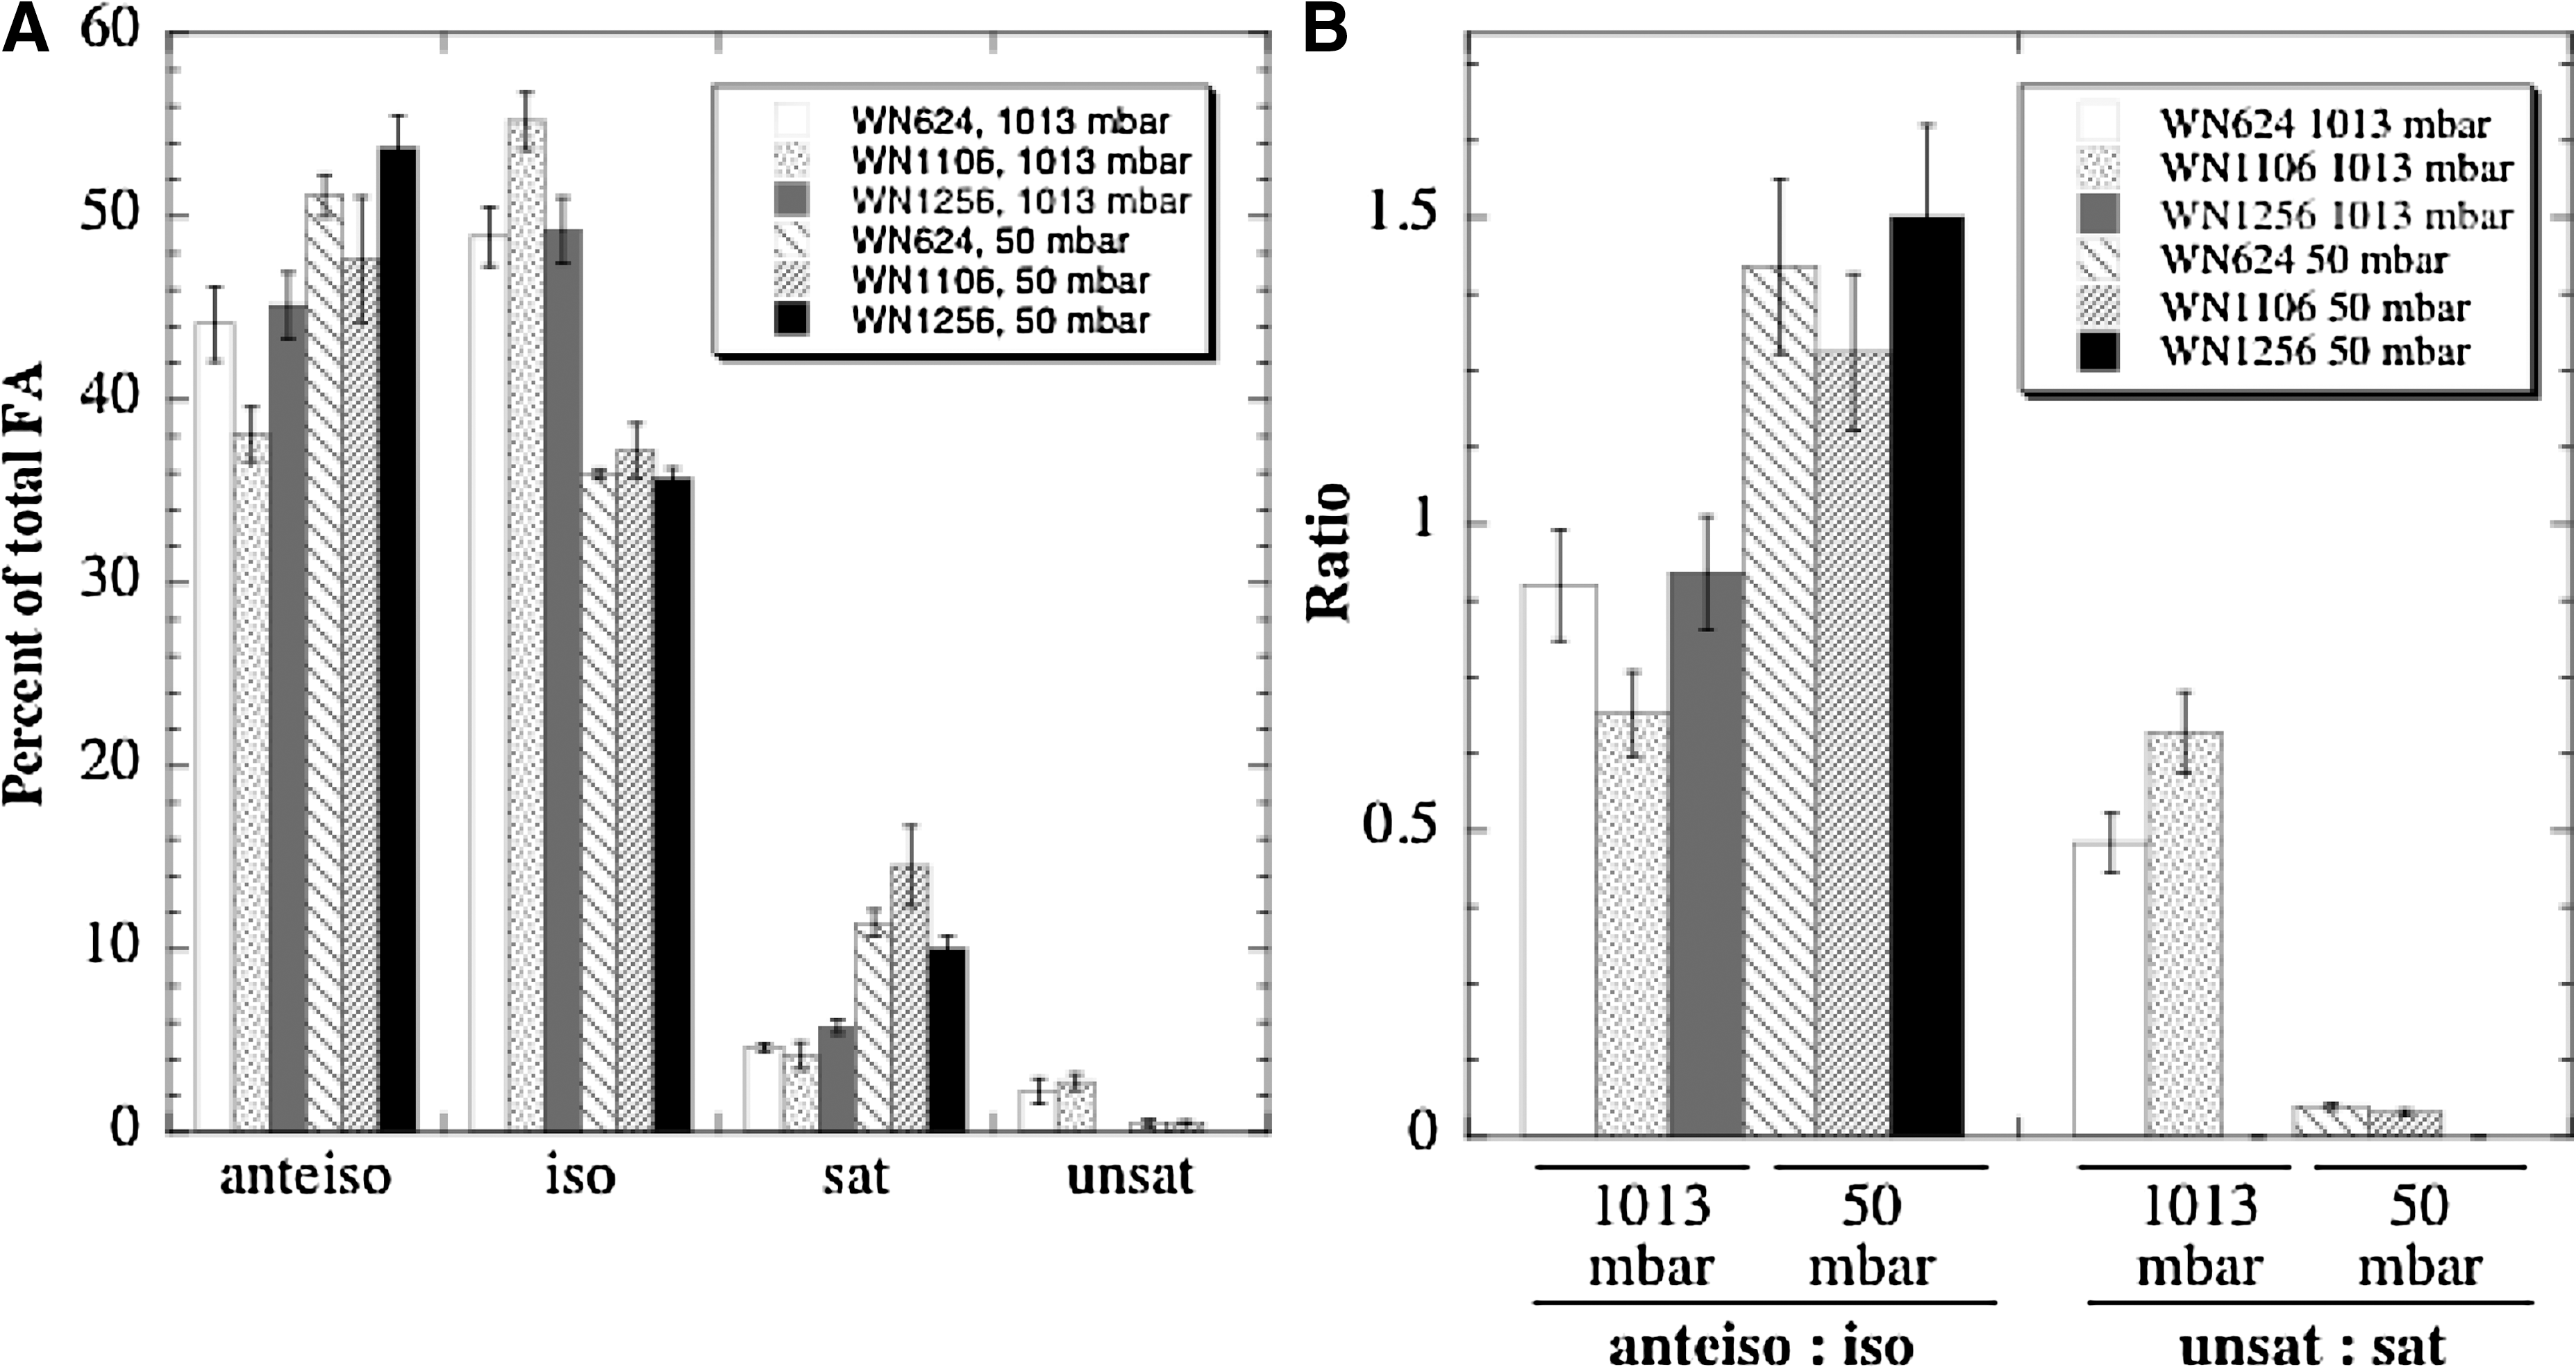
Membrane FA analyses of strains WN624 (ancestor), WN1106 (low-pressure-evolved), and WN1256 (WN624 Δdes::kan) grown at 1013 or 50 mbar. (
When unsaturated and saturated FAs were analyzed, the percentage of unsaturated FAs in both strains WN624 and WN1106 decreased at 50 mbar, with a concomitant increase in the percentage of saturated FAs (Fig. 7A). This observation is consistent with the results obtained with strain 168 (Fig. 6) and with decreased Des activity in a low-oxygen tension environment (Beranová et al., 2010). Strain WN1106 demonstrated a slightly higher ratio of unsaturated:saturated FAs at 1013 mbar than did WN624, but there was no significant difference in the unsaturated:saturated FA ratio between strains WN624 and WN1106 at 50 mbar (Fig. 7B). Predictably, no unsaturated FAs were detected in control strain WN1256 (Δdes::kan), either at 1013 or 50 mbar, consistent with this strain carrying a des knockout mutation.
When branched-chain FAs were analyzed in cells grown at 1013 mbar, it was observed that strain WN1106 contained a significantly higher percentage of iso-FA species and a significantly lower percentage of anteiso-FA species than did strains WN624 and WN1256 (Fig. 7A). In cells grown at 50 mbar, all three strains produced significantly more anteiso-FAs and significantly less iso-FAs (Fig. 7A); however, the differences between the strains were not significant. As seen in Fig. 7B, the ratio of anteiso-FA:iso-FA was significantly higher in all strains at 50 mbar than at 1013 mbar, and no significant differences were found in such ratios when strains WN624, WN1106, and WN1256 grew at 50 mbar (Fig. 7B). The data indicate that in low-pressure-evolved strain WN1106 gross changes in membrane FA composition did not occur at 50 mbar and therefore were not responsible for the better fitness of WN1106 for hypobaric growth. However, a significant difference in the anteiso-FA:iso-FA ratio was observed between strains WN624 and WN1106 grown at 1013 mbar (Fig. 7B); the ratio was lower in the evolved strain WN1106, which suggests a more rigid membrane. In addition, changes in the levels of minor FA species were also noted, even though these FAs were detected at levels below 1% of total. First, 17:0 and 17:0 iso3OH FAs were identified only in strain WN1106 growing at 1013 mbar. Second, the relative abundance of stearic acid (18:0) increased when all three strains WN624, WN1106, and WN1257 were grown at 50 mbar (data not shown).
4. Discussion
Mars presents a wide range of challenging conditions even for terrestrial extremophiles (reviewed in Schuerger, 2004). Biological responses to some of these parameters (e.g., desiccation, low temperature, high doses of UV and ionizing radiation) have been studied extensively, and the strategies utilized by some organisms capable of growing under such conditions are quite well understood at the molecular level (Nicholson et al., 2000, 2005; Rothschild and Mancinelli, 2001). In contrast, studies spanning more than half a century on the effects of low pressure on microorganisms have concentrated almost exclusively on survival after exposure (Brueschke et al., 1961; Gillmore and Gordon, 1975; Horneck, 1981) and not on growth under such conditions. More recently, the effects of low pressure on growth (Kanervo et al., 2005; Schuerger and Nicholson, 2006; Berry et al., 2010) or on metabolic activity (Kral et al., 2010) of microorganisms have been reported. For every microorganism tested thus far, growth rates decreased significantly at lower pressures, and a low-pressure threshold of 25 mbar has been suggested (Schuerger and Nicholson, 2006). However, the particular mechanism or mechanisms underlying the limited ability of microorganism to grow at low pressure have not to date been elucidated. We approached this problem by isolating a strain of B. subtilis, strain WN1106, that had evolved over 1000 generations a phenotype of enhanced growth at 50 mbar (Nicholson et al., 2010). In this study, we explored the molecular basis for its phenotype.
4.1. Microarray experiments
To investigate the genetic responses that allow strain WN1106 to grow under hypobaric conditions, a transcriptional microarray analysis was conducted to identify genes differentially expressed in WN1106 versus WN624 grown at 50 mbar. It was found that both the des gene and the downstream desKR operon were expressed at ∼5–8 fold higher level in WN1106 than in WN624 at 50 mbar, and this result was confirmed by qRT-PCR (Figs. 1 and 2). Although the factor by which the mRNA levels of des, desK, and desR were higher in WN1106 than in WN624 at 50 mbar was different when measured by the two techniques, what is important is the directionality (upward) of the change in strain WN1106. Experimental evidence and a review of the literature indicate that the expression of genes exhibiting up-regulation correlates well in microarray and qRT-PCR data, and low correlations are observed when the changes detected are lower than 2-fold (Morey et al., 2006). In light of this, the higher mRNA levels of the des, desK, and desR genes in low-pressure-evolved strain WN1106 grown at 50 mbar determined by microarrays can be considered validated by qRT-PCR.
Initially, the above results seemed to indicate that the increased fitness of WN1106 at low pressure was mediated at least in part through an adaptive response to alteration in membrane fluidity provoked by low pressure. The desKR operon encodes DesK, a histidine kinase known to be activated by changes in membrane thickness resulting from a drop in temperature, and DesR, its cognate response regulator, which in its phosphorylated form is a positive activator of the des gene, which codes for the acyl lipid desaturase in B. subtilis (Cybulski et al., 2010). Thus, it was not surprising to find genes that respond to temperature to seemingly be implicated in low-pressure adaptation, because both temperature and pressure have a direct influence in membrane fluidity (MacDonald, 1984; Scaion et al., 2008).
4.2. Regulation of des mRNA levels versus a des-lacZ fusion
It was of obvious interest to determine whether des transcription would respond to a pressure downshift in a manner similar to its response to a temperature downshift (Aguilar et al., 2001). We reasoned that introduction of a des-lacZ transcriptional fusion into strains WN624 and WN1106 (resulting in strains WN1216 and WN1217, respectively) would provide a convenient way to monitor des expression at different pressures. However, expression of the des-lacZ fusion was not up-regulated by a shift to low pressure in either strain WN1216 or WN1217 (Fig. 4), although the fusion was up-regulated normally in both strains in response to a temperature downshift (Fig. 3), as noted previously (Aguilar et al., 2001). Given that assay of des-lacZ fusion expression was not an option to measure des expression following a pressure shift, qRT-PCR assays were also performed to this end. Des mRNA levels were measured by qRT-PCR in strains WN1216 and WN1217, at 0 and 90 min after they were subjected to a pressure downshift from 1013 to 50 mbar (Fig. 4). An ∼19-fold induction of des mRNA occurred in the low-pressure-evolved strain derivative WN1217 but not in the ancestral strain derivative WN1216 (Fig. 4). It is interesting to note, however, that the increased level of des mRNA in strain WN1217, 90 min after pressure downshift, was also observed after overnight growth of strain WN1106 at low pressure (data not shown), which suggests that, once induced by a pressure downshift, des mRNA levels remain high for many hours. This aspect of des regulation is distinctly different from the case of temperature, where des expression is only transiently induced after a temperature downshift (Aguilar et al., 1998).
Why is des mRNA elevated in strain WN1106 in response to pressure downshift but expression of a des-lacZ fusion is not? At present the answer is unknown, but two possible explanations present themselves. First, the placement of the des-lacZ fusion at the ectopic amyE locus could cause a different response of the fusion to low pressure as opposed to low temperature. In support of this notion, anomalous regulation of the expression of several B. subtilis gene fusions placed at the amyE locus has previously been reported, for example: sigG, sspA, sspB, sspE, gerA, and gpr (Mason et al., 1988; Sun et al., 1991a, 1991b). A second possible explanation for the discrepancy is that low pressure affects the half-life of the des-lacZ mRNA differently than it does the half-life of des mRNA in strain WN1106 grown at low pressure. In this scenario, WN1106 may have sustained a mutation in its mRNA degradation apparatus that manifests itself at low pressure. The regulation of gene expression through mRNA stability in B. subtilis has been reported, and it was reviewed in detail recently (Condon and Bechhofer, 2011).
4.3. Contribution of des to competitive fitness of strain WN1106
After showing that the des gene exhibits a different regulation at low pressure than at standard pressure in strain WN1106, it was important to determine whether des confers a fitness advantage to growth of WN1106 at 50 mbar. To accomplish this, we competed ancestral strain WN628 against its congenic ancestral strain WN624 and low-pressure-evolved strain WN1106, as well as their counterparts containing knockout mutations inactivating their des genes, strains WN1256 and WN1257, respectively (Fig. 5). The results of the competition experiments showed that the des knockout did not significantly alter the competitive fitness of strain WN1106 under standard conditions but significantly lowered its competitive fitness at 50 mbar (Fig. 5). These experiments clearly indicated that the des gene contributed to better fitness of WN1106 at low pressure but that (currently unknown) genes other than des are also necessary for strain WN1106's increased fitness at 50 mbar.
4.4. Hypobaria versus hypoxia
The contribution of des to the increased fitness of strain WN1106 at 50 mbar cannot be explained as an advantage to growth at the low-O2 tension environment resulting from hypobaria, because competition experiments performed at 1013 mbar with low aeration revealed that strain WN1106 was actually less fit than ancestral strain WN628 under hypoxic conditions (Fig. 5). This finding supports other reports in the literature showing that hypobaric effects on organisms are not due solely to low pressure-induced hypoxia. For example: (i) The growth of five different phytopathogenic fungi was inhibited to a greater extent at low pressure than it was in an environment of similar oxygen tension and humidity but at atmospheric pressure (Apelbaum and Barkai-Golan, 1977). (ii) The sporulation of some fungi was shown to be inhibited more by low pressure of 102 mm Hg (135 mbar) than by a treatment of low (2.7%) oxygen at atmospheric pressure (Wu and Salunkhe, 1972). (iii) Differential gene expression patterns have been shown in Arabidopsis thaliana plants grown under hypobaric versus hypoxic conditions (Paul et al., 2004). (iv) The concentration of some protective phytochemicals in Red Sails lettuce was observed to be increased under standard atmospheric pressure with lower oxygen tension conditions but decreased at low pressure if the oxygen tension was maintained at 21 kPa (Rajapakse et al., 2009), which indicates that, for certain variables, hypobaria and hypoxia can actually exert opposite effects.
4.5. FA analyses
Analyses of membrane FA composition were performed on ancestral strain WN624, low-pressure-evolved strain WN1106, and Δdes::kan strain WN1256 grown at 1013 or 50 mbar (Fig. 7A). These results showed that a higher rate of des transcription did not result in a higher level of FA desaturation. This observation may be due to the fact that des codes for an oxygen-dependent Δ5-desaturase (Altabe et al., 2003). In addition, a higher level of unsaturated membrane FAs would result in increased membrane fluidity. The equations of thermodynamics and experimental evidence show that increases in pressure and temperature act oppositely on membrane fluidity (Scaion et al., 2008); thus, the effect of hypobaria on the molecular structure of membranes is a looser packing of the FA chains of phospholipids. A response to low pressure by a microorganism increasing its membrane fluidity would in theory be detrimental for growth at low pressure.
An unexpected finding was that the ratio of anteiso-FAs:iso-FAs was not significantly different between strains WN624 and WN1106 grown at 50 mbar (Fig. 7B). A lower anteiso-FA:iso-FA ratio would have indicated a less fluid membrane, a competitive advantage at low pressure. However, it was noted that at 1013 mbar, strain WN1106 exhibited a significantly lower anteiso-FA:iso-FA ratio (0.69±0.07) than did WN624 (0.89±0.11) (Fig. 7B), which implies that WN1106 may have a more rigid membrane under standard conditions. This may explain why strain WN1106 could have an initial growth advantage when shifted from 1013 to 50 mbar, before a low-pressure response could be mounted. In support of this notion, it has been reported that preincubation of Lactobacillus sanfranciscensis cells at low temperature resulted in increased resistance to hyperbaric conditions (Scheryhing et al., 2004).
Regarding changes in membrane fluidity, some differences in minor FA species were also noted (Fig. 7A). For example, stearic acid (18:0) increased in abundance in all strains grown at 50 mbar. Because this is a saturated FA, it could indicate an adaptive response to a sudden increase in membrane fluidity and permeability; however, it is difficult to make this case in light of the bulk decrease in saturated FAs (Fig. 7A). Two FA species were found only in strain WN1106 (17:0 and 17:0 iso3OH), but at levels below 1% and only at 1013 mbar. Although both FA species would be predicted to decrease membrane fluidity, a possible advantage before a low-pressure challenge, their extremely low levels make it difficult to ascribe a major contribution of these minor FAs to the higher hypobaric fitness of WN1106.
It thus appears that B. subtilis strains are unable to respond to low pressure by adjusting their membrane lipid composition to maintain homeostasis. This is true even in the low-pressure-evolved strain WN1106. Based on these observations, we suggest that because microorganisms do not normally encounter low-pressure conditions on Earth, they have not evolved systems for sensing and responding appropriately to low pressure.
4.6. Regulation of des at low pressure
To start uncovering the molecular mechanisms that make growth at low pressure possible, our approach was to identify genes in low-pressure-evolved strain WN1106 differently expressed at low pressure compared to ancestral strain WN624. Of special interest were up-regulated genes that showed the biggest difference in expression levels at 50 mbar. Our first candidates were genes of the des-desKR system, which rendered surprises upon further study. First, no mutations were found in the des-desKR coding sequence of WN1106 or in upstream or downstream regulatory regions. Second, in strain WN1106, des mRNA levels increased at low pressure (Figs. 1, 2, and 4). This second observation runs contrary to what the temperature downshift model would predict. In response to a temperature downshift, the des promoter is activated by the phosphorylated form of DesR, a transcription regulator responsive to the membrane-embedded histidine kinase sensor DesK. DesK kinase activity is likely caused by an increase in membrane thickness induced by increased ordering of membrane FAs in response to lower temperature (Cybulski et al., 2010). In the case of low pressure, membranes become thinner due to a decrease in the order of membrane lipids (Braganza and Worcester, 1986). Thus, a thinner membrane should lead to down-regulation of des transcription through DesK and DesR, not up-regulation. Third, despite increased des mRNA levels in WN1106 at 50 mbar, no concomitant increase in unsaturated membrane FA levels was detected in WN1106 at low pressure (Fig. 7A), possibly due to the oxygen dependence of des-encoded desaturase activity (Beranová et al., 2010). Fourth, we found that des mRNA level did not increase transiently as a result of a pressure change, the way it does when responding to a temperature change. Fifth, unlike the intact des gene at its own locus, the expression of a des-lacZ fusion at the amyE locus did not increase under low pressure (Fig. 4). Thus, there are obvious differences between the response of des to temperature downshift versus pressure downshift.
The possibility exists that under low pressure the des gene in strain WN1106 responds to a different signal transduction system than DesK-DesR and that this putative system does not necessarily sense changes in membrane thickness or fluidity but is responsive to other changes in the physical or chemical environment triggered by hypobaria. It is notable that in response to pressure downshift neither des mRNA levels nor des-lacZ expression are induced in the ancestral strain WN624 (Figs. 1, 2, and 4), which indicates that in wild-type B. subtilis cells the des-desKR system is not responsive to low pressure. What are the adaptive changes that might be expected in low-pressure-evolved strain WN1106? For clues, it may be instructive to examine the effects of low pressure on biological systems in general. Hypobaria affects surface boundary layers and increases the rate of gas diffusion, convective transfer, and water evaporation (Goto et al., 1996; Rygalov et al., 2004; Richards et al., 2006). It is reasonable to suppose that low pressure, via disordering of the cell membrane, would lead to changes in membrane permeability, hence compensatory changes in the expression of genes involved in membrane processes such as nutrient and ion transport, protein translocation, proton pumping, or motility.
4.7. Implications for the search for life on Mars
It has been suggested that the past climate of Mars was more Earth-like, with an atmospheric pressure much higher than it is now (Debaille et al., 2007; Brain et al., 2010) and flowing liquid surface water (Malin and Edgett, 2003; Fassett et al., 2010). Because Earth and Mars may have exhibited similar environments in their past, it has been suggested that microbial life could have originated on either planet and subsequently been transferred to the other by impact processes (i.e., lithopanspermia) (reviewed in Nicholson, 2009). In this scenario, terrestrial and martian life would then be supposed to have evolved, over geological timescales, to adapt to the changing environmental conditions of their host planets (Nicholson, 2009), including progressively lowered atmospheric pressure on Mars. Our experiments thus have astrobiological relevance when considering the possibility of microorganisms evolving as their once-hospitable surroundings change. The results presented here suggest that terrestrial microorganisms such as B. subtilis can evolve to enhanced growth under low-pressure conditions approaching those of Mars (Nicholson et al., 2010). Because bacteria have previously been demonstrated to survive exposure to both space and the Mars surface environment (reviewed in Nicholson et al., 2000; Fajardo-Cavazos et al., 2007; Nicholson, 2009), the findings reported here strengthen the case for the possibility of finding microbial life on other planets such as Mars.
4.8. Implications for planetary protection
The ability of Earth microbes to grow in Mars environments is a subject of interest to the field of planetary protection, which seeks to prevent planetary cross contamination (reviewed in Nicholson et al., 2009). Successful transfer of microbial life from Earth to Mars via spacecraft (so-called “forward contamination”) is dependent on the capacity of microbes not only to survive but subsequently to grow and evolve in the harsh martian environment. The surface of Mars is cold, dry, and oxidizing, and in its rarefied CO2-dominated atmosphere, microorganisms would be exposed to intense UV radiation and hypobaria. Out of all the conditions found on Mars, only hypobaria is not found in Earth ecosystems; thus, the study of directed evolution to hypobaric growth in strains such as WN1106 could provide insights into adaptive strategies used by microbes for proliferation in low-pressure environments.
Footnotes
Acknowledgments
The authors wish to thank Janá Bernová, Ivo Konopásek, Cecilia Mansilla, and Diego de Mendoza for generous donation of strains, and Vadim Rygalov for insightful discussions. This work was supported by a grant from the NASA Astrobiology: Exobiology and Evolutionary Biology program (NNX08AO15G) to W.L.N., A.C.S., and P.F.-C.
Abbreviations
Cm, chloramphenicol; FA, fatty acid; FAMEs, fatty acid methyl esters; GC, gas chromatography; LB, Luria-Bertani; OD, optical density; PBS, phosphate-buffered saline; qRT-PCR, quantitative reverse transcription–polymerase chain reaction; Spc, spectinomycin.