
Abstract
The enthalpies of formation of synthetic MgSO4·4H2O (starkeyite) and MgSO4·3H2O were obtained by solution calorimetry at T=298.15 K. The resulting enthalpies of formation from the elements are
Additionally, differential scanning calorimetry (DSC) measurements with a Perkin Elmer Diamond DSC in the temperature range 270 K<T<300 K were performed to check the reproducibility of the PPMS measurements around ambient temperature.
The experimental Cp data of starkeyite between 229 and 303 K were fitted with a Maier-Kelley polynomial, yielding Cp (T)=107.925+0.5532·T−1048894·T −2.
The hydration state of all Mg sulfate hydrates changes in response to local temperature and humidity conditions. Based on recently reported equilibrium relative humidities and the new standard properties described above, the internally consistent thermodynamic database for the MgSO4·nH2O system was refined by a mathematical programming (MAP) analysis.
As can be seen from the resulting phase diagrams, starkeyite is metastable in the entire T-%RH range. Due to kinetic limitations of kieserite formation, metastable occurrence of starkeyite might be possible under martian conditions. Key Words: Mg sulfates—Starkeyite—Thermodynamic data—Entropy—Enthalpy—Calorimetry. Astrobiology 12, 1042–1054.
1. Introduction
A
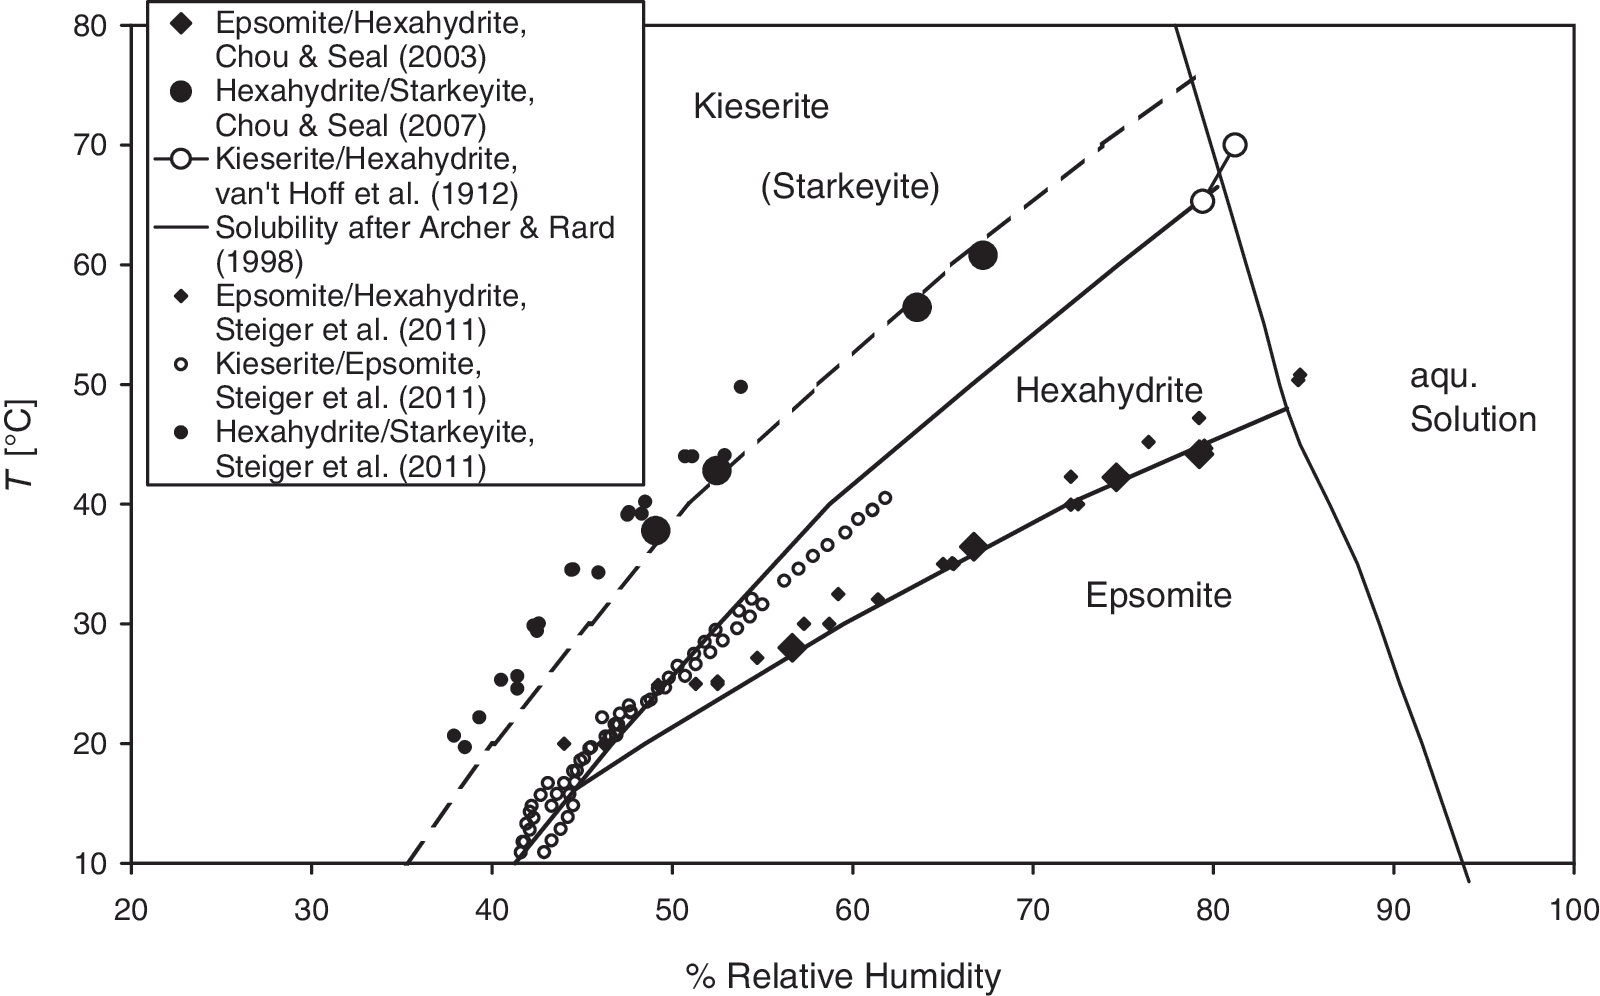
Calculated stability of Mg-sulfate hydrates as a function of temperature and relative humidity (Grevel and Majzlan, 2009). The size of the large symbols representing the experimentally obtained reversals for the reactions epsomite=hexahydrite + H2O (Chou and Seal, 2003), hexahydrite=starkeyite + 2H2O (Chou and Seal, 2007), and hexahydrite=kieserite + 5H2O (van't Hoff et al., 1912) indicates the experimental uncertainty. Starkeyite is metastable. The solubility curve was calculated after Archer and Rard (1998) based on solubility data of Linke (1965). Small symbols represent new measurements of equilibrium relative humidities for several hydration–dehydration equilibria in the MgSO4–H2O system (Steiger et al., 2011). Only data points which were used by Steiger et al. (2011) to derive their final phase diagram are shown.
In case the structure is known, this reference is given.
Steiger et al. (2011) reported new measurements of equilibrium relative humidities for several stable and metastable hydration–dehydration equilibria in the MgSO4–H2O system (see Fig. 1). These measurements served as additional constraints for our MAP procedure to obtain a revised internally consistent thermodynamic data set for magnesium sulfate hydrates.
2. Materials
2.1. Starkeyite
Starkeyite was produced at the Department of Chemistry (University of Hamburg, Germany) by dehydration of MgSO4·6H2O, (Fluka 00627 p.a.) in a drying cabinet (4 days) at about 320 K (Steiger et al., 2011). After verification by X-ray powder diffraction (XRD), the powdered material was kept in a closed vial in the drying cabinet before it was sent to Bochum by regular mail. XRD patterns were obtained on a Stadi P powder diffractometer (STOE, Germany) with transmission configuration for which Cu-Kα radiation was used. The XRD patterns were compared to JCPDS standard 24-720. Additionally, powder XRD measurements acquired with a Siemens D 500 diffractometer with 0.02° step scans every 2 s between 3° and 65° 2θ were collected before and after the Cp measurements in Salzburg.
2.2. The trihydrate
Crystals of MgSO4·3H2O were prepared by gentle evaporation of a 25 wt % MgSO4 solution at 105°C for ∼48–72 h without stirring (Fortes and Lemée-Cailleau, 2010). The crystals grown in this manner are clusters of euhedral colorless plates, 1–2 mm in length and 0.1–0.5 mm in thickness (Fig. 2). After extraction from the solution, the crystals of MgSO4·3H2O became somewhat dull. However, batches of crystals, far from being unstable as reported by Hodenberg and Kühn (1967), were preserved in a small glass bottle for a period of ∼10 days and withstood repeated exposure to warm air (∼30°C) and examination under a microscope. Thus, some crystal fragments could be transported to Jena by mail for use in the calorimetry experiments. Once powdered under air, this phase hydrates extremely rapidly, so measurements requiring powder samples were not carried out on this material.
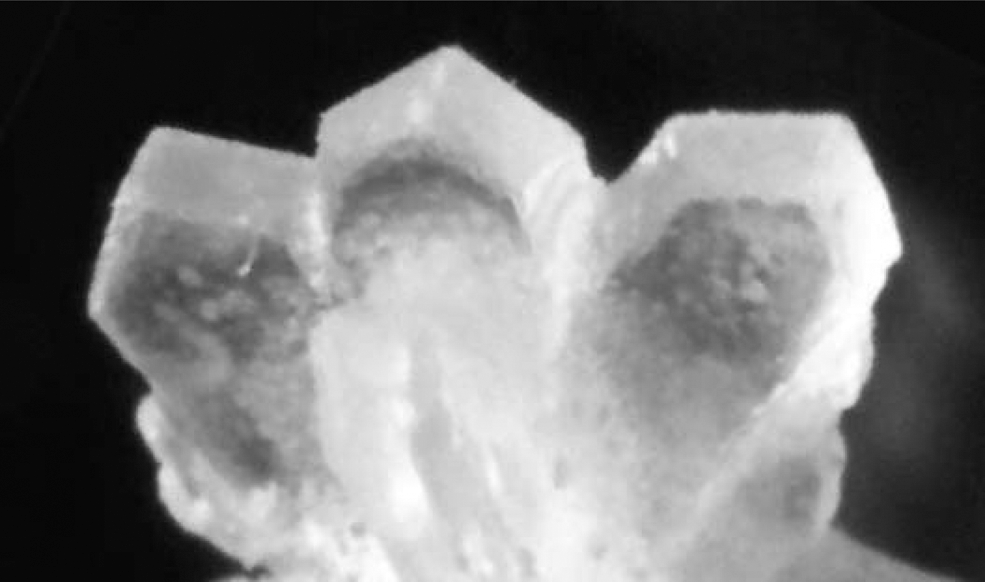
Synthetic MgSO4·3H2O typically forms small clusters of blades (each shown here is ∼1 mm across the 010 face).
The crystal structure of the deuterated analogue MgSO4·3D2O was previously determined from neutron single-crystal diffraction measurements at the Institut Laue-Langevin, Grenoble, France (Fortes and Lemée-Cailleau, 2010), and the thermal expansion behavior was measured by high-resolution neutron powder diffraction at the ISIS neutron spallation source (Fortes et al., 2010). The room-temperature unit-cell dimensions, a=8.1925(2) Å, b=10.9210(2) Å, c=12.3866(4) Å and space-group Pbca, agree with the values previously published by Hodenberg and Kühn (1967) for the protonated form (MgSO4·3H2O) that was used in this work.
3. Calorimetric Methods
3.1. Solution calorimetry
For solution calorimetry, we used the commercial IMC-4400 isothermal microcalorimeter (Calorimetry Sciences Corporation) described by Ackermann et al. (2009) located at the Institute of Geosciences (Friedrich-Schiller University, Jena). The calorimetric solvent (25 mL of deionized water) contained in a closed polyether ether ketone cup with a total volume of 60 mL was inserted into the liquid bath of the calorimeter, which was kept at a constant temperature of 25°C (±0.0005°C). During the stabilization (∼8 h) and the experiment (80–100 minutes), the solvent was stirred with a SiO2 glass stirrer driven by a motor positioned about 40 cm from the active zone of the instrument. The fine-grained starkeyite sample was pressed into pellets of about 20 mg and weighed on a microbalance with a precision of 0.002 mg (as stated by the manufacturer). In contrast, crystal fragments of the coarse-grained trihydrate sample were weighed out and used for calorimetry experiments without grinding. Directly after the weighing, the samples were dropped through a SiO2 glass tube into the solvent, and the heat produced or consumed during the dissolution was measured. The solution was always freshly prepared, and the final molalities of Mg2+ and
The heat flow between the reaction cup and the constant temperature reservoir was then integrated to calculate the caloric effect. The calorimeter was calibrated by dissolving ∼20 mg pellets of KCl in 25 g of deionized water. Prior to each calibration measurement, the potassium chloride was heated overnight in the furnace at 500°C to remove any adsorbed water. The expected heat effect for the calibration runs was calculated from Parker (1965).
3.2. Thermogravimetry
The weight loss of two starkeyite samples (∼50 mg each) was determined with a STA 503 Thermal Analyzer (BÄHR-Thermoanalyse GmbH) located at Ruhr University Bochum. The samples were investigated under N2-enriched air (1 atm) in the temperature range from room temperature to 600°C at a heating rate of 5°C/min. Differential thermal analysis (DTA) and thermogravimetric analysis (TG) signals were recorded simultaneously.
3.3. Low-temperature heat capacity measurements
The low-temperature (5–300 K) heat capacity behavior of starkeyite was investigated with the Physical Property Measurement System (PPMS) constructed by Quantum Design (Lashley et al., 2003) installed at Salzburg University. About 20 mg of the powdered sample was sealed in an Al pan so that the powder was compressed into an ∼1 mm thick layer (Dachs and Bertoldi, 2005). Heat capacity was measured at 60 different temperatures and three times at each temperature on cooling from 300 K with a logarithmic spacing. A full PPMS experiment to measure Cp consisted of an “addenda run” and a “sample run.” During the first measurement, the heat capacity of the empty sample platform was determined. In the second measurement, the sample was placed in the pan, and the heat capacity of the whole ensemble was measured. The net heat capacity of the sample is then given by the difference between the two measurements. An uncertainty of ±0.02 mg for the sample weight was adopted for converting the PPMS data from units of μJ·K−1 to units of J·K−1·mol−1.
3.4. Differential scanning calorimetry
Differential scanning calorimetry (DSC) measurements with a Perkin Elmer Diamond DSC in the temperature range 270 K<T<300 K were performed to check the reproducibility of the PPMS measurements around ambient temperature (Dachs and Benisek, 2011). The powdered sample was put into Perkin Elmer Al pans covered with lids. The measurements were performed under a flow of Ar gas, and the calorimeter block was kept at a constant temperature of 243.3 K with a Perkin Elmer Intracooler. The growth of ice crystals on the calorimeter block was prevented by a flow of dried air (200 mL·min−1). Additionally, the cover heater was turned off.
The complete investigation consisted of three separate measurements: a blank, a reference, and a sample measurement. Before the sample measurement, the DSC was calibrated with a reference run by using a synthetic single crystal of corundum (31.764 mg) whose heat capacity values were taken from the National Bureau of Standards Certificate (Ditmars et al., 1982). Two measurement series were performed.
4. Experimental Results
4.1. Enthalpy measurements
Five experiments were carried out for starkeyite, four for the trihydrate crystals. After the first two experiments with the trihydrate, the crystal pieces became whitish, and the measured solution enthalpies deviated progressively from the first two results. Apparently, a significant volume of the crystals started hydrating; therefore, the last two results were discarded. The thermodynamic cycle listed in Table 2 was used to calculate the enthalpy of formation from the obtained enthalpies of dissolution of both studied hydrates of MgSO4.
Average.
Two standard deviations of the mean.
Number of measurements.
Robie and Hemingway (1995).
Our measured
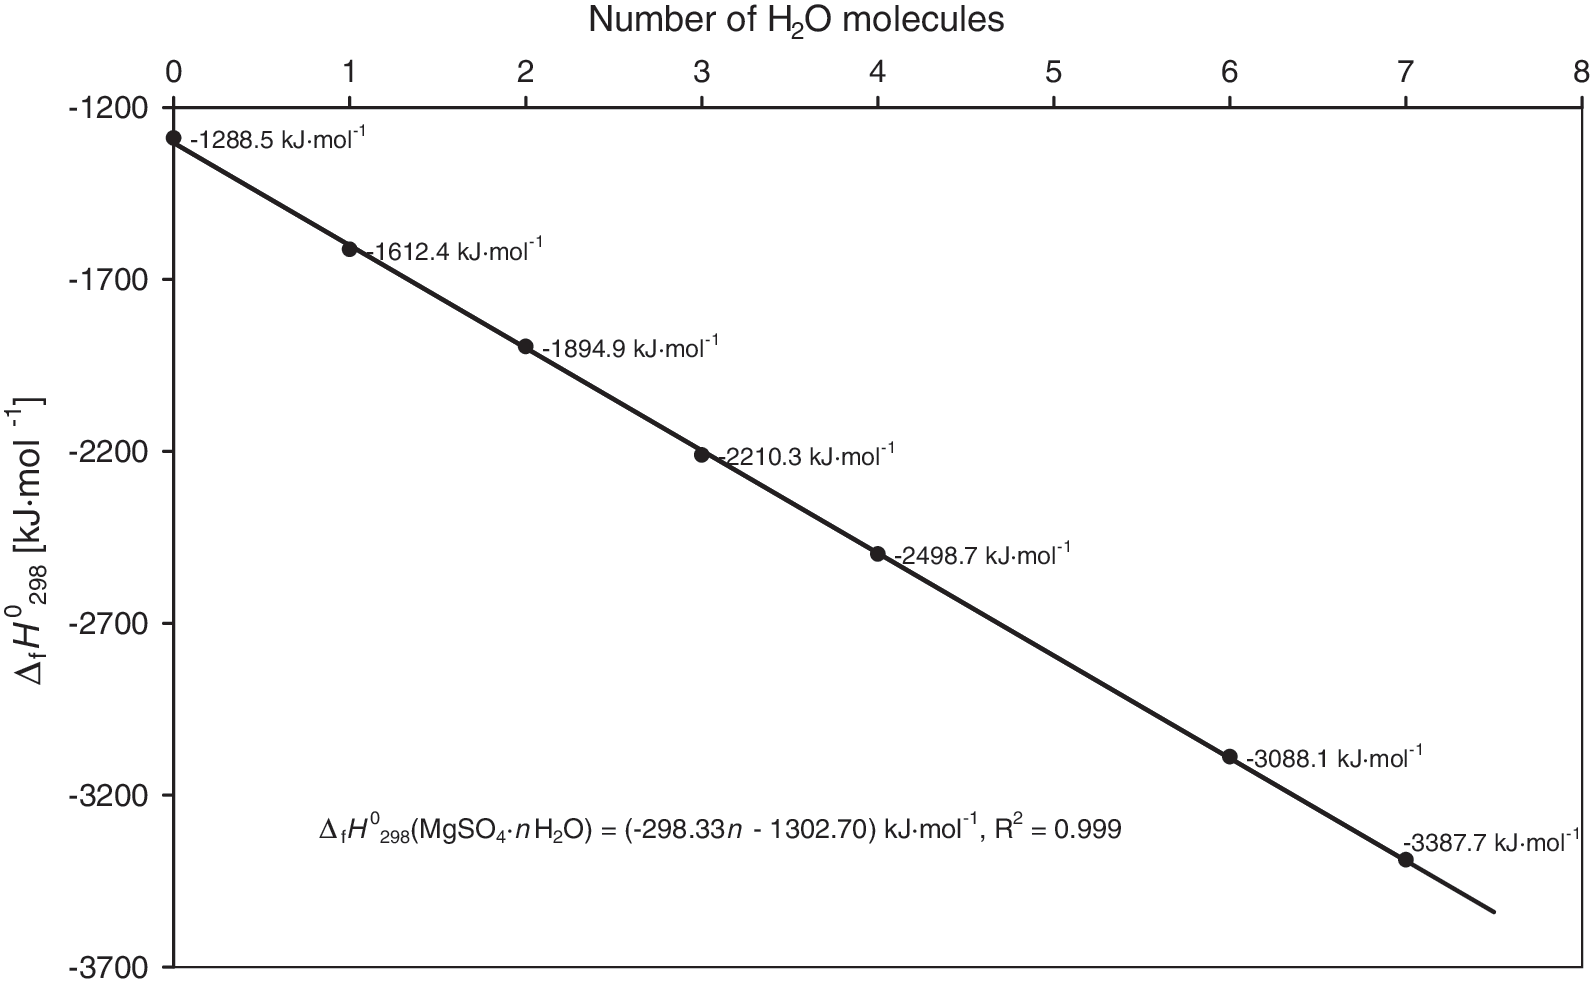
Linear correlation between the number of water molecules and the enthalpy of formation of Mg-sulfate hydrates. The measured values given in the figure for kieserite (n=1), sanderite (n=2), hexahydrite (n=6), and epsomite (n=7) were taken from Grevel and Majzlan (2009); for starkeyite (n=4) and the trihydrate (n=3) see this study. The value for anhydrous Mg sulfate (n=0) was taken from Ko and Daut (1979).
with a high correlation coefficient of R 2=0.99. This high value tempts to consider the estimated formation enthalpies for the Mg-sulfate hydrates to be very good. It has to be noted that the correlation is so high because formation enthalpies from elements (not formation enthalpies from oxides or formation enthalpies from MgSO4 and H2O) are considered. The estimated enthalpies of formation of the respective magnesium sulfate hydrates differ from the experimentally determined properties by 2.7 kJ·mol−1 for starkeyite to more than 14 kJ·mol−1 for the anhydrous magnesium sulfate. For the delicate phase equilibria considered in this paper, such difference would mean a shift of relative humidity of an equilibrium reaction at a given temperature of more than 100%, thus shifting some curves completely out of the T-RH space. So, estimates such as these may be used as a first guess but will most likely not lead to correct phase diagrams.
Using Eq. 1 for obtaining an estimate for
4.2. Thermogravimetry
Two different batches of the powdered starkeyite sample were analyzed. The first batch was untreated. The other batch was finely ground, used for the Cp measurements in Salzburg, and analyzed afterwards. The untreated batch weighed 57.50 mg, the ground sample 46.75 mg. Figure 4 shows the results for the ground sample. The results of the untreated sample are almost equivalent. Starkeyite loses water in five steps; the total loss was calculated to be 36.9% for the ground sample and 37.0% for the untreated material. These observations agree well with the theoretical value of 37.4%. Thus, we conclude that grinding had no effect on the state of hydration of our sample. Analyzing the TG curve (Fig. 4), we concluded that starkeyite dehydrates to sanderite (n=2) in two steps. The observed loss of water, 18.6%, agrees very well with the theoretical value, 18.7%. In the next step, dehydration to kieserite occurs—27.8% weight loss was observed versus 28.1% weight loss theoretically. The final dehydration of kieserite seems to occur in two more steps.
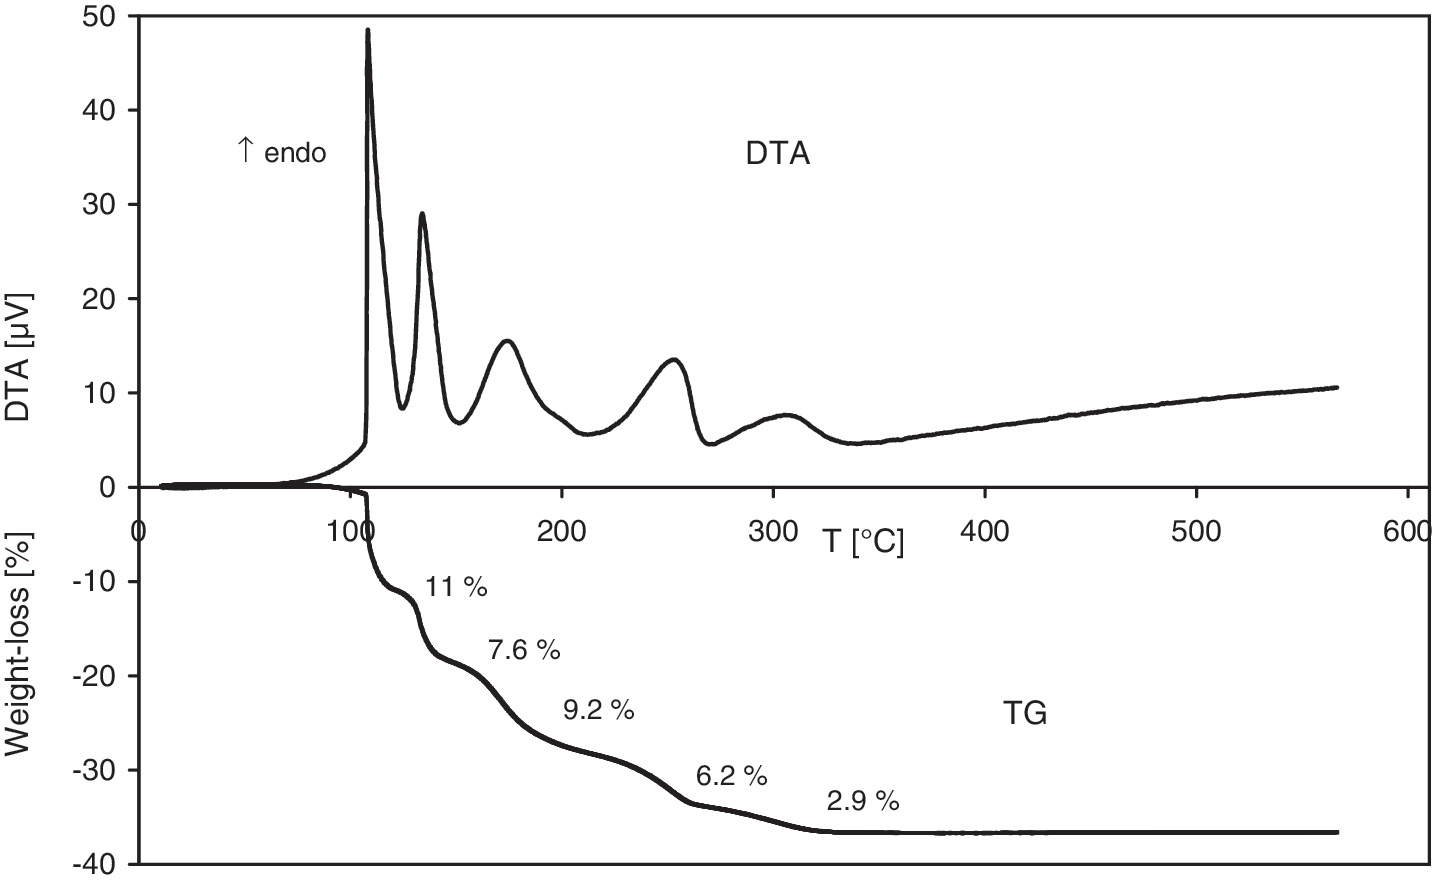
TG/DTA analysis of starkeyite. The sample weight was 46.75 mg. The total mass loss equals 36.9%. Obviously, starkeyite loses water in five steps; the weight loss of each single step is shown in the TG diagram.
4.3. Entropy and heat capacity of starkeyite
A single PPMS measurement on 21.618 mg of the ground starkeyite sample was carried out. The sample, which was verified to be starkeyite by XRD directly before and after the measurement, had lost 0.124 mg of its weight during the experiment, which was taken into consideration in the data analysis. All measured heat capacities for starkeyite are listed in Table 3 and shown in Fig. 5; the low-temperature PPMS data can be found in Table 3a, the DSC data (around ambient T) in Table 3b. Smoothed thermodynamic functions for starkeyite (Table 3c) were calculated by fitting this final Cp
data set to a combination of Debye, Einstein, and Schottky functions (e.g., Boerio-Goates et al., 2002; Dachs et al., 2010) and extrapolating this function to 0 K:
The data are the mean of two series of measurements.
where D(θD), E(θE), and S(θS) are the Debye, Einstein, and Schottky functions, respectively, and nd, ne, ns, θD, θE, and θS are adjustable parameters. For an optimal representation of the experimental low-temperature Cp behavior, the data were divided into low- and high-temperature intervals. Thus, two sets of fit parameters are listed in Table 3d, which have to be used below and above T switch, respectively. As can be seen from Fig. 5, the agreement between PPMS and DSC data around ambient temperature is very good; at 295 K, the latter are larger by 0.13%. As expected for the simple compound, no anomalies in the Cp data are observed.
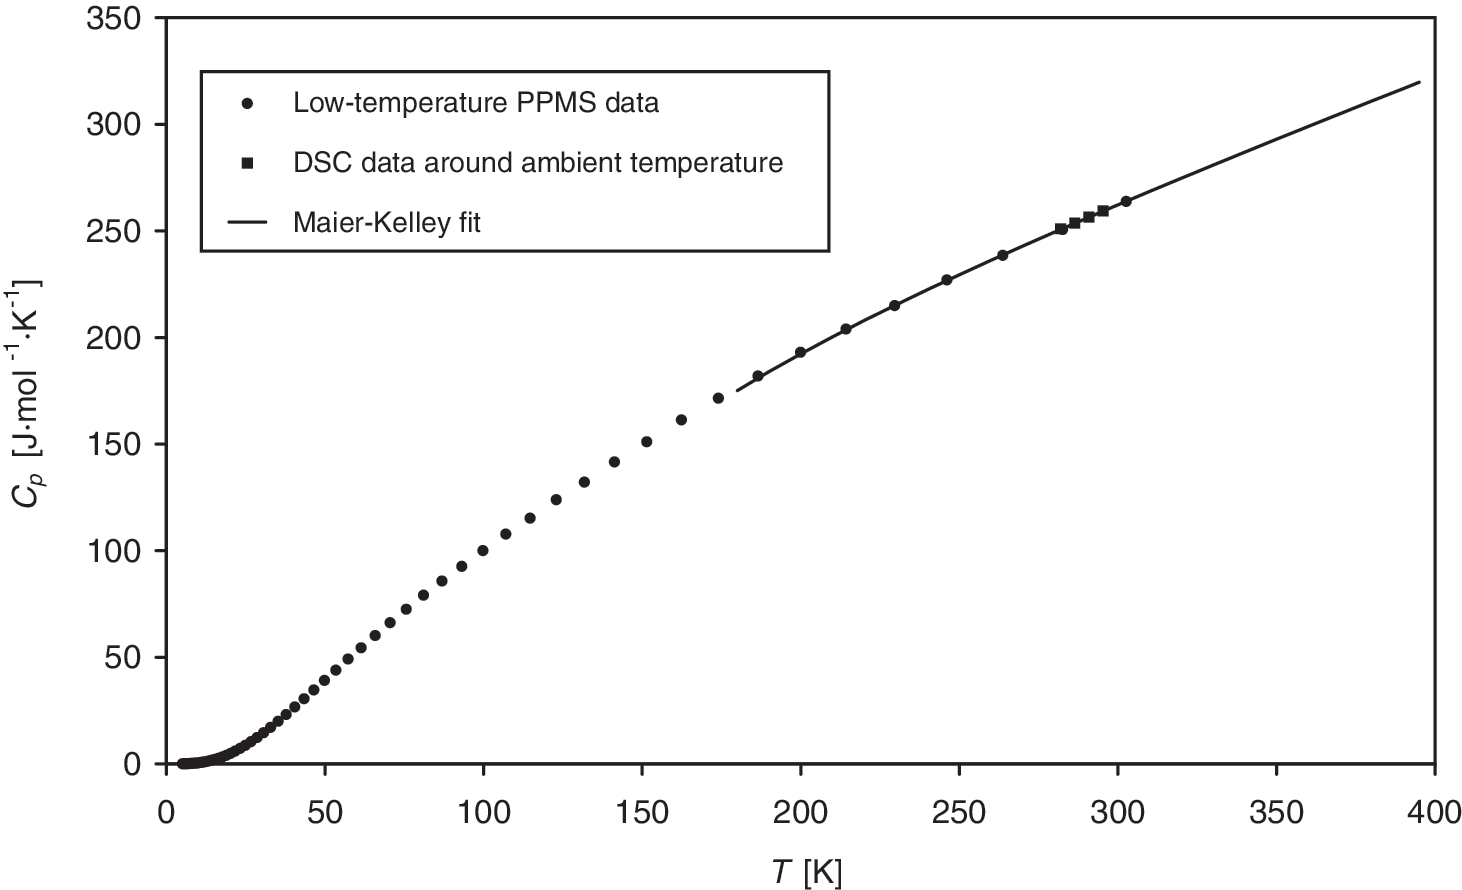
Heat capacity of starkeyite. The solid line represents a Maier-Kelley fit to all Cp data between 229 and 303 K.
The resulting standard entropy of starkeyite, 254.48±2.0 J·K−1·mol−1, is very close to the estimate of Pabalan and Pitzer (1987), 254.76 J·K−1·mol−1, and also close to the optimized value 259.9 J·K−1·mol−1 from Grevel and Majzlan (2009). Obviously, the earlier estimate of 246.86 J·K−1·mol−1 (DeKock, 1986) can be discarded.
5. Refinement of the Thermodynamic Data
All Mg-sulfate hydrates change their hydration state in response to the local temperature and humidity conditions. In their case study, Grevel and Majzlan (2009) performed a MAP analysis based on a simultaneous treatment of calorimetric data and constraints given from relevant reversal experiments (van't Hoff et al., 1912; Chou and Seal, 2003, 2007) according to the hydration-dehydration reaction
For this reaction, the standard Gibbs free energy (in kJ·mol−1) is given as
where
Mathematical programming deals with a system of inequalities given by (1) phase equilibria constraints resulting from the reversal experiments, and (2) phase property constraints gained from calorimetry.
According to Reaction 3, the low-temperature half-bracket indicates the T-%RH condition at which the higher-hydrate sulfate, that is, the reactant, has proven to be stable—here
These inequalities can be rewritten as
r denoting the sum of the remaining terms of Eq. 5, which are kept constant throughout the MAP procedure:
Grevel and Majzlan (2009) assumed ΔCp
=0 in their MAP calculations because only a limited amount of Cp
data of the different hydrates of MgSO4 was available. The magnitude of the error introduced by this assumption is not known exactly but is likely not large, because the temperature range spanned is less than 100 K wide. Nevertheless, now we have experimental data for the important Mg-sulfate hydrates kieserite (Frost et al., 1957), starkeyite (this study), hexahydrite (Cox et al., 1955), and epsomite (Gurevich et al., 2007). For starkeyite, the data reported in this study in the temperature region T=229–303 K (cf. Table 3a, 3b) were fitted with a commonly used Maier-Kelley polynomial
The fit parameters a, b, and c are listed in Table 4 together with the parameters for the other minerals, which were taken from Grevel and Majzlan (2009).
The parameters for kieserite, hexahydrite, and epsomite are taken from Grevel and Majzlan (2009). The parameters for starkeyite result from a fit to the experimental data in the range 229 K<T<303 K.
In the present study, we repeated the MAP analysis carried out by Grevel and Majzlan (2009), suspending the assumption ΔCp =0 for all reactions under consideration. The fugacity of steam is calculated by the equation of state of Grevel and Chatterjee (1992), which is based on the data of Haar et al. (1984) and is implemented in the software used for the MAP analysis (cf. Grevel and Majzlan, 2011). Standard state values for steam are taken from Robie and Hemingway (1995).
The inequalities given by the phase property constraints are defined by
In a first run, the MAP problem was constrained by the same reversal experiments already used by Grevel and Majzlan (2009), which are depicted in Fig. 1 (van't Hoff et al., 1912; Chou and Seal, 2003, 2007). The calorimetric
The resulting values consistent both with our calorimetric data and humidity brackets are listed in Table 5a. The refined standard enthalpy values changed only slightly (generally less than 1 kJ·mol−1) in comparison to the starting values, that is, well within their error limits given by the calorimetric measurements. On the other hand, the entropy values changed more significantly. The largest difference (2.9 J·mol−1·K−1) to the starting value 348.1 J·mol−1·K−1 was obtained for
The differences
Steiger et al. (2011) reported new measurements of equilibrium relative humidities for several stable and metastable hydration–dehydration equilibria in the MgSO4–H2O system (see Fig. 1). They concluded a good agreement of their data with those of Chou and Seal (2003) for the epsomite/hexahydrite reaction but a significant disagreement with the Chou and Seal (2007) experiments for the hexahydrite dehydration to starkeyite, especially at higher temperatures. Furthermore, the data of Steiger et al. (2011) are in a good agreement with the experimental data on the latter reaction provided by Lallemant et al. (1974). Additionally, Steiger et al. (2011) presented data for the reaction epsomite=kieserite + 6H2O.
In a second run, the measurements of Steiger et al. (2011) served as constraints for our MAP procedure to obtain a revised internally consistent thermodynamic data set for magnesium sulfate hydrates. Since Steiger et al. (2011) did not provide brackets but only equilibrium positions, their stated overall accuracy (±1–2%RH) was added retrospectively to obtain brackets constraining the MAP problem. In this run, all starting values including the entropy values changed only slightly (cf. Table 5b).
Figure 6 shows the calculated equilibrium curves according to Eq. 4, for which the refined data were used, for different hydration/dehydration reactions. In Fig. 6a, the data are constrained by the brackets of Chou and Seal (2003, 2007), while in Fig. 6b the diagram constrained by the Steiger et al. (2011) data is shown. Obviously, the (metastable) dehydration hexahydrite/starkeyite is moved to higher temperatures here. The invariant point defined by MgSO4·7H2O + MgSO4·6H2O + MgSO4·H2O + vapor, which is equivalent to the lower temperature limit of the hexahydrite stability field, is located at about 7.5°C and 39.0%RH (Fig. 6a), respectively, 10.0°C and 40.7%RH (Fig. 6b). Both diagrams show calculated curves extended to temperatures below 0°C. The sublimation pressure of H2O was calculated according to Wagner et al. (1994). The invariant point given by the assemblage MgSO4·7H2O +MgSO4·6H2O + MgSO4·4H2O + vapor, which was modeled at 3°C and 32.9%RH by Steiger et al. (2011), is now found below 0°C in both cases. When the MAP problem is constrained by the Chou and Seal (2003; 2007) data, this point is located at nearly −18°C and 27.2%RH, whereas constraining the data by the experiments of Steiger et al. (2011) yields about −13°C at 28.3%RH. Quantitatively, both diagrams are very similar to Fig. 6 of Chou and Seal (2007). At −50°C, the (metastable) dehydration of epsomite to starkeyite occurs at about 20%RH and the epsomite–kieserite reaction at ca. 25%RH; this behavior is almost similar in Fig. 6a and 6b and slightly different from that of Steiger et al. (2011), who calculate the equilibrium humidities at this temperature to about 12%RH respectively 15%RH. It has to be noted here that Steiger et al. (2011) based their calculations on a pure water standard state at subzero temperatures, that is, RH=p/p0, with p0 the vapor pressure over supercooled liquid water. If the sublimation pressure, that is, the saturation vapor pressure over ice, represented by the ice-line in their diagram, is used, the calculated equilibrium humidities at T=−50°C are 21%RH for the epsomite–starkeyite transition and 25.6%RH for the epsomite–kieserite transition. So actually there is excellent agreement with their calculations at low temperature.
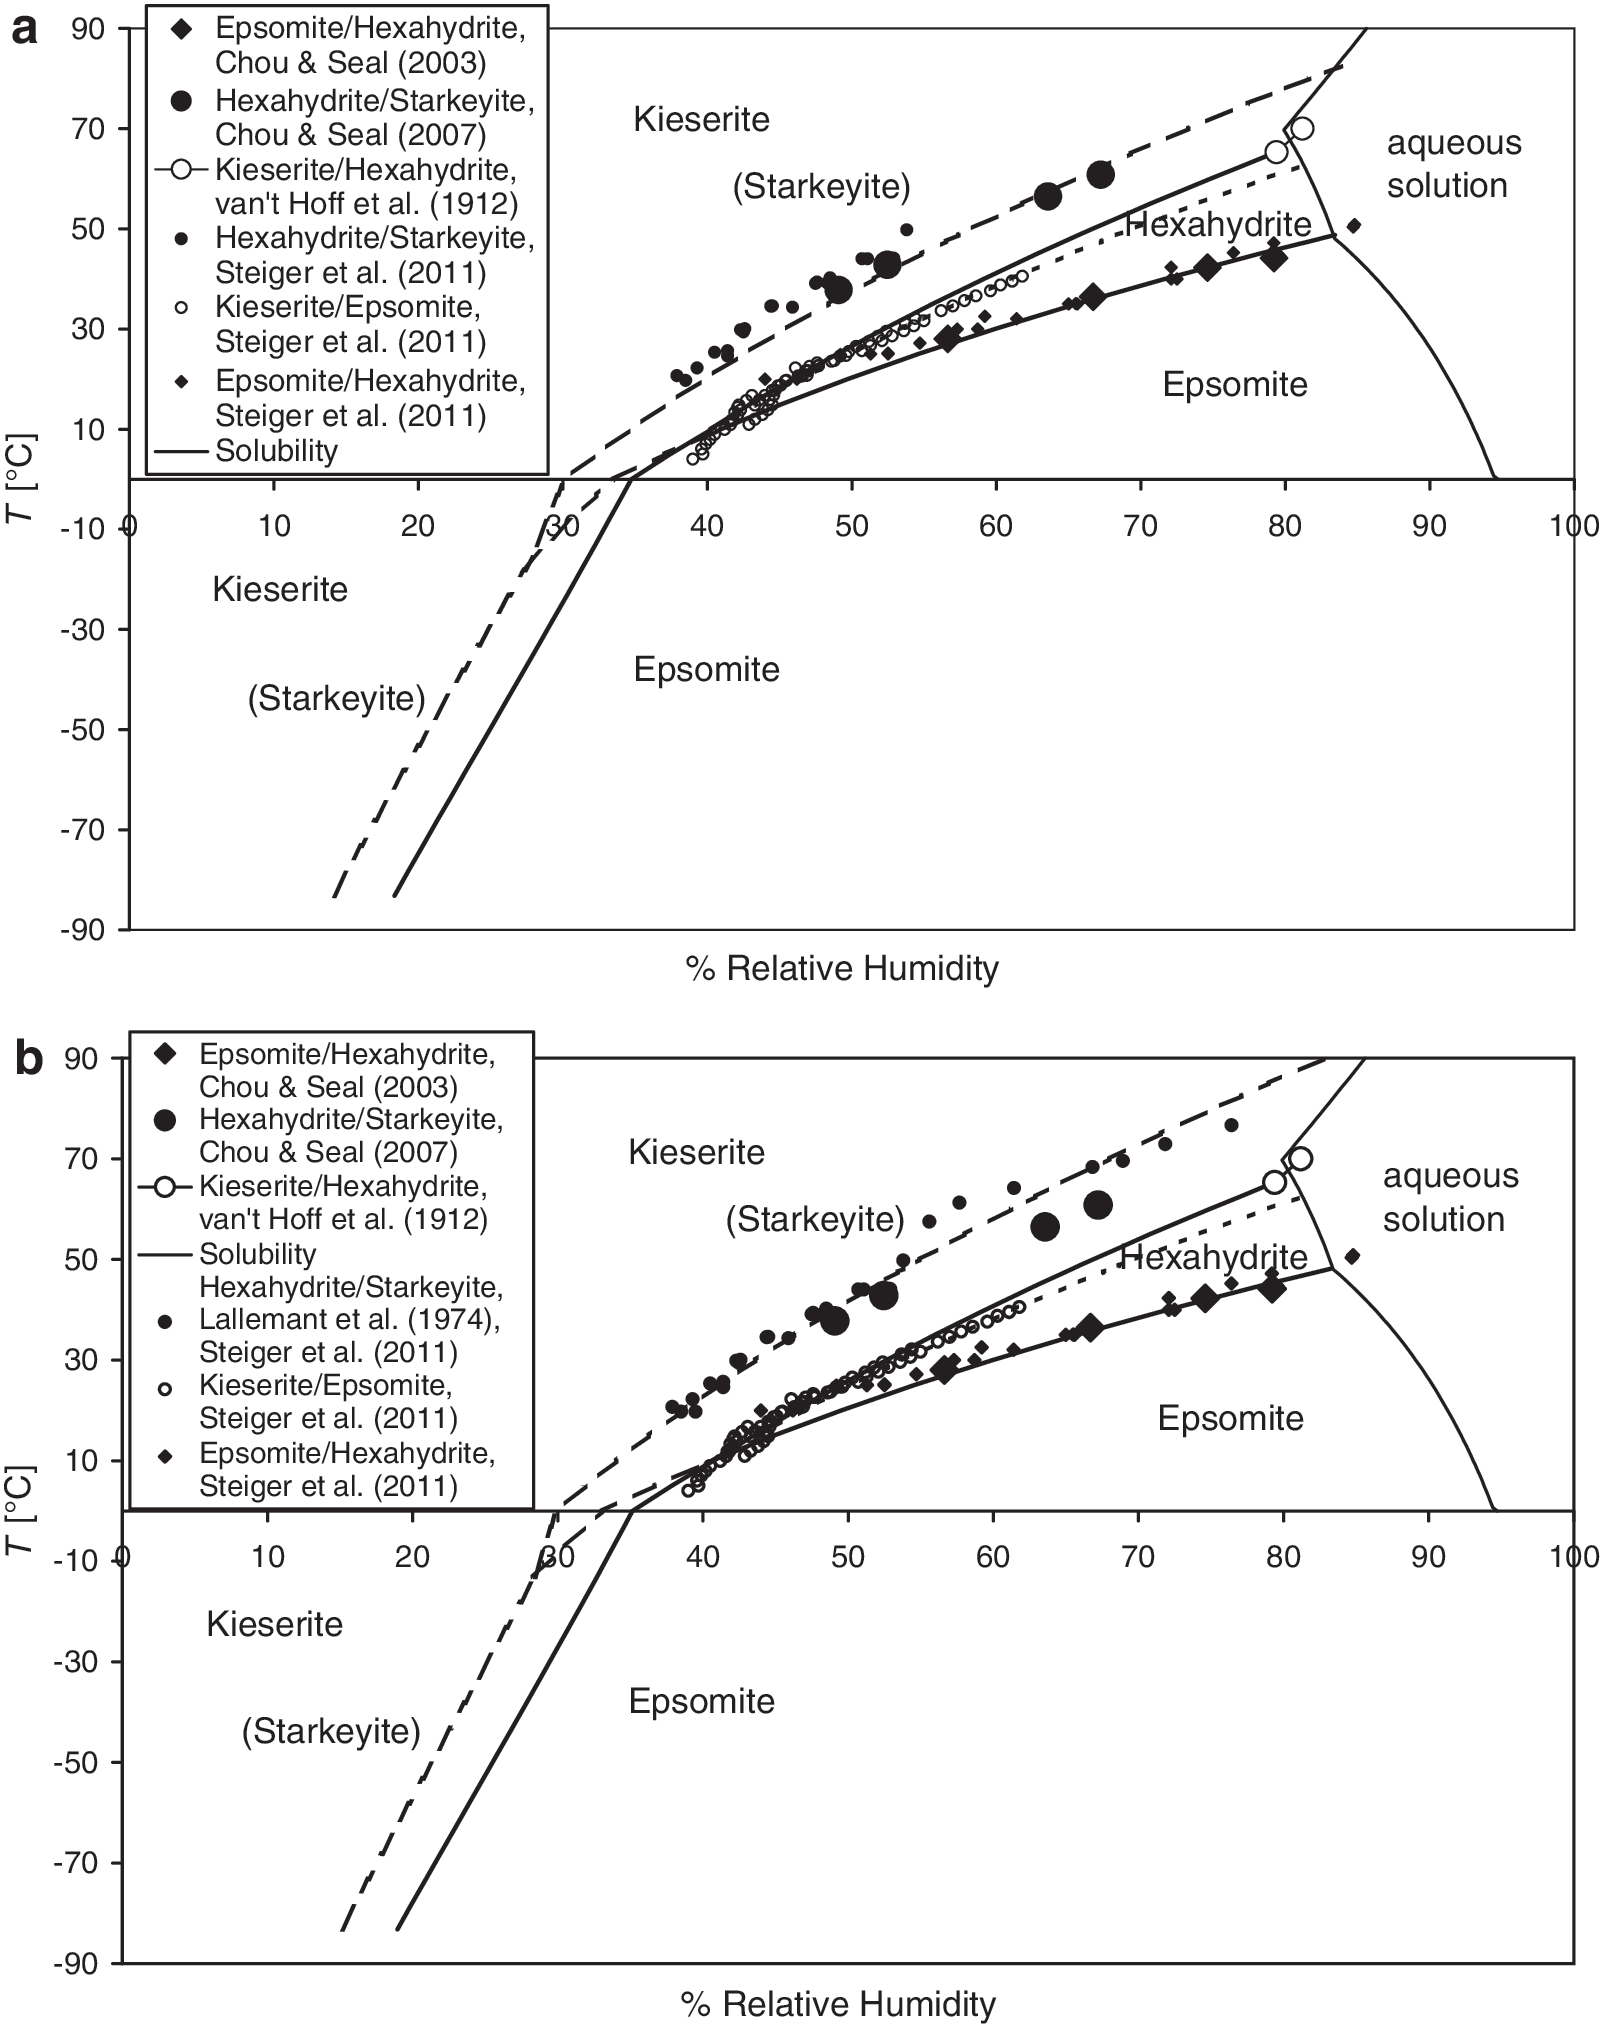
Calculated stability of Mg-sulfate hydrates as a function of temperature and relative humidity. Solid lines represent the stable equilibria MgSO4·7H2O⇔MgSO4·6H2O + H2O (epsomite/hexahydrite), MgSO4·6H2O⇔MgSO4·H2O + 5H2O (hexahydrite/kieserite), and MgSO4·7H2O⇔MgSO4·H2O + 6H2O (epsomite/kieserite below 10°C); dashed curves are the metastable MgSO4·6H2O⇔MgSO4·4H2O + 2H2O (hexahydrite/starkeyite), MgSO4·7H2O⇔MgSO4·4H2O + 3H2O (epsomite/starkeyite below −13°C), and MgSO4·7H2O⇔MgSO4·6H2O + H2O (epsomite/hexahydrite below 10°C) coexistence curves; the dotted line represents the MgSO4·7H2O⇔MgSO4·H2O + 6H2O boundary (epsomite/kieserite above 10°C). The solubility curve was calculated after Steiger et al. (2011). Large symbols represent experimentally obtained reversals of Chou and Seal (2003), Chou and Seal (2007), and van't Hoff et al. (1912). Small symbols represent measurements of equilibrium relative humidities for several hydration–dehydration equilibria in the MgSO4–H2O system (Steiger et al., 2011). The meridianiite (n=11)–epsomite reaction is not shown in the diagrams because no experimentally determined thermodynamic properties for meridianiite are available.
6. Implications
As already pointed out by Chou and Seal (2007) and Steiger et al. (2011), magnesium sulfate hydrates may play a dominant role in the water cycle of Mars through hydration and dehydration reactions involving atmospheric moisture during diurnal cycles of heating and cooling. Meridianiite (n=11) and epsomite (n=7) are stable at higher relative humidities during the night, while kieserite (n=1) is the stable phase during the martian day conditions. Starkeyite (n=4) is metastable in the entire T-%RH range. Kieserite and higher hydrated phases, so-called “polyhydrated sulfates,” are undoubtedly present on Mars, but the exact nature of the latter phases is not known up to now. Possible candidates include higher hydrated magnesium sulfates but also hydrated sulfates with other cations and double compounds such as bloedite (Roach et al., 2009). Strong kinetic limitations on Mg-sulfate equilibrium may prevent kieserite hydration (Vaniman and Chipera, 2006). Also, dehydration to kieserite is considered to be very sluggish. Therefore, the metastable formation of starkeyite is also possible under martian conditions. Though favorable from a thermodynamic point of view, the low temperatures on Mars might slow down reaction rates such that daily cycling is too short to allow for significant changes in the state of hydration. This may explain the occurrence of both kieserite and higher hydrated sulfates.
Interpretation of the potential role of magnesium sulfate hydrates in the martian water cycle must be approached with caution because of the uncertainties in reaction pathways at the low temperatures of the martian surface, which have not yet been investigated experimentally in enough detail. Further experimental data are needed at subfreezing temperatures to bracket Mg-sulfate stability. Nevertheless, this work places constraints on the conditions for preservation of the metastable tetra- and trihydrates of MgSO4, which is an essential requirement for interpreting the possible detection of these species by the forthcoming Curiosity Mars rover's mineralogy package, which includes in situ X-ray diffraction.
7. Concluding Remarks
In this work, we have derived two slightly different sets of internally consistent thermodynamic data for several MgSO4 hydrates by a mathematical programming procedure, including data for starkeyite based on calorimetric measurements. These sets are based on the new equilibrium experiments of Steiger et al. (2011) on one hand and on the brackets provided by Chou and Seal (2003, 2007) on the other (Fig. 1). The deviations from the input values are significantly smaller when the MAP problem is constrained by the Steiger et al. (2011) data, which are, on the other hand, more scattered than the data by Chou and Seal (2003, 2007). Since the treatment of the hexahydrite–starkeyite equilibrium by Steiger et al. (2011) is also consistent with all reported solubilities of the two solids (Steiger, personal communication), we prefer the use of the data listed in Table 5b. Nevertheless, both data sets are internally consistent. To constrain the data better, more low temperature calorimetric data are needed.
Footnotes
Acknowledgments
This work was supported by the Deutsche Forschungsgemeinschaft (Grant MA 3927/5-1 and 5-2), which is highly appreciated. Also, grants of the Austrian Science Fund (FWF), project numbers P21370 to E. Dachs and P23056 to A. Benisek, are gratefully acknowledged.
Abbreviations
DSC, differential scanning calorimetry, differential scanning calorimeter; DTA, differential thermal analysis; MAP, mathematical programming; PPMS, physical property measurement system; TG, thermogravimetric analysis; XRD, X-ray powder diffraction.