




Abstract
We report the first science results from the Space Environment Viability of Organics (SEVO) payload aboard the Organism/Organic Exposure to Orbital Stresses (O/OREOS) free-flying nanosatellite, which completed its nominal spaceflight mission in May 2011 but continues to acquire data biweekly. The SEVO payload integrates a compact UV-visible-NIR spectrometer, utilizing the Sun as its light source, with a 24-cell sample carousel that houses four classes of vacuum-deposited organic thin films: polycyclic aromatic hydrocarbon (PAH), amino acid, metalloporphyrin, and quinone. The organic films are enclosed in hermetically sealed sample cells that contain one of four astrobiologically relevant microenvironments. Results are reported in this paper for the first 309 days of the mission, during which the samples were exposed for ∼2210 h to direct solar illumination (∼1080 kJ/cm2 of solar energy over the 124–2600 nm range). Transmission spectra (200–1000 nm) were recorded for each film, at first daily and subsequently every 15 days, along with a solar spectrum and the dark response of the detector array. Results presented here include eight preflight and 16 in-flight spectra of eight SEVO sample cells. Spectra from the PAH thin film in a water-vapor-containing microenvironment indicate measurable change due to solar irradiation in orbit, while three other nominally water-free microenvironments show no appreciable change. The quinone anthrarufin showed high photostability and no significant spectroscopically measurable change in any of the four microenvironments during the same period. The SEVO experiment provides the first in situ real-time analysis of the photostability of organic compounds and biomarkers in orbit. Key Words: Cubesat—Nanosatellite—O/OREOS—SEVO—Low-Earth orbit—Astrobiology—UV-visible spectroscopy—Photochemistry—Photodegradation of organics—Polycyclic aromatic hydrocarbons—Quinone. Astrobiology 12, 841–853.
1. Introduction
K
Polycyclic aromatic hydrocarbons (PAHs) are among the most-studied organic molecules in space-exposure experiments due to their abundance and ubiquity in galactic and extragalactic regions, protoplanetary disks, and solar system objects (Sephton, 2002; Tielens, 2008). Spectral band variety and the ratios of main IR bands and many weaker bands indicate the existence of PAH families, including pure PAHs, PAH-related species (e.g., with aliphatic side groups), PAH clusters, and hydrogenated PAHs in space environments. The formation of PAHs is strongly linked to amorphous carbon and/or soot and may occur through gas-phase reactions in circumstellar regions (Cherchneff, 2010) or through the degradation of hydrogenated amorphous carbon that decomposes into small dehydrogenated PAHs, fullerenes, and large PAH clusters (García-Hernández et al., 2011). PAHs are also found in the soluble and insoluble carbonaceous fractions of meteorites (Fumiaki and Koichi, 2011).
Quinones, another class of astrobiologically relevant molecules, are common biological electron-transport and electron-transfer agents. These molecules have been formed in laboratory simulations of UV-photolyzed interstellar and planetary ices containing PAHs and are thought to be present on solid dust particles in cold space environments such as dense interstellar clouds or in the midplane of protoplanetary disks (Bernstein et al., 1999, 2002; Ashbourn et al., 2007).
The two additional organic samples aboard the Space Environment Viability of Organics (SEVO) payload—iron tetraphenylporphyrin, a member of an important class of biomarker for electron, oxygen, and CO2 transport in living systems; and the amino acid tryptophan, an exemplary protein building block—will be discussed in detail in a subsequent publication.
Considering the degradation and reactions of organic species, including PAHs and quinones, in nonterrestrial environments, radiation (including starlight or sunlight) is not the only important agent: direct contact with dust or minerals can modulate the effects and consequences of radiation in interstellar space or on atmosphere-free bodies such as asteroids (Madey et al., 2002; Rajappan et al., 2011). A range of gases, vapors, and liquids can affect the nature of the radiation spectrum that reaches the molecules on planets and some of their satellites, and these species can be involved as reactants or catalysts in photochemical reactions.
Nanosatellites or cubesats, which are small autonomous satellites in the under 10 kg category, have been heralded for their potential to reduce the cost and increase the accessibility of space science experiments (e.g., Woellert et al., 2011). Leveraging and integrating recent advances in nano-, micro-, and miniature technologies in fields that include biotechnology, materials, sensors, optics, electronics, fluidics, telecommunications, power, and analytical instrumentation, these small satellites are under development by nearly 100 universities, a growing cadre of small- and medium-sized commercial enterprises, most major aerospace companies, at least a dozen developing nations, and all major space-faring countries. Despite their small size, such spacecraft can support complex experiments (Ricco et al., 2010). Their free-flying nature means that radio communication of autonomously recorded results is more practical, and far less costly, than attempting sample recovery or return. This coupling of autonomous measurement with telemetry means that near-real-time data can be reported as orbital science experiments progress: kinetic information is readily available.
We report here initial science results from a 10 cm cube–based payload system known as the Space Environment Viability of Organics (SEVO) experiment aboard the Organism/Organic Exposure to Orbital Stresses (O/OREOS) nanosatellite. The main objective of the SEVO experiment is to investigate the stability, degradation, and modification of organic molecules to enhance our understanding of carbon chemistry in a variety of space environments. SEVO was designed to do this by enabling real-time UV-visible-NIR spectroscopic monitoring of the physical and chemical changes induced in organic compounds. During their exposure to space radiation, samples were maintained inside astrobiologically relevant “microenvironments.” We focus here on time-dependent spectral measurements of the PAH isoviolanthrene (IVA) and the quinone anthrarufin, obtained from SEVO orbital data telemetered to Earth during the first 10 months of the mission.
2. The O/OREOS Mission
2.1. The O/OREOS spacecraft
The first technology demonstration mission of the NASA Astrobiology Small Payloads program, the 5.5 kg O/OREOS nanosatellite was launched from Kodiak Launch Complex in Alaska to a 650 km, high-inclination (72°) Earth orbit on November 19, 2010. O/OREOS began operations hours after launch and achieved full mission success in May 2011 after 6 months in orbit (the end of its baseline mission); 16 months after launch, it continues to function, returning spectra from the SEVO payload every 15 days.1 Nicholson et al. (2011) recently reported the first results of the other O/OREOS payload, the Space Environment Survivability of Living Organisms (SESLO) experiment, which investigated growth and metabolism of microbes as a function of their residence time in the space environment.
The O/OREOS spacecraft is equipped with a passive attitude-control system that orients the satellite in Earth's magnetic field and hysteresis rods that damp rotational and nutational energy. The satellite has an orbital period of 97.7 min, and rotation around its long axis was ∼1 rpm for most of the mission.
Science data were retrieved throughout the mission by the Operations Center of the Robotic Systems Laboratory at Santa Clara University, with the use of a pair of 3 m parabolic antennas on campus. Further details on the spacecraft and its engineering systems are summarized elsewhere (Kitts et al., 2011).
2.2. SEVO in flight operation
The SEVO payload, housed in a 10 cm cube, contains a motorized 24-sample-cell carousel (18 organic samples, 4 microenvironment references, 2 “open hole” solar references), a UV-visible-NIR spectrometer, and fiber optics to transmit light from the sample cell collection optics to the spectrometer (Fig. 1). Additional components of the payload include sensors for measuring illumination angle and intensity as well as temperature and ionizing radiation dose (Kitts et al., 2011). A microprocessor controls the payload system and relays data to the spacecraft bus, which in turn transmits the data to Earth. The Sun serves as the light source for the spectrometer, which has spectral resolution of 1–2 nm and a 2048-pixel linear CCD array that acquires a single spectrum in 10–135 ms; for the results reported here, integration time was either 100 or 135 ms. Further technical details of the SEVO system are provided elsewhere (Bramall et al., 2012). Approximately 6 MB of science, systems health, and status data were downlinked from the spacecraft during the 6-month primary mission.
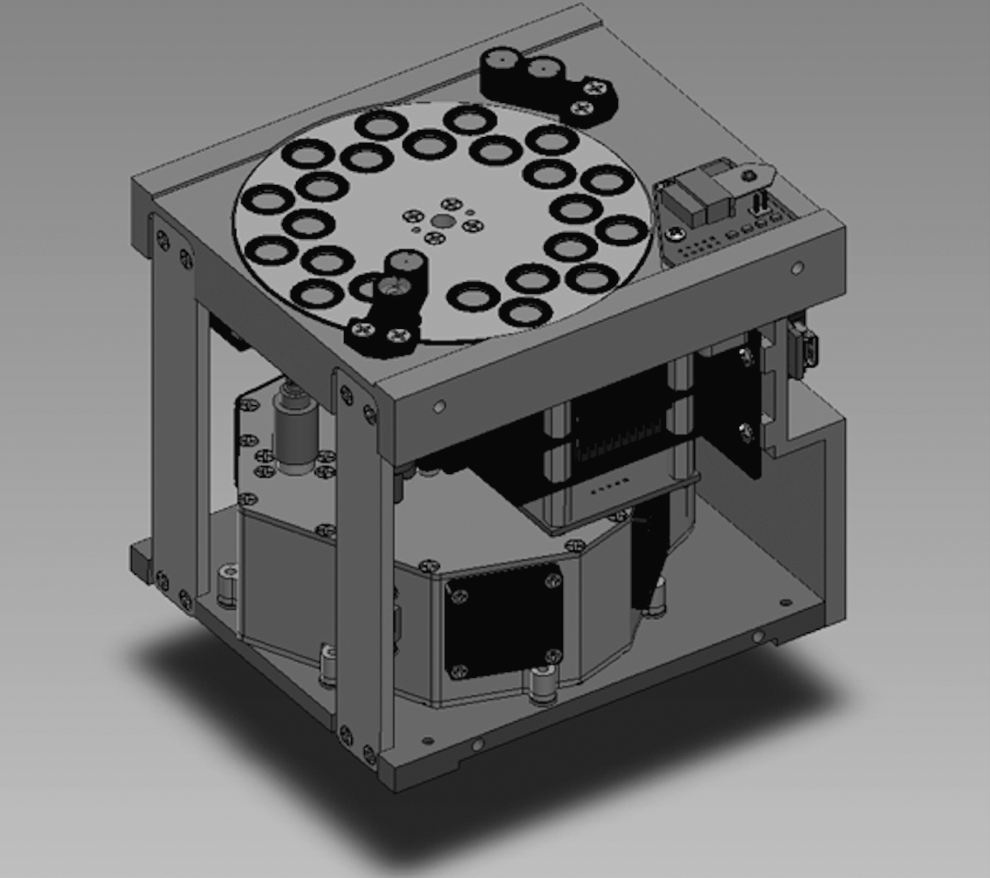
The SEVO payload includes a sample carousel driven by a stepper motor that holds 24 sample cells designed to expose organic thin films to both the full solar electromagnetic spectrum and the ionizing particle radiation of space. Spectra of the organic samples are measured in situ with a compact UV-visible-NIR spectrometer utilizing the Sun as light source.
The space radiation environment to which SEVO samples were exposed includes the full solar spectrum and ionizing radiation (attenuated only by 1.5 mm thick MgF2 optical flats that support the organic thin films) at an altitude of 650 km. During the 309-day exposure period reported here, SEVO thin-film samples were exposed to ∼2210 h of direct solar illumination (∼1080 kJ/cm2 of solar energy) in combination with an estimated 47 Gy of total ionizing radiation, including 43 Gy of trapped electrons, 2.8 Gy of trapped protons, 0.27 Gy of X-rays from Brehmsstrahlung, and 0.15 Gy of galactic cosmic radiation.2
Successful operation of the UV-visible-NIR spectrometer in outer space requires overcoming several significant hurdles: the thermal environment is unstable, so the spectrometer and its optical bench function from −20°C to +40°C without significant shift in wavelength calibration; only a few watts are available to operate the spectrometer, so detector cooling is not possible. Non-radiation-hardened electronics, including the detector, were chosen (due to budget constraints), so “hot pixel” effects must be corrected. Preflight radiation testing at ∼5 times the anticipated ionizing radiation dose during the mission confirmed that the commercial electronics should survive without failure and also foretold the hot-pixel effects observed in the downlinked spectra.
The use of the Sun as the light source saves power and provides good signal levels. Rotation of the spacecraft around its long axis at variable, initially unknown angular rates required a dynamic Sun angle detection capability to trigger spectral acquisition. The complexity of the solar spectrum combined with light intensity variability leads to a complex spectral processing routine. The near-point-source nature of solar illumination required adding a spectrally flat, angle-independent light diffuser. Comparatively less solar intensity in the UV and NIR led to incorporation of a custom broadband filter to attenuate the center of the solar spectrum without affecting the UV and NIR ends, which increased the available dynamic range. Earthshine and moonshine could potentially have interfered with the data analysis scheme used to extract absorbance from solar-illuminated thin-film transmittance, necessitating optical baffling of the incoming light to attenuate any such illumination. Miniature noncontact optical pyrometric sensors achieved temperature measurement of the rotating carousel that carries the samples.
The time for testing and calibration of all these customizations was minimal, necessitating on-orbit tuning via uplinked ground commands of the intensity-based spectral acquisition-triggering threshold and the detector integration time. The operation of the spectrometer and the return of spectra with acceptable signal-to-noise ratios within days of nanosatellite deployment represent the achievement of challenging mission success criteria.
3. Materials and Methods
3.1. SEVO samples and microenvironments
Custom sample cells, which were developed to house vacuum-deposited thin-film organic samples in the SEVO payload, controlled and defined reaction conditions at the start of space exposure. The controlled initial conditions, referred to as microenvironments, included headspace gas composition and pressure, water activity, and the composition of the sample-substrate interface (Bramall et al., 2012).
The SEVO samples comprise a suite of four organic molecules that include a PAH, a quinone, a metalloporphyrin, and an amino acid. The astrobiological relevance of the SEVO organic chemical classes has been extensively described in the literature (e.g., Bernstein et al., 1999; Ehrenfreund et al., 2006). Each SEVO sample cell contains one of the four organic compounds—IVA, anthrarufin, tryptophan, and iron tetraphenylporphyrin chloride—as an optically thin film on a MgF2 window, hermetically sealed inside one of the four microenvironments. Table 1 lists sample cell characteristics for the IVA and anthrarufin samples discussed in this paper. IVA is a 9-ringed PAH, a class of molecule that is a ubiquitous source of carbon in the interstellar medium. Anthrarufin is a partially oxidized form of 9,10-anthraquinone, a known biological electron-transport agent. Bramall et al. (2012) provided a detailed description of all SEVO samples, including the underlying science justification and sample preparation methods. Results from the space exposure of the two other SEVO organic sample types, tryptophan and iron tetraphenylporphyrin chloride, are under analysis and will be reported in a future communication.
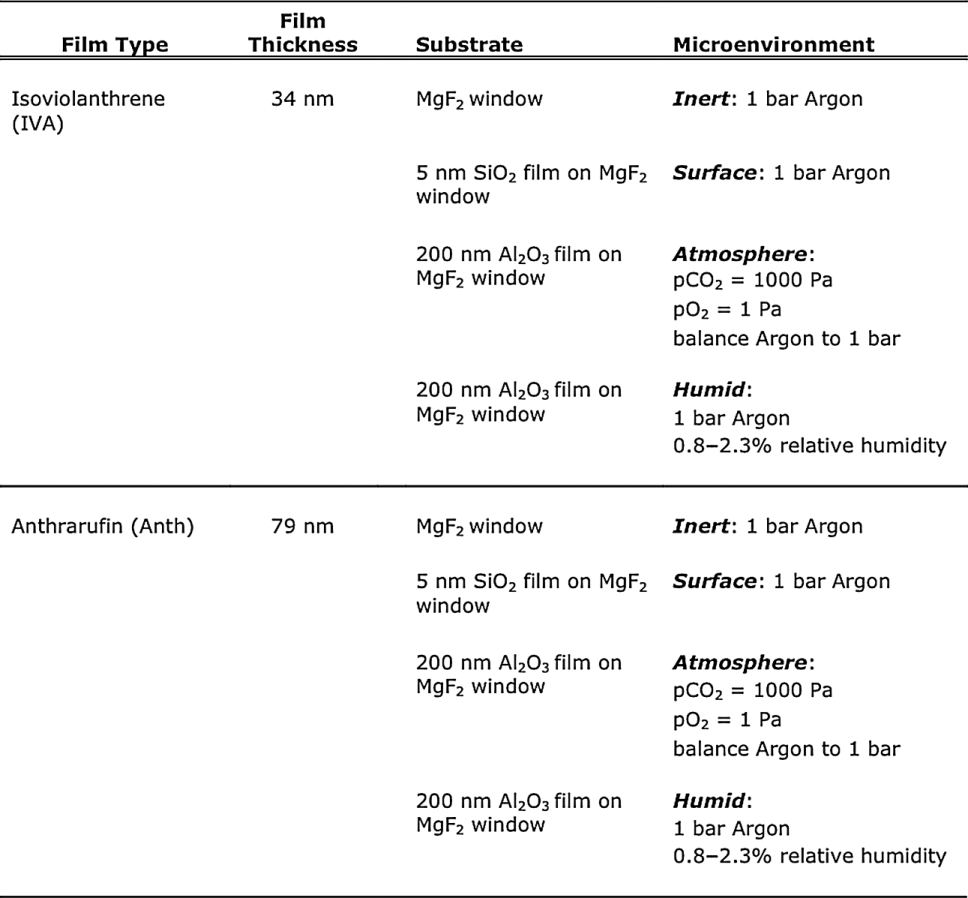
The four microenvironments, Inert, Surface, Atmosphere, and Humid (Table 1), were designed to probe potential chemical processes of astrobiological relevance and are not meant to duplicate actual astrophysical environments. Inert cells, containing 1 bar of Ar, focus primarily on direct radiation-induced changes in the organic samples, as in interstellar or interplanetary space. In Surface cells (also filled with Ar at 1 bar), the organic film was deposited onto a MgF2 window coated with a continuous 5 nm thick SiO2 film at the window/organic interface (Bramall et al., 2012) to probe possible photocatalytic effects of this oxide on the organic thin film, which is potentially similar to photochemistry that occurs on interplanetary dust particles, within comets, and on the lunar surface. Potential photochemical processes that occur between organic compounds and atmospheric gases are investigated in the Atmosphere cells, in which the organic thin film was sealed in 10% CO2 with trace O2 atmosphere (balance Ar to 1 bar). A thin layer of Al2O3 served as a coating on the MgF2 window to filter vacuum UV<170 nm. Finally, the impact of water on reaction mechanisms was investigated in Humid cells in which the organic film was deposited onto a 200 nm Al2O3-film-coated MgF2 window and sealed in a cell with controlled relative humidity (∼2% at 25°C or ∼67 Pa; balance Ar to 1 bar); see Bramall et al. (2012) for details. The Al2O3 coating serves two functions in this cell: protecting the hygroscopic MgF2 window of the cell from the water vapor and serving as a vacuum-UV-wavelength filter.
All the SEVO thin-film samples possess a UV-visible (UV-Vis) spectrum with significant absorption bands between 200 and 1000 nm (the range of the spectrometer) and, to provide maximum sensitivity to small absorbance changes, were deposited to scale the most intense absorption band of each thin film to ∼0.3 absorbance units (i.e., 50% light transmission). Additionally, the SEVO IVA and anthrarufin film thicknesses of 30–80 nm (Table 1) permit efficient film penetration by UV photons, which increases the probability that a measurable change would occur throughout the films and be observable over the course of the 6-month primary mission.
3.2. SEVO data collection and processing
Solar intensity sensors on SEVO trigger the sample spectral acquisition when the solar intensity exceeds a preset threshold. Spectra are collected every 100 or 135 ms until the measured intensity passes its maximum for that rotation of the satellite, and the most recent 16 collected spectra are averaged and the result stored and the spectrometer returned to standby mode. The sample carousel then rotates to the next sample position, and the process is repeated until all 24 positions have been measured; depending on the intensity threshold setting and the phase of the orbit (i.e., the illumination conditions), a few hours to several days are required to collect 24 spectra in this manner. Once all 24 positions have been measured, the carousel returns to the “home” position in which all cells are exposed to direct sunlight and the diffuser and collimator assemblies are positioned above a blank region of the carousel. Spectral sets from all 24 sample positions were collected daily during the first 2 weeks of space operations, with the acquisition period decreasing gradually to biweekly. The highest-quality early (November 2010–March 2011) and late (May 2011–August 2011) mission data, based on signal-to-noise and saturation levels, are reported.
Absorbance was calculated with the following equation:
where A is absorbance, I S is the intensity of light after it passes through the sample film, and I R is the corresponding reference intensity, obtained in each case from a “blank” sample cell having the same microenvironment and same window coating layer (if any) as the organic sample cell. For presentation purposes only, to eliminate obfuscating noise due to low response of the spectrometer at short wavelengths, both the reference and sample spectrum were additively scaled by n=100 intensity counts (see Eq. 1) before taking the ratio to calculate absorbance. Due to variations in spectral intensity resulting from solar intensity changes due to satellite rotation and orientation, I R and I S were scaled to each other in a region where no absorbance features were expected or detected prior to calculating absorbance. For IVA all spectra were scaled at 420 nm, and for anthrarufin all spectra were scaled at 370 nm.
To determine the strength of a spectral feature, a polynomial was fit to the feature, and a local straight-line continuum was determined by selecting points on both sides of the band. The polynomial was integrated, with the use of the local continuum, to determine the integrated absorbance of the band. Error bars for the integrated absorbance were estimated by selecting extreme (but still reasonable) continuum points, resulting in the smallest and largest reasonable integrated absorbance for each spectrum, which define the margins of each error bar.
3.3. Laboratory spectroscopy and photolysis
Preflight laboratory baseline spectra were measured in transmission with an Ocean Optics HR4000CG-UV-NIR spectrometer (200–1100 nm), which has characteristics similar to the SEVO flight spectrometer. A spectroscopic, fiber-coupled combination deuterium/tungsten lamp (DH-2000, Ocean Optics, Inc.) was used as the light source. Preflight absorbance spectra were reduced with the same methods described above. Preflight and mission spectra for the IVA and anthrarufin sample cells are shown in the next section. It should be noted that the additive scaling used in calculation of absorbance spectra has the effect of decreasing the apparent absorbance at wavelengths where the difference in I R and I S is close to zero. To quantify changes in the spectra, we integrated the absorbance of the main feature at 357 nm at numerous time points throughout the mission. All such integrations were performed on spectra calculated without the use of the additive scaling factor n in Eq. 1.
To aid in the analysis of flight films, a limited laboratory control study was conducted by using a flight-duplicate Humid IVA sample cell. Photolysis of the control sample was achieved with two separate light sources, the two beams coinciding at the target sample. The first was a 300 W xenon arc lamp (Newport Corporation 66485) that simulated most of the visible portion of solar radiation. The second light source was a Lyman α–emitting microwave-powered hydrogen discharge lamp, similar to those described in Warneck (1962) and Cottin et al. (2003). The target sample rotated in and out of the beams on the same timescale as the rotation of the satellite.
Ultraviolet-visible and infrared spectral measurements were made at various time points throughout the photolysis experiment. Measurements of evolved CO2 inside the sample cell were made through the MgF2 and Al2O3 windows at four time points by the Digilab FTIR spectrometer. The areas of the gas-phase bands were integrated with Digilab Resolution Pro software and converted to molar values by using the A (absorbance) values published by Yamada and Person (1964). Ultraviolet-visible spectra of the irradiated cell were recorded at 16 time points throughout the experiment to monitor film changes.
4. Results
4.1. Isoviolanthrene (C34H18)
The in-flight and preflight absorbance spectra of the PAH isoviolanthrene for all four microenvironments are shown in Fig. 2. IVA is a large PAH composed of nine 6-membered rings attached in a mostly perifused manner. Its structure can be thought of as two naphthalene molecules attached to both ends of a perylene molecule, giving it the chemical name dinaphtho[1,2,3-cd:1′,2′,3′-lm]perylene.
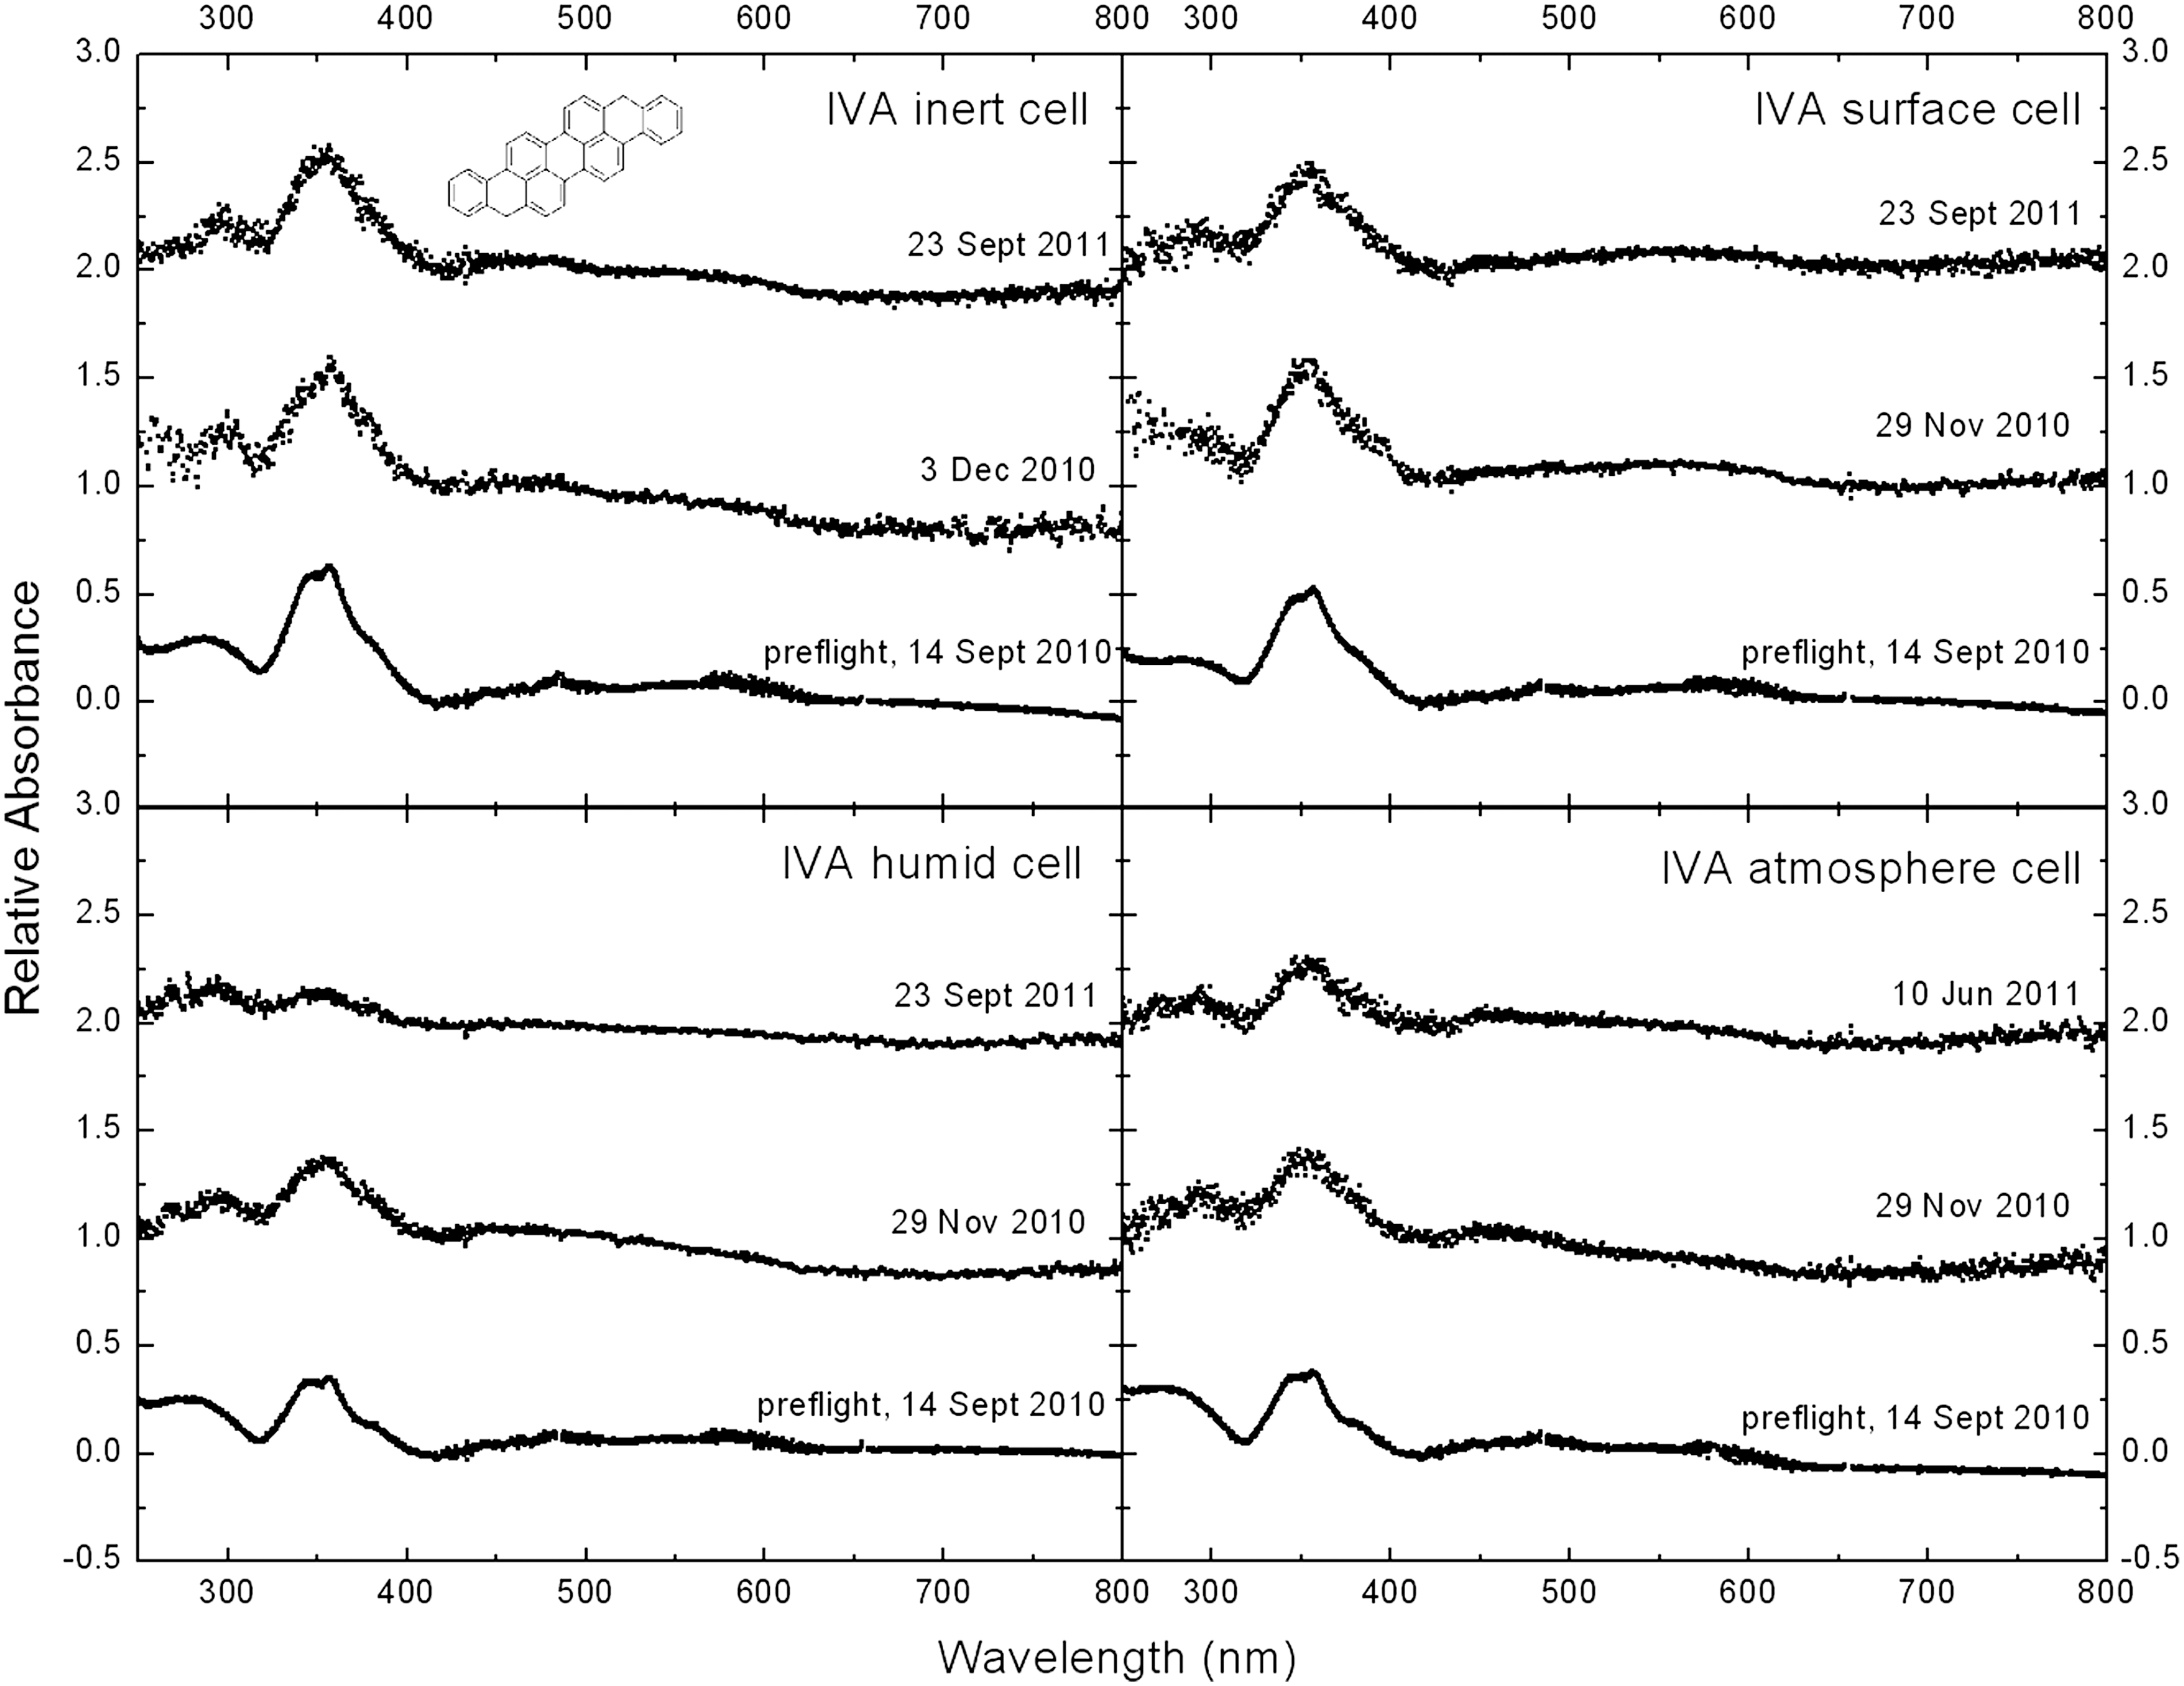
UV-Vis spectra of an IVA (C13H18) thin film in the four microenvironments (Inert, Surface, Atmosphere, and Humid). The spectra were measured with a laboratory spectrometer and light source (preflight) and in flight with the SEVO spectrometer and the Sun as a light source. Note the significant decrease in the ∼350 nm band's area between November 29, 2010, and September 23, 2011 (309 days), indicating IVA's photodestruction or modification in the Humid cell. The spectrometer's initial operational protocol and parameters were not optimized for the low solar flux below 260 nm (e.g., the solar flux at 260 nm is 30 times smaller than that at 400 nm), resulting in relatively poor signal-to-noise ratios below 260 nm. The additive scaling used in calculation of absorbance spectra has the effect of slightly decreasing the apparent absorbance (see Section 3.3).
The thin-film IVA spectrum shows a band centered at 288 nm, a broad, intense feature composed of two or more bands around 344 and 357 nm, and a very broad, weak feature with two, possibly more, bands centered at approximately 459 and 581 nm. Another absorption feature appears around 222 nm in the IVA thin film measured in the laboratory but falls in a region of reduced spectral sensitivity for the flight spectrometer and is not shown in Fig. 2. The feature is observed in laboratory-recorded spectra from Bramall et al. (2012). The only spectroscopic data for IVA reported in the literature are solution spectra recorded between 300 and 550 nm (Clar, 1964) and 250 and 600 nm (Fetzer, 1999). In solution, IVA contains three band systems of approximately equal intensity with maxima at 274 nm (side band 300 nm), 366 nm (vibronic progression at 341, 324 nm), and 518 nm (vibronic progression at 482, 454 nm) in the 250–600 nm range (Fetzer, 1999). The positions of these features are in complete agreement with the solution spectra of our deposited IVA thin-film samples, produced by dissolving the IVA thin film in tetrachloroethylene; see Fig. 3.

4.2. Anthrarufin (C14H8O4)
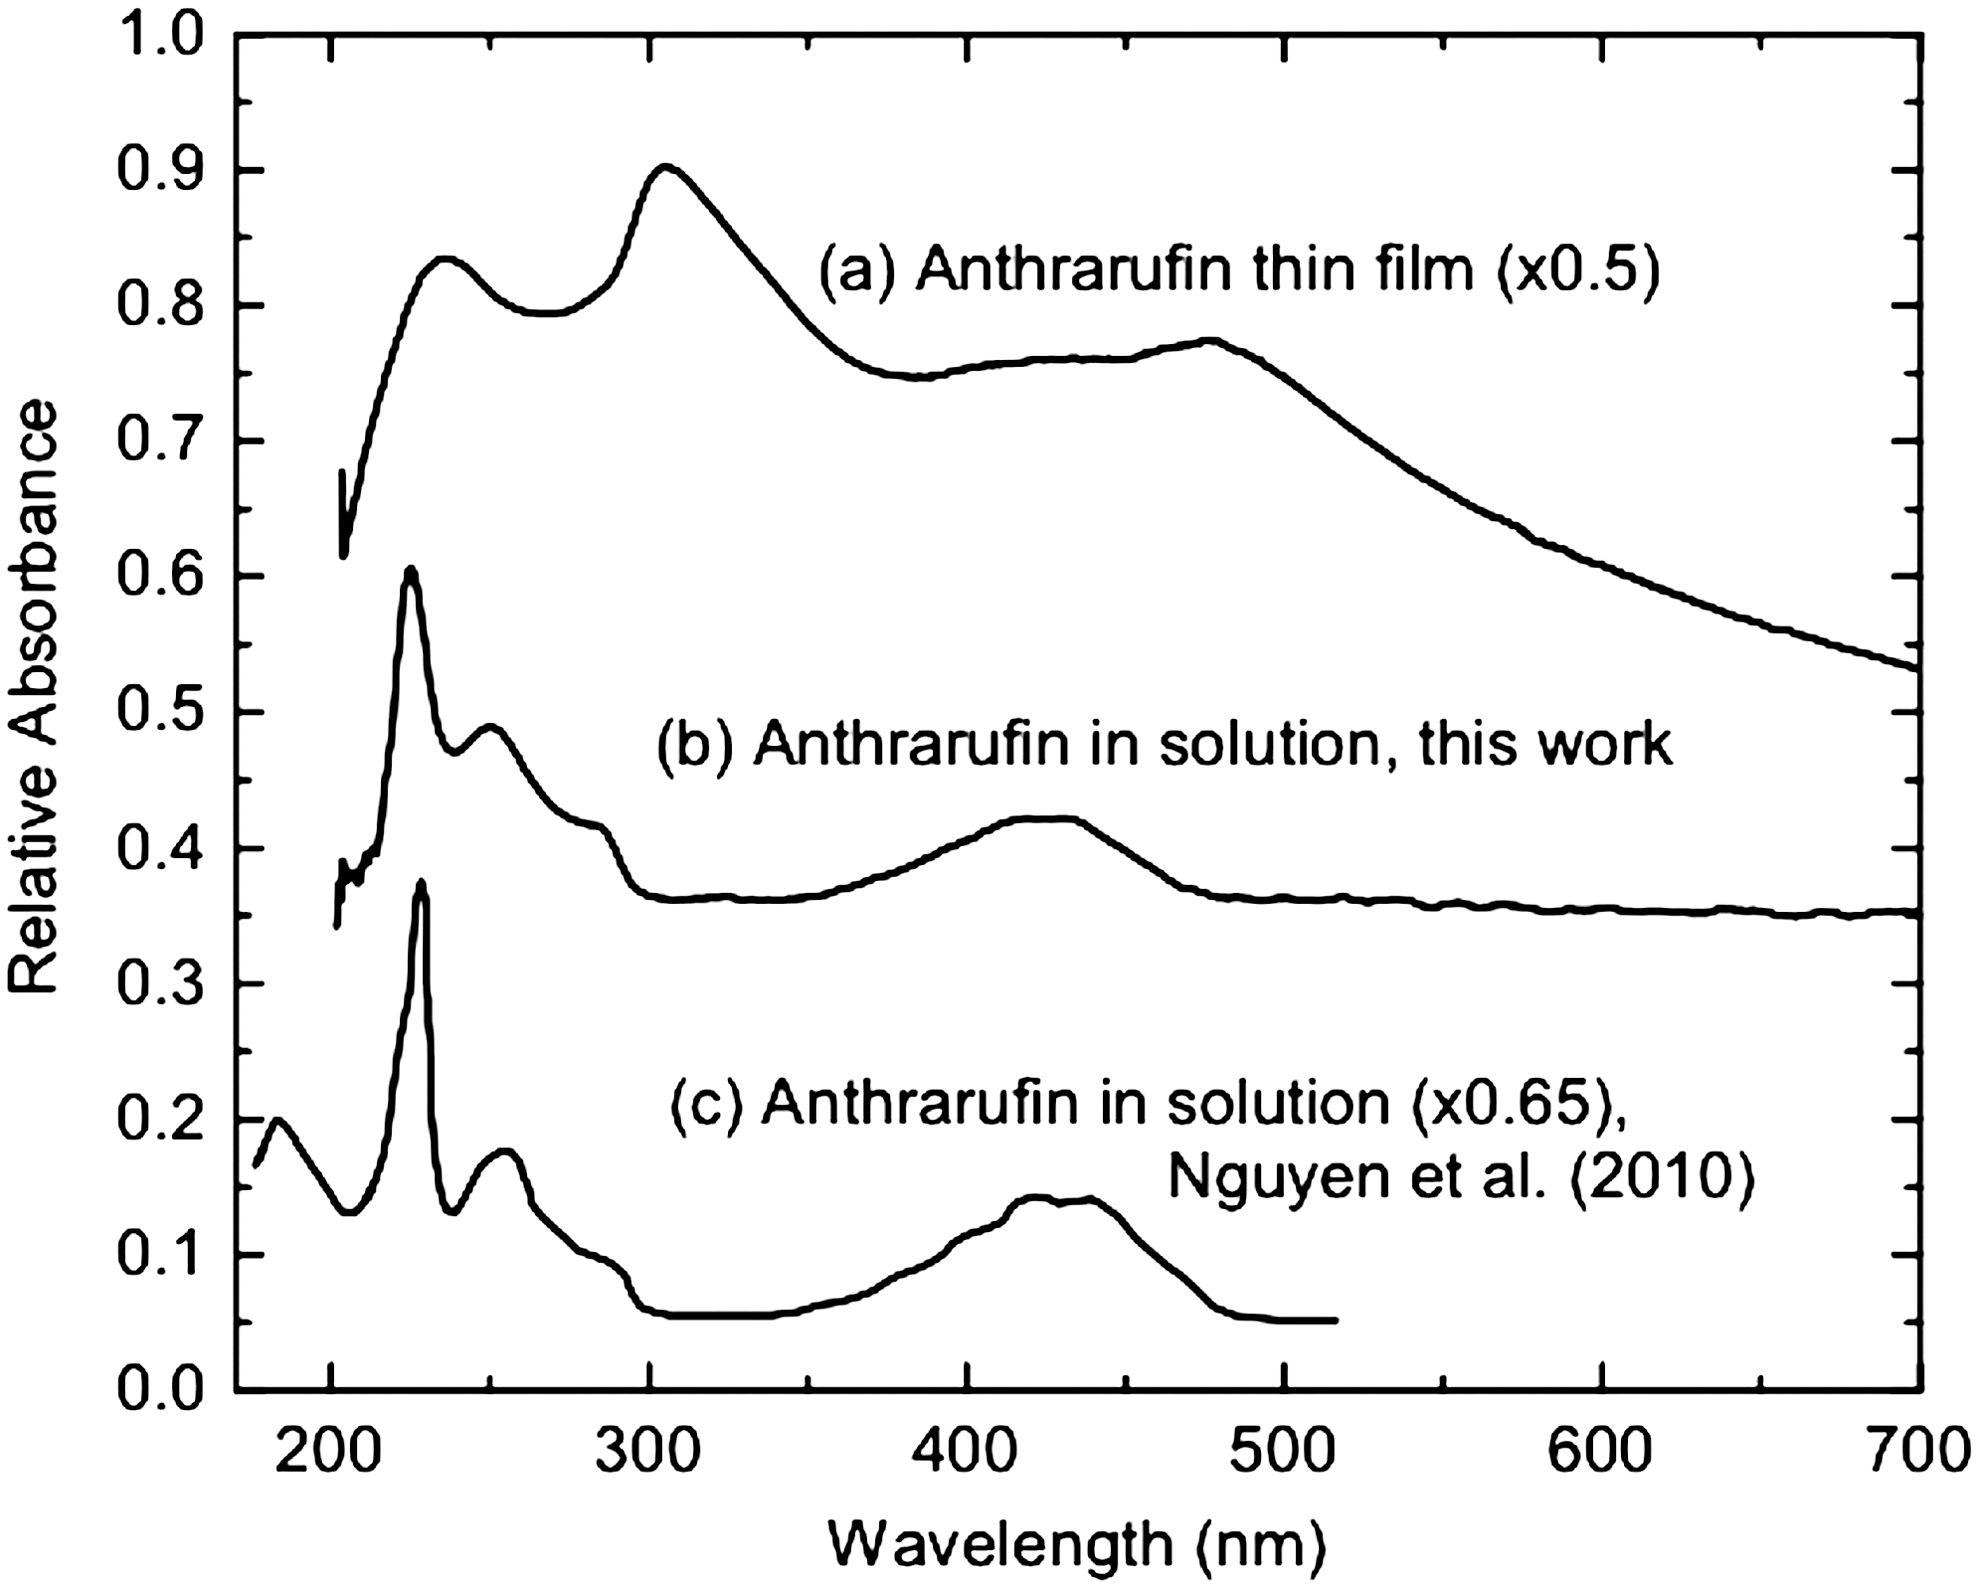
Figure 4 shows preflight and spaceflight thin-film UV-Vis absorbance spectra of anthrarufin, an oxidized form of anthraquinone, in all four microenvironments, while Fig. 5 shows a comparison of the thin-film and solution UV-Vis spectra produced by dissolving the film from one of the MgF2 windows in methanol. The anthrarufin thin-film spectrum shows a band at 298 nm and a broad feature extending from 400 to 490 nm centered around 442 nm. A shorter-wavelength feature also exists at 233 nm but is located near the wavelength detection limit for the flight data (Bramall et al., 2012).
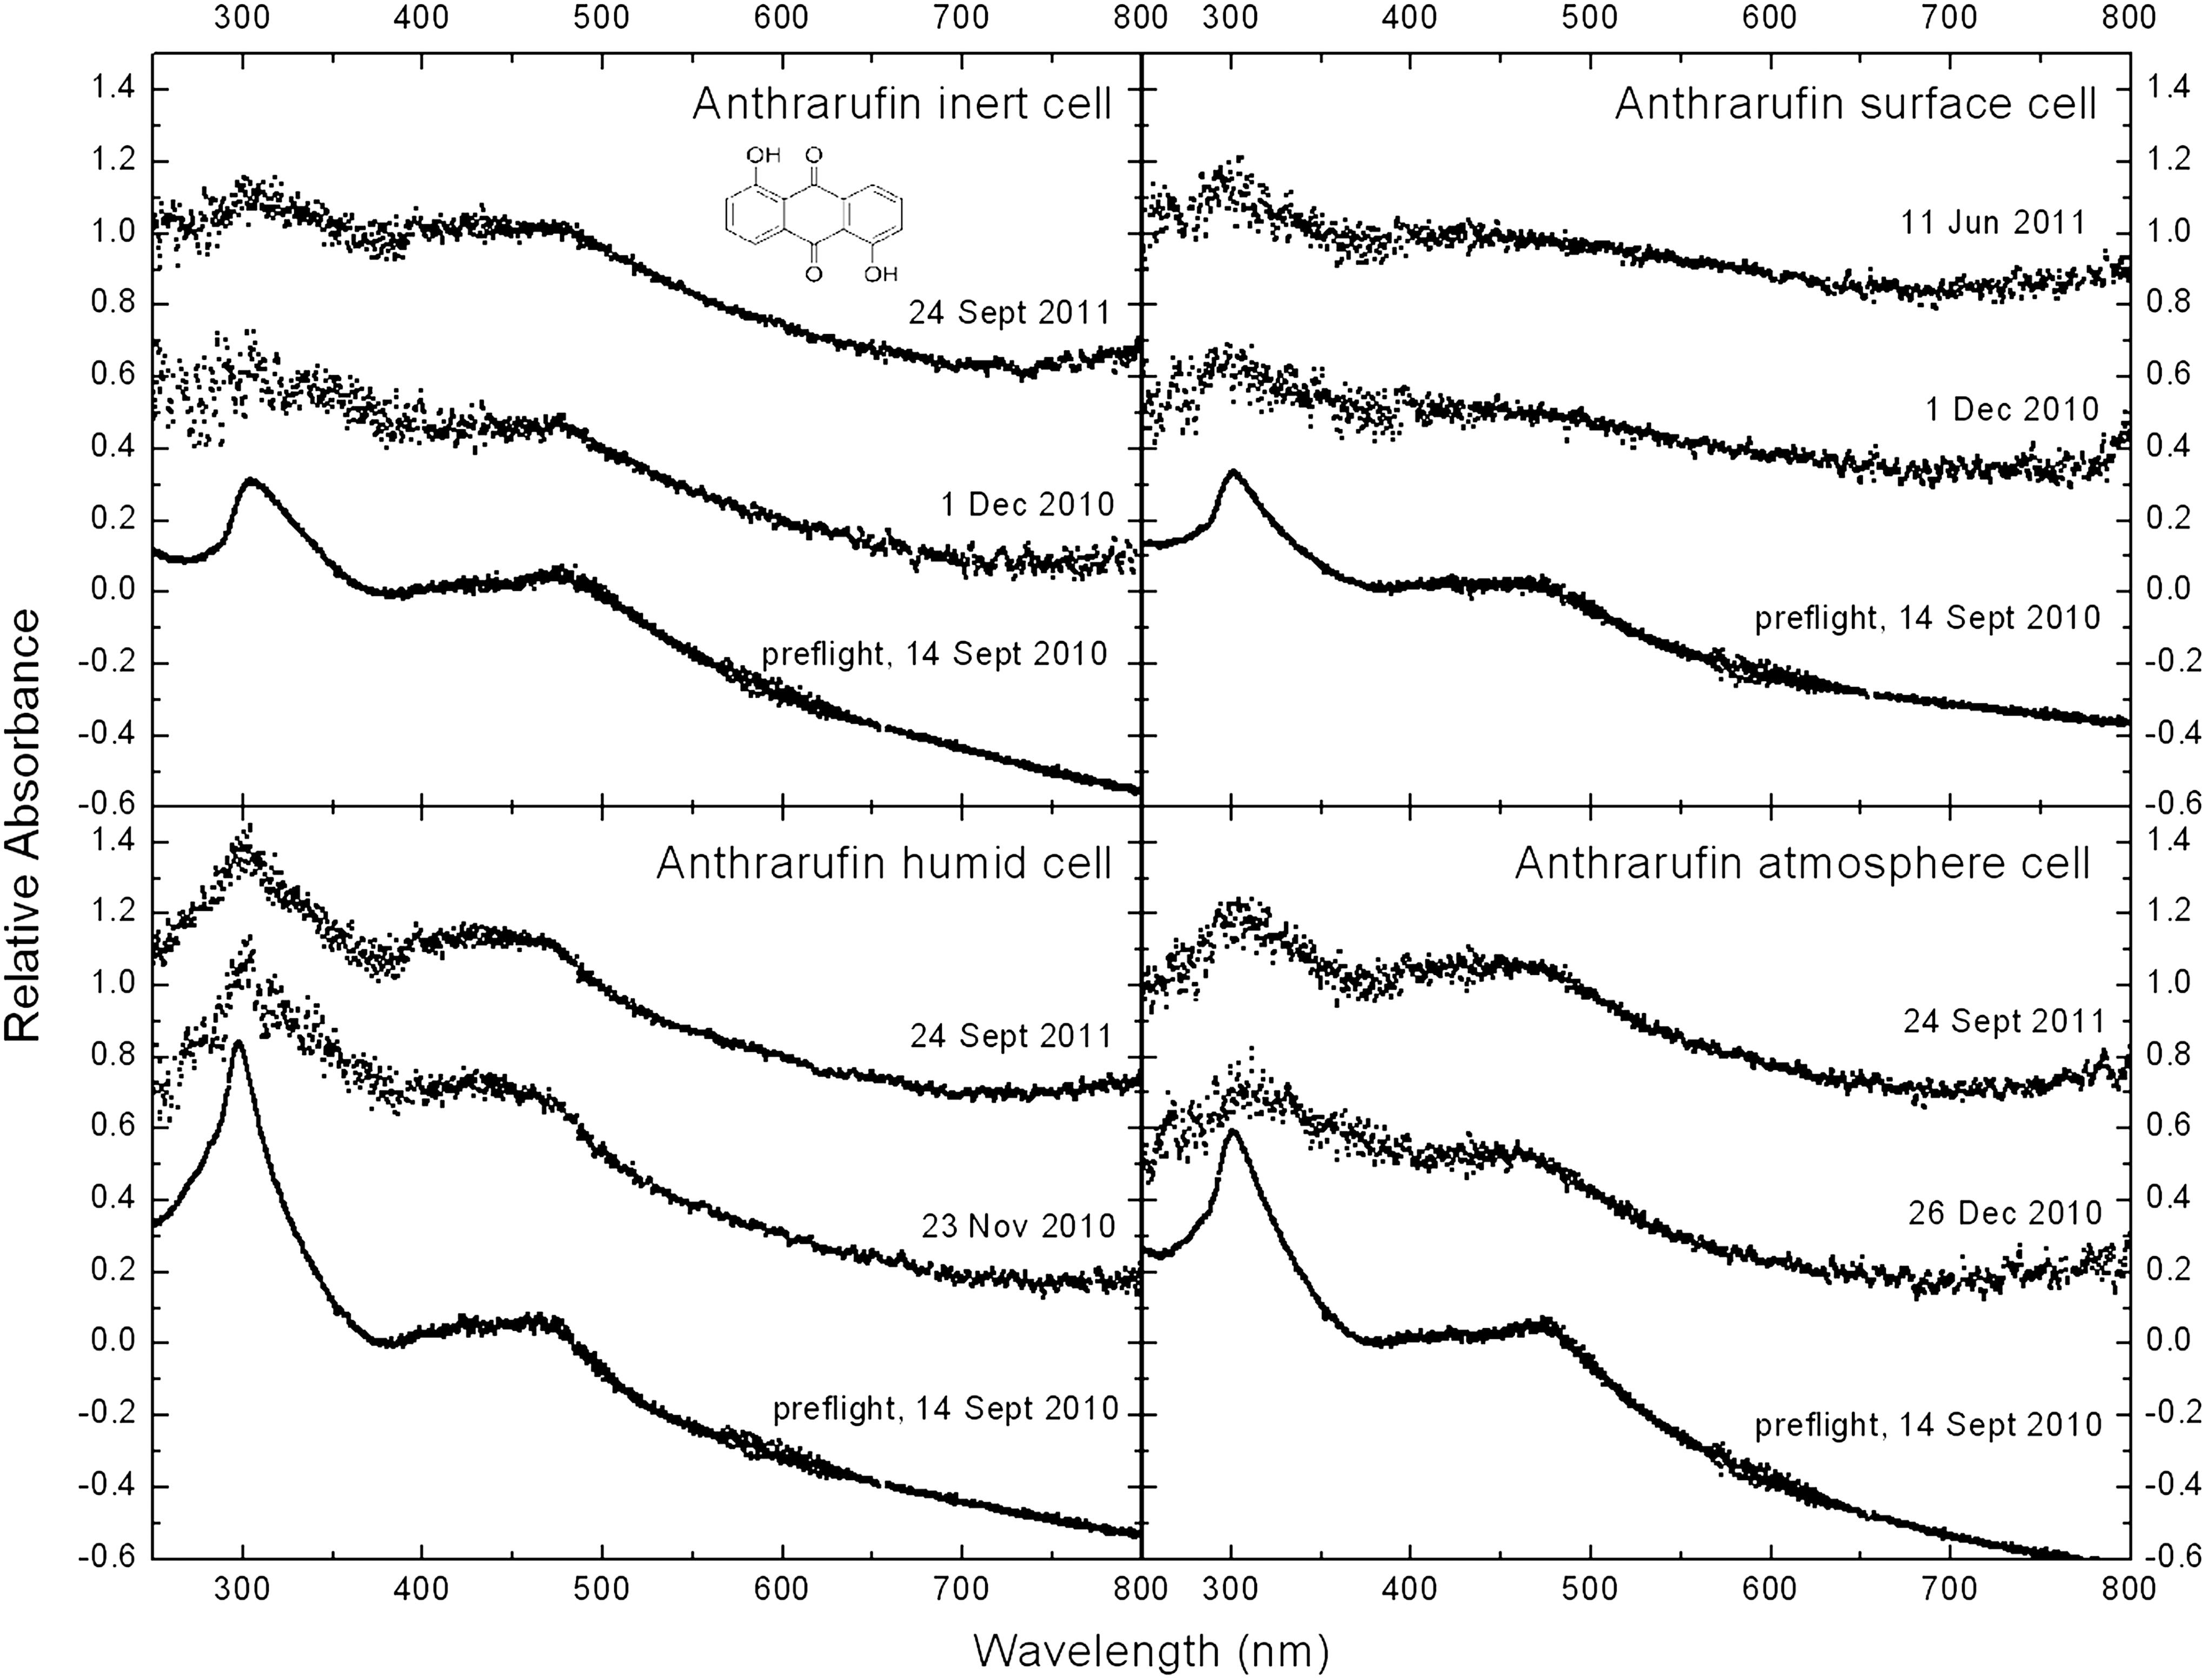
UV-Vis spectra of an anthrarufin (C14H18O4) thin film in four microenvironments (Inert, Surface, Humid, and Atmosphere). The spectra were measured with a laboratory spectrometer and light source (preflight) and in flight with the SEVO spectrometer and the Sun as a light source. Note the excellent agreement between the laboratory and in-flight measurements. The spectrometer's initial operational protocol and parameters were not optimized for the low solar flux below 260 nm (e.g., the solar flux at 260 nm is 30 times smaller than that at 400 nm), resulting in relatively poor signal-to-noise ratios below 260 nm. The additive scaling used in calculation of absorbance spectra has the effect of slightly decreasing the apparent absorbance.
Over the 9 months of exposure to irradiation in orbit represented by Fig. 4, no significant spectral changes, including the bands centered around 298 and 450 nm, were observed for the anthrarufin samples in any of the four microenvironments. Overall, the quality of the in-flight SEVO spectra compares well to those obtained with the laboratory spectrometer and light source with one minor difference (Fig. 4): the intensity of the absorption band at 298 nm measured in orbit is slightly lower than that measured in the laboratory. This lower response is likely the result of low solar flux below ∼300 nm (the Sun is used as the spectrometer's light source).
4.3. IVA spectral changes, kinetics, and products
As noted with the anthrarufin samples, the preflight and initial in-flight IVA spectra are in good agreement (See Figs. 2 and 4). The band around 288 nm in the IVA spectrum does exhibit a slight decrease in intensity for the orbital spectra when compared to the laboratory spectrum. This is similar to the decrease observed for the anthrarufin band at 298 nm, due to low solar flux below 300 nm.
The IVA spectra in the Inert, Surface, and Atmosphere cells show little, if any, spectral changes between the various time points over 10 months in orbit. There is, however, a significant decrease in the intensity of the main IVA absorption feature in the Humid cell. Figure 6 shows the change in the 350 nm band area of IVA as well as the number of moles of IVA in the sample versus solar exposure time and solar flux: a gradual decrease in the 350 nm band area is correlated with accumulated UV radiation dose. The number of moles of IVA present in the thin film was determined by dividing the integrated area of the 350 nm band by the absorptivity of 4.1×10⁸ nm mol−1. The thin-film absorptivity value was determined by comparing the integrated absorbance of IVA's thin-film 350 nm band with the band area of this feature in the solution-phase spectrum (generated by dissolving all the thin film), with the concentration of IVA in solution being determined by the solution molar absorptivity values provided by Schmidt (private communication 2009).
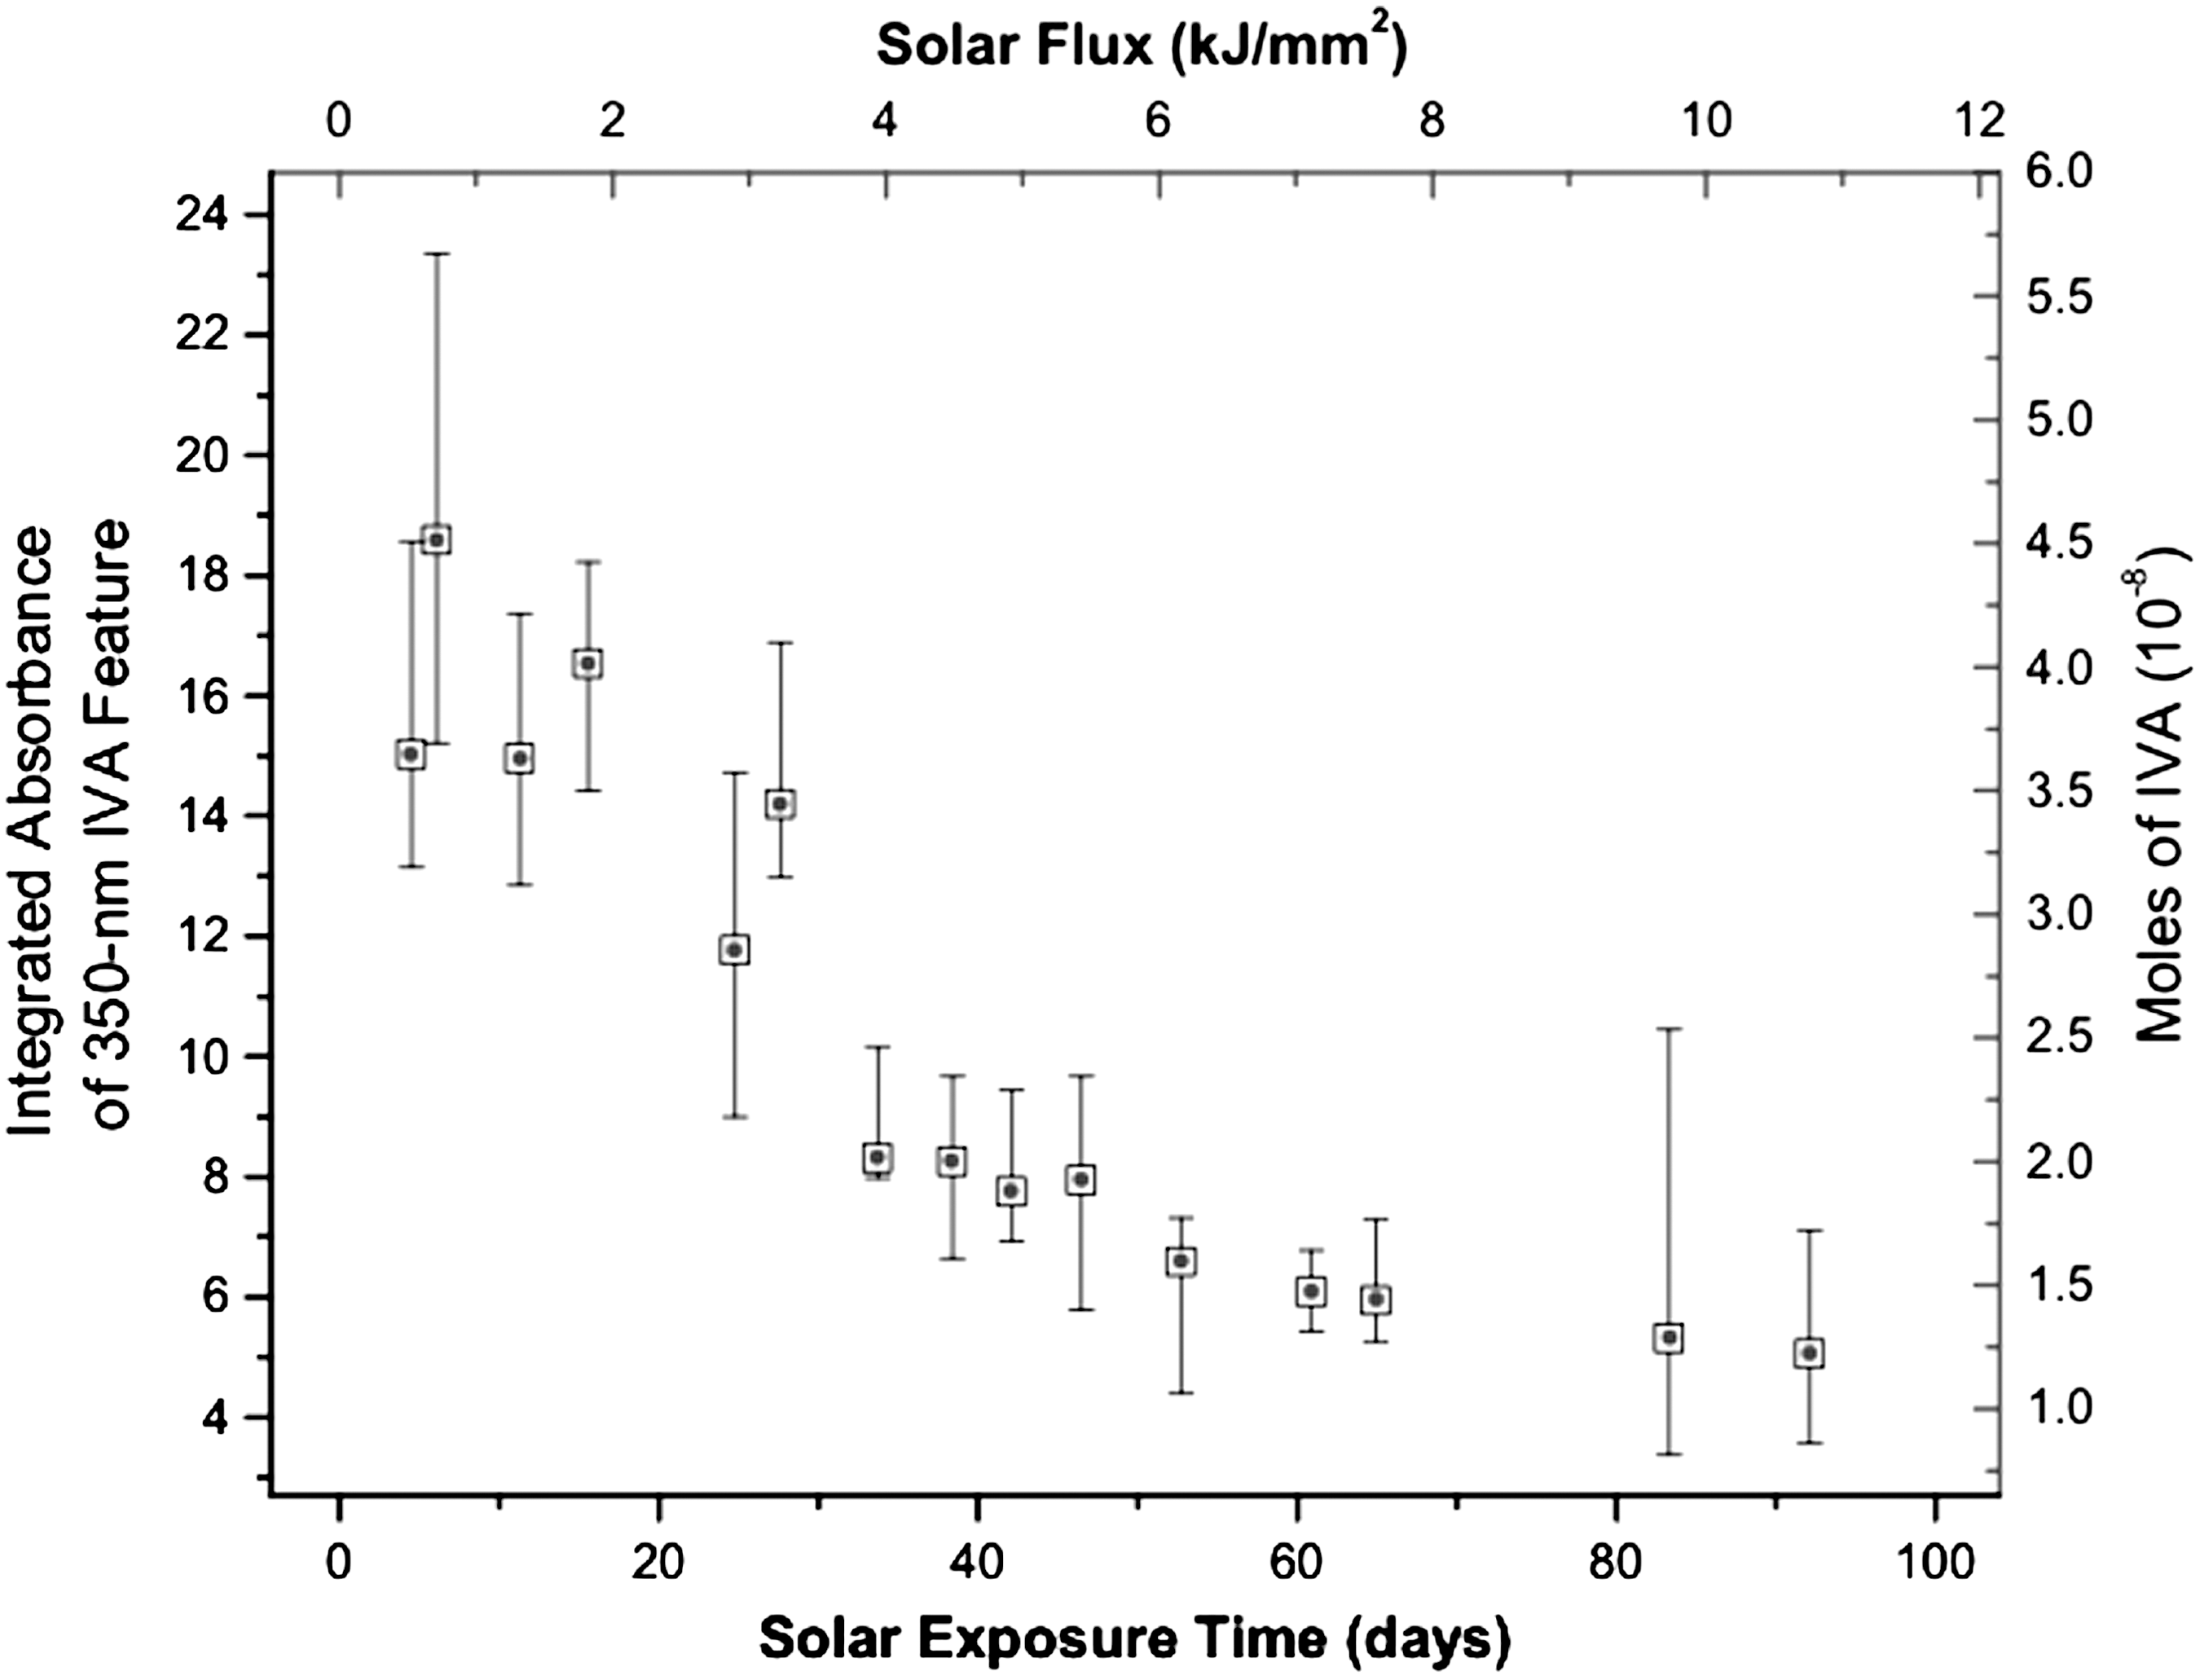
Integrated absorbance of IVA's 350 nm absorbance band and moles of IVA versus hours of solar exposure time and solar flux while in orbit. Note the decrease in the band area from the start of the orbital measurements with increasing UV exposure time.
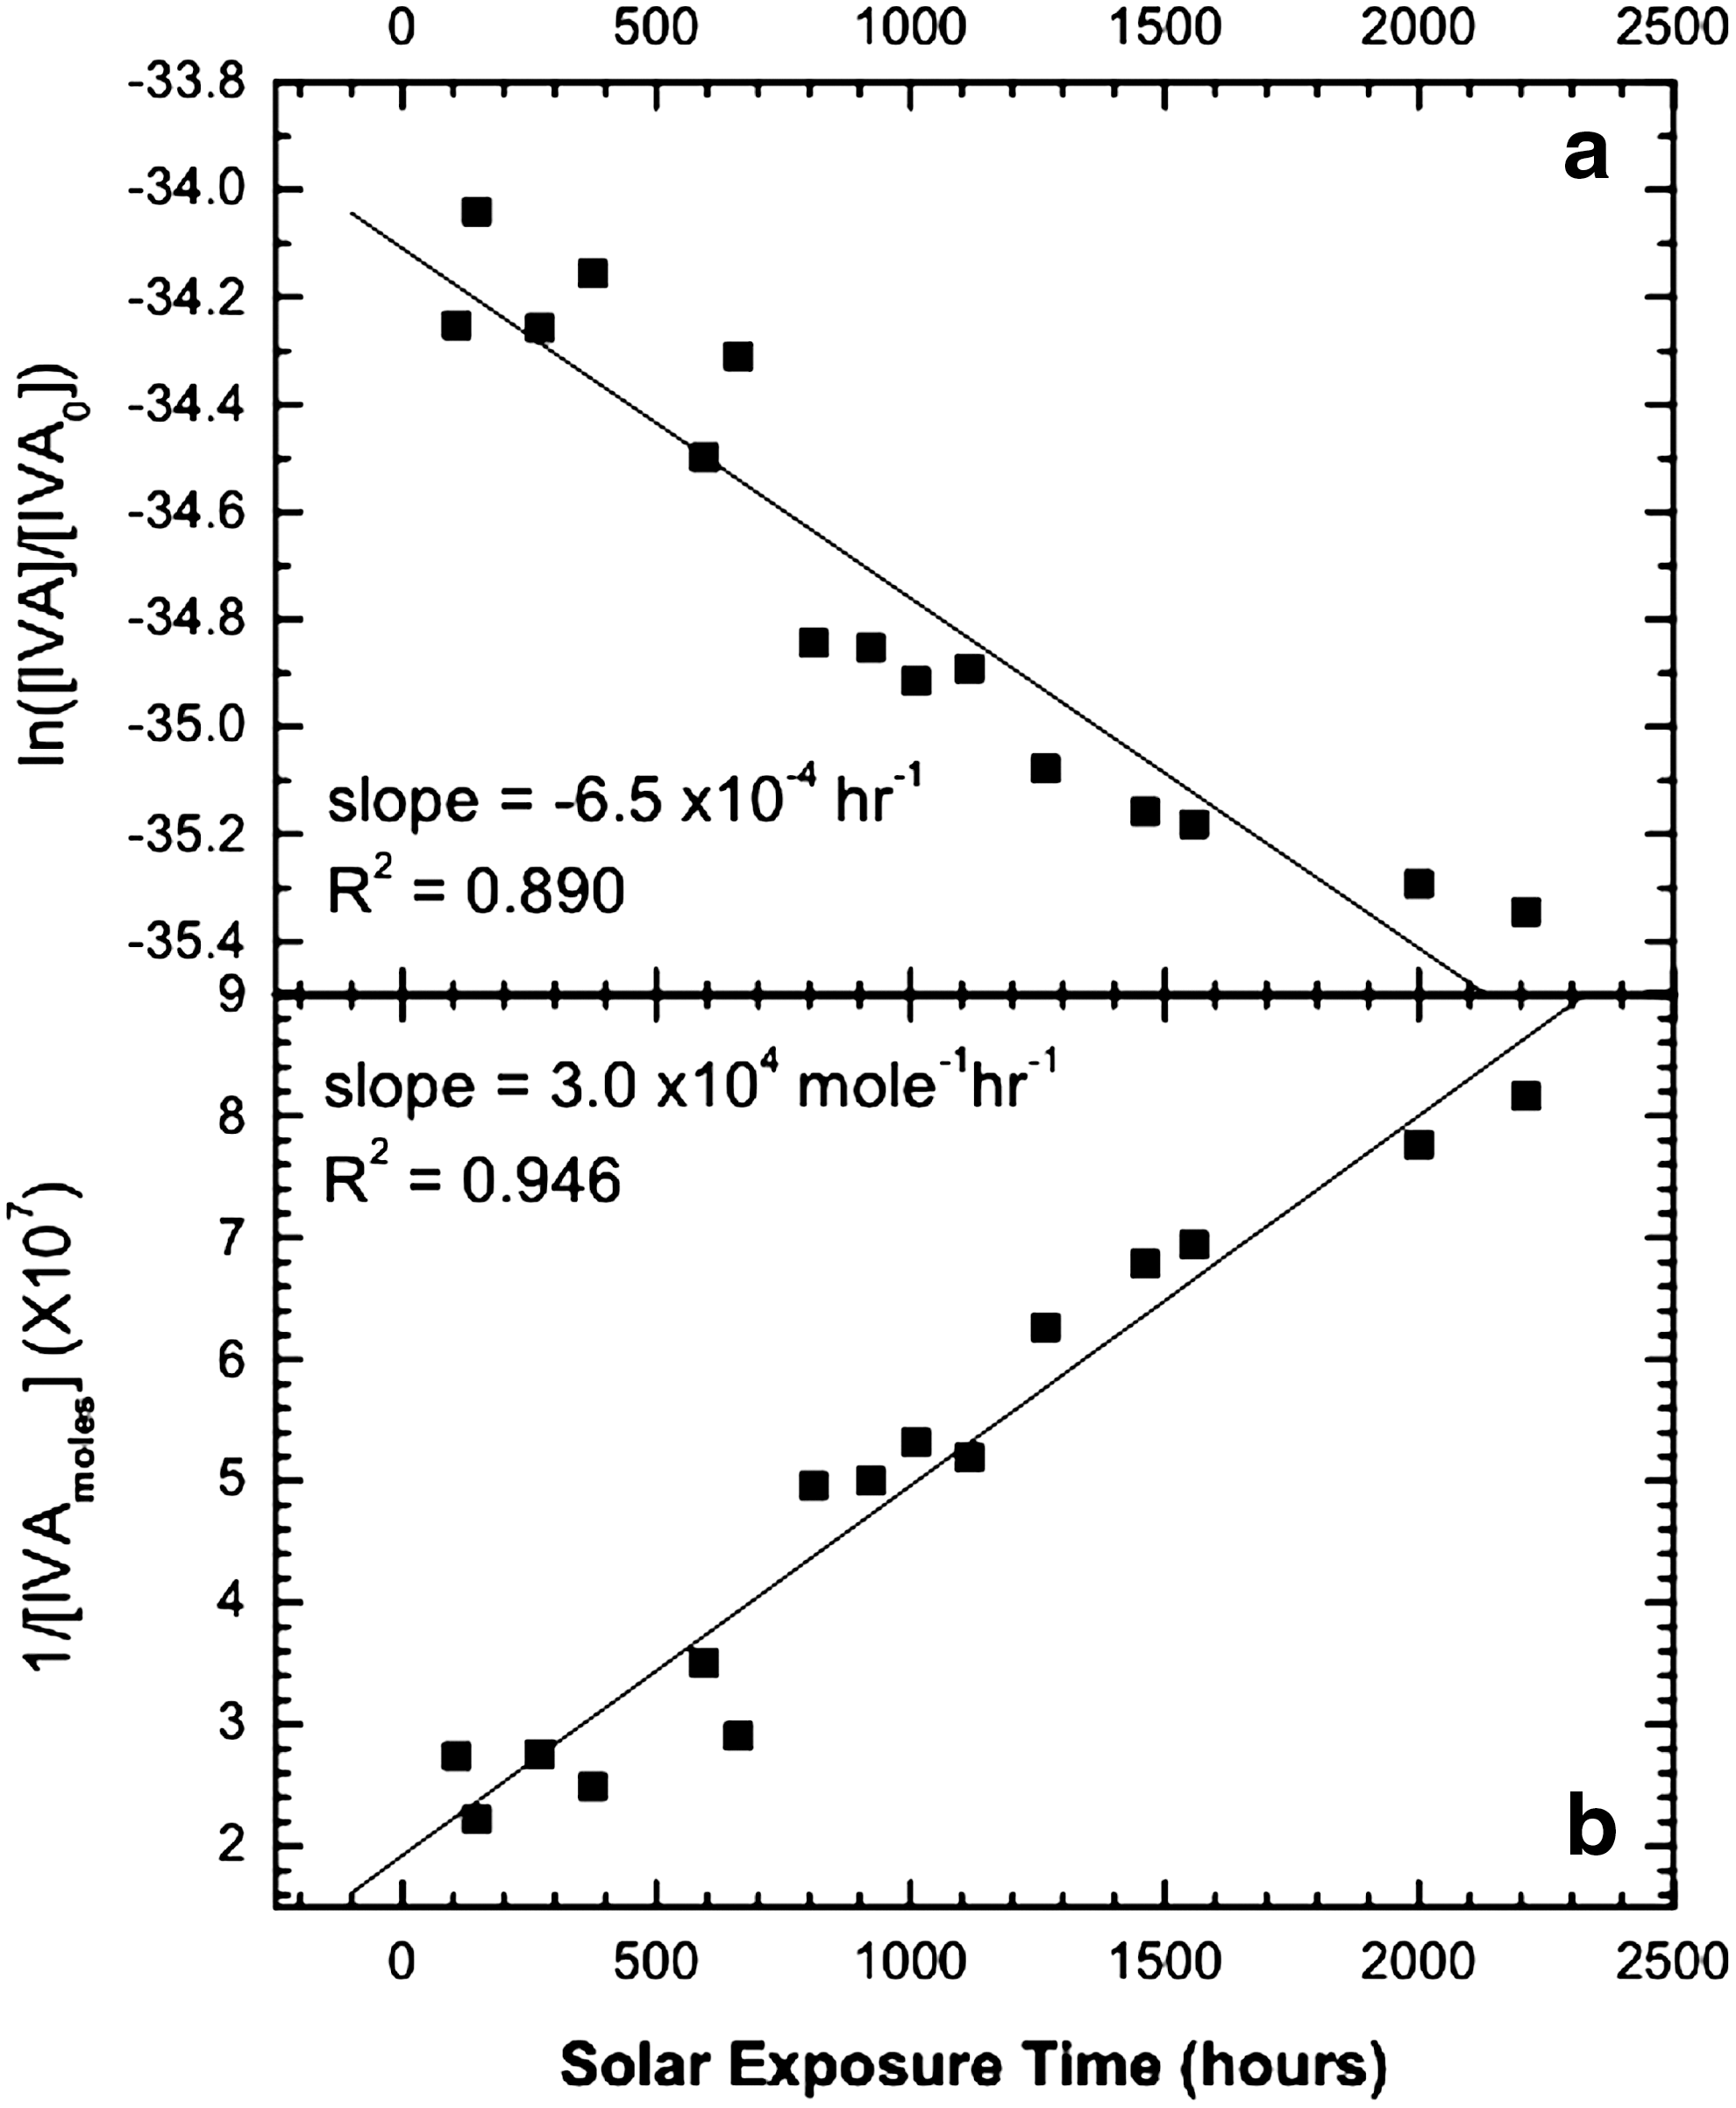
Figure 7 plots the normalized quantity of remaining IVA for both first-order and second-order reaction kinetics based on the solar exposure time for the films. Figure 7a, a plot of ln([IVA]/[IVA0]), should be linear if the reaction is first order with respect to IVA, with the slope of the line being the rate constant; the linear fit to the data yields a rate constant (slope) of −6.5 h−1 and an R 2 value of 0.890. However, the plot of 1/[IVA], expected for a second-order dependence on [IVA] and shown in Fig. 7b, is a slightly better fit to a straight line, with a slope of 3.0×10⁴ mol−1 h−1 and an R 2 value of 0.946. The order of the reaction here refers to the number of IVA molecules (regardless of whether they are in the ground or excited state or part of a transient complex involving another species) involved in the reactant side of the rate-limiting step of the degradation reaction.
We examined the time-dependent decrease in IVA's 350 nm band in the Humid microenvironment in a preliminary laboratory control study. Figure 8 shows the loss of IVA in a Humid cell due to UV exposure for 671 h by a combination of a Xe lamp (configured as an AM0 solar simulator) and an H2 discharge lamp (primarily to provide the Lyman-α irradiation characteristic of sunlight outside Earth's atmosphere). As Fig. 8 shows, there is a gradual, nonlinear increase in the loss of IVA versus hours of UV laboratory exposure.
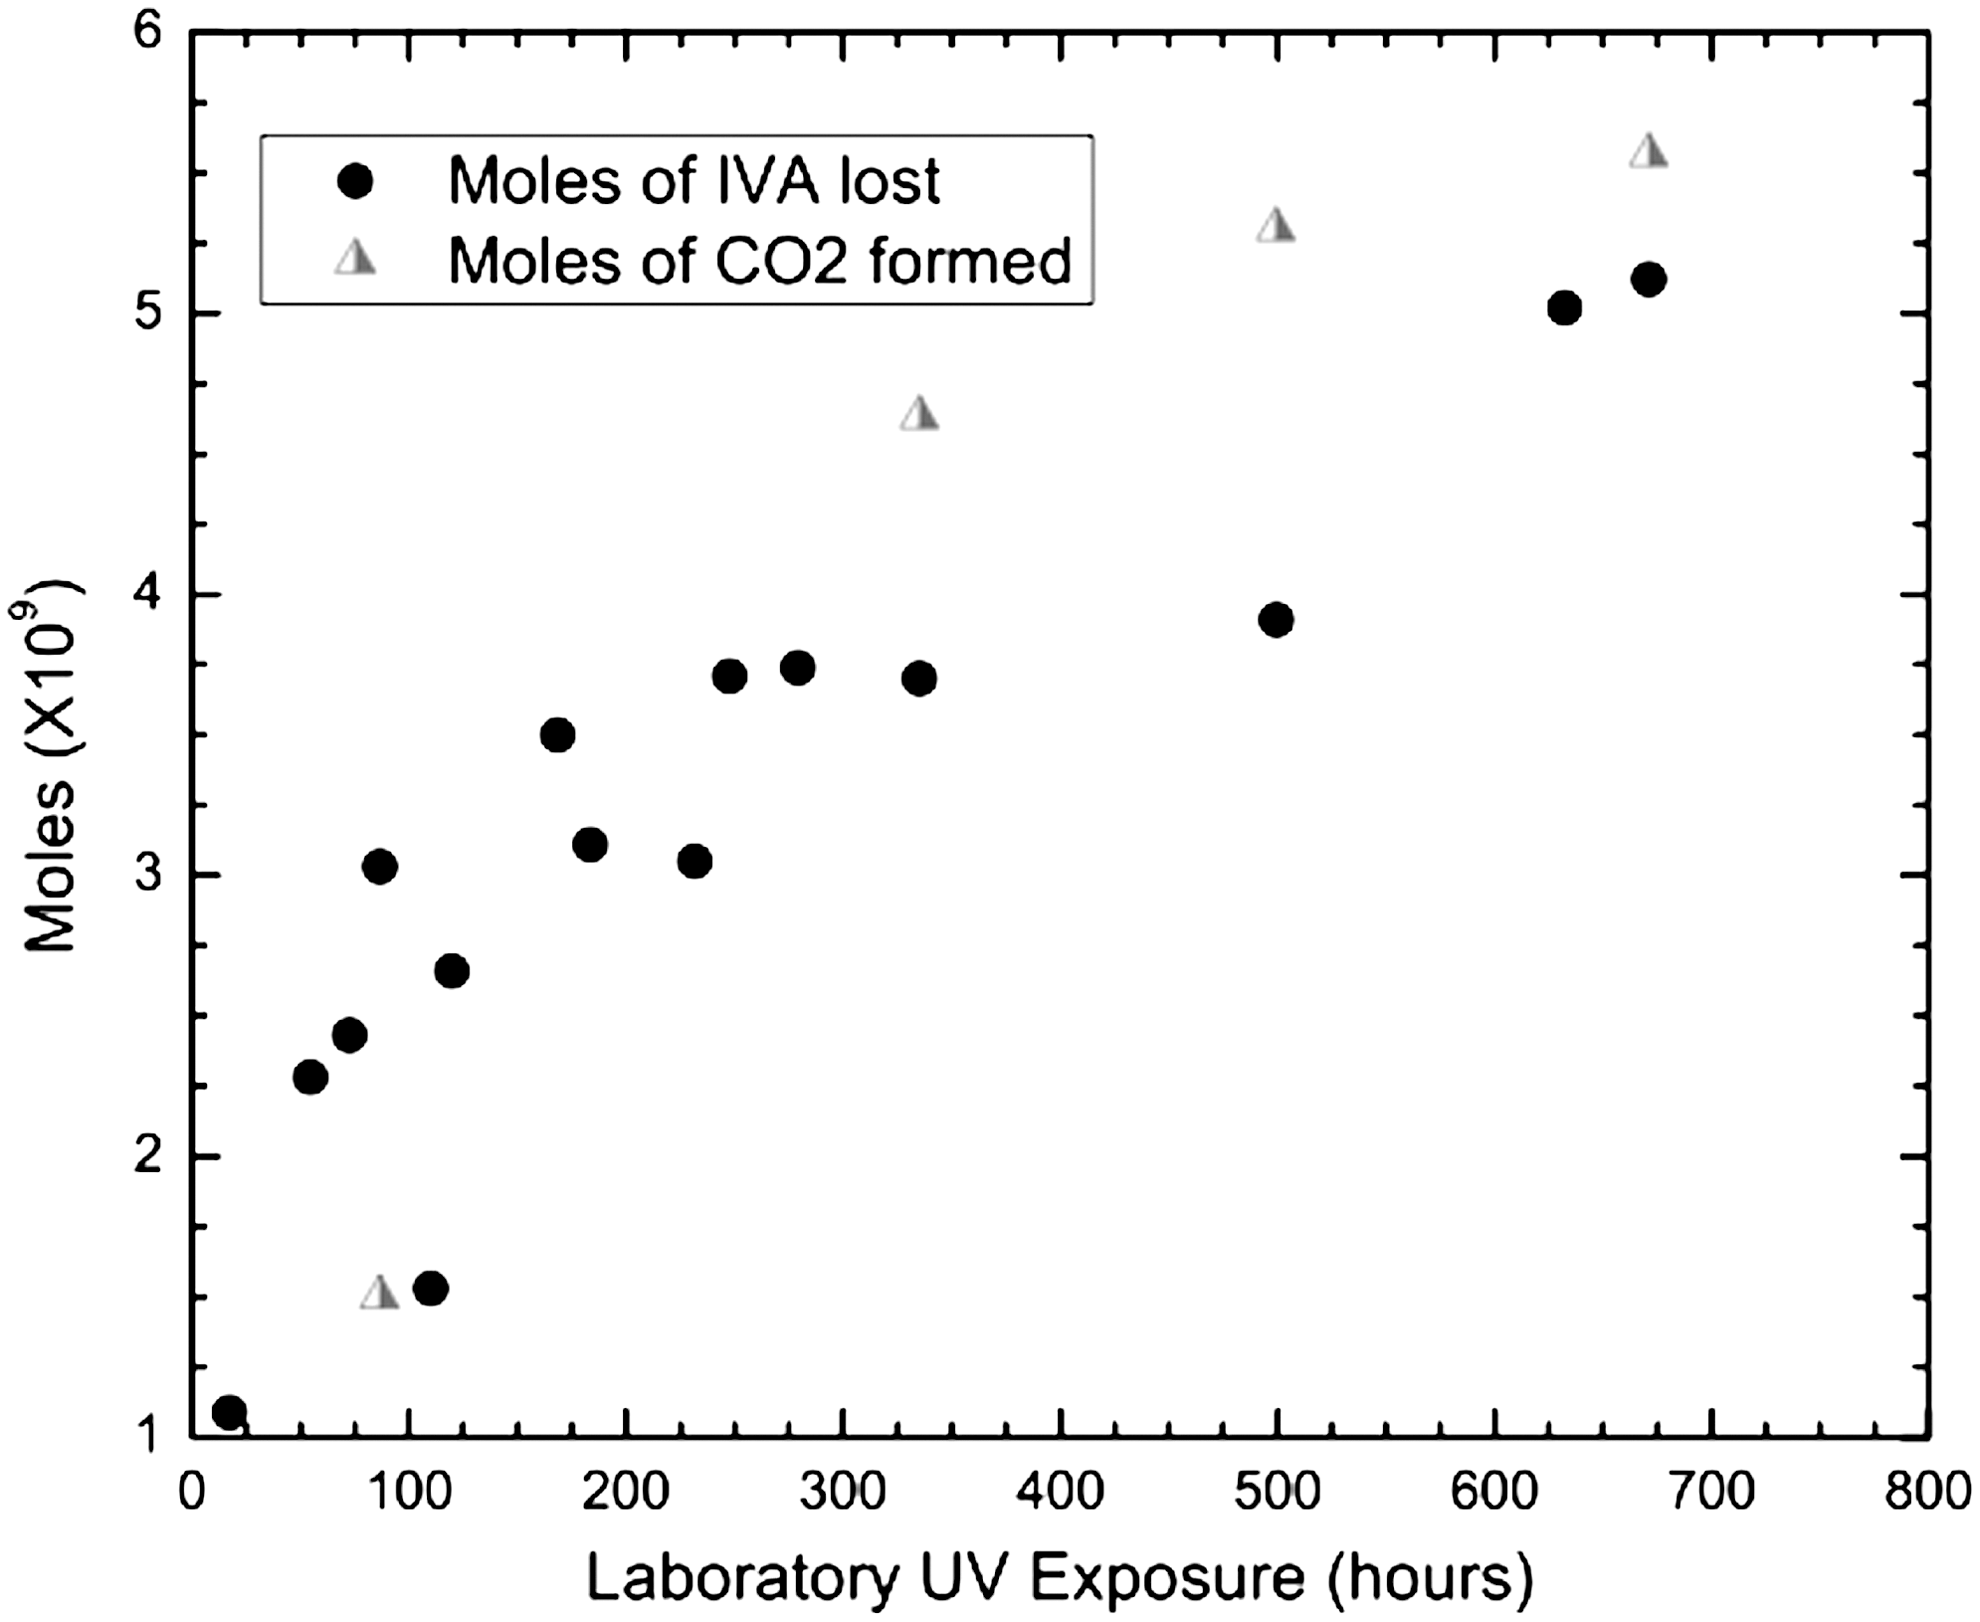
Plots of the moles of CO2 formed in comparison to the moles of IVA lost during laboratory UV-Vis photolysis of the IVA sample in a Humid cell. Note the nearly 1 to 1 correlation between the moles of IVA lost and the formation of CO2.
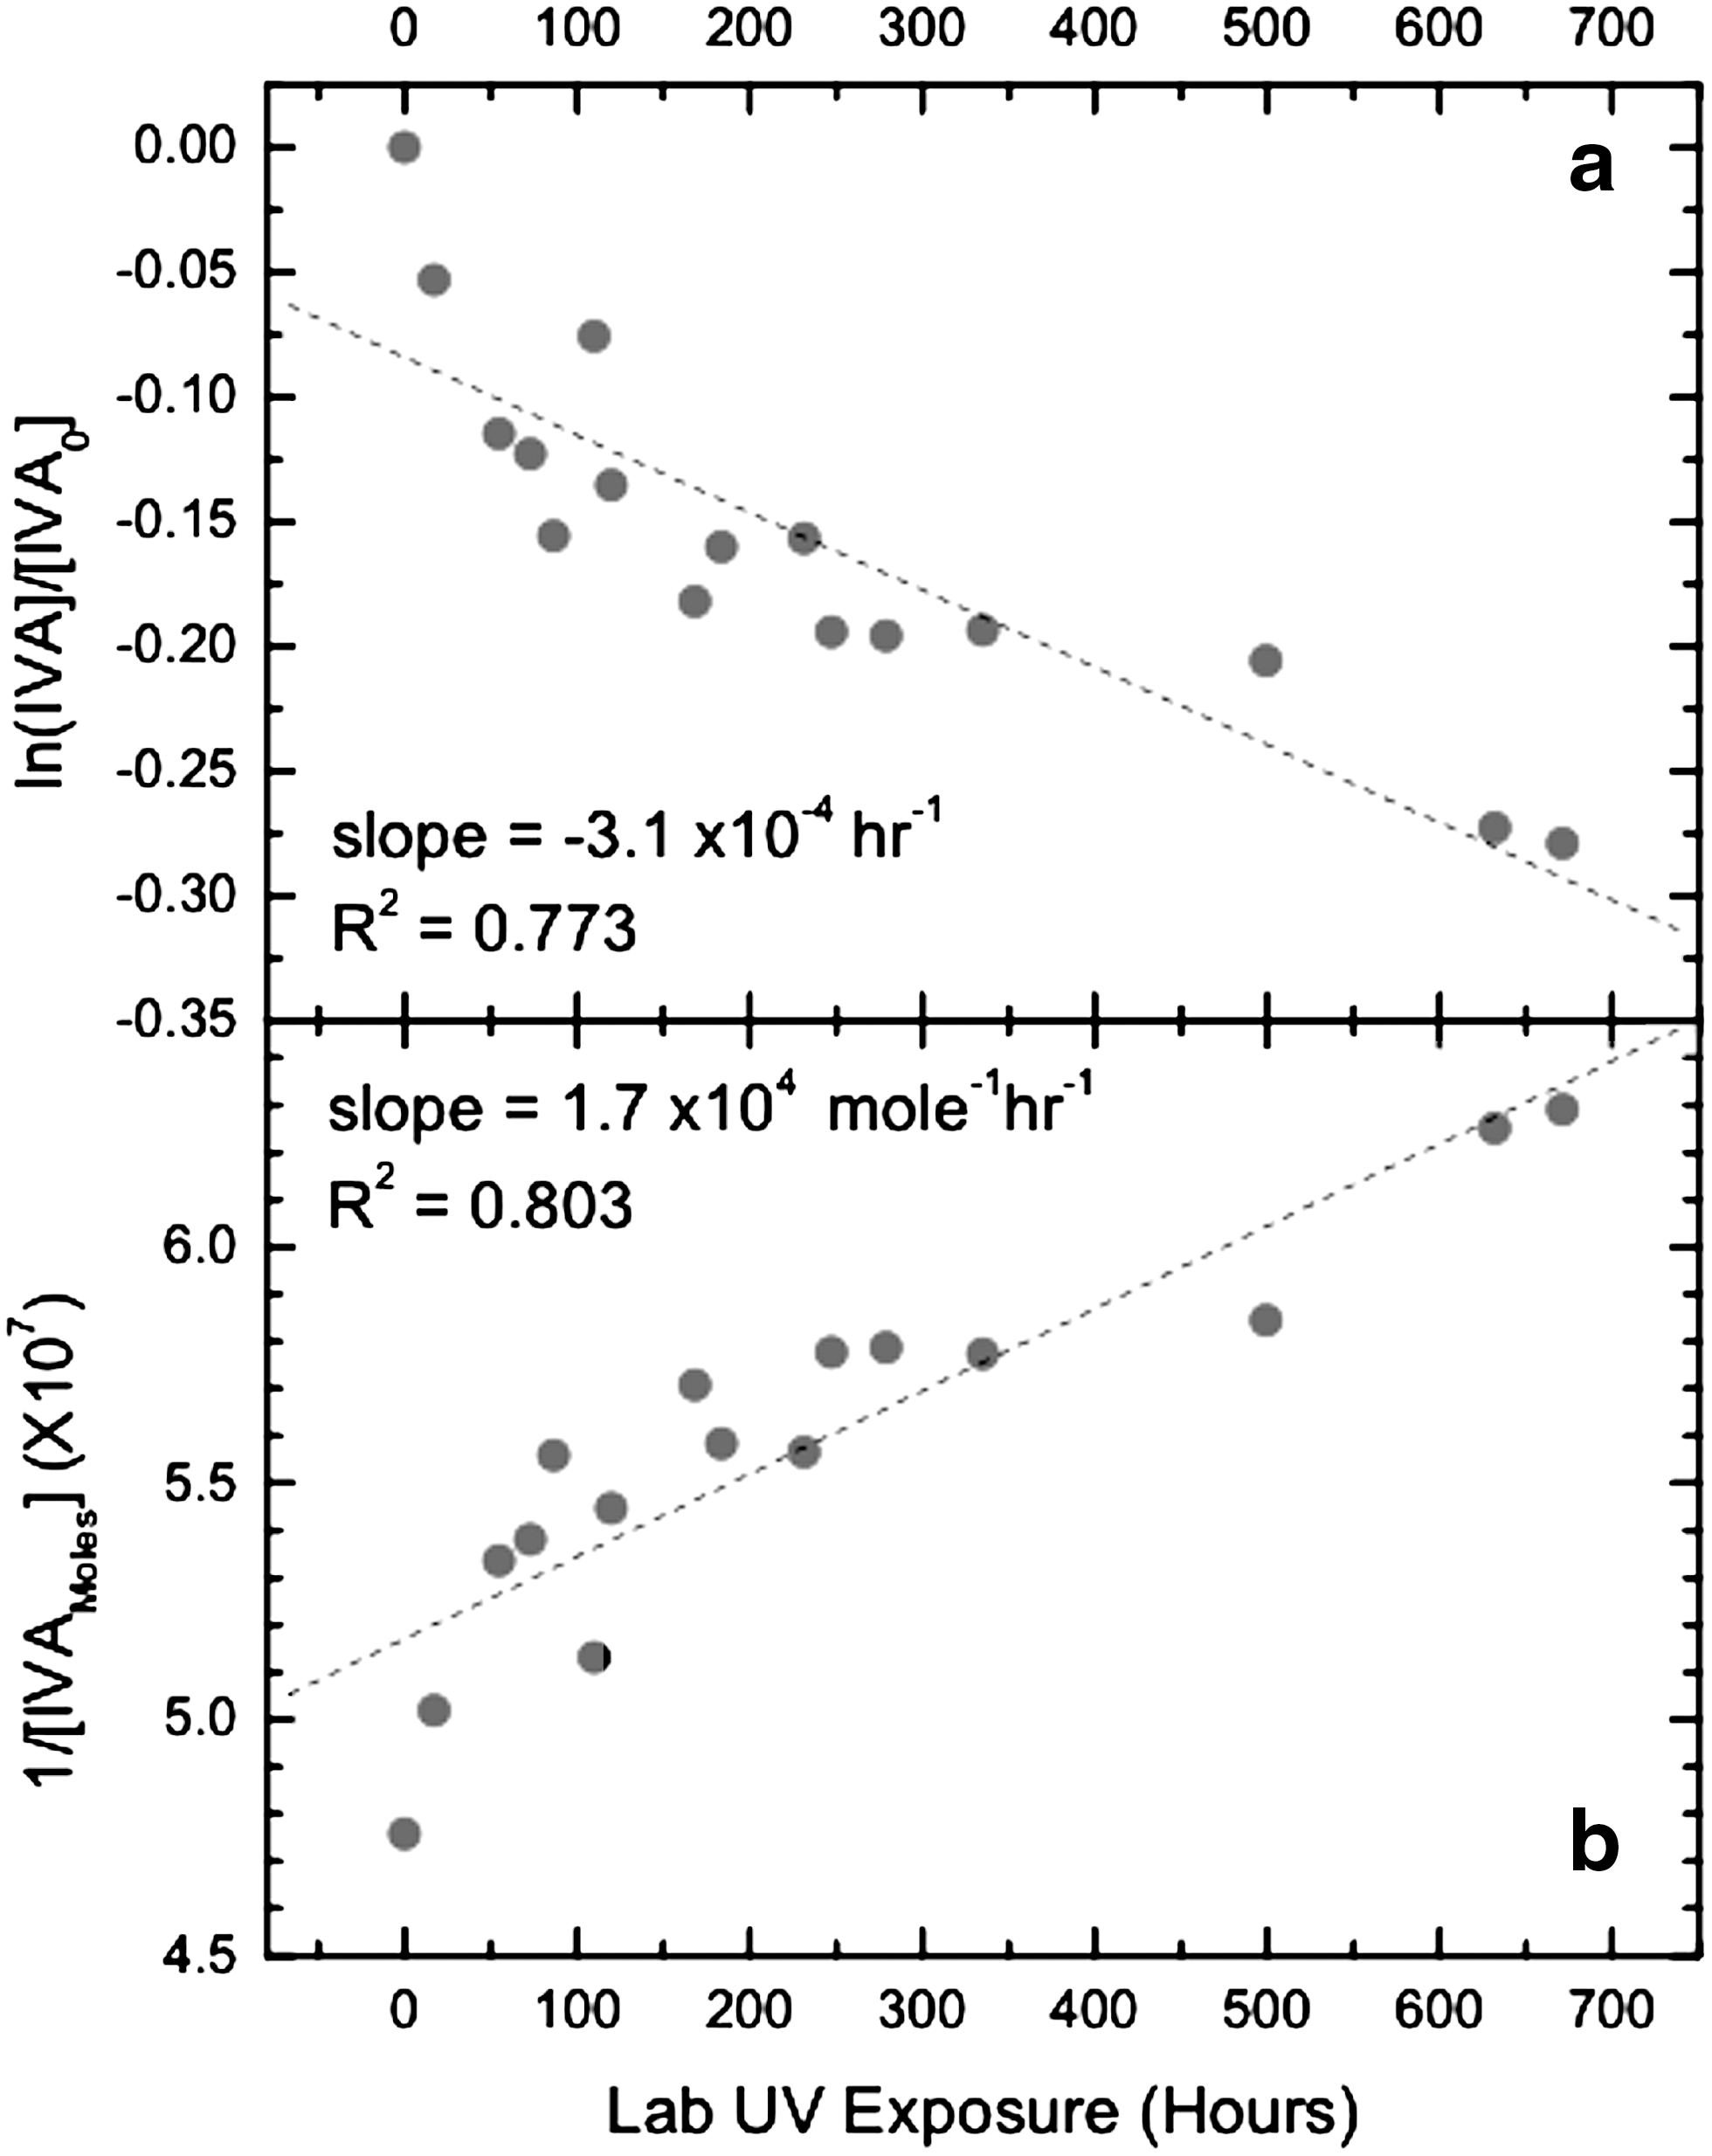
To better compare the laboratory results to the flight data, we constructed both first- and second-order rate plots for the laboratory data (see Fig. 9a and 9b). Although the laboratory sample was exposed for approximately one-third of the time of the flight sample, some trends can be observed. As with the IVA flight sample, both a first- and second-order rate plot fit the data reasonably well. The laboratory data yield a first-order rate constant of −3.1×10⁻⁴ h−1 with an R 2 value of 0.773, and a second-order rate constant of 1.7×10⁴ mol−1 h−1 with an R 2 value of 0.803. As with the flight data, the laboratory results exhibit a slightly better fit to the second-order plot. Likewise, the laboratory-derived rate constants are in agreement, within a factor of two, with the flight sample.
To better understand the oxidation of IVA in Humid cells during the photolysis process, IR spectra of the thin film inside the laboratory control Humid cell were collected. The sample cell includes one Al2O3 window, so IR observations are limited to energies greater than 1550 cm−1. While this prohibits measurement of most IVA vibrational modes, the Al2O3 window does not obscure the υ 3 vibrational mode of CO2, the final oxidation product of a PAH. Figure 8 also plots the amount of CO2, determined by using Fourier transform infrared measurements of the 2347 cm−1 band, formed inside the Humid control cell during laboratory photolysis, showing a clear increase with time.
After completion of laboratory photolysis, the sapphire (Al2O3) window was removed from the Humid cell, and the UV-exposed thin film was measured via Fourier transform infrared spectroscopy to identify newly formed chemical species. The IVA thin film was then dissolved in tetrachloroethylene and measured via UV-Vis spectroscopy. Neither technique revealed any new features in the resulting spectrum, a result that was not unexpected. The IVA thin film was measured on a MgF2 window, which limited the observable wavelength range to energies above ∼1300 cm−1. In neutral PAH and PAH-related species this should permit observation of the aromatic C–C and C–H in-plane vibrational modes. However, the oscillator strengths for these neutral modes are typically only tens of kilometers per mole (Weisman et al., 2005), making them too weak to be visible in these thin films. For comparison, the υ 3 vibrational mode of CO2, measured in the gas volume of the sample cells, is 457 km/mol (Yamada and Person, 1964). The exposed IVA thin-film sample, only 34 nm thick (see Table 1), exhibited the expected (weak) bands due to the remaining neutral IVA. Given that UV-Vis absorbance decreased by only ∼25% in the laboratory studies, the concentrations of aromatic oxidation products with similar absorptivities would probably be too low for detection by our measurements; experiments are in progress to photolyze a larger fraction of the film to improve the chances of detecting a product.
5. Discussion
5.1. IVA thin-film spectra, degradation mechanisms, kinetics, and products
While band positions of the IVA thin films, Fig. 3, agree approximately with the solution spectra, the relative intensities vary significantly between thin film and solution. Such intensity behavior is not unusual and is similar to that observed by Kahan and Donaldson (2007). Ultrathin solid films can exhibit short-range structure in molecular packing that results in solid-state effects, including potential polarization/symmetry effects (Nguyen et al., 2010). Such effects can lead to band quenching, which induces differences in relative band intensities relative to solution-phase spectra, as observed in our thin-film measurements. Solid-state IVA is a semiconductor (Inokuchi, 1951), so the extended aromatic structure contributes to solid-state electrical conductivity; its band structure will not necessarily produce an absorbance spectrum identical to that of the molecular form. While uncharged aromatic molecules exhibit strong absorption bands in the UV and visible range, their cations and anions display specific transitions in the visible and near infrared. UV-visible-NIR spectroscopy from 200 to 1000 nm therefore provides unambiguous information about the electronic and molecular structure of these organic compounds (e.g., Salama, 1999; Mattioda et al., 2005, 2008).
As mentioned in the Results section, there was no significant decrease in the 350 nm band area for the IVA thin films in any of the Atmosphere, Surface, or Inert cells as a function of solar exposure time. IVA's electrical conductivity means it can be expected to have significantly shorter excited-state lifetimes than molecular IVA in solution or other matrices (Maliakal et al., 2004). The SEVO spaceflight results suggest that the thin-film IVA excited-state lifetime is sufficiently short that no appreciable photodegradation occurs in the presence of atmospheres of Ar or of 1000 Pa CO2+1 Pa O2, nor is this lack of reactivity altered by direct contact with a thin layer of SiO2.
In the presence of appreciable (∼67 Pa) water vapor, however, the IVA degrades, albeit slowly: much of the original IVA remains in the flight Humid sample (Fig. 4) even after receiving ∼1 MJ/cm2 of full-spectrum solar irradiation. The measurable degradation that did occur suggests several possibilities: (1) excited-state OH• could be the species responsible for initiating the degradation of thin-film IVA; (2) though short, the excited-state lifetime of solid-state IVA could be adequate for it to react with OH• or adsorbed H2O to form a product that can be further photolyzed (with no similarly rapid reaction available for CO2, trace O2, or their photolysis products); (3) the first step of degradation could occur only when the excited states of both IVA and OH• react directly with one another.
It is unclear from our analysis whether the oxidation of IVA in a humid environment (see Fig. 7) at the partial H2O pressures studied (∼67 Pa at 25°C) proceeds via a first- or second-order process with regard to IVA. This uncertainty may be a limitation of the measurement accuracy of our experiment, although the scatter of the data in Fig. 7 is not excessive, or it may simply be due to the complexity of the photochemically induced degradation process. The fact that the data fit both first- and second-order rate laws reasonably well suggests that there simply is not a large difference to be expected in the rate of loss of IVA between the two mechanisms for the particular set of conditions in our reaction cells. While most literature concerning the degradation of PAHs in water concludes the mechanism is first order (Miller and Olejnik 2001; Kahan and Donaldson 2007), Kahan and Donaldson (2007) also noted a reasonable fit to a second-order rate equation.
Relevant studies by Maliakal et al. (2004) and Miller and Olejnik (2001) described various mechanistic pathways for both solution-phase and thin-film PAH degradation. Although the mechanisms vary depending on the species present (e.g., O2, H2O2), they concluded that an excited PAH molecule is necessary for the reaction to proceed, which for our results would rule out OH• as the sole excited-state species involved in photodegradation of IVA. Whatever the mechanism, water vapor is the differentiator that enables solar photodegradation of IVA in thin-film form. Thus, the physicochemical state of the PAH (isolated in a water ice or an inert matrix, clustered on a mineral surface, or deposited on a planetary surface) and its local microenvironment (gases or condensates) can have significant impact on reaction mechanisms, rates, and overall photostability.
As detailed in the Results section, the gas-phase photolysis products of the oxidation of IVA in Humid cells were monitored along with the thin films via IR spectroscopy in the laboratory experiment (Fig. 8), which revealed the formation of measurable CO2 quantities. PAHs are typically converted to quinones and other intermediates before being completely oxidized to CO2. Pan et al. (2008) determined that the energy needed to ionize and remove a single CO2 group from small quinones such as 9,10-anthraquinone is 9–11 eV (138–113 nm), and in excess of 12 eV (<103 nm) is needed to remove a second CO2 group. These dissociation energies are expected to decrease with increasing PAH/quinone size. The approximate 1:1 molar correlation of CO2 increase and IVA loss (see Fig. 8) is consistent with the CO2 inside the Humid cell resulting from the destruction of IVA and with a single CO2 group being removed from the IVA carbon skeleton in the course of its spectroscopically measured loss. Based on previous laboratory studies (Bernstein et al., 2002; Ashbourn et al., 2007; Kahan and Donaldson, 2007), it is likely that IVA is oxidized prior to the loss of a CO2 group.
5.2. Anthrarufin spectra
Generally, the anthrarufin band positions and relative intensities for the thin-film form, Fig. 4, agree with the synchrotron radiation linear dichroism study by Nguyen et al. (2010), which reports bands around 227, 256–290, and 415–454 nm for solution-phase spectra of anthrarufin and microcrystalline anthrarufin deposited onto stretched polyethylene. The main difference between spectra reported by Nguyen and our thin-film anthrarufin spectrum is related to the band centered at approximately 300 nm. As discussed above for IVA, polarization effects can lead to band quenching, which induces differences in relative band intensities relative to solution-phase spectra. An increased red shift of bands in the UV-Vis range is observed in many solid-state spectra compared to matrix and solution data (Lim et al., 2004; Maliakal et al., 2004). The spectroscopic studies by Nguyen et al. (2010) reveal that the band system between 250 and 290 nm varies with polarization. As for IVA, the band shift and band suppression in the SEVO thin-film anthrarufin samples were confirmed by dissolving one of the thin films in methanol (Fig. 5), the result being a spectrum in which all the UV-Vis bands appear in the same positions reported by Nguyen et al. (2010).
5.3. Comparison of flight results: anthrarufin reactivity and comparison with IVA
Neither anthrarufin nor IVA shows appreciable photodegradation in the Inert, Surface, or Atmosphere microenvironment in the first 10 months of exposure. There are, however, notable differences in the reactions of these two thin-film materials in the Humid cell microenvironment. As previously mentioned, when PAHs are exposed to UV irradiation in either aqueous solutions or water-ice matrices, they are oxidized, forming quinones, ketones, alcohols, and hydrogenated PAHs; these products can, depending on temperature, concentrations, light intensity/spectral composition, and other reaction conditions, suffer further photolytic decomposition. Beltrán et al. (1999), as well as Kahan and Donaldson (2007), discussed degradation rates for PAH and PAH-type compounds in a variety of environments. While various mechanisms have been proposed to account for the degradation of PAHs in aqueous environments, most authors propose ionization or excitation of the PAH as an initial step (Kahan and Donaldson, 2007), making the ionization energy of the compounds a relevant parameter.
The ionization energy of gas-phase anthrarufin is 8.53 eV (∼145 nm) (Potapov and Sorokin, 1971), while gas-phase IVA's ionization energy is significantly lower, 6.42 eV (193 nm) (Clar and Schmidt, 1978). The thin Al2O3 coating applied to the inner surface of the MgF2 windows of the Humid cells has a measured UV transmission range that cuts off wavelengths shorter than ∼170 nm (Bramall et al., 2012). While wavelengths longer than 170 nm are sufficient to ionize gas-phase IVA, H2O vapor, and adsorbed H2O, the energies of these transmitted photons are inadequate to ionize anthrarufin. Combined with the comparatively low solar flux at short wavelengths (relative to the visible), this is the probable reason for the lack of anthrarufin degradation in the two microenvironments that include potential oxidants (H2O, CO2, O2), both of which include the protective sapphire (Al2O3) film and so do not admit Lyman-α irradiation. The other two cell microenvironments, while admitting Lyman-α irradiation, lack any significant concentration of oxidizing species, and anthrarufin is apparently quite photostable under these circumstances as well.
6. Conclusions
The O/OREOS SEVO payload has successfully enabled the first real-time in situ investigations of the photostability and dynamic changes of organic molecules and biomarkers in outer space. Ultraviolet-visible-near infrared spectral data sets from 24 sample positions were typically downlinked within days of their acquisition in 650 km orbit, which allowed for rapid analysis and the opportunity to strategically and tactically modify data collection parameters and timing in order to optimize science return.
Through this real-time optimization process, flight spectra that are comparable in quality to preflight laboratory spectra were returned from the O/OREOS nanosatellite, demonstrating the capabilities and functionality of this 10 cm cube–UV-visible-NIR spectroscopy system. Importantly, the spectra in Fig. 2 demonstrate the in situ measurement of time-evolving spectral changes in organic samples, a primary success criterion of this mission. This powerful technological capability was previously unavailable for long-duration exposure facilities in low-Earth orbit, including those on the International Space Station.
During the first 309 days (∼10 months) of space exposure on the O/OREOS nanosatellite, the SEVO payload returned spectral data sets that show significant changes in absorbance of IVA films due to photochemical degradation related to the presence of low levels of water vapor (∼2% relative humidity). The results show, as expected, that the photochemical degradation of IVA is (much) more efficient in low relative humidity environments than in the presence of small amounts of dry CO2 gas plus a trace of O2. Thin-film reaction rate data and other spectral information measured in situ will be used in combination with planned ground-based experiments and modeling to characterize reaction mechanisms pertinent to the SEVO microenvironments and related space environments.
The data shown here represent a fraction of more than 800 spectra downlinked during the mission (over 16 months at the time of this writing). More extensive data reduction and analysis will be necessary for a thorough interpretation of the evolution of all four classes of organic molecules in all four microenvironments. SEVO continues to record spectra at the time of publication, monitoring continuing film evolution. Further analysis will include correlation of organic film evolution with temperature variation, solar flares, cosmic ray influence, ground control experiments, and other space environment parameters.
We are also using the spectra acquired after the 6-month baseline mission to optimize spectrometer performance in orbit by adjusting via command such parameters as spectral acquisition intensity threshold, detector integration time, and number of spectra averaged to create one stored spectrum. The technical success and significant return of science data from the SEVO payload of the O/OREOS nanosatellite demonstrate that SEVO and its technologies will enable focused, detailed astrobiology investigations at low cost and low risk for future small missions. Whether these missions fly to terrestrial, lunar, planetary, or near-Earth-object orbits or landing sites, the return on investment can be exceptional when using small satellite technologies like SEVO.
Footnotes
Acknowledgments
The authors would like to thank the NASA Astrobiology Small Payloads program for support, Robert Walker for outstanding technical support, Emmett Quigley and Ryan Walker of the NASA Ames Airborne Instrument Development Lab for their work in producing the hardware necessary for the production of the sample cells, the NASA Astrobiology Institute, the NASA Postdoctoral Program (NPP) administered by Oak Ridge Associated Universities through a contract with NASA, and the Exobiology Program for additional support (proposal number 09-EXOB09-1030). We also thank Cindy Taylor for assistance with deposition and characterization of the thin films, and members of the NASA Ames Small Spacecraft Payloads and Technologies Team, including Michael Henschke, Lynn Hofland, Ed Luzzi, Nghia Mai, Andrea Nazzal, and John Tucker. We are also grateful for the efforts of the highly effective student-and-staff operations team at Santa Clara University, including Laura Bica and Ignacio Mas. We acknowledge helpful discussions and guidance from Andrew Holmes-Siedle (REM Oxford, Ltd.), developer of the radFETs.
Author Disclosure Statement
No competing financial interests exist
Abbreviations
IVA, isoviolanthrene; O/OREOS, Organism/Organic Exposure to Orbital Stresses; PAH, polycyclic aromatic hydrocarbon; SEVO, Space Environment Viability of Organics; UV-Vis, UV-visible.
1
2
Radiation dose calculations were made by SPENVIS, ESA's Space Environment Information System. SPENVIS is a web interface to models of the space environment and its effects, including Earth's natural radiation belts, solar energetic particles, cosmic rays, plasmas, gases, and “micro-particles” (see