
Abstract
Evaporation of silica-rich geothermal waters is one of the main abiotic drivers of the formation of silica sinters around hot springs. An important role in sinter structural development is also played by the indigenous microbial communities, which are fossilized and eventually encased in the silica matrix. The combination of these two factors results in a wide variety of sinter structures and fabrics. Despite this, no previous experimental fossilization studies have focused on evaporative-driven silica precipitation. We present here the results of several experiments aimed at simulating the formation of sinters through evaporation. Silica solutions at different concentrations were repeatedly allowed to evaporate in both the presence and absence of the cyanobacterium Synechococcus elongatus. Without microorganisms, consecutive silica additions led to the formation of well-laminated deposits. By contrast, when microorganisms were present, they acted as reactive surfaces for heterogeneous silica particle nucleation; depending on the initial silica concentration, the deposits were then either porous with a mixture of silicified and unmineralized cells, or they formed a denser structure with a complete entombment of the cells by a thick silica crust. The deposits obtained experimentally showed numerous similarities in terms of their fabric to those previously reported for natural hot springs, demonstrating the complex interplay between abiotic and biotic processes during silica sinter growth. Key Words: Silica—Cyanobacteria—Fossilization—Hot springs—Stromatolites. Astrobiology 13, 163–176.
1. Introduction
In situ studies have also revealed that the microbial communities that thrive around hot springs and their outflows play an important role in the formation of silica sinters. By acting as a reactive substratum for passive and heterogeneous silica nucleation, these microorganisms become very rapidly fossilized and eventually encased in the newly formed sinter (Schultze-Lam et al., 1995; Cady and Farmer, 1996; Renaut et al., 1996; Jones et al., 1997, 1998, 2000, 2001, 2003, 2004, 2008; Konhauser et al., 2001; Mountain et al., 2003; Kyle et al., 2007; Tobler et al., 2008). The structure of the microbial communities, as well as their daily or seasonal growth variations, thus also contribute to the development of the fabrics and structure of their entombing sinters (Walter et al., 1976; Hinman and Lindstrom, 1996; Konhauser et al., 2001, 2004; Jones et al., 2005; Berelson et al., 2011). Consequently, sinter micro- and macrostructures are determined or influenced by a large number of parameters, which explains the large diversity of facies observed (e.g., Jones et al., 1998; Braunstein and Lowe, 2001; Schinteie et al., 2007) and the difficulties at deciphering the processes involved.
However, very little is understood about the evaporative precipitation process; despite several decades of experimental studies in which the silicification of microbes was examined, only one (Yee et al., 2003) involved examination of silicification after cooling-induced supersaturation. In all other experimental studies, rapid pH neutralization was employed to induce silica deposition (e.g., Ferris et al., 1988; Birnbaum et al., 1989; Westall et al., 1995; Westall, 1997; Phoenix et al., 2000; Toporski et al., 2002; Yee et al., 2003; Benning et al., 2004a, 2004b; Lalonde et al., 2005; Orange et al., 2009, 2013), and evaporation as a viable pathway for rapid cellular fossilization was neither considered nor examined. Accordingly, the rationale for this study was to reproduce, in a simple way, the formation of laminated silica sinter in both the presence and absence of microorganisms and exclusively by evaporative processes. Through experiments involving successive cycles of addition and evaporation of undersaturated and oversaturated silica solutions, the following aspects of evaporation-induced silica deposition were examined: (1) how silica precipitates by evaporation either in the absence or presence of microorganisms, (2) whether successive addition/evaporation cycles can form sinter fabrics or laminations, (3) what role microorganisms have on the deposition of silica or the structure of the deposit, and (4) how evaporative silica deposition relates to sinter formation in natural settings with respect to deposition rate and silica saturation state.
2. Material and Methods
2.1. Cell culturing
The obligate photoautotrophic cyanobacterium Synechoccoccus elongatus PCC 7942 was chosen for this study because it is a model organism commonly used in prior cyanobacterial studies (e.g., Chen, 2007), diverse members of this genus inhabit the surface layers of hot spring microbial mats (e.g., Walter et al., 1972; Ferris et al., 1996; Jones et al., 1998), and its rod morphology facilitates identification in microscopy. Cultures were grown in liquid BG-11 media (Rippka et al., 1979) with constant illumination, shaking, and bubbling with filtered and humidified air (Chamot and Owttrim, 2000). Cell pellets were recovered from stationary phase cultures by centrifugation (7500 rpm, 15 min) and stored at 4°C until use.
2.2. Experimental silica mineralization
The goal of this experiment was to mimic hot spring conditions where silica-rich waters become rapidly silica-oversaturated as the result of cooling, evaporation, or pH change (e.g., White et al., 1956; Fournier, 1985; Jones et al., 1998) shortly before or upon contact with microbial mats. We used alkaline monomeric silica solutions at three different concentrations (30, 150, and 300 ppm Si) similar to those encountered in hot spring systems (e.g., Mountain et al., 2003; Tobler et al., 2008). The pH of these solutions was lowered from pH ∼11 to ∼8 immediately before exposure to S. elongatus cell concentrates, thus making the 300 ppm Si and 150 ppm Si silica-oversaturated (amorphous silica solubility at 20°C: 49 ppm Si, calculated from the equilibrium equation of Gunnarsson and Arnórsson, 2000). Oversaturation of the 30 ppm Si solution was only achieved during evaporation. A 300 ppm Si stock solution was prepared by diluting 0.304 g of Na2SiO3·9H2O (Fisher Scientific, Nepean, ON) in 100 mL of ultrapure water. Part of this solution was then diluted either 2× or 10× to obtain solutions of 150 ppm Si and 30 ppm Si, respectively.
For each experiment, 20 μL of the cell pellet was spread in a polystyrene weighing dish and left to dry (Fig. 1). One milliliter of silica solution was then added to completely cover the deposited cells. Immediately before addition, the pH of the silica solution was lowered to ∼8 with 0.12 or 1.2 M HCl. Samples were then left to dry at room temperature. Complete drying usually occurred after ∼36 h. The addition of 1 mL of silica solution and its drying is hereafter referred to in this study as “a cycle.” The following experiments were conducted: (1) 10 cycles with a 30 ppm Si solution, (2) 10 cycles with a 150 ppm Si solution, (3) 1 cycle with a 300 ppm Si solution [amount of silica equivalent to (1)], (4) 10 cycles with a 300 ppm Si solution, and (5) control samples with no cells and 2 cycles with either 30 or 300 ppm Si silica solutions. With every successive addition and drying of silica solution, a deposit of increasing thickness formed at the bottom of the polystyrene dishes (Fig. 1).
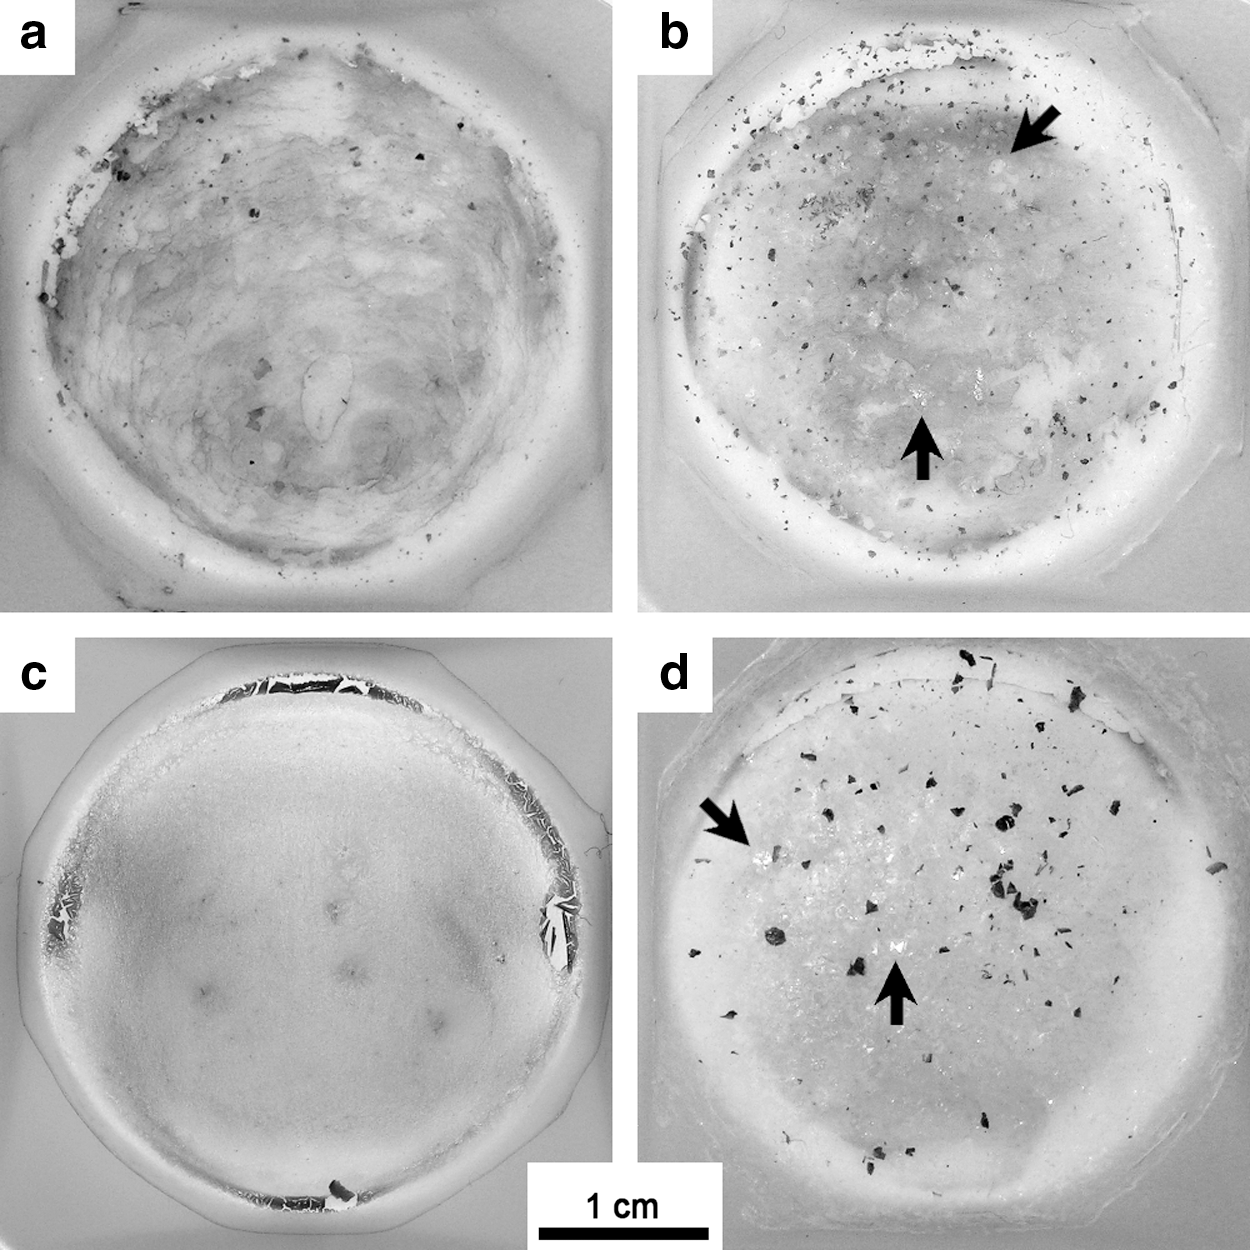
Images of silica-treated Synechococcus elongatus cell pellets at the end of the experiments. (
2.3. Scanning electron microscopy
For both samples with cell pellets and for controls, areas of interest were identified by light microscopy, carefully excised as 5×5 mm squares (two per sample), and then delicately rinsed three times in ultrapure water to dissolve NaCl deposited during the final stages of evaporation. Samples were placed on silver-painted scanning electron microscope (SEM) sample stubs and gold coated. SEM observations were performed at 5 kV with a JEOL 6301F field emission gun scanning electron microscope in the Department of Earth and Atmospheric Sciences at the University of Alberta.
3. Results
3.1. Light microscopy
The cell pellets used for these experiments were highly concentrated such that a small volume (20 μL) was sufficient to cover the bottom of the polystyrene dishes with a bright green deposit made of multiple layers of densely packed S. elongatus cells (Figs. 1, 3a). Silica addition led, at least in the first cycles, to the partial resuspension of the initial deposited cells or the clumping and detachment of some cell material (small dark aggregates, Fig. 1a, 1b, 1d). The color of the deposited cells became progressively more yellowish with time. The thickness of the silica deposit was directly related to the silica concentration. In the 300 ppm Si experiment, the deposited cell pellets were completely encrusted by silica after 10 cycles (Fig. 1d), with biomass appearing faded under a visible layer of silica that was somewhat frosted in appearance (compare Fig. 1c and 1d). Small, bright NaCl crystals could at times be seen with the naked eye on top of the deposit, especially for the highest Si concentrations (Fig. 1b, 1d, arrows).
3.2. Scanning electron microscopy
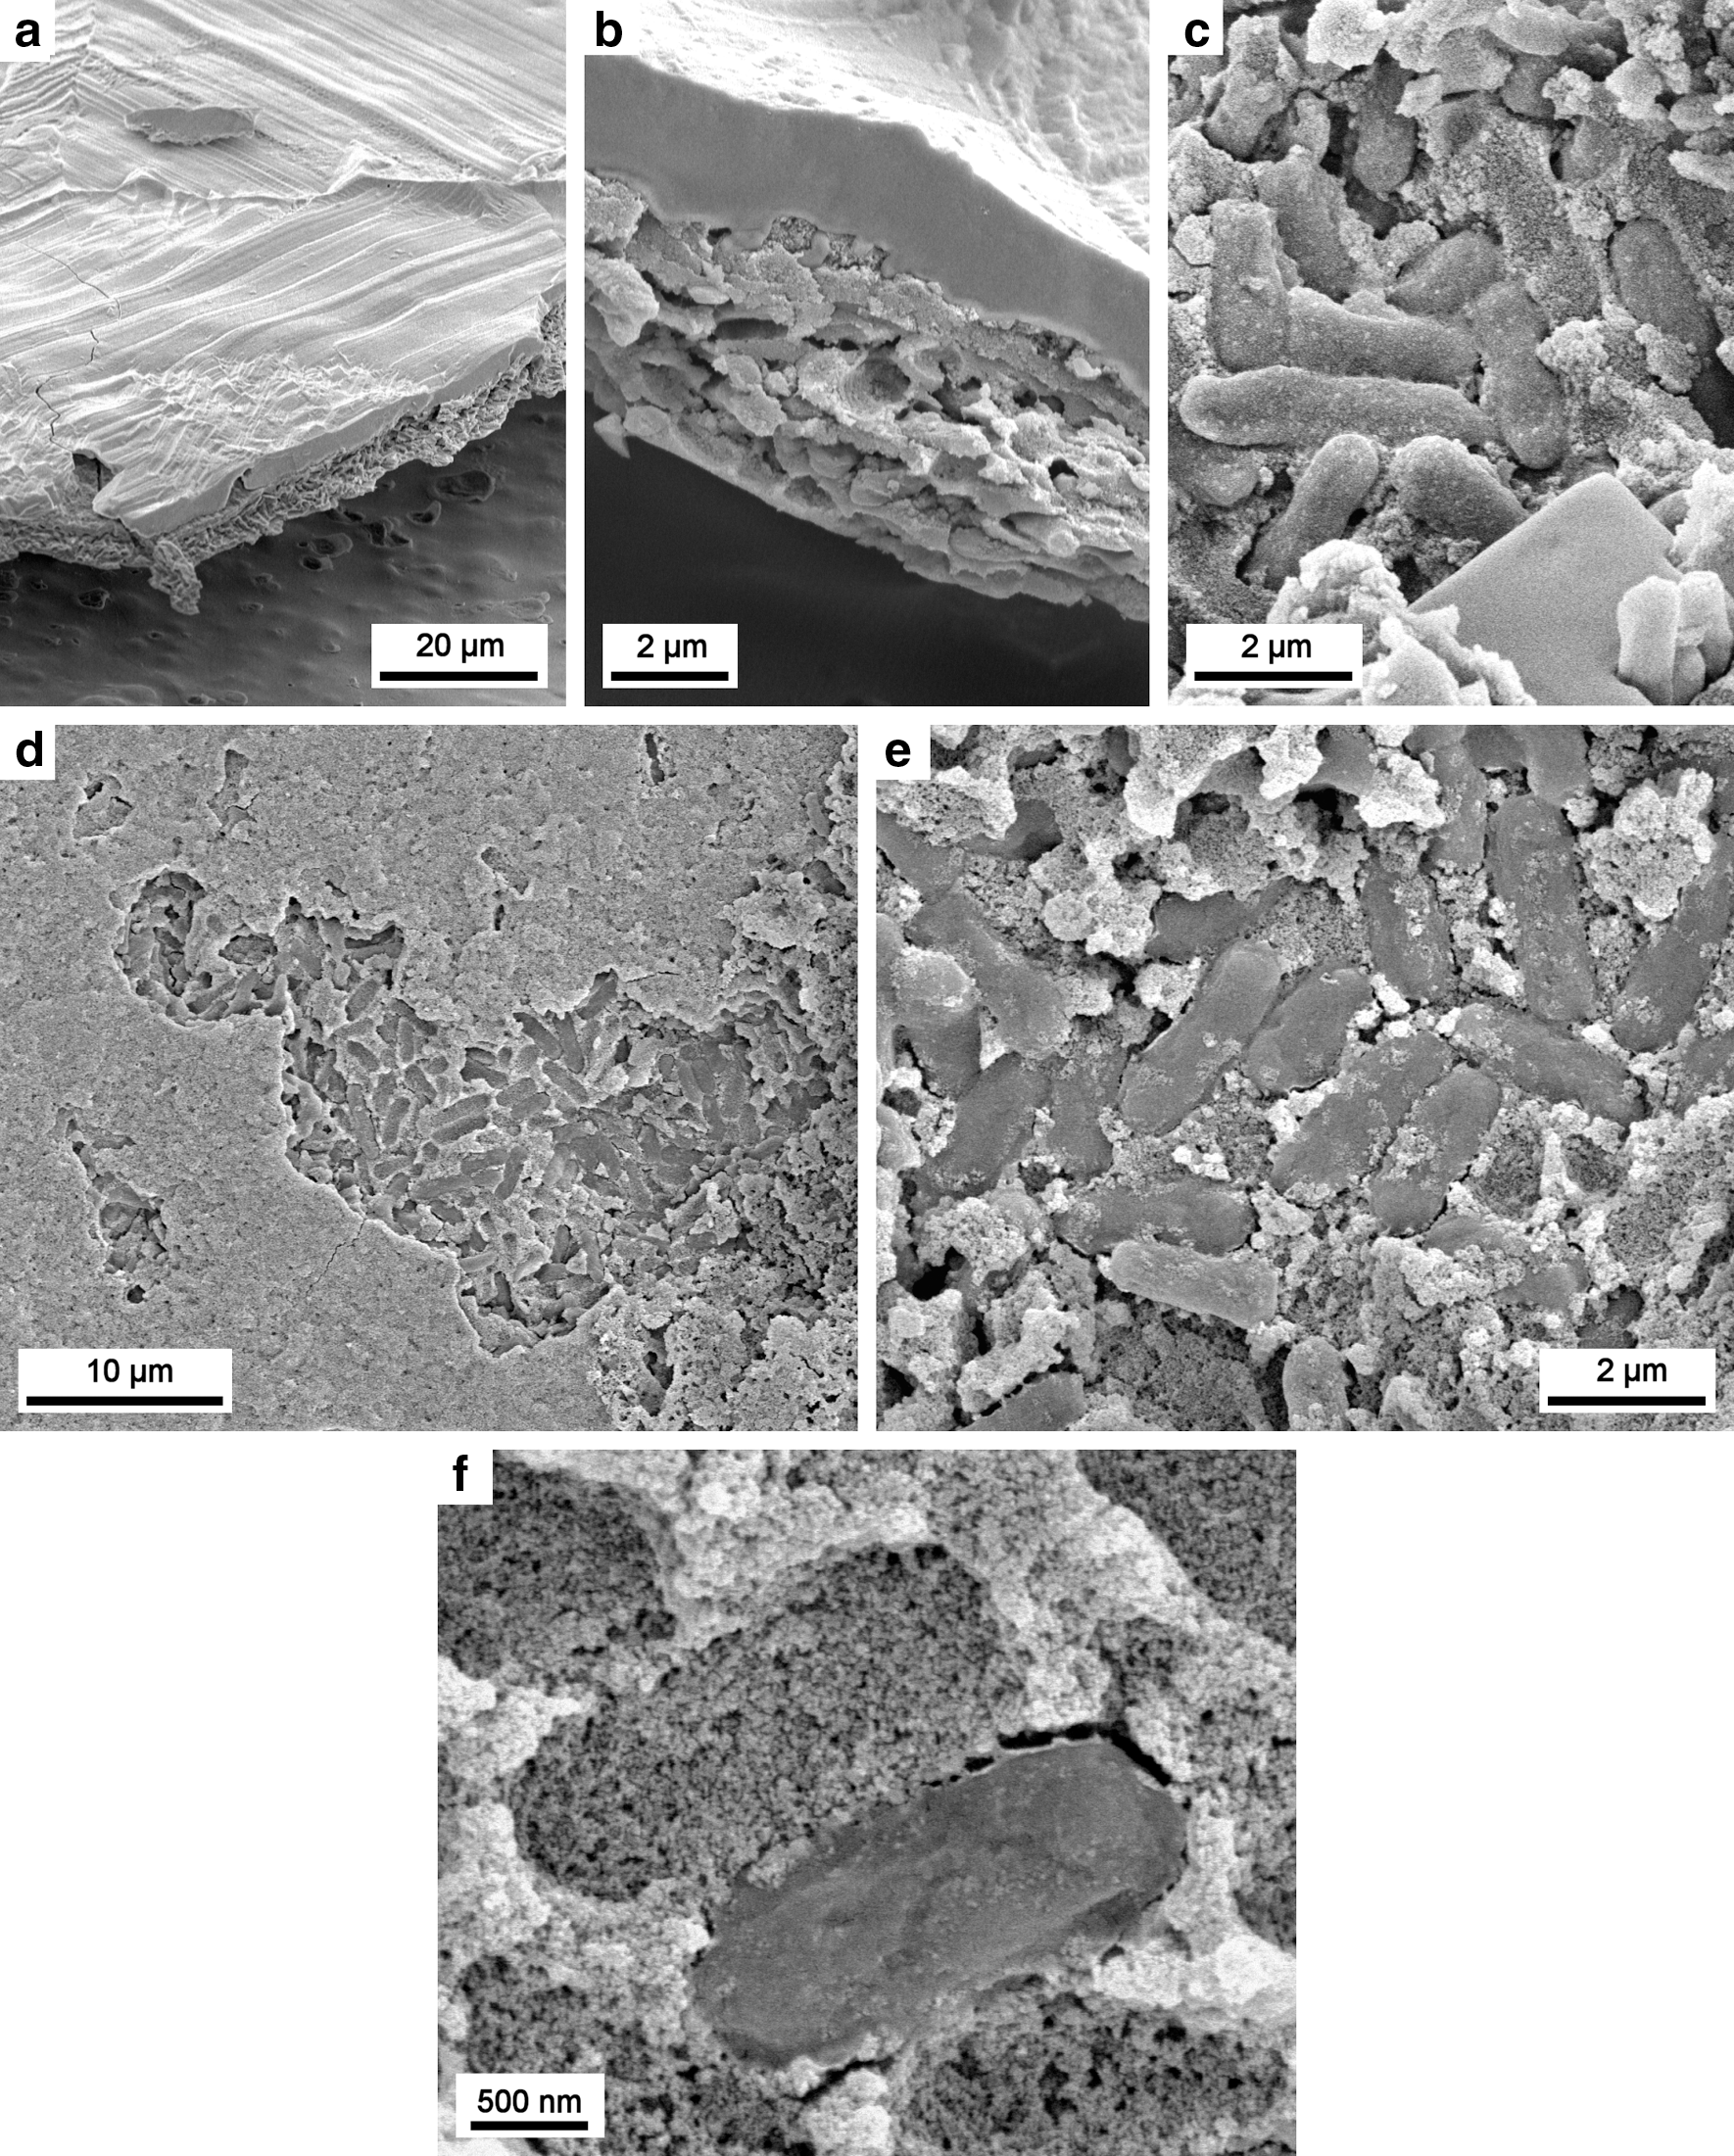
In the inorganic controls, SEM micrographs of the 30 ppm Si sample showed that 2 cycles of silica addition resulted in a layered structure in the deposit that formed at the bottom of the polystyrene dish (Fig. 2a). Two granular layers of silica, corresponding to the two additions of silica solution (i.e., 2 cycles), were visible along with a layer of smooth NaCl precipitate intermittently covering the silica (Fig. 2a). The silica layers were quite homogeneous and composed of 30–40 nm sized silica particles (Fig. 2b, 2c). The NaCl layer apparently formed over deposited silica and likely represents late-stage precipitation during evaporation as the result of concentrating Na+ (from the sodium silicate solution) and Cl− ions (from the HCl used for pH adjustment). These ions had similar molar concentrations in the added solution (with a small excess of Na+) (Table 1). Two cycles of 300 ppm Si solution addition resulted in the formation of a ∼3 μm thick deposit (Fig. 2e). Despite the fact that the 300 ppm Si solution was initially supersaturated with respect to amorphous silica, the 300 ppm Si control sample showed features very similar to the 30 ppm Si control sample (with an undersaturated solution). Most of this deposit was formed of granular silica precipitate with sizes similar to the 30 ppm Si control experiment (30–40 nm; Fig. 2f).
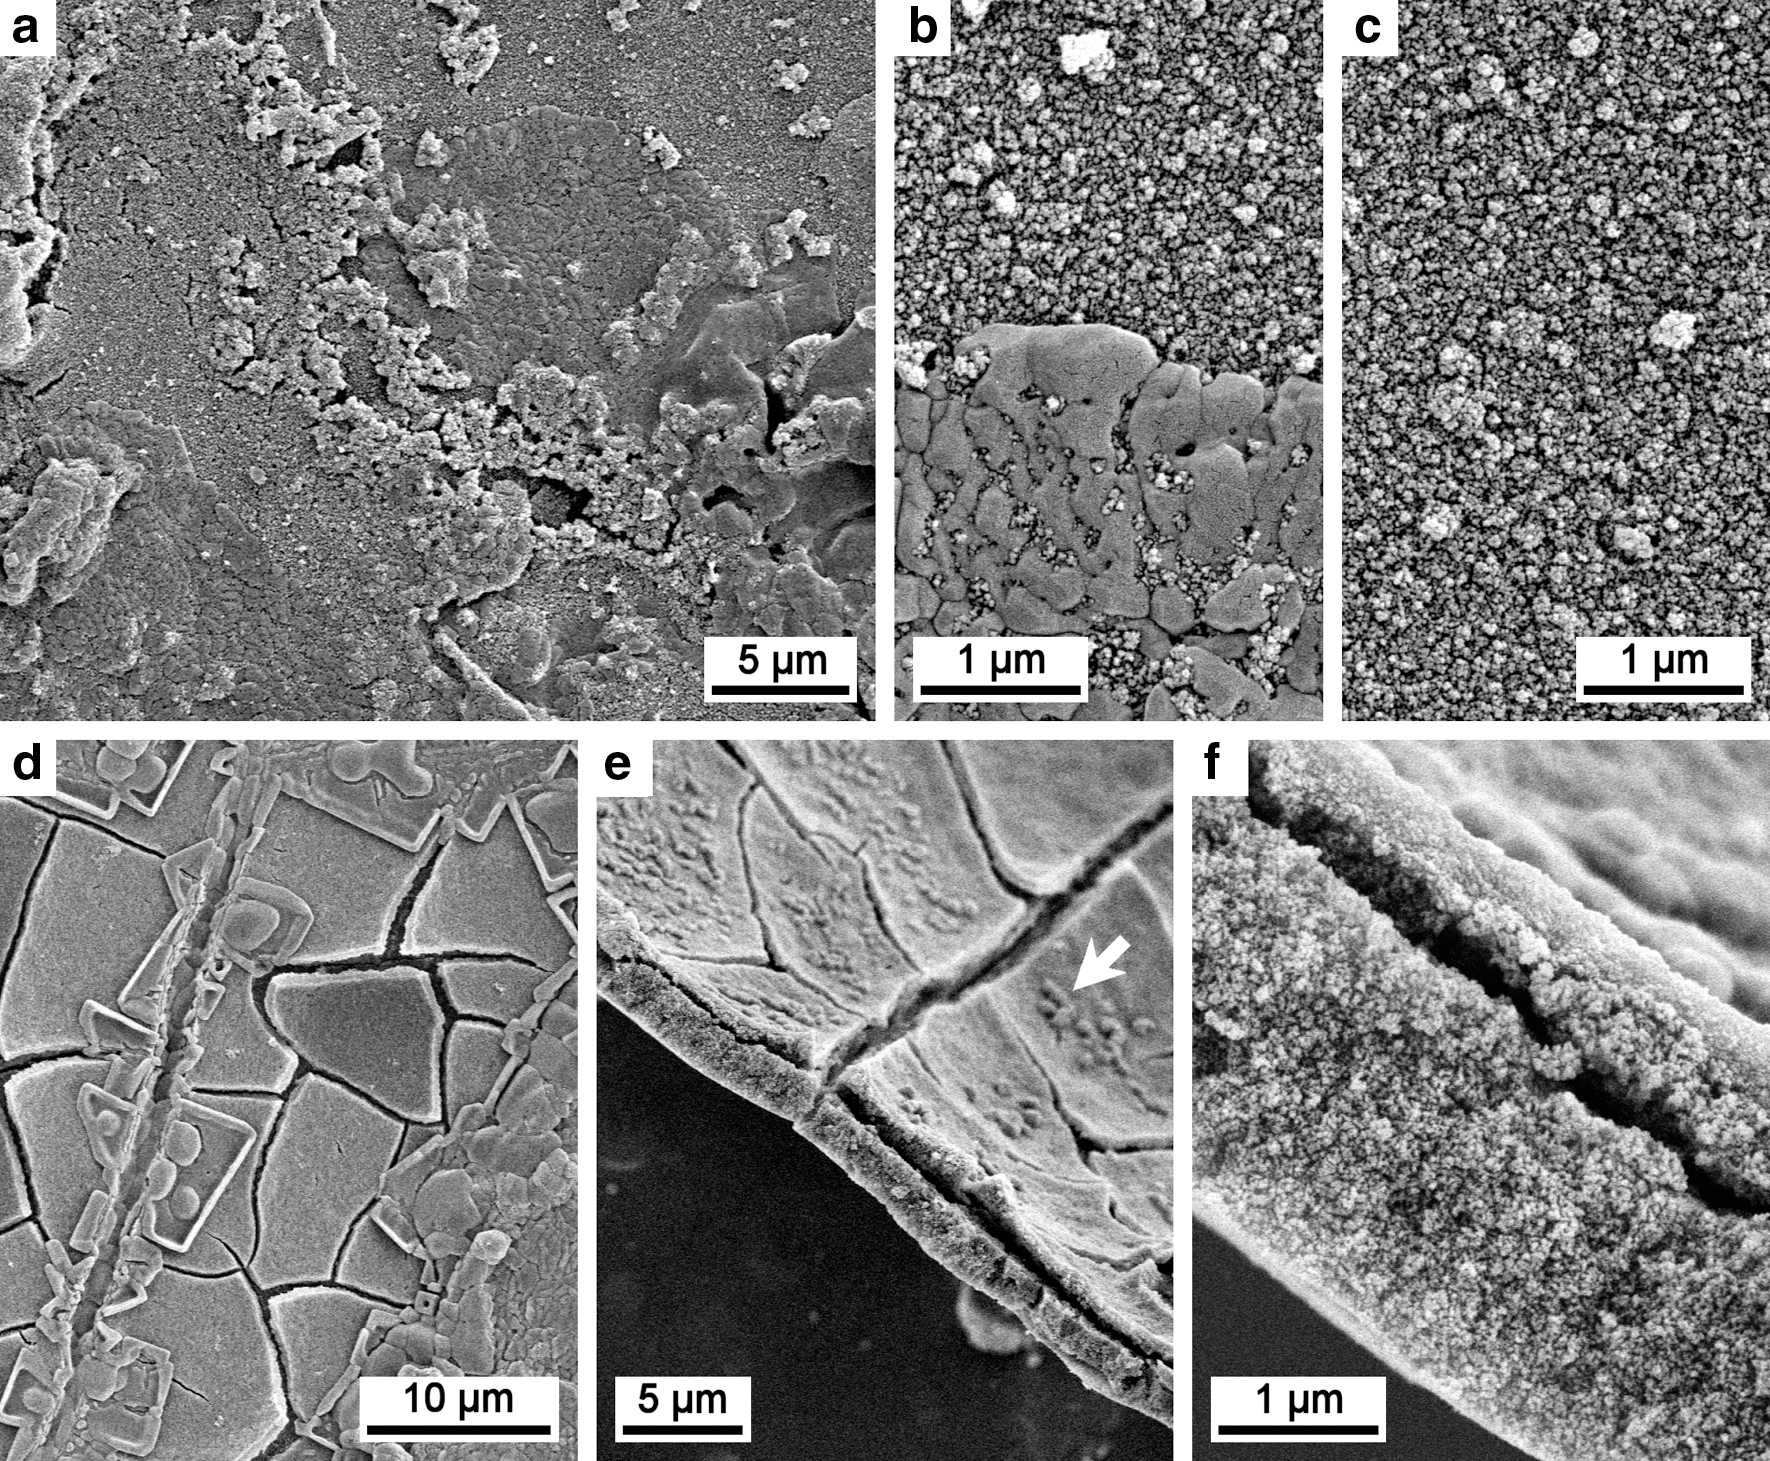
SEM micrographs showing precipitates formed in control experiments (no cells) after 2 cycles of silica addition and drying (a–c, 30 ppm Si; d–f, 300 ppm Si). 30 ppm Si: (
(
(
(
(
(
(
(
In the 300 ppm Si experiments, desiccation cracks formed in the silica mass, both vertically and horizontally, resulting at times in separation of the two layers corresponding to the two silica additions (Fig. 2d, 2e). NaCl deposits again formed on the silica layer but did not cover it completely, and in places it appeared distinctly more crystalline and associated with desiccation features (Fig. 2d). In cross section the top silica layer appeared thinner than the bottom layer (Fig. 2f), suggesting that, after the second addition of saturated silica solution, silica may have penetrated and precipitated within void space of the first silica layer. No traces of NaCl deposit could be seen between the two silica layers (Fig. 2f), suggesting that the NaCl deposit formed at the end of the first cycle was completely dissolved after the second addition of fresh silica solution.
For experiments with cell pellets, repeated silica treatments do not appear to have significantly resuspended the deposited cell mass. After 10 cycles of 30 ppm Si solution, S. elongatus cells remained densely packed (Fig. 3a) and appear to have retained smooth extracellular polymeric substance (EPS) covering material (Fig. 3b). The cells showed no evidence of significant deformation or degradation. After 10 cycles with 30 ppm Si solution, silicification was manifested in three different ways: (i) as homogeneous deposits made of 20–50 nm silica particles on the surface of the polystyrene weighing dishes between, and adjacent to, the deposited cell mass (Fig. 3e)—these were similar in size to those observed in control samples (e.g., Fig. 2c); (ii) as larger agglomerates (hundreds of nanometers) composed of 30–70 nm silica particles, deposited on, or intertwined within, the silica-cell mass (larger, brighter particles in Fig. 3b–d); and (iii) as coatings directly on cell or EPS surfaces where the silica is clearly more fine-grained than in the case of (ii) (30–50 nm), yet it retains a granular appearance (exemplified by cells directly center of Fig. 3c). No layering of the silica precipitate was observed in the 30 ppm Si cell pellet experiments. The dense mass of cells, providing a template for the deposition of silica, apparently prevented the formation of distinct layers at scales commensurate with a single cycle of silica addition. No large, contiguous deposits of NaCl were observed, and instead, NaCl crystals appeared to form preferentially on cell surfaces (Fig. 3b), perhaps as a result of heterogeneous water distribution during the dessication process.
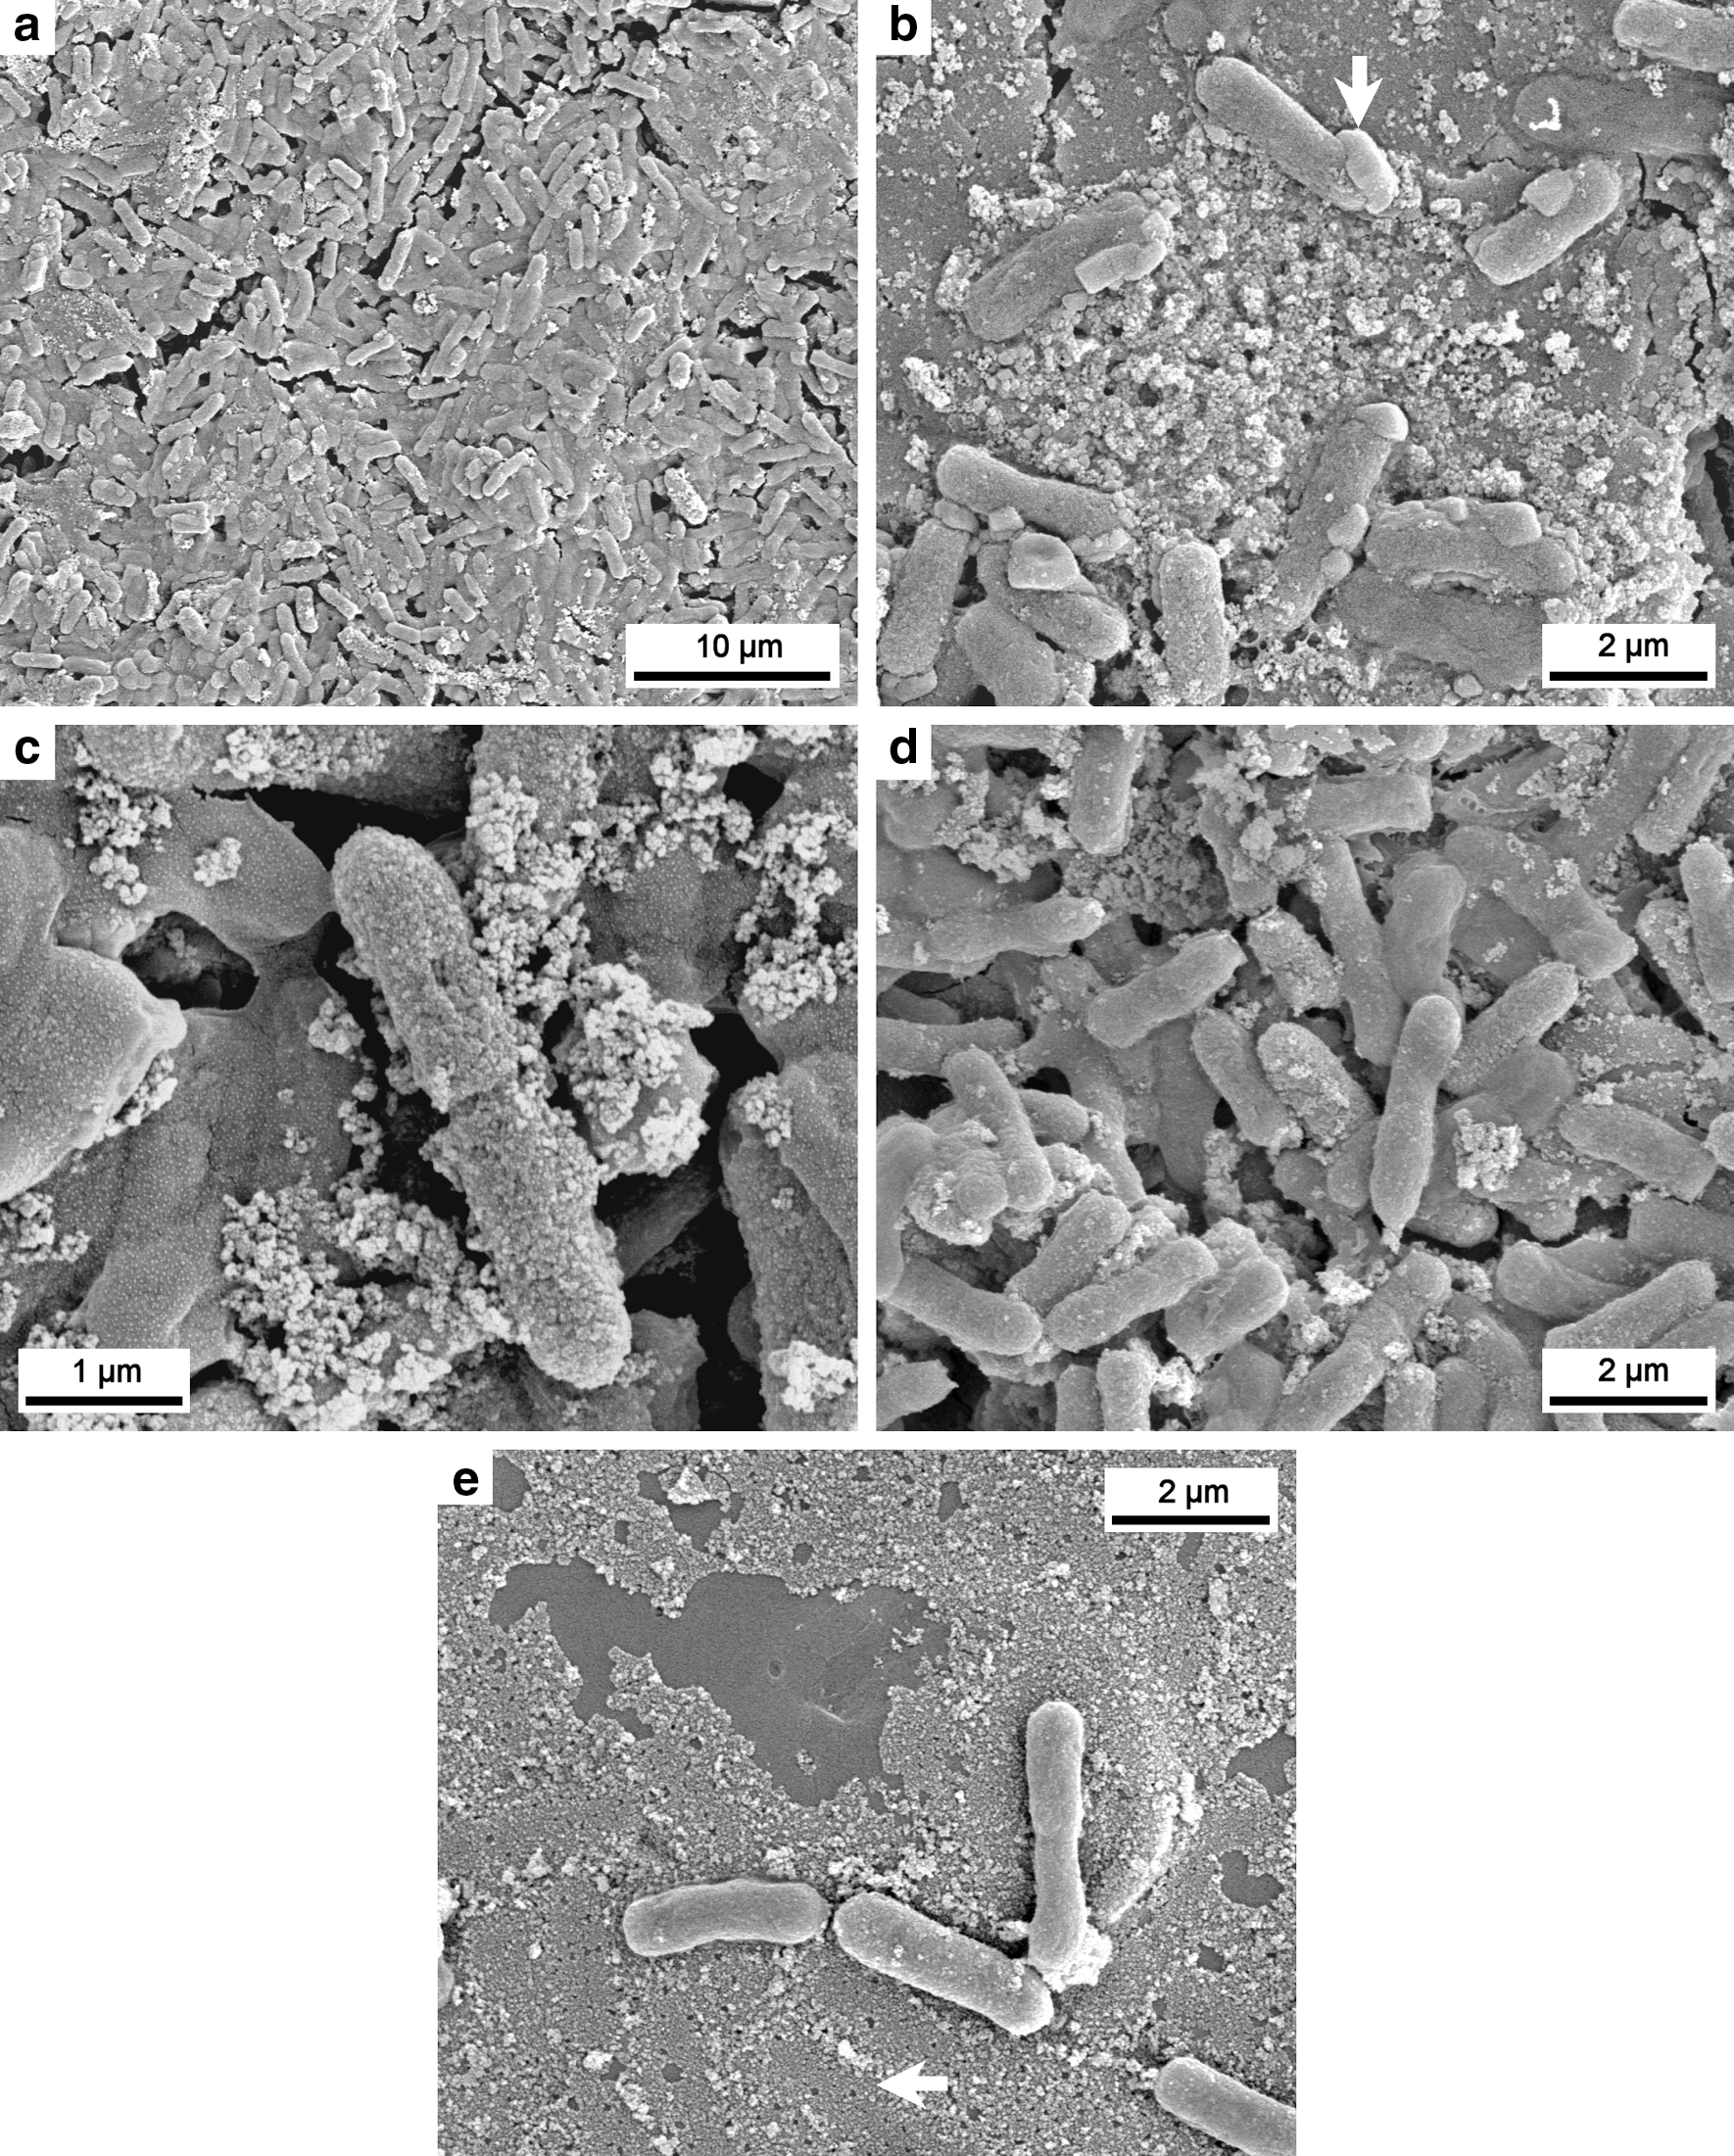
SEM micrographs of a mineralized cell pellet of Synechococus elongatus after 10 cycles of silica addition/drying of a 30 ppm Si solution. (
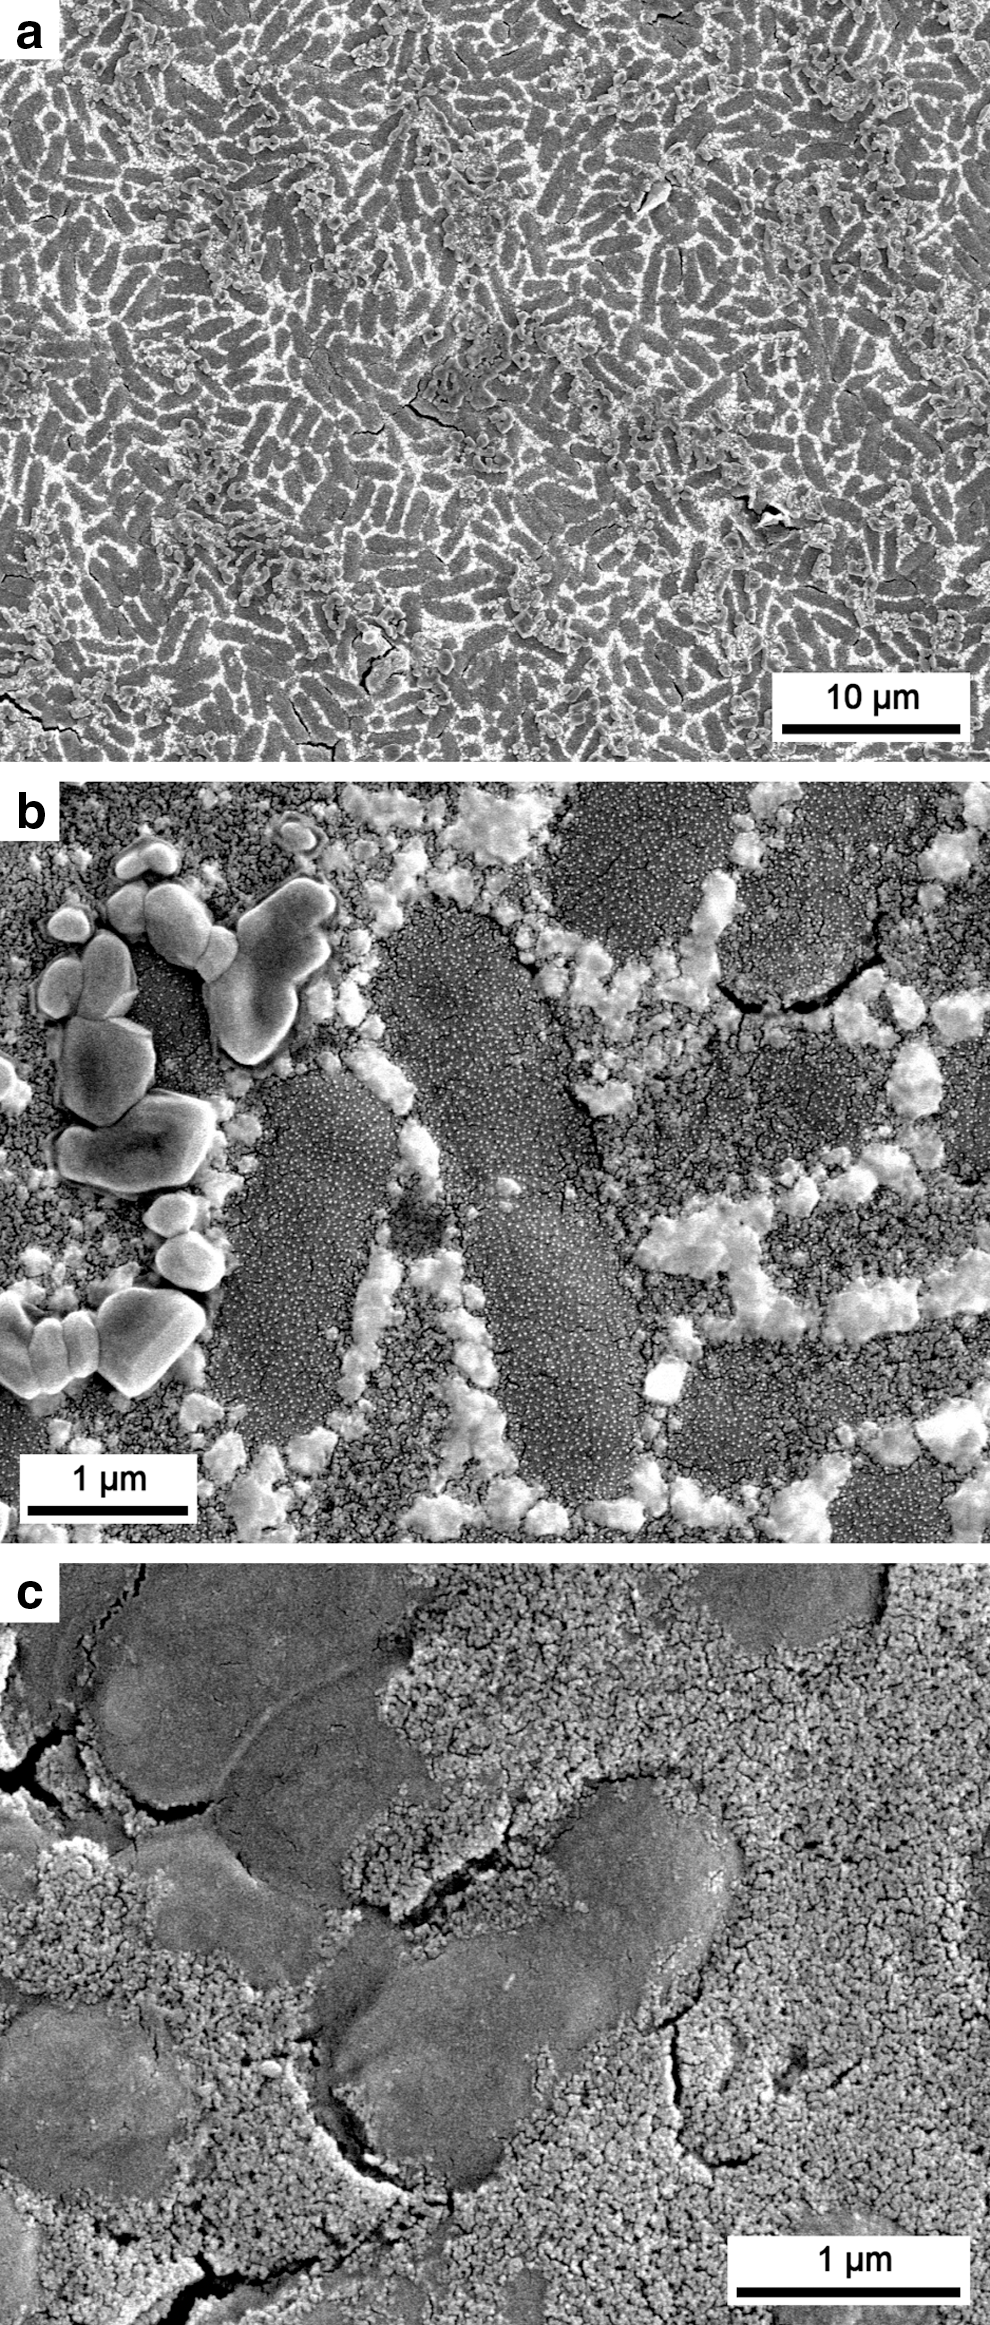
Experiments with 150 ppm Si solutions, which were rendered silica-oversaturated by pH adjustment immediately prior to use, generated significantly thicker deposits (Fig. 4a). After 10 cycles, almost all S. elongatus cells in the pellet were associated with authigenic silica precipitates (Fig. 4b, 4c). Instead of individual crystals, late-stage NaCl formed a uniform deposit on top of the silica mass, covering it almost entirely (Fig. 4a). At times, 30–70 nm nanoparticles of precipitated silica entirely filled void spaces between cells (Fig. 4b, 4c). Again, no distinct layering of silica could be seen resulting from sequential silica additions. All three forms of silica mineralization (granular mass, larger agglomerates, and fine coatings) observed in the 30 ppm Si experiments were again observed (Fig. 4b–d). As in the 30 ppm Si experiments, cells sometimes were covered with a layer of discrete silica particles that were finer than coexisting aggregates (25–55 nm vs. 30–70 nm; compare Figs. 3c and 4d), but also showed variations in the level of mineral precipitation (compare Fig. 4c and 4d). S. elongatus cells again appeared undamaged by the treatments (Fig. 4d).
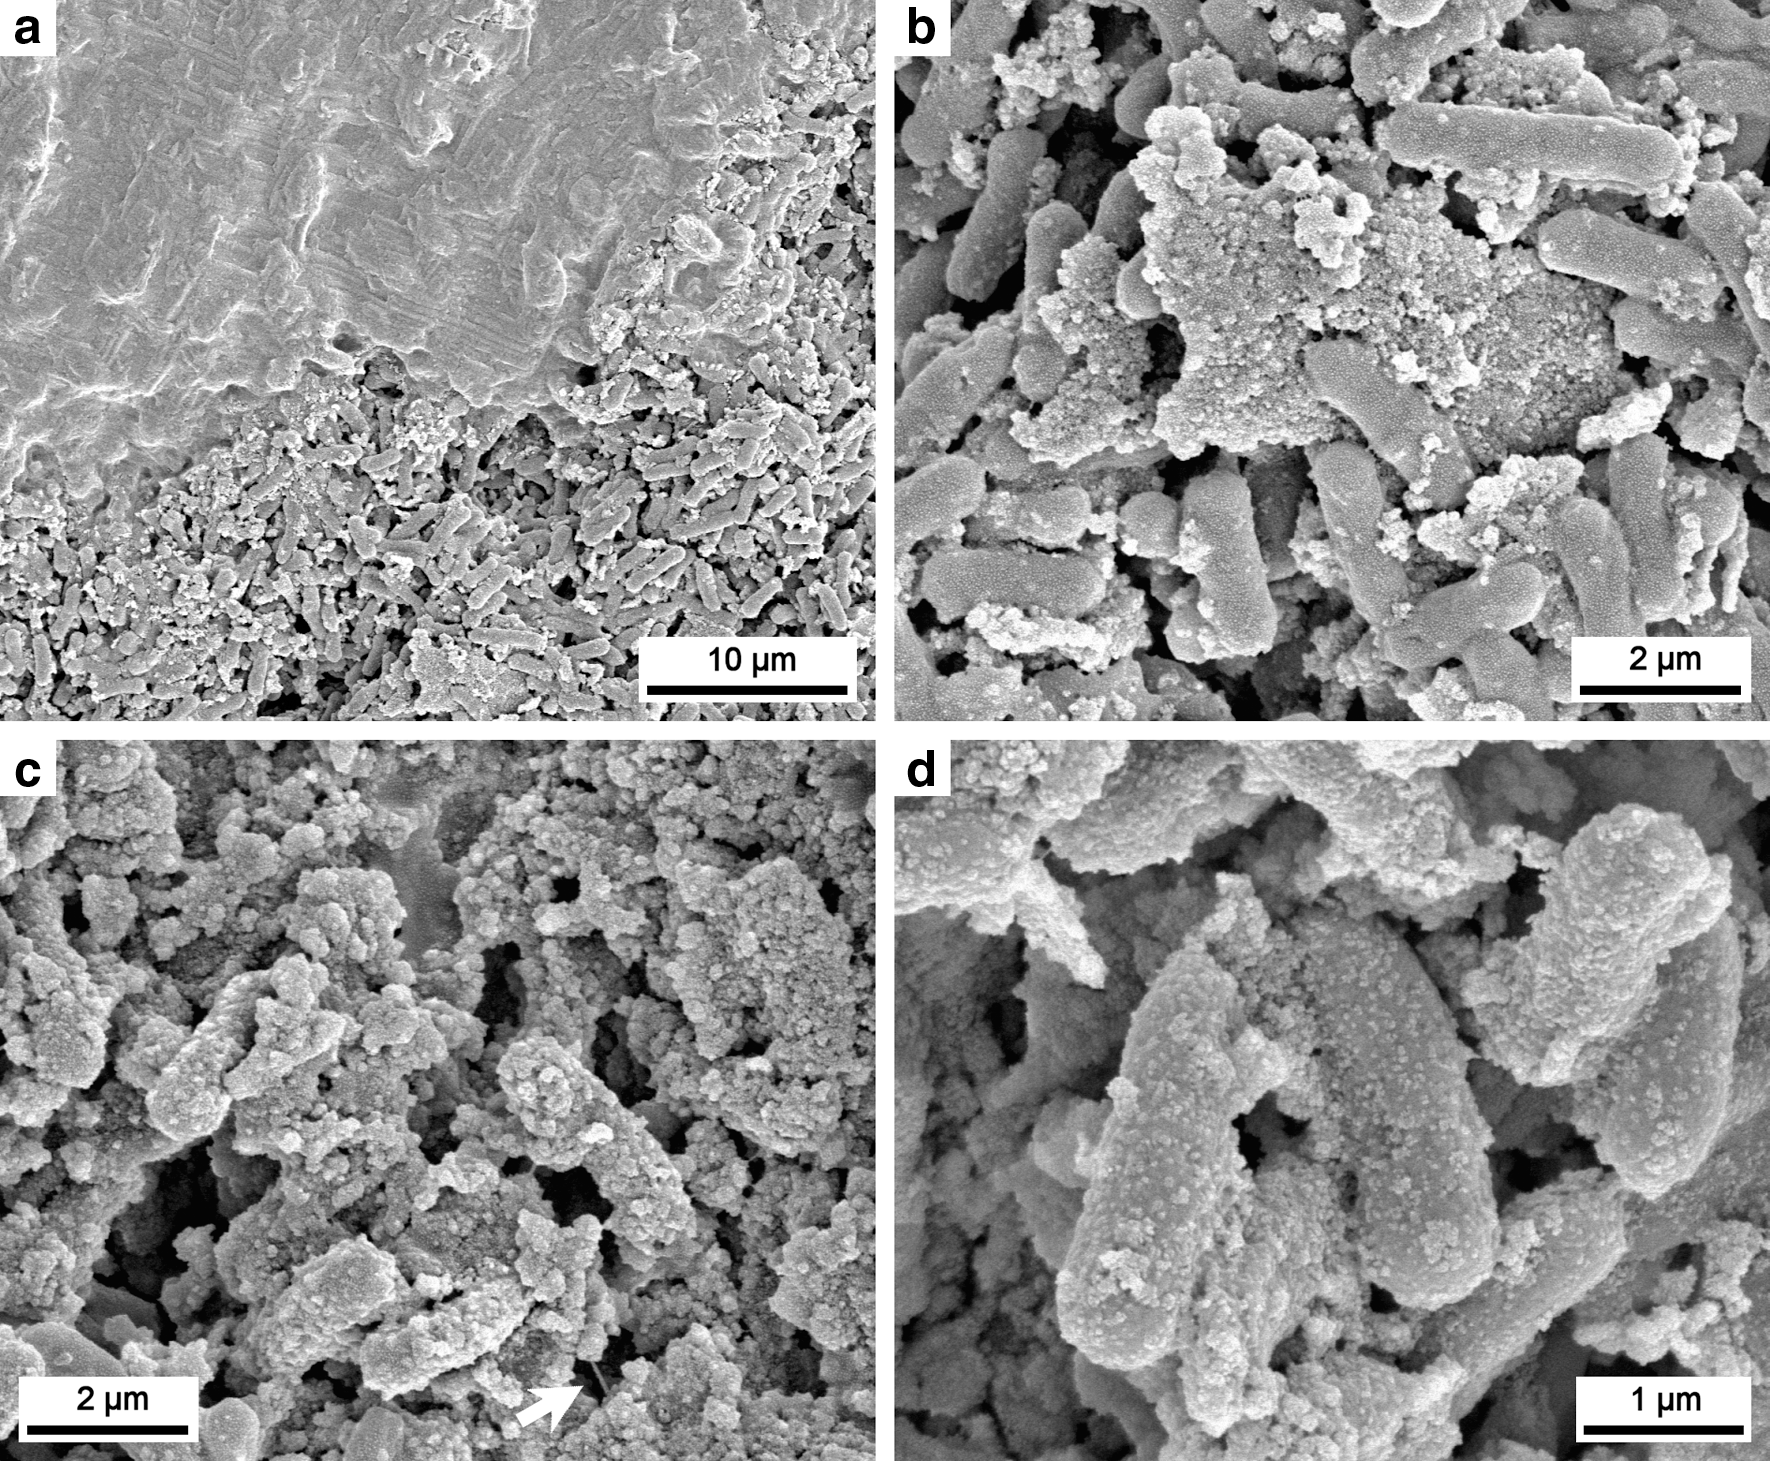
SEM micrographs of a mineralized cell pellet of Synechococus elongatus after 10 cycles of silica addition/drying of a 150 ppm Si solution. (
In the case of experiments with 300 ppm Si oversaturated solutions, the total amount of silica precipitated after only 1 cycle is equivalent to 10 cycles with undersaturated 30 ppm Si solutions (Table 1). Despite this, the two samples looked significantly different (compare Figs. 3a and 5a). After complete evaporation, the cell-silica deposits appeared particularly flat, and S. elongatus cells were easily recognizable and trapped within an apparently bright matrix (Fig. 5a). Close-up micrographs show that the bright aspect of the matrix was due to small NaCl crystals that formed on its surface (Fig. 5b). These crystals were completely removed by rinsing, which unveiled the underlying smooth and homogeneous silica matrix comprising densely packed 20–40 nm silica particles (Fig. 5c). S. elongatus cells appeared mainly molded and trapped by silica (Fig. 5b, 5c), but a few smaller particles (15–30 nm) had nucleated on S. elongatus cell surfaces (Fig. 5c).
SEM micrographs of a mineralized cell pellet of Synechococus elongatus after 1 cycle of silica addition/drying of a 300 ppm Si solution. (
In experiments comprising 10 cycles with highly oversaturated 300 ppm Si solution, the resulting deposits were between 5 and 10 μm thick and consisted of two distinct layers: a homogeneous upper NaCl layer constituting approximately one-third of the total thickness, and a bottom 3–6 μm layer hosting a mixture of cells and granular silica precipitates consisting of an amalgamation of 25–50 nm particles (Fig. 6a, 6b). The limit between the two layers was well defined (Fig. 6b), and no traces of NaCl or other salts were evident in the lower silica mass. Once again, NaCl formed at the surface after each drying episode but was dissolved entirely during the next solution addition. The result appears to have been progressive deposition of silica, eventually forming a single silica deposit, upon which a NaCl layer was presumably repeatedly deposited and dissolved. Unlike the other cell pellet experiments, but comparable to the 300 ppm Si inorganic control, stratification within the silica deposit itself is visible but more difficult to discern due to the presence of cells (Fig. 6b). During the first 5–7 cycles, it appears that the deposition of silica progressively trapped cells, and complete entombment of the cell pellet was achieved. Layers of silica that formed afterward apparently only covered the previous deposit and formed quite uniform layers (e.g., Fig. 6b, 6d). The deepest, initial silica layers appear denser than silica layers nearest to the surface (Fig. 6b). Compaction is an unlikely explanation; instead, percolation of silica solution and void infilling may have occurred during later additions. No differences in the size of the silica particles of the different layers could be seen. S. elongatus cells remain intact and continue to show no sign of degradation that might be expected from silica entombment or multiple drying/rehydration cycles (e.g., Fig. 6c, 6e).
SEM micrographs of a mineralized cell pellet of Synechococus elongatus after 10 cycles of silica addition and drying of a 300 ppm Si solution. (
In addition to removing the NaCl layer, rinsing prior to SEM observation at times removed cells and revealed cell imprint casts in the fine granular silica matrix (Fig. 6e, 6f). These casts have sizes that are identical to the original cells, indicating that on the timescale of these experiments, cell silicification provides an accurate molding of the cells with no size or shape changes despite desiccation and repetitive additions of silica. Simulated diagenesis experiments have indicated that this is not always the case (Orange et al., 2013). Silica mineralization of the cell was significantly lower than that of the 30 and 150 ppm Si experiments (compare Figs. 3c, 4d, and 6c), but 20–40 nm particles could be seen heterogeneously covering S. elongatus cells (Fig. 6c, 6f), indicating that successive silica additions did not lead to a significant increase in the size of the particles.
4. Discussion
4.1. Formation and microstructure of experimental sinters
In experiments without cells (Fig. 2), the repeated addition and evaporation of silica solutions, both over- and undersaturated with respect to amorphous silica, led to the formation of laminated deposits with silica layers corresponding to each evaporation cycle and with variable amounts of late-stage NaCl salts (Fig. 2b, 2e). Apart from obvious differences in the amount of silica precipitated, the structure of the deposit was similar for all concentrations. Higher (oversaturated) silica concentrations only led to a more dense silica deposit, but they did not appear to influence the size of the granular silica precipitate (30–40 nm). During evaporation, amorphous silica always precipitated first, even when the solution was initially undersaturated. NaCl only became supersaturated after >99% evaporation for the first cycle, or >96% after 10 cycles (Table 1), excluding any significant period of coprecipitation with silica. The addition of fresh silica solution apparently dissolved in its entirety any residual salts from the previous cycle (Fig. 2f). Despite sometimes reaching relatively high salinity values after 10 cycles (Table 1), we assumed that the dissolved NaCl did not have an influence on the size of the particles formed or the silica solubility, in accordance with the findings of Tobler et al. (2009). In the case of the most silica-supersaturated (300 ppm Si) inorganic experiment, two subsequent addition-evaporation cycles resulted in two distinct deposit layers of significantly different thickness, whereby the second cycle led to a thinner layer (Fig. 2f). The most likely explanation is that, during the second cycle, silica precipitated at first within void spaces of the previous silica layer. This is consistent with natural examples where sinters have been observed to be more or completely cemented at depth, for example, from rim to spicule core (Jones and Renaut, 2006) and top to bottom (Campbell et al., 2001).
Silicification of cell biomass can occur from either particles preformed in suspension by homogeneous nucleation or by heterogeneous nucleation on cellular or inorganic surfaces. In both cases, a state of supersaturation is required for mineral formation (see review in Konhauser et al., 2004). In our experiments that consisted of successive additions of silica, it is likely that both processes occurred in tandem. First, deposition of particles that formed in suspension during any one given cycle would result in the accumulation of particles of similar sizes but with perhaps the amount of silica particles that formed increasing in number with higher states of initial silica concentrations (i.e., a nucleation-controlled regime where new surface area is created mainly by the nucleation of many small grains characterized by high surface-area-to-mass ratios; Steefel and Van Cappellen, 1990). Some of these particles would sediment onto cell biomass, while many would not end up associated with biomass. Simultaneously, silica nucleation also occurred on the cellular (wall, EPS) or inorganic surfaces. These initial crystals would be small in size but then grow after continued exposure to other silica additions (i.e., crystal-growth regime). This is indeed what was observed in the 30 ppm Si and 150 ppm Si experiments, where particles grew from 30–40 nm after 2 cycles (Fig. 2b, 2c) to 30–70 nm after 10 cycles (Figs. 3c, 4b). Interestingly, in the 300 ppm Si experiments, the size of the particles of the silica matrix did not change significantly and remained around 20–40 nm even after repeated cycles (compare Figs. 5c and 6f). Moreover, the amount of silica particles bound to the cell surfaces was significantly lower in the 300 ppm Si experiment than that which occurred in the 30 and 150 ppm Si experiments (compare Figs. 4d and 6f), with most of the silica particles unassociated with S. elongatus cells. This difference supports the fact that silica precipitation occurred mainly by heterogeneous nucleation and growth on cellular and inorganic surfaces in the 30 and 150 ppm Si experiments and by homogeneous nucleation and deposition of preformed silica particles in the 300 ppm Si experiment. These collective observations highlight the classic division between nucleation-dominated regimes at high supersaturation and growth-dominated regimes at low supersaturation. Indeed, the greater overall size range of the particles at lower Si concentrations may be attributed in part to Ostwald ripening, a process in which—at lower degrees of saturation (growth-dominated or equilibrium regimes)—larger particles continue to grow at the expense of smaller particles that dissolve despite solution saturation (see Boistelle and Astier, 1988, for review). These observations also correlate well with previous studies that have argued that silicification at hot spring systems, where silica concentrations do not typically reach 300 ppm Si, is enhanced by the presence of reactive cell surfaces (Phoenix et al., 2003; Yee et al., 2003; Benning et al., 2004a, 2004b; Konhauser et al., 2004; Lalonde et al., 2005, 2008a, 2008b), while deposition of preformed particles would be nonpreferential.
It is also worth noting that the presence of a layer of S. elongatus cells generally inhibited the formation of a laminated silica precipitate, relative to the experiments without cells. In particular, the 30 ppm Si and 150 ppm Si experiments did not result in the formation of well-defined silica layers, as most of the silica had precipitated on the cells or on the EPS mucus that binds them (Figs. 3b, 4c). Some thick silica deposits were seen from time to time for both silica concentrations (Figs. 3c, 4b) but were scarce in the 30 ppm Si experiment and insufficient to fill entirely the void space between cells in the 150 ppm Si experiment (Fig. 4c). In the 300 ppm Si experiment, silica not only filled this void space entirely (Fig. 6e) but also eventually completely entombed and covered the cells (Fig. 6d). Subsequent silica additions led to the formation of well-defined silica layers, similar to the experiment without cells, with uniform laminations and a progressive filling of one layer's porosity by silica coming from subsequent additions (Fig. 6b). Deposits that formed after successive cycles with 30, 150, or 300 ppm Si silica solution additions each reveal different stages or degrees of silicification, with a progression of silicification that depends on the concentrations added: at first precipitating directly on cells, then filling of voids between cells and eventual entombment.
A comparison of experiments with different initial silica solution concentrations but with the same total amount of silica added (e.g., 10 cycles with 30 ppm Si solution vs. 1 with 300 ppm Si solution) reveals that initial concentration also plays a role in the sinter structure and formation. With the same amount of silica, 10 additions of a 30 ppm Si silica solution only resulted in a small and heterogeneous precipitation of silica on S. elongatus cells and rare silica aggregates (Fig. 3c). By contrast, one addition of a 300 ppm Si solution entirely filled the void space between cells (Fig. 5b, 5c) but with no significant mineralization of the cells. Similar to the monitoring of the evolution of particle sizes, this suggests that in the 300 ppm Si experiment the high degree of oversaturation favored homogeneous nucleation and massive deposition as opposed to heterogeneous nucleation directly on the cell surfaces at 30 and 150 ppm Si.
4.2. Comparison with natural silica sinters
The experimental sinters described herein demonstrate several important commonalities with their natural counterparts, specifically their fabrics, cell mineralization, and microstructure. First, despite tightly controlled conditions, the experimental sinters displayed significant fabric heterogeneity, with styles of mineralization ranging from cell-surface attachment of sparse colloids and aggregates (Fig. 3c, 3d) to complete cell coverage (e.g., Fig. 4c, 4d) and eventually the complete encasement of the cells in a fine-grained mass of amorphous silica (e.g., Figs. 5, 6d, 6f). Similar degrees of heterogeneity are widely reported in natural sinters. For example, within the well-preserved late-Pleistocene Umuriki sinter (Taupo Volcanic Zone, New Zealand), Campbell et al. (2001) identified three general silica fabrics. They included (i) a fine-grained porous and friable fabric, (ii) a dense vitreous fabric, and (iii) a more crystalline fabric. All three fabrics were presumed original to early diagenesis and appear broadly equivalent to the mineralization styles observed in our experiment (Figs. 4c and 6d). The third fabric observed by Campbell et al. (2001) is more crystalline and represents later stage diagenesis; such diagenesis was precluded by our experiments and, accordingly, no such fabric was observed.
Second, cells completely encrusted in a fine-grained mass of amorphous silica appeared well preserved and without evidence for significant degradation (i.e., cell wall defect, dehydration, or collapse) (Figs. 3c, 4d, 6c). Due to the short duration of our experiment, however, it is difficult to estimate the effects of successive silica deposition and evaporation cycles on the long-term preservation of cells. Nonetheless, the different silicification patterns observed were similar to those that have been described from natural microfossils. The progressive covering of S. elongatus cells by the nucleation of fine-grained particles of silica on their walls, observed in the 30 and 150 ppm Si experiments (Figs. 3c, 4c), has previously been observed in numerous fossilization studies, performed in situ (Schultze-Lam et al., 1995; Cady and Farmer, 1996; Konhauser et al., 2001; Jones et al., 1998, 2001, 2003, 2004; Handley et al., 2005; Tobler et al., 2008) and in vitro (Oehler and Schopf, 1971; Oehler, 1976; Ferris et al., 1988; Birnbaum et al., 1989; Westall et al., 1995; Westall, 1997; Toporski et al., 2002; Lalonde et al., 2005; Orange et al., 2009, 2011). The complete entombment of the cells in a dense silica matrix observed in the 300 ppm Si experiment (Fig. 6d), and the formation of molds preserving the morphology of the cells (Fig. 6f), has also been widely described during the formation of silica sinters (Cady and Farmer, 1996; Jones et al., 1998, 2001, 2003, 2005; Kyle et al., 2007; Tobler et al., 2008; Parenteau and Cady, 2010). The absence of changes in the size and shape of these molds, despite repeated cycles of desiccation and silica addition, illustrates that dense silica deposits that form as a result of evaporation may be particularly resistant to mechanical deformation, as previously noted by Hinman and Lindstrom (1996) and Orange et al. (2013).
Third, structural analogies of the simulated sinter with their natural counterparts are limited to their microstructure. As previously mentioned, and as noted in our experimental simulations, the sinter microstructure can easily be influenced by the presence of microorganisms. In the absence of microorganisms (in the control experiments or in the 300 ppm Si experiment after complete entombment of the cells; Figs. 2a, 2f, 6b), the thin and regular micrometric laminae observed are similar to those reported for geyserites that form in proximity to alkaline hot springs where high temperatures prevent the development of microbial mats (Walter 1972, 1976a). Under such circumstances, lamination derives from the intermittent supply of silica (e.g., through splash during spring surges or geyser eruptions). In areas densely populated by microorganisms, micrometer-scale laminae are generally absent, and thicker laminated structures (tens to hundreds of micrometers thick) form as the result of daily or seasonal variations in microbial activity. Such is the case for many hot spring stromatolites, where lamination arises from an alternation of microbially mediated porous laminae and abiotically formed laminae, or an alternation between horizontally and vertically orientated silicified filamentous microorganisms (Walter, 1972; Walter et al., 1976; Hinman and Lindstrom, 1996, Jones et al., 1998, 2005; Konhauser et al., 2001; Handley et al., 2005; Berelson et al., 2011). The cell pellets used in our study were not an actively growing microbial community. Therefore, this prevented us from observing sinter structures such as laminae that form as a result of temporal variations in microbial growth (Berelson et al., 2011) or spicules that are usually found in hot spring pool inner rims and form by using microcolonies as templates (Handley et al., 2005; Schinteie et al., 2007).
With that said, by acting as a surface for heterogeneous nucleation of silica particles, S. elongatus cells proved to be influential on the deposition of silica and the fabrics of the sinter despite the short timescales of our experiments. For instance, the thick silica deposit that formed progressively in the 300 ppm Si experiment (Fig. 6b) included a heterogeneous layer that was strongly influenced by the presence of microorganisms and a more homogeneous layer that formed after complete entombment of microorganisms, thus bearing analogies with the natural laminated microstromatolites. In all cases (abiotic or microbially influenced sinter formation), the macrostructure is determined by environmental factors such as the location of the sinter with respect to the spring (pool, outer and inner rim, discharge apron, outflow channel), the spring style and activity (i.e., quiet, surging, boiling, geyser; Braunstein and Lowe, 2001), or other parameters (i.e., silica concentration, air temperature; Hinman and Lindstrom, 1996). All these factors have not been simulated in our experiments. Limitations in size and duration prevented us from observing the development of macrostructural features such as terraced, digitate, or columnar sinters (Jones et al., 1998; Braunstein and Lowe, 2001). A longer study, with a prolonged supply of dissolved silica, might possibly have led to the formation of such structures, as was the case in sinter growth studies performed in situ on glass substrates (Mountain et al., 2003; Handley et al., 2005; Tobler et al., 2008).
Finally, special consideration of natural and experimental silica deposition rates is warranted to better understand the applicability of experimentally generated silica sinter and silica biomineralization experiments in general to the context of natural settings. This work constitutes, to our knowledge, the first experimental study with the aim of ascertaining the importance of evaporative processes on the formation of some natural sinters (Jones et al., 1998; Braunstein and Lowe, 2001; Mountain et al., 2003; Handley et al., 2005; Schinteie et al., 2007; Tobler et al., 2008). Importantly, the relationship between the initial degree of silica supersaturation of a solution and its potential for silica deposition is significantly different between the scenarios of complete evaporation and simple re-equilibration of a saturated solution. Complete evaporation of a silica-bearing solution will lead to silica deposition regardless of initial saturation state, whereas for a solution that is simply re-equilibrating, deposition approaches zero as its initial composition approaches saturation. This relationship is demonstrated in Fig. 7, where silica deposition rates [in kg(SiO2)·yr−1·m−2] are plotted as a function of initial solution saturation state [expressed as log(Q/K)]. Q is the ion product of the equation SiO2+2H2O⇄H4SiO and is equal to [H4SiO4], and K is the solubility product, calculated from the equilibrium equation of Gunnarsson and Arnórsson (2000): log(K)=−8.476 − 485.24×T −1 − 2.268×10⁻⁶×T 2+3.068×log(T). Model lines corresponding to silica deposition after either complete evaporation (straight lines) or chemical equilibrium silica deposition (curved lines) are drawn by using the aforementioned equilibrium equation for calculating log(Q/K) and silica solubility at 20°C and 90°C and by using the parameters of our sinter growth experiments for calculating silica deposition rates for different initial silica concentrations in both cases of complete evaporation and chemical equilibrium. In highly silica-supersatured solutions, the precipitation of silica as the result of equilibration approaches the case of complete evaporation (upper right portion of the plot) as a greater proportion of the total silica is deposited. Also plotted are sinter growth rates and silica saturation parameters collected from field studies in New Zealand and Iceland (Mountain et al., 2003; Tobler et al., 2008). This representation puts into perspective the relationships between saturation state and silica deposition rate for both natural and experimental sinters. Experimental deposition rates were within the range observed for natural systems, and they span their saturation states. The lowest Si concentration experiment (30 ppm Si) is the only one that was initially silica-undersaturated and thus fell in the evaporation-only field (deposition below initial log Q/K=0). Natural systems with low deposition rates appear consistent with precipitation after physicochemical equilibrium, falling along curved lines (chemical equilibrium precipitation models). The deposition rates observed in the 150 and 300 ppm Si experiments, being close to physicochemical equilibrium line, appear to follow the trend of these natural systems. The most rapidly depositing natural sinters [>300 kg(SiO2)·yr−1·m−2] fall to the right of model lines, indicating anomalously fast precipitation; this may be due to additional parameters (notably cooling) that were not considered (cf. difference between 20°C and 90°C model lines).
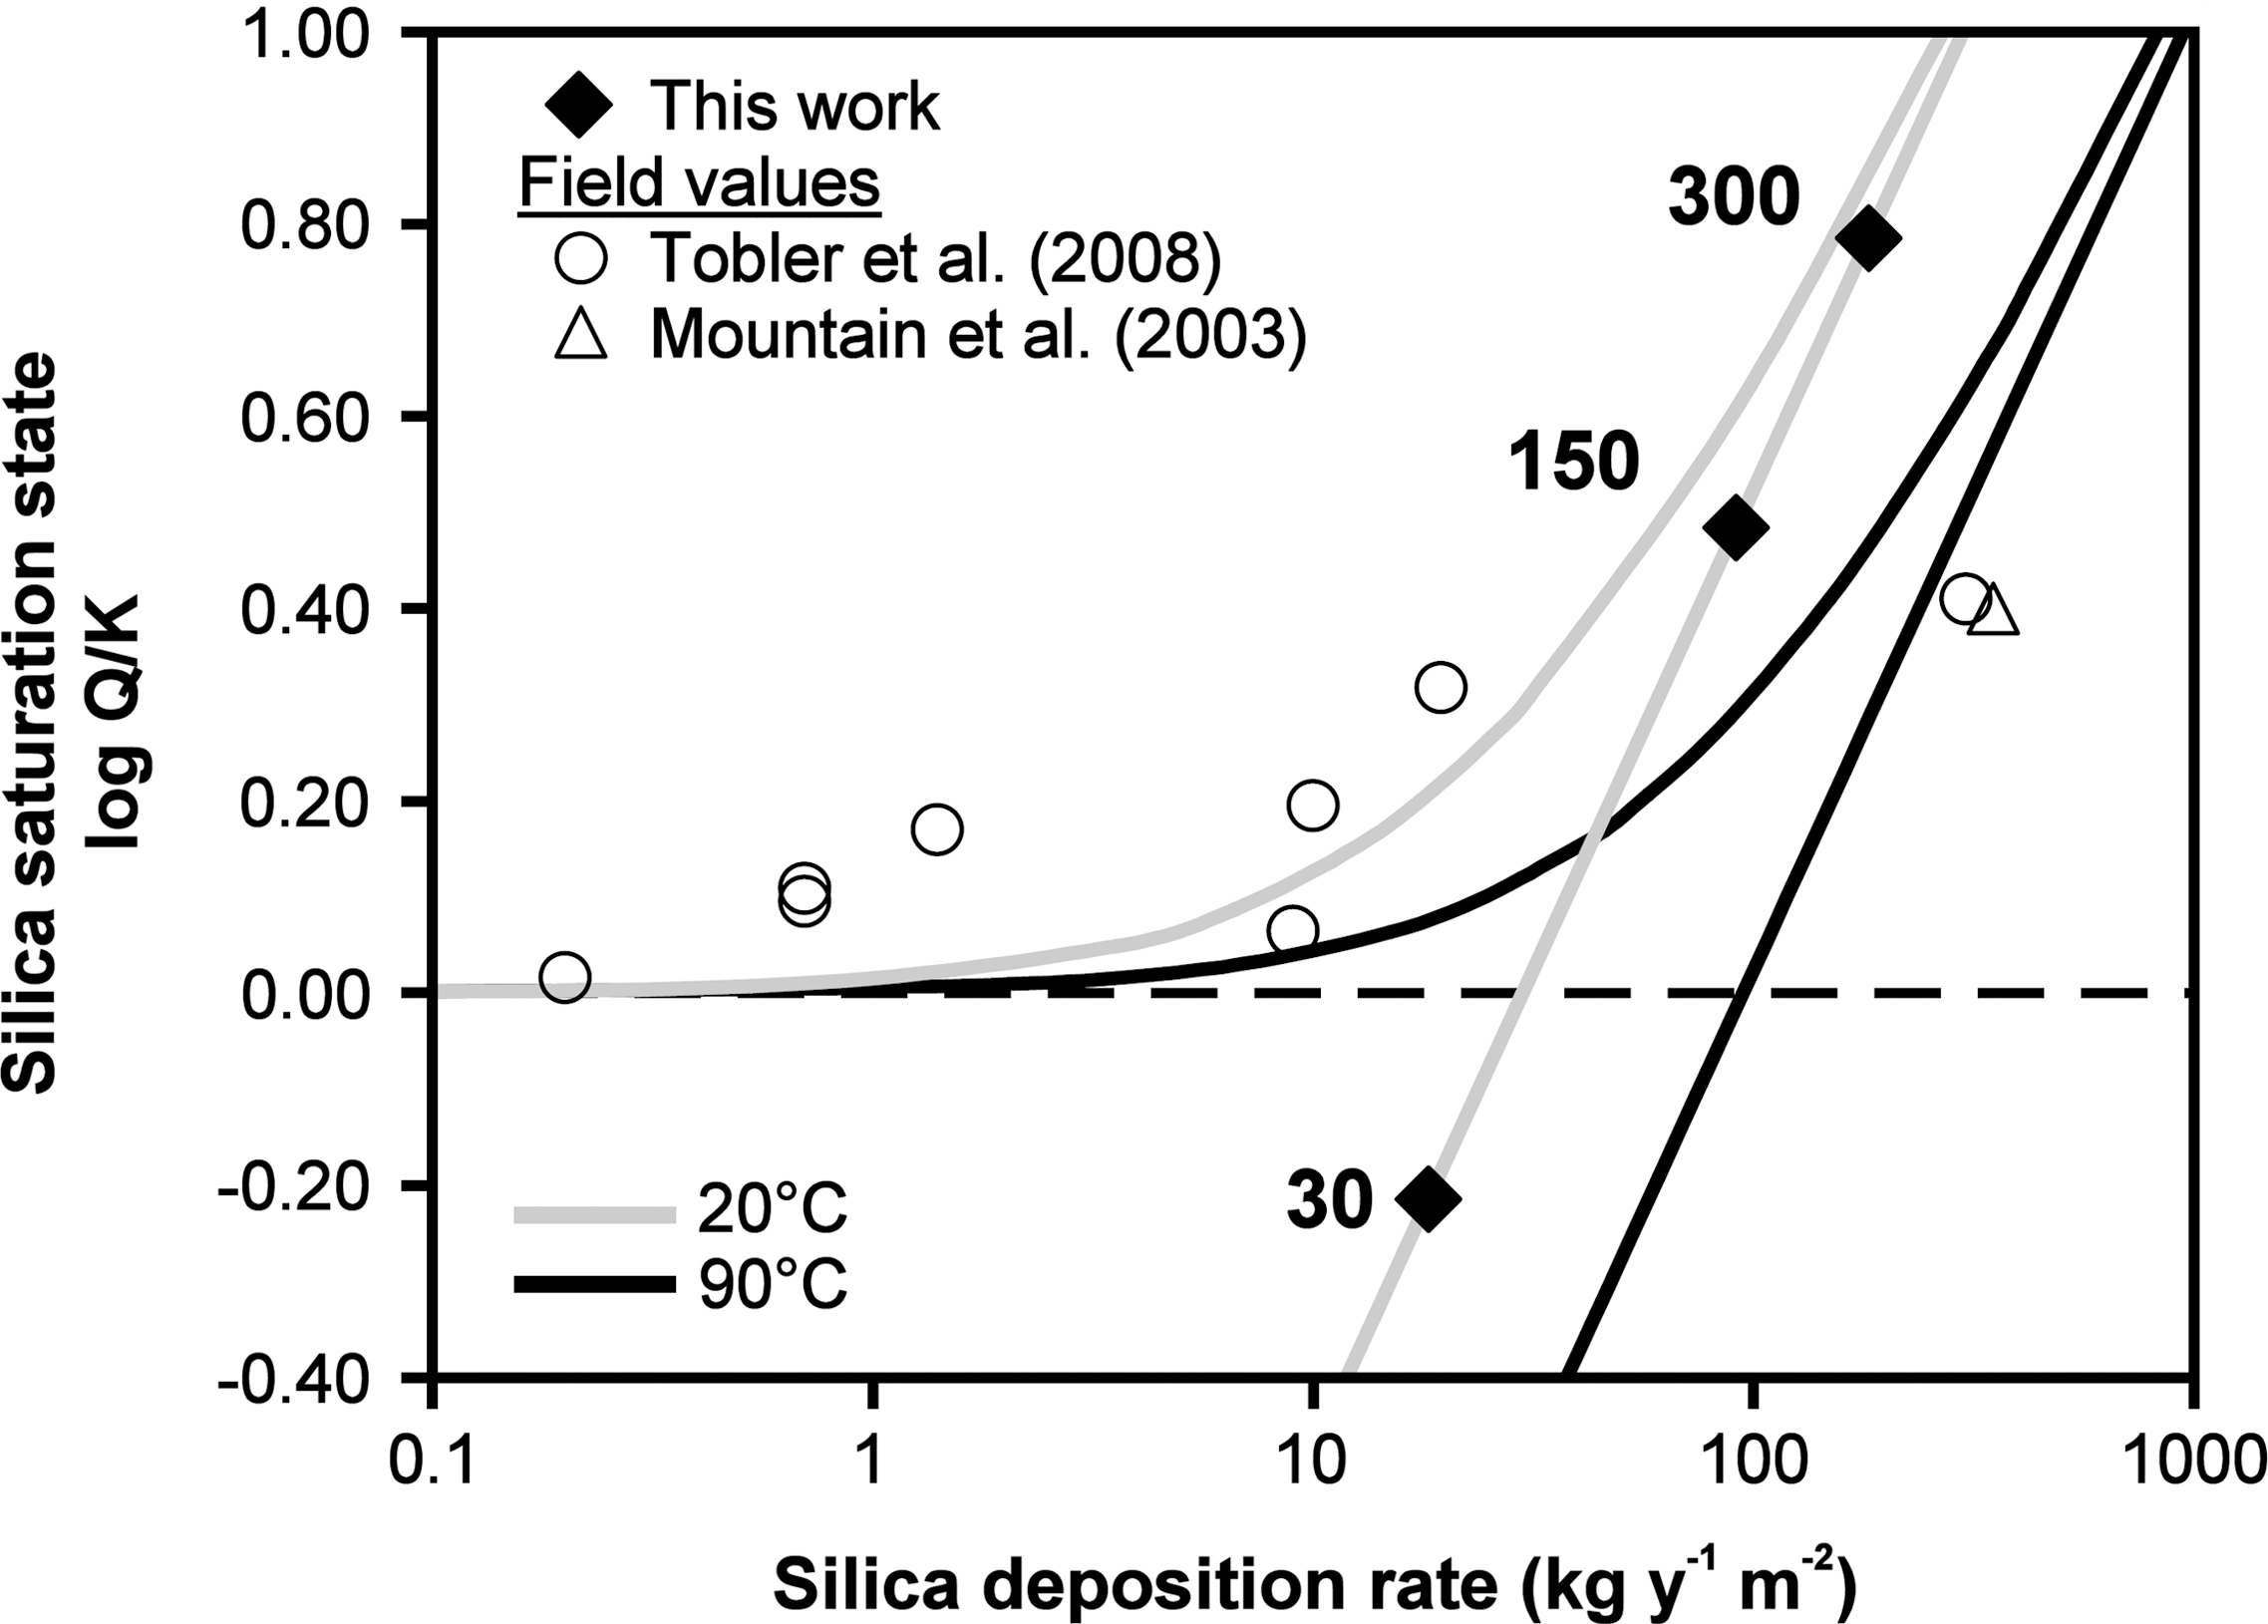
Calculated silica deposition rates for equilibrium precipitation from supersaturated solutions (curved lines) and after complete evaporation (straight lines) as calculated for two temperatures (20°C, gray lines; 90°C, black lines). Data points represent natural examples where sinter deposition rates were published (circles and triangle; Mountain et al., 2003; Tobler et al., 2008) and the experimental sinters described herein (30, 150, 300 ppm Si experiments, black diamonds). See text for further explanation.
In addition, the thickness of the sinter obtained at the end of the 300 ppm Si experiment (3–6 μm) would translate into an annual growth of ∼0.1 mm/yr. This value is lower than the value measured in natural sinters, such as 0.2–0.9 mm/yr at Champagne Pool, New Zealand (Jones et al., 1999); 0.45–0.9 mm/yr at Krisuvik hot spring, Iceland (Konhauser et al., 2001); 0.5–1.0 mm/yr at Yellowstone National Park, USA (Braunstein and Lowe, 2001); ∼1 mm/yr at Warakei, New Zealand (Smyth et al., 2003); <1 mm/yr to 24 mm/yr at various Yellowstone hot springs (Hinman and Lindstrom, 1996); and 10–50 mm/yr at Obsidian Pool Prime, Yellowstone, USA (Berelson et al., 2011). The differences in deposition rates between our experiments and natural sinters is not surprising and may be explained by several factors. First, our experiments represent discrete simulations (e.g., 10×36 h cycles) of natural sinter growth that may be continuous or punctuated in nature (e.g., Berelson et al., 2011). They thus lack the variability and complexity of environmental conditions, particularly as relating to silica input during subaerial sinter growth (e.g., waves, splashes; capillary action; Hinman and Lindstrom, 1996; Mountain et al., 2003; Handley et al., 2005), pH changes (solubility calculations of Fig. 7 are only valid for pH <9 where H4SiO4°>>H3SiO4 −), and temperature (all experiments in the current study were performed at room temperature). Second, our experiments also did not involve the continuous flow of silica-saturated waters above the sinter surface for a 1 yr period, with which to better compare our results to natural hot springs. Nonetheless, the consideration of precipitation rates as in Fig. 7 represents a first step toward better calibrating or evaluating experimental silicification studies in the context of their natural counterparts.
5. Conclusion
Despite limitations in time and space, this study has successfully recreated and examined some of the basic processes relating to silica sinter formation in a hot spring system as a result of evaporation and under the influence of a common sinter-containing cyanobacterium. In the absence of microorganisms, successive addition and evaporation of silica solutions led to the formation of laminated deposits made of fine-grained silica particles, irrespective of the initial silica concentration used. Subsequent cycles of silica addition infilled the void spaces of previously deposited layers, thus resulting in a denser matrix. By contrast, the presence of S. elongatus cells greatly disturbed the formation of laminated deposits. Sinters with different structures were obtained depending on the initial silica concentration. For undersaturated and moderately oversaturated solutions (30 and 150 ppm Si, respectively), silica precipitated mainly on S. elongatus cell walls and EPS, resulting in a disorganized and porous sinter. Cells were efficiently silicified and progressively covered by silica particles. For the most oversaturated experimental condition (300 ppm Si), the resulting sinter matrix was dense, with silica infilling the void spaces between cells and resulting in their complete entombment despite limited direct cell surface silicification. Importantly, not only were these differences related to differences in the amount of silica added between each experiment, but they were also due to accompanying differences in the mechanisms of silica precipitation. In undersaturated and moderately oversaturated solutions, silica seemed to have precipitated mainly by heterogeneous nucleation on available surfaces (cell surface, silica particles), while in the highly oversaturated silica solution, deposition of silica particles that were preformed in suspension was favored. The sinters obtained through these simple experiments show numerous similarities with their natural counterparts, especially regarding their fabrics, microstructure, extent of microbial silicification, and silica deposition rate. These experiments enhance our understanding for silica sinter development and thus represent an important complement for in situ sinter growth studies. They also set the stage for subsequent experiments designed to examine a wider range of environmental conditions or longer episodes of silicification.
Footnotes
Acknowledgments
The authors thank Dr. George W. Owttrim and Dana Chamot (Department of Biological Sciences, University of Alberta) for providing the cyanobacteria fresh cultures, De-Ann Rollings and George Braybrook (Scanning Electron Microscope Laboratory, Department of Earth and Atmospheric Sciences, University of Alberta) for their help with the SEM, and the two anonymous reviewers for their helpful comments on this manuscript. F.O. was funded by the European Science Foundation ArchEnviron Exchange Grant #2723, and S.V.L. and K.O.K by the Natural Sciences and Engineering Research Council of Canada.
Abbreviations
EPS, extracellular polymeric substance; SEM, scanning electron microscope.