
Abstract
Permeation of aldopentoses and nucleosides through fatty acid and phospholipid membranes was investigated by way of molecular dynamics simulations. Calculated permeability coefficients of membranes to aldopentoses, which exist predominantly in the pyranose form, are in a very good agreement with experimental results. The unexpected preferential permeation of ribose, compared to its diastereomers, found by Sacerdote and Szostak, is explained in terms of inter- and intramolecular interactions involving hydroxyl groups. In aqueous solution, these groups favor the formation of intermolecular hydrogen bonds with neighboring water molecules. Inside the membrane, however, they form intramolecular hydrogen bonds, which in ribose are arranged in a chain. In its diastereomers this chain is broken, which yields higher free energy barrier to transfer through membranes. Faster permeation of ribose would lead to its preferential accumulation inside cells if sugars were converted sufficiently quickly to nonpermeable derivatives. An estimate for the rate of such reaction was derived. Preferential accumulation of ribose would increase the probability of correct monomers' incorporation during synthesis of nucleic acids inside protocells. The same mechanism does not apply to nucleosides or their activated derivatives because sugars are locked in the furanose form, which contains fewer exocyclic hydroxyl groups than does pyranose. The results of this study underscore concerted early evolution of membranes and the biochemical processes that they encapsulated. Key Words: Ribose—Aldopentoses—Nucleosides—Membrane permeability—Protocells. Astrobiology 13, 177–188.
1. Introduction
Vesicles were nothing more than envelopes containing molecules needed for chemical reactions that supported the self-maintenance, growth, and evolution of primordial cells. These reactions, which constituted the primordial metabolism, required a supply of organic material from the environment. In contemporary cells, this material is delivered through either unassisted permeation or protein-mediated passive or active transport across cell walls. In early ancestors of cells, unassisted permeation dominated since it is unlikely that complex transmembrane protein assemblies capable of assisting transport of solutes were already present. Considering that only a small subset of molecules that might have been created by prebiotic chemistry is utilized in biological systems (e.g., only specific isomers are the constituents of biopolymers), any transport mechanism that gives selective advantage to molecules of life is of inherent interest to protobiology.
One such mechanism was recently discovered. Sacerdote and Szostak (2005) observed that ribose permeated walls of vesicles on an order of magnitude faster than its diastereomers (arabinose and xylose). The effect was independent of membrane-forming material and applied to both fatty acid and phospholipid membranes. This finding is significant because it implies a kinetic mechanism for preferential incorporation of ribonucleotides into nucleic acids in a protobiological environment in which aldopentoses existed as a mixture of diastereomers (Sacerdote and Szostak, 2005). Via this mechanism, ribose would be supplied more quickly to primordial cells for synthesis of nucleotides and their subsequent polymerization. As long as the chemical reactions required for polymerization proceeded sufficiently fast, the excess of ribo-derivatives inside protocells would persist. If, on the other hand, membranes were equally permeable to different diastereomers of aldopentoses, or the sugars were used only slowly, their concentrations inside and outside protocells would reach an equilibrium state. This, in turn, would markedly increase the probability of incorporation of incorrect nucleotides into the growing nucleic acid chain, thus causing termination or stalling of elongation, or strains in the chain subsequently resulting in single-strand nicks (Hayakawa et al., 1998; Azuma et al., 2001; Sampath et al., 2003). In fact, the latter mechanism is believed to form the basis for the anti-cancer and anti-viral activity of arabononucleotides (Grant, 1988; Cheson et al., 1997).
Considering the structural similarities between different aldopentoses, the observed differences in membrane permeabilities are quite unexpected. In fact, the empirical methods employed broadly within the pharmaceutical industry to predict membrane permeabilities to different solutes (mostly on the basis of estimating their water/octanol or water/oil partition coefficients) uniformly fail to predict this effect (Sacerdote and Szostak, 2005; Wei and Pohorille, 2009). This indicates that molecular bases for the effects are not captured in these methods, even though they take into account a number of important determinants of permeations, such as solute size, solvent-exposed surface, and polarity of individual chemical groups, and have been parametrized and tested for a very large database of compounds.
In this paper, we describe results of atomic-level computer simulations that explain why ribose permeates membranes faster than its diastereomers. Next, we present a simple kinetic model aimed at determining reaction rates for processing aldopentoses inside a protocell, rates necessary to preserve an excess of ribose. Finally, we consider an alternative scenario in which nucleosides, rather than sugars, permeate protocellular walls from the environment and ask whether the same preferences apply. We demonstrate that these considerations impose concrete constraints on scenarios for the primordial polymerization of nucleic acids.
2. Computational Methods
2.1. Description of the simulated systems
The solutes of interest were studied in three environments. One was the water-oil interface. To simulate sugars, this system consisted of 66 hexadecane and 988 water molecules placed in a simulation box of dimensions 30 Å×30 Å×72 Å. The interface was in the x, y plane. The thicknesses of the water and hexadecane phases (in the z direction) were 30 and 42 Å, respectively. Nucleosides were simulated in a box of dimensions 29 Å×29 Å×79 Å. It contained 106 decane molecules and 988 water molecules. The sizes of the boxes were chosen to reproduce experimental bulk densities of water, hexadecane, and decane.
The remaining two systems consisted of hydrated bilayers that extended in the x and y directions. One bilayer was built of 100 molecules of oleic acid in each leaflet, for a total of 200 molecules. Oleic acid (OA) was a 1:1 mixture of neutral and protonated forms, which is the expected equilibrium state at the experimental conditions of pH=8.5 and room temperature (Cistola et al., 1986). On both sides the bilayer was in contact with the water phase containing 4528 molecules. This system was enclosed in a simulation box of dimension 57.4 Å×57.4 Å×71.2 Å. This corresponds to the surface area per OA molecule of 33 Å2 estimated on the basis of NMR data (Cistola et al., 1986). Magnesium ions were used as counter ions to ensure electroneutrality of the system. Fifty neutralizing Mg2+ ions were located in water near the headgroup regions on both sides of the OA bilayer. In addition, the system contained one Mg2+ ion and two Cl− ions placed in bulk aqueous solution. This corresponds to a 48 mM ionic strength of MgCl2 buffer in the bulk water region, which is a few times larger than the ionic strength established in experiments (Chen et al., 2005; Mansy et al., 2008). The second bilayer, approximately 30 Å thick, was built of 1-palmitoyl-2-oleoyl-sn-glycero-3-phosphocholine (POPC) lipids. To study sugar permeation, the system consisted of 26 phospholipids and 1858 water molecules. For nucleosides, due to their larger size, a larger system was simulated; it comprised 142 POPC molecules and 5903 water molecules. The corresponding system sizes were 30 Å×30 Å×62 Å and 69 Å×69 Å×72 Å, respectively. In both cases, the surface area per lipid molecule was kept at the experimental value of 68.3 Å2 (Kucerka et al., 2005). Periodic boundary conditions were applied. This is the standard procedure to simulate macroscopic systems.
The sugars considered in this study were ribose and its two diastereomers, arabinose and xylose. The nucleosides were riboadenosine (rA) and arabinoadenosine (aA). All these compounds were simulated in the water-oil system and in the POPC membrane. Only ribose and arabinose were studied in the bilayer made of OA.
2.2. Molecular dynamics simulations
All simulations were carried out by using the molecular dynamics (MD) method. In this method, Newton's equations of motion are solved numerically for all the atoms in the system by way of an iterative procedure. From the positions, velocities, and forces acting on the atoms at time t, new positions and velocities at time t+Δt can be calculated if the forces do not change appreciably during the small interval, Δt, which was equal to 10−15 s. By repeating this procedure many times, we obtained time histories of the systems, called trajectories, whose total length varied from 3.5×10⁻⁸ s for sugars at the water-oil interface to 5×10⁻⁷ s for nucleosides in the POPC system. At each time step, the forces acting on every atom of the system—due to interactions with all other atoms in the system—need to be calculated. These forces, obtained by using the CHARMM force field for fatty acids, phospholipids, carbohydrates, nucleosides, and ions (Ha et al., 1988; Schmidt et al., 1996; MacKerell et al., 1998), contain contributions from the stretching of chemical bonds, the bending of bond angles, the rotation around dihedral angles, and the electrostatic and van der Waals interactions between nonbonded atoms. Water molecules were represented as the TIP3 model (Jorgensen et al., 1983). In MD simulations, no additional assumptions about the mechanism of solute permeation through membranes are necessary. To improve the efficiency of calculations, long-ranged, electrostatic interactions were evaluated using the Particle Mesh Ewald method. Slowly changing, long-ranged forces were updated every four time steps. The simulations were carried out in the NPT ensemble, in which pressure and temperature were set at 1 atm and 303 K, respectively. The NAMD suite of programs (Phillips et al., 2005) was used for this purpose.
2.3. Free energy calculations and membrane permeability
The primary goal of the simulations was to calculate changes in the free energy of the solutes, A(z), as a function of their position along the z coordinate perpendicular to the water-oil interface or the plane of the bilayer. A(z) was calculated using the Adaptive Biasing Force method (Darve and Pohorille, 2001; Darve et al., 2008) implemented in NAMD (Hénin and Chipot, 2004), in which an estimate of the position-dependent thermodynamic force is subtracted from the instantaneous force acting along the order parameter in an adaptive manner. This approach guarantees nearly optimal efficiency of free energy estimations. Statistical errors associated with the calculated free energies were estimated by using the approach described by Rodriguez-Gomez et al. (2004).
From A(z) determined across the water-oil interface in the range extending from bulk water to bulk oil, the water/oil partition coefficient, p
w/o, was calculated as
where ΔA
w/o is the free energy difference between the solute in bulk water and oil, k
B is the Boltzmann constant, and T is temperature. For the water-bilayer systems, A(z) extending from bulk water to the center of the bilayer was obtained. In analogy to Eq. 1, concentration of the solute, c(z), relative to that in bulk water, c
w, as a function of solute position along z, is given as
A(z), measured with respect to the solute free energy in water, is also used to calculate membrane permeability, P
m, from the formula (Marrink and Berendsen, 1994)
where D(z) is the diffusion coefficient in the direction perpendicular to the membrane surface, which can be estimated from the autocorrelation function of random force (Kubo, 1966), as described previously (Wei and Pohorille, 2009). D(z) is position-dependent because the environment of the solute is anisotropic and heterogeneous. The limits of integration z 1 and z 2 are located in bulk water on opposite sides of the bilayer, and A(z) is considered symmetric with respect to the plane at the center of the bilayer.
3. Results
3.1. Sugar permeation through membranes
3.1.1. Conformations of aldopentoses in aqueous and oily phases
Aldopentoses, such as ribose, arabinose, and xylose considered in this study, adopt a number of structural forms (Rao et al., 1998). These sugars can exist in the D or L forms, which are structurally analogous to D- or L-glyceraldehyde, respectively. To be consistent with the permeability experiments (Sacerdote and Szostak, 2005), we consider only the D form. The sugars can adopt the five-membered (furanose) or the six-membered (pyranose) cyclic form, or the linear form. The cyclic forms can exist either as α- or β-anomers, defined by the direction of the anomeric hydroxyl group. Using the Haworth projection convention (Haworth, 1929) for the D form, this hydroxyl group points up in the α configuration and down in the β configuration. Both five-member and six-member rings can exist in a number of nonplanar conformations. Furanose rings undergo pseudorotation and exist most frequently in 2′-endo or 3′-endo conformations, which dominate in RNA and DNA, respectively. For the pyranose ring, the most common are chair conformations. Other conformers, such as boat, skew, half-chair, and envelope are rare, and so is the linear, acyclic structure. In addition, hydroxyl groups rotate around the C–O bond, preferentially adopting staggered trans (t), gauche+ (g+), or gauche− (g−) conformations. A number of different structures of aldopentoses are shown in Fig. 1.
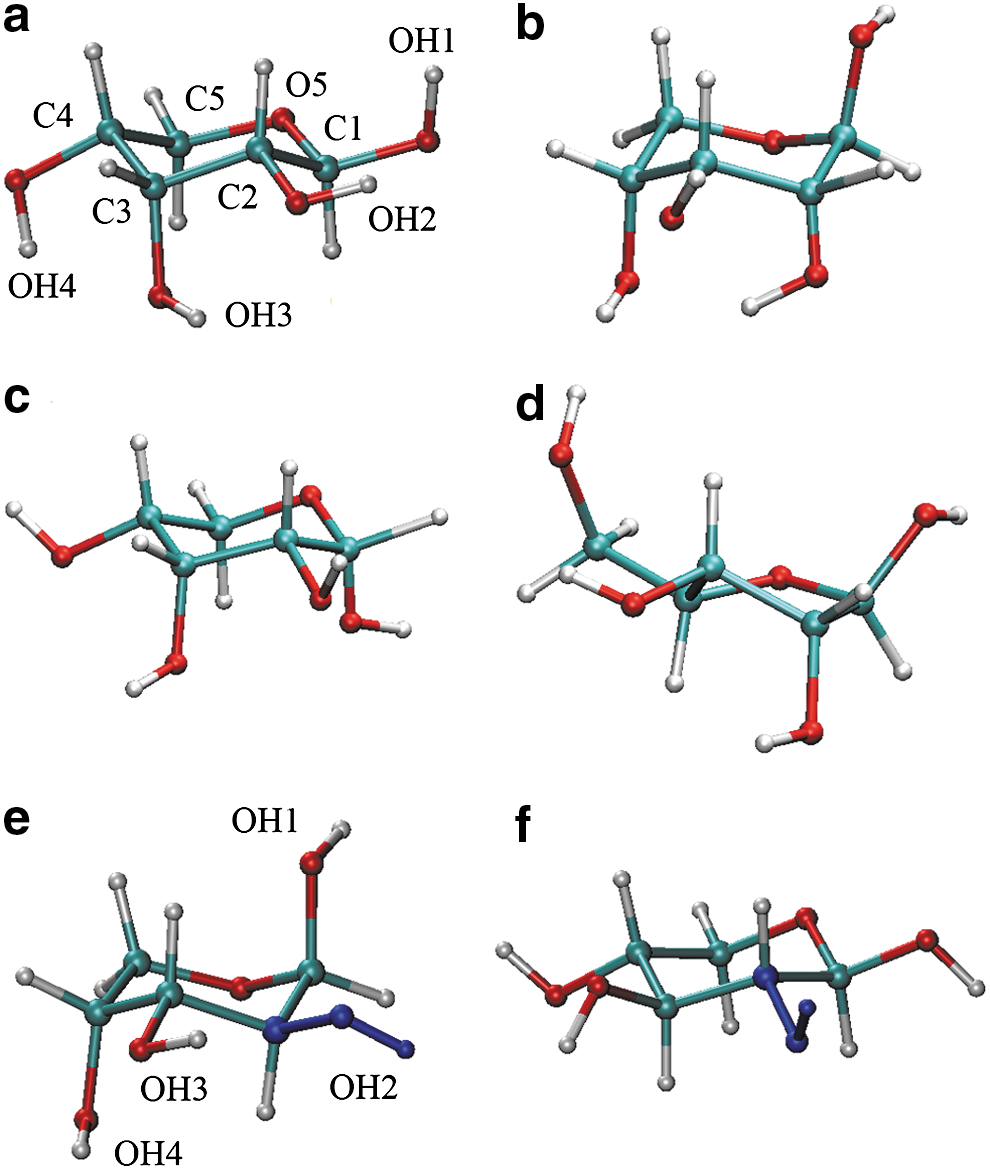
Ball-and-stick representations of sugar molecules in different conformations. Ribose: (
Pseudorotation of the furanose ring and rotations of exocyclic hydroxyl groups occur at short timescales and can be readily captured in MD simulations. In contrast, different conformations of the pyranose ring are often separated by high free energy barriers and, therefore, transitions between these conformations are observed only rarely in simulations. Isomerization of anomers is even slower; the process takes much longer than other structural transitions or sugar permeation through membranes (Acree et al., 1969; Wertz et al., 1981; Snyder et al., 1989). Moreover, it involves breaking and forming chemical bonds that cannot be satisfactorily described using classical MD. Accounting for multiple, slowly interconverting structures of aldopentoses might greatly complicate calculations of their permeation through membranes. For this reason, it is essential to determine which of these structures are sufficiently populated in water and in nonpolar, oily phases to be relevant to the problem at hand.
Populations of different forms of aldopentoses in aqueous solution were determined experimentally (Rudrum and Shaw, 1965; Lemieux and Stevens, 1966; Angyal, 1984; Franks et al., 1989), and are collected in Table 1. In all cases, the pyranose structure dominated. An appreciable population of the furanose form (22%) was observed only for ribose (Angyal, 1984; Franks et al., 1989). For all three sugars considered in this study, both α- and β-anomers were identified. The former was preferred for arabinose, whereas the latter was more frequent in ribose and xylose. The dominant conformations of the pyranose ring in arabinose and xylose were 1C4 and 4C1 chair conformations, respectively. β-ribopyranose was found to exist as a mixture of these two forms in an approximately 1:3 ratio. For α-ribopyranose, only 4C1 conformation was identified.
The free energy difference, ΔA, between sugars in different conformations is also listed.
The quantities directly relevant to permeabilities, however, are not the populations of different structures in water but the populations in nonpolar phases. Although experimental data for these populations are not available, they can be estimated through combining calculated free energies,
where
From Table 1 it follows that the 4C1 conformation of β-pyranose, which is preferred in water for both ribose and xylose, is even more favored in nonpolar phases. Thus, for these two compounds, it is sufficient to consider permeation of only the β-pyranose form through membranes. For arabinose, the lowest ΔA w/o also corresponds to the 4C1 chair of β-pyranose, which again means that its population in oil is higher than it is in water. In contrast to ribose and xylose, however, the population of the 4C1 chair in aqueous solution is quite low, as it is not detected in NMR measurements (Rudrum and Shaw, 1965; Lemieux and Stevens, 1966), which have the estimated sensitivity of 2% (Franks et al., 1989). Even though this population increases in oil, it still remains well below the populations of the 1C4 chair of α- and β-pyranose, which are nearly the same. In principle, both forms should be considered further. From statistical mechanical considerations, however, it follows that assuming the existence of only one form with the combined population provides a satisfactory approximation to calculating permeabilities. We adopt this approximation by choosing the 1C4 chair of β-pyranose for further studies.
For several minority conformers that are not observed in water even in trace amounts and, therefore, are populated at less than 2%, no calculations were carried out. One might suggest that the minority conformers could become sufficiently populated in the nonpolar phase and thereby compete with the majority conformers. This would require that the water/oil partition free energy of these minority components be lower than the corresponding free energy of the majority components by at least 1.8–2.0 kcal/mol. Such large, relative stabilization in oil is highly unlikely, especially given that many minority conformers are α-anomers, which whenever calculated have a partition free energy higher than the corresponding β-anomers. Other minority conformers are furanoses. Again, their relative stabilization in oil is not probable for the reasons explained further in the paper.
3.1.2. Free energy profiles of sugars across membranes and membrane permeabilities
For the selected sugar structures we calculated the free energy profiles, A(z), of their transfer from water to the center of membranes made of POPC or OA. The corresponding concentration profiles, c(z)/c w, obtained from Eq. 2 are shown in Fig. 2. All exhibit the same pattern; they remain nearly constant in water but monotonically decrease from the water-membrane interface to the center of the bilayer. This pattern, also observed for a large number of other solutes, was explained in previous studies (Pohorille and Wilson, 1996; Pohorille et al., 1998, 1999), and its significance for the origin of life was discussed (Pohorille and Wilson, 1995; Griffith et al., 2012). As shown in Fig. 3, all sugars exhibit a parallel orientation to the membrane surface at the interface but exhibit a perpendicular orientation to the membrane surface inside the bilayer. This orientation minimizes disruptions to the arrangement of hydrocarbon chains in the interior of the bilayer.
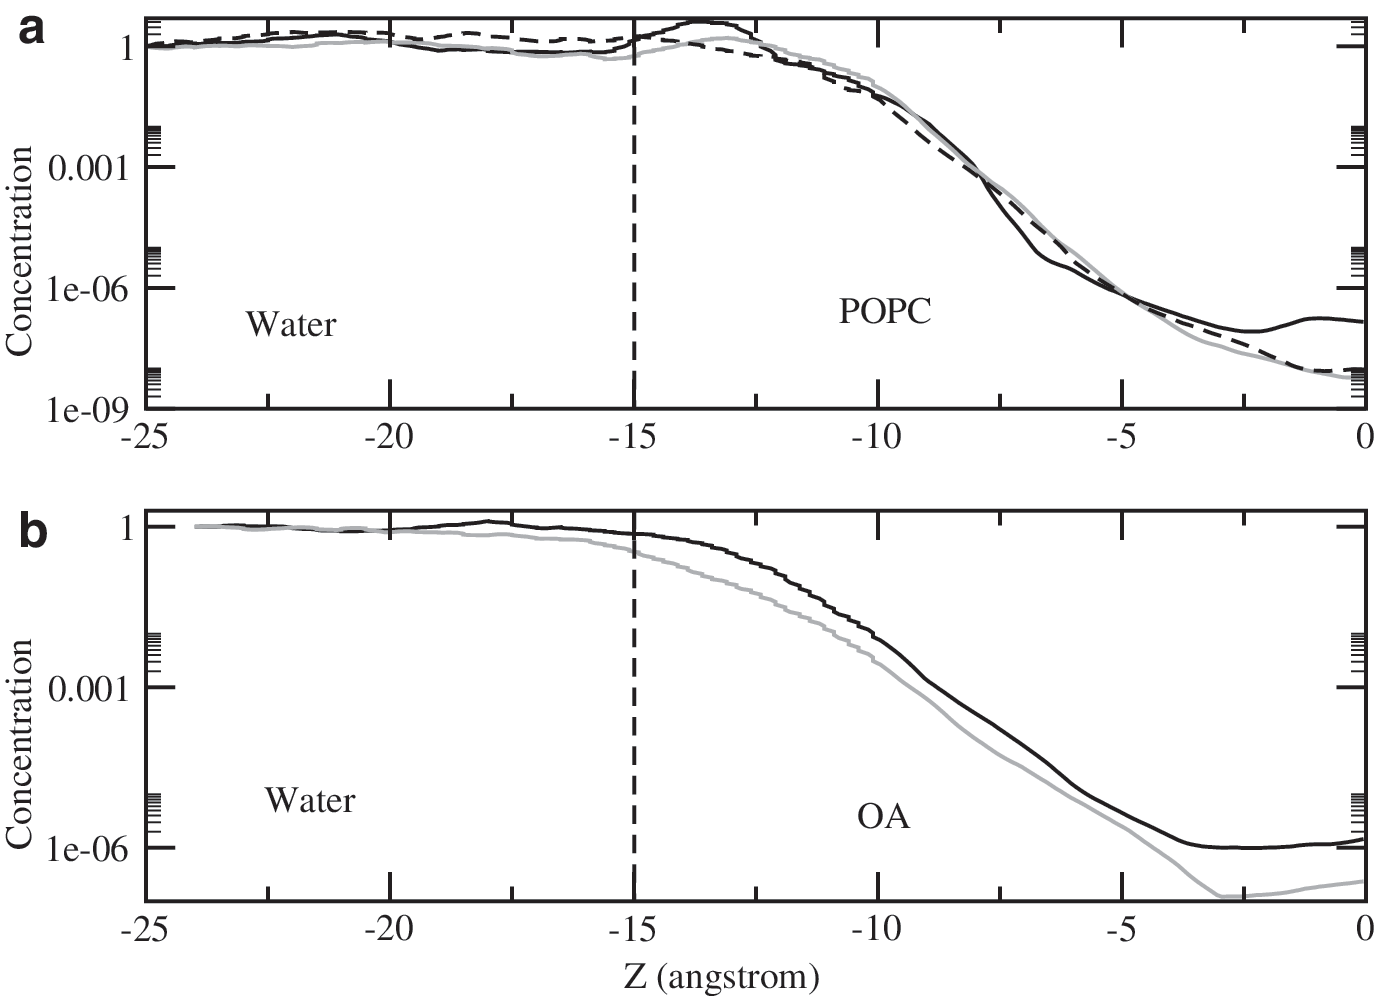
Concentrations of aldopentoses as a function of their position with respect to the water-POPC (
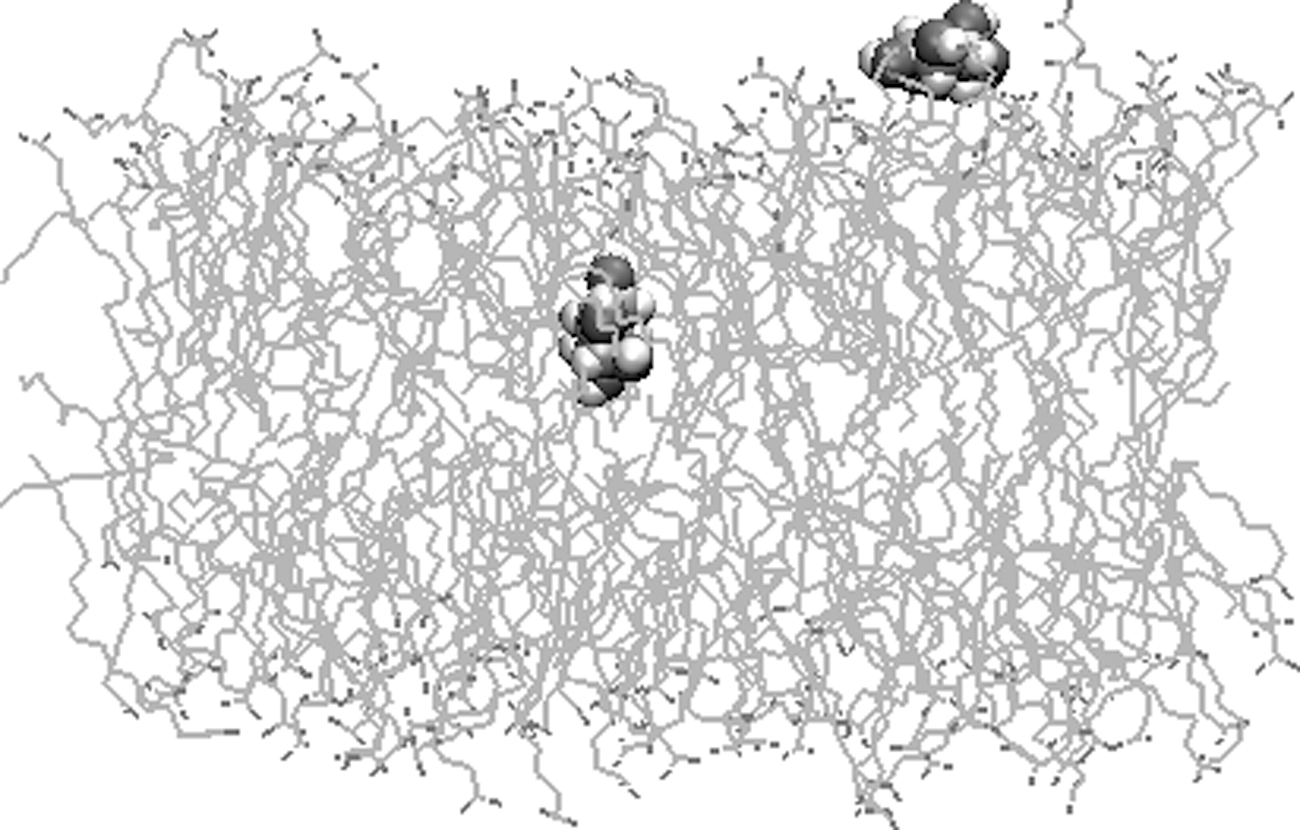
Snapshot of a ribose molecule at the interface and at the center of an oleic acid membrane.
The free energy barrier, ΔA w/b, to transferring a solute through the membrane (i.e., the free energy difference between a solute in bulk water and in the center of the bilayer), is the lowest for ribose. In the oleic acid membrane, it is equal to 8.2±0.1 kcal/mol, compared to 9.4±0.1 kcal/mol for arabinose. In the POPC membrane, ΔA w/b is equal to 9.5±0.2, 11.2±0.2, and 10.9±0.3 kcal/mol for ribose, arabinose, and xylose, respectively. The free energy barrier is markedly higher for furanose than pyranose, with ΔA w/b equal to 16.4 kcal/mol for β-ribofuranose.
Calculating membrane permeabilities requires the knowledge of not only A(z) but also the diffusion coefficient, D(z). For ribose, the diffusion coefficient in water is equal to 5.4×10⁻⁶ cm2/s. It decreases to 0.6×10⁻⁶ in the interfacial region of the POPC membrane and then increases slightly to 1.1×10⁻⁶ cm2/s in the center of the bilayer. Similar changes in D(z) were observed in other simulations of solute permeation across membranes (Marrink and Berendsen, 1994; Marrink et al., 1996; Xiang and Anderson, 2006). D(z) for arabinose and xylose was assumed to be the same for ribose. The diffusion coefficient in the OA membrane was also assumed to be similar.
Once both A(z) and D(z) are known, the permeability coefficient can be calculated from Eq. 3. The results of these calculations and the corresponding experimental values are summarized in Table 2. For the POPC membrane, the agreement between the calculated and measured absolute and relative permeabilities is very good, remaining within the error range associated with both these quantities. For OA membranes, the calculated relative permeabilities are also in very good agreement with experimental values, but their absolute values are uniformly larger by approximately an order of magnitude. It should be kept in mind that the relative rather than absolute values are of interest here. Both computations and measurements indicate that POPC and OA membranes are more permeable to ribose than arabinose and xylose by nearly an order of magnitude.
The values in parentheses are relative permeability coefficients with respect to P m to ribose.
Even though the focus of this study is on relative permeabilities, the discrepancy between the calculated and measured values of P m for the OA bilayers is of some concern, especially if it reflects inaccuracies in potential functions used to describe interactions of sugars with other components of the systems. We investigated this possibility in a series of additional simulations. Specifically, we calculated the water/octanol partition coefficient of ribose, P w/o, which is known from experimental studies (Hansch et al., 1995). This was done by using the free energy perturbation approach following previously described procedures (Pohorille et al., 2010). The calculated and measured logs, P w/o, are −2.96 and −2.32, respectively. This difference was expected because simulations were carried out for pure octanol, whereas water-saturated octanol was used in the experiment. Next, we calculated the permeability of the myristoleic acid bilayer to ribose. This was found to be larger than the permeability of the OA membrane by a ratio of 2.2, in a very good agreement with the ratio of 2.8 determined experimentally (Mansy et al., 2008). Then, we calculated the permeabilities of POPC and OA membranes to glycerol. In POPC, the calculated and measured (Sacerdote and Szostak, 2005) permeabilities agree to a factor of 2, which is within errors associated with these quantities. However, calculated permeability of the OA membrane was again overestimated by more than an order of magnitude. Finally, we examined the effect of buffer on OA permeabilities. This issue might be of some concern because fatty acid vesicles become unstable at high concentrations of divalent ions (Chen et al., 2005). Thus we calculated the free energy barrier to permeation of glycerol through OA membranes in the presence of neutralizing ions but in the absence of the buffer. The barrier of 7.24 kcal/mol is indistinguishable from the barrier of 7.35 kcal/mol obtained in the presence of the buffer. Insensitivity of permeation through the OA bilayer to low concentrations of Mg2+ was observed by Mansy et al. (2008, see Fig. S1). We also substituted Na+ for Mg2+ throughout the system in the 2:1 ratio to conserve electroneutrality, and calculated the free energy barrier to permeation of ribose. Again, the barrier remained unchanged (8.1 vs. 8.2 kcal/mol), indicating that the nature of counterions does not affect simulated permeation rates. These results do not point to any substantial inaccuracies in potential functions or inadequate choice of counterions. Instead, results appear to indicate that the problem is associated with fatty acid membranes rather than with a specific solute. It is possible that permeation properties of simulated fatty acid membranes and fatty acid vesicles studied experimentally are slightly different.
Both OA and POPC membranes are more permeable to ribose than to arabinose or xylose. This is because the free energy barrier to transferring ribose across these membranes is lower than the corresponding barrier for its diastereomers. The same tendency is observed for the transfer of aldopentoses across a water-hexadecane interface. As can be seen in Table 1, the lowest ΔA w/o is found for ribose. These results suggest that preferential partition of ribose is not characteristic of a specific bilayer but instead is common to all hydrophobic phases.
3.1.3. Why are membranes more permeable to ribose than to its diastereomers?
Faster permeation of ribose can be explained through the conformational analysis of exocyclic hydroxyl groups. In aqueous solution, the distribution of the rotamers in all three sugars is quite broad, as most staggered conformations are significantly populated. Some combinations of rotamers lead to the formation of intramolecular O–H…O hydrogen bonds between hydroxyl groups attached to two consecutive carbon atoms of the pyranose ring. Most combinations, however, do not yield such interactions. Instead, exocyclic hydroxyl groups form hydrogen bonds with surrounding water molecules, as water is known to be an excellent donor and acceptor of hydrogen atoms in such bonds. In nonpolar phases, water molecules are no longer available for hydrogen bonding, and intramolecular hydrogen bonds dominate. For ribose, hydroxyl groups attached to carbon atoms C(2), C(3), and C(4) are located on the same side of the ring. If the consecutive O-H groups are in the g−, g+, g+, and g− conformations, this facilitates the formation of a chain of four hydrogen bondlike interactions, as shown in Fig. 4. For arabinose and xylose, the hydroxyl group attached to either C(2) or C(3) is on the opposite side of the pyranose ring. This disrupts the chain of intramolecular O–H…O interactions and leads to broader distributions of hydroxyl group rotamers, as shown in Fig. 4. As a result, these two aldopentoses are less soluble in nonpolar phases than ribose. This in turn increases the free energy barrier, ΔA w/b, and lowers permeability of membranes to these compounds.
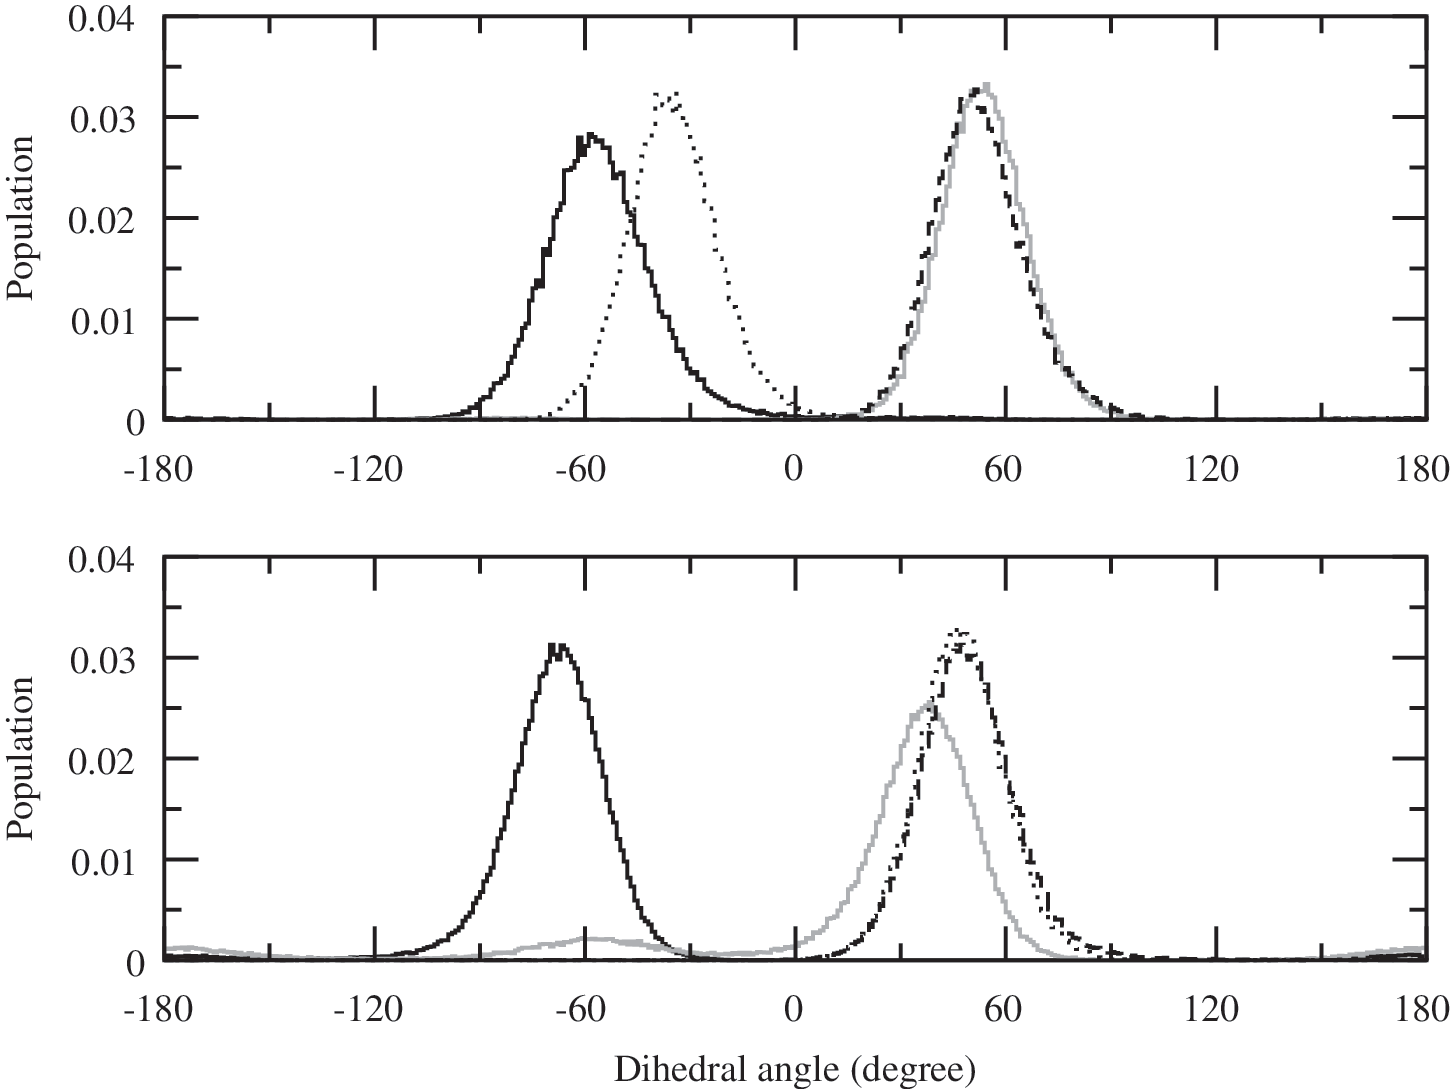
Population of dihedral angles involving four hydroxyl groups in ribopyranose (upper panel) and arabinopyranose (lower panel) located at the center of the oleic acid membrane. Dark solid, light solid, dashed, and dotted curves are for O-H groups attached to the C(1), C(2), C(3), and C(4) atom, respectively. The hydroxyl group attached to C(2) (light solid) in arabinose is on the opposite side of the sugar ring than other O-H groups and cannot form intramolecular hydrogen bonds with the neighboring hydroxyl groups as efficiently as in ribose. As a result, its orientational distribution is markedly broader. As shown in Fig. 1a, the most probable orientations of O-H groups in ribopyranose (g−, g+, g+, g−) lead to the formation of a chain of intramolecular hydrogen bonds. In comparison (see Fig. 1e), in the most probable orientation of O-H groups in arabinopyranose (g−, g−, g+, g+), the hydrogen bond between H-O(C1′) and H-O(C2′) is broken.
3.2. Coupling of permeation and metabolism: a simple kinetic model
Consider a process in which molecular species (e.g., aldopentoses) permeate cell membranes and subsequently are converted to nonpermeable or nearly nonpermeable compounds. Phosphorylation might serve as an example of such a reaction. Assuming that one species permeates cell walls faster than others, we ask a question: what is required to retain an excess of this species in the cell interior in a long-time limit?
3.2.1. Kinetic model for a single species
We start by considering permeation of a single solute species. The current, J, across the cell membrane is related to the membrane permeability coefficient, P
m, as follows,
where C
out and C
in are the concentrations of the solute outside and inside the cell. The current, J, can also be calculated from the rate at which the total number, n(t), of the solute molecules changes inside the cell,
where A is the surface area of the cell. The volume of the cell, V, is equal to
After combining Eqs. 5 and 6, we obtain
The radius of the cell is assumed to be constant with time.
Next, we assume that our species undergoes a reaction inside the cell that converts it to a nonpermeable compound. The rate for this reaction is k
r. We further assume that the reaction is irreversible and that the catalyst is distributed approximately uniformly in the vesicle. The assumption of a well-stirred reactor is common to many kinetic models. Then an extra term has to be added per Eq. 7:
To simplify notation, we define permeation rate,
The solution to this equation is
The rate at which molecules of the new species, m(t), accumulate inside the cell is
Substituting the expression for n(t) from Eq. 10, the solution to Eq. 11 is
At the limit t→∞ , n(t) reaches the steady-state limiting value of
3.2.2. Kinetic model for two species with different permeation rates
Now consider two species, A and B (e.g., ribose and arabinose), independently permeating the membrane. In the long-t limit, the ratio of molecules of these species accumulated in the cell is
For simplicity, we will further assume that
Finally, consider a relatively general case in which A and B react at the same rate,
Thus, if species A permeates membranes faster than species B, the former always reaches higher concentration at long times, but the ratio of concentrations depends on both the ratio of the permeation rates and on the reaction rates. If the reaction rate is slow, the effect due to different permeation rates of A and B decreases. This is shown in Fig. 5. In this figure, it is assumed that the ratio of the permeation rates for A and B is 10, as is the case for ribose and arabinose. Then m
A/m
B is plotted as a function of the ratio of k
r/k
m for A. Although the limiting value of 10 is approached slowly, the ratio k
r/k
m=2 is sufficient to yield the excess of m
A equal to 6. This excess is available for subsequent reactions that might eventually lead to synthesis of nucleic acids. In the concrete case of ribose permeating the POPC membrane, P
m is 20×10−8 cm/s. This yields
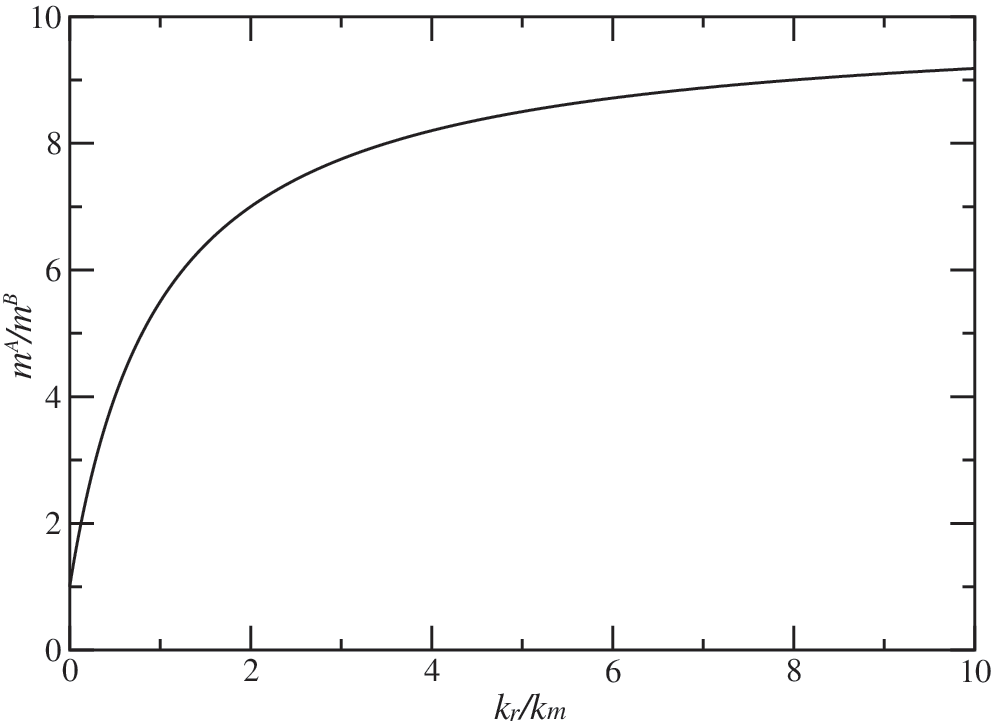
The ratio between the numbers of ribose (m A) and arabinose (m B) molecules inside a cell, as a function of the ratio between reaction rate (k r) and permeation rate (k m), at the large t limit.
3.3. Permeation of nucleosides through membranes
So far it has been assumed that sugars are the species permeating membranes and that the building blocks of nucleic acids are synthesized inside protocells. In an alternative scenario, nucleosides, nucleotides, or their activated derivatives are synthesized in the environment and are the species that cross protocellular walls. This raises a question: does preferential permeation of ribo-derivatives as compared to their diastereomers (which has been just described for aldopentoses), also apply to these compounds? There are serious reasons to expect that this might not be the case. In contrast to free sugars, which exist mostly in the pyranose form, the sugar ring of nucleosides and nucleotides is locked in the furanose form. In this case, only two O-H groups capable of forming intramolecular hydrogen bonds are attached to the ring-forming carbon atoms. Moreover, the smaller, five-membered ring constrains mutual orientations of the 2′ and 3′ hydroxyl groups such that they are unable to interact as effectively as in pyranose. This means that the solubilities of ribonucleosides or ribonucleotides in nonpolar media might not be markedly higher than the solubilities of their diastereomers. This, in turn, implies that the effect of preferential permeation of ribo-derivatives will disappear or at least become substantially reduced.
To test our expectations, we calculated the free energy profiles for transferring two adenosine nucleosides, rA and aA, from water to the center of the POPC membrane, and computed the permeability coefficient of the membrane to these two species (Wei and Pohorille, 2011). First, however, we calculated water-decane partition coefficients for three related compounds: adenine (A), 2′-deoxyadenine (2′-dA), and 2′,3′-deoxyadenine (2′,3′-ddA). These compounds were selected because their partition coefficients had been measured (Xiang and Anderson, 1994). The values are (3.7±0.3)×10−7, (8±0.2)×10−8, and (3.6±0.2)×10−6, respectively, in good agreement with the corresponding calculated partition coefficients of 1.3×10⁻⁷, 1.2×10⁻⁸, and 0.9×10⁻⁶. This agreement indicates that the description of intermolecular interactions between nucleosides and water or nonpolar phase used in our simulations is satisfactory. Close agreement between calculated and measured conformational equilibria of rA and aA in water confirms this conclusion. The ribose ring in rA is preferentially in the 2′-endo conformation. Our simulations and NMR measurements (Stolarski et al., 1980) yield population of this state equal to 87% and 63%, respectively. In contrast, the dominant conformation of the arabinose ring in aA is 3′-endo. Its population as determined from simulations and NMR is 84% and 76%, respectively. Both NMR experiments and our MD simulations yield appreciable fractions of both anti and syn conformations about the glycosidic bond of rA. In simulations, both conformations are equally probable, whereas the fractions of anti to syn determined from NMR are 75% and 25%, respectively (Stolarski et al., 1980). The only discrepancy is in the orientation of the exocyclic group attached to C4′. In simulations, this group is almost entirely in gauche+ state, whereas NMR measurements indicate that this state is populated only at approximately 50% (Plavec et al., 1992). This discrepancy, however, is not expected to affect solubility because the hydroxyl group of the C4′ exocyclic group does not have potential to engage in strong intramolecular hydrogen bonds.
The free energy profiles for both rA and aA exhibit small interfacial minima and then increase monotonically toward the center of the POPC bilayer. The corresponding concentration profiles are shown in Fig. 6. Inside the membrane, the nucleosides are not oriented randomly but instead align themselves with the normal to the water-membrane interface such that the hydrophilic sugar moiety is located closer to water. Once the nucleosides cross the midplane of the membrane they must reorient themselves to retain the same alignment. This effect has to be properly accounted for in free energy calculations (Wei and Pohorille, 2011).

Concentrations of nucleosides as a function of their position with respect to the water-POPC interface. All concentrations are plotted relative to the concentration in bulk water. The dark solid and light solid curves are for riboadenosine (rA) and arabinoadenosine (aA), respectively. Z=0 is at the center of the bilayer. Inset: ball-and-stick representation of rA (up) and aA (down) molecule. O-H group as attached at C2′ and C3′ is marked in dark black.
The shapes of the profiles for both compounds are similar, and so are the free energy barriers. They are equal to 10.0±0.1 and 10.4±0.1 kcal/mol for rA and aA, respectively. This yields a difference in the barrier between these two molecules of only 0.4 kcal/mol, compared to the difference of 1.7 kcal/mol between ribose and arabinose. Separate estimates of this difference based on free energy perturbation approach, in which ribose of rA is transformed to arabinose in water and in the center of the membrane, also yield the value of 0.4 kcal/mol.
The permeability coefficients of POPC membrane to aA and rA can be estimated from the free energy profiles and the calculated diffusion coefficients by way of Eq. 3 and are equal to 9×10⁻⁷ and 5.3×10⁻⁷ cm/s, respectively. Thus the ratio between these two coefficients is only 1.7, a significant reduction of the corresponding ratio for arabinose and ribose, which is equal to 8. These results are consistent with the measured water-octanol partition coefficients (Hansch and Leo, 1987; Ford et al., 1991) and the partition coefficients calculated across the water-decane interface, which are nearly the same for aA and rA. Similarly, the ratio of partition coefficients for arabinofuranose and ribofuranose is only 1.2, markedly smaller than the ratio of 6 between the partition coefficients for arabinopyranose and ribopyranose across the water-hexadecane interface. Taken together, these results indicate that preferential permeation of ribose through membranes, compared to its diastereomers, is a characteristic of the pyranose form and does not apply to compounds containing aldopentoses in the furanose form.
4. Discussions and Conclusions
The unexpected phenomenon of preferential permeation of ribose across membranes, as compared to its diastereomers, can be explained in terms of inter- and intramolecular interactions involving exocyclic hydroxyl groups attached to carbon atoms of the pyranose ring. In aqueous solution, these groups, independently of their position with respect to the ring, preferentially form hydrogen bonds with water molecules. In the interior of the membrane, this possibility is no longer available due to the absence of water. Instead, hydroxyl groups attached to two consecutive carbon atoms in the ring form intramolecular hydrogen bonds. These interactions are particularly favorable in ribose because they lead to the formation of a chain of consecutive hydrogen bonds. For other aldopentoses, this chain is broken because at least one O-H group is oriented differently than in ribose. As a result, the free energy in nonpolar phases, compared to that in water, is lower for ribose than for its diastereomers. This, in turn, lowers the free energy barrier to transferring ribose through membranes and increases its permeation rate. This phenomenon is independent of the nature of the membrane since all bilayers have a nonpolar interior. The mechanism that leads to increased permeation, described above, is general; it is available to any solute that can form effective intramolecular hydrogen bonds.
The same mechanism that explains selective permeation of ribose does not apply to nucleosides or their activated derivatives. In nucleosides, the sugar ring exists in the furanose form. The number of hydroxyl groups attached to this ring is smaller, and intramolecular interactions between them are less efficient than in the pyranose form due to geometric constraints imposed by a smaller, five-membered ring. As a consequence, ribonucleosides are only slightly stabilized in the membrane interior compared to their diastereomers; and the permeability coefficients of membranes for different diastereomers are, therefore, very similar. The same conclusion, however, might not apply to nucleosides that contain sugars in the pyranose form. Considering that polymers built of a number of corresponding nucleotides can form a double helix (Beier et al., 1999), this might be an interesting issue to investigate.
The results of this study constrain different scenarios for the formation of the earliest nucleic acid. In one scenario, sugars permeate protocellular walls and subsequently are converted to the building blocks of nucleic acids inside protocells. As long as this conversion proceeds sufficiently quickly, ribose derivatives will be favored over their diastereomers, thus assisting synthesis of nucleic acids from the correct monomers. The required rate of conversion can be estimated from a simple kinetic model presented above. In an alternative scenario, nucleosides or their activated derivatives are synthesized outside protocells and subsequently transported across the protocellular membranes. Then the kinetic mechanism which yields an increased concentration of ribo-derivatives as compared to their diastereomers no longer applies. Another mechanism that leads to the incorporation of correct monomers during synthesis of nucleic acids has to be invoked.
Selective transfer of ribose, but not ribonucleosides, through membranes highlights the connection between permeabilities of protocellular walls and the metabolism thus encapsulated. This is, however, not the only example of such connection. Recently, it was shown both experimentally and computationally that at least some blocked amino acids permeate phospholipid bilayers very slowly, at the timescale of several hours (Cardenas et al., 2012). This means that this route for supplying protocells with building blocks for proteins is highly inefficient. In another example, a very low permeability of phospholipid membranes to simple ions led to the conclusion that the emergence of protocells encapsulated by such membranes must have been accompanied by the emergence of capabilities for assisted ion transport that utilized carriers or ion channels (Pohorille et al., 2005; Vlassov, 2005; Pohorille and Deamer, 2009). These and other examples show that evolution of primordial metabolism is inextricably linked to the evolution of the earliest membranes (Pohorille and Deamer, 2009; Budin and Szostak, 2011), and any comprehensive scenario of the origin of life should consider these two processes simultaneously.
Footnotes
Acknowledgments
This work was supported by a grant from the NASA Exobiology Program. NASA Advanced Supercomputing (NAS) Division provided computational resources needed to carry out this study. The authors thank Michael Wilson for his valuable comments on the manuscript.
Author Disclosure Statement
No competing financial interests exist.
Abbreviations
aA, arabinoadenosine; MD, molecular dynamics; OA, oleic acid; POPC, 1-palmitoyl-2-oleoyl-sn-glycero-3-phosphocholine; rA, riboadenosine.