
Abstract
The Iron Mountain Mine Superfund Site near Redding, California, is a massive sulfide ore deposit that was mined for iron, silver, gold, copper, zinc, and pyrite intermittently for nearly 100 years. As a result, both water and air reached the sulfide deposits deep within the mountain, producing acid mine drainage consisting of sulfuric acid and heavy metals from the ore. Particularly, the drainage water from the Richmond Mine at Iron Mountain is among the most acidic waters naturally found on Earth. The mineralogy at Iron Mountain can serve as a proxy for understanding sulfate formation on Mars. Selected sulfate efflorescent salts from Iron Mountain, formed from extremely acidic waters via drainage from sulfide mining, have been characterized by means of Raman spectroscopy. Gypsum, ferricopiapite, copiapite, melanterite, coquimbite, and voltaite are found within the samples. This work has implications for Mars mineralogical and geochemical investigations as well as for terrestrial environmental investigations related to acid mine drainage contamination. Key Words: Acid mine drainage—Efflorescent sulfate minerals—Mars analogue—Iron Mountain—Laser Raman spectroscopy. Astrobiology 13, 270–278.
1. Introduction
The Richmond Mine at Iron Mountain was mined for copper and zinc by underground methods between the 1920s and 1950s. The Richmond Mine is notorious for having extremely acidic mine drainage; the water leaving the Richmond adit has a pH around 0.5 and extremely elevated concentrations of sulfate, iron, and other metals (Alpers et al., 2003). As part of its Superfund remediation program, the U.S. Environmental Protection Agency renovated a portion of the underground workings of the Richmond Mine during 1988–1990, which allowed access for sampling of water and efflorescent sulfate minerals. This reconnaissance sampling resulted in characterization of the extremely acidic mine waters (pH values from −3.6 to +0.5) and a variety of iron-sulfate efflorescent salts (Nordstrom and Alpers, 1999; Nordstrom et al., 2000).
Some studies suggest that the sulfates on Mars are produced via aqueous oxidation of sulfide minerals (Squyres and Knoll, 2005) that are known to be present there from analyses of martian meteorites (Greenwood et al., 2000). Before we target specific locations on Mars in the search for more information on Mars' hydrous past and even on the possibility for extant or extinct life, it is imperative that we characterize and understand analogous settings on Earth. The extreme environment in Iron Mountain typically hosts rhomboclase, copiapite group minerals, and jarosite group minerals (Alpers et al., 2008), which have been identified on Mars (Klingelhofer et al., 2004). The Iron Mountain site could therefore serve as an analogue for sulfate formation on Mars.
As part of a comprehensive study of Iron Mountain minerals and mine waters in which diverse techniques were used, we report here a Raman characterization of a set of mineral precipitates that were collected in a series of U.S. Geological Survey campaigns (1990–1992, 1998). Spectral data for VNIR, XANES, and Mössbauer on similar samples of sulfate minerals from Iron Mountain were reported by Majzlan et al. (2011). The laser Raman spectroscopic technique is particularly suited for this task and has proven to be very powerful for the analysis of the mineralogy of terrestrial sulfate samples (Sobron, 2008). On the other hand, Raman spectroscopy will provide key information for the identification of organic compounds and minerals on the martian surface and subsurface; the Raman Laser Spectrometer instrument will perform Raman spectroscopy on crushed powdered samples inside the ExoMars rover's Analytical Laboratory Drawer (Rull et al., 2011). During ExoMars' mission, the Raman instrument will provide a rapid mineralogical evaluation of the target that will be very useful for selecting samples to be eventually collected for sample return purposes or sample sites to be drilled in the search for other species (e.g., organic compounds), and for supporting scientific measurements by correlating its spectral information with other spectroscopic, imaging, and life-detection instruments aboard the ExoMars rover.
In addition to the implications for Mars geochemical studies, the study of acidic sulfate environments is important for understanding the liquid-solid phase equilibria in sites contaminated by acid mine drainage; such understanding may lead to the development of remediation strategies and may allow for an early detection of acid mine drainage contamination by providing guidance for where and how to search for specific contaminating species.
2. Selected Samples and Instrumentation
The mineral samples analyzed in this work were collected from the Richmond Mine at Iron Mountain during 1990–1992. Specific sites of sample collection were in the B and C drifts on the 2600 level, in the B′ stope on the 2650 level, and in the E manway, which connects the 2600 and 2650 levels along the C drift (see map in Fig. 1 of Jamieson et al., 2005). Ambient temperatures in the mine workings were 35–47°C. Mineral samples were preserved in acid-washed glass jars with Teflon-lined lids. Parafilm was used to provide additional sealing of the lids. The samples were stored in a warehouse in Sacramento, California, where temperature fluctuated between about 15°C and 35°C. A total of eight samples were selected to perform Raman spectroscopic measurements.
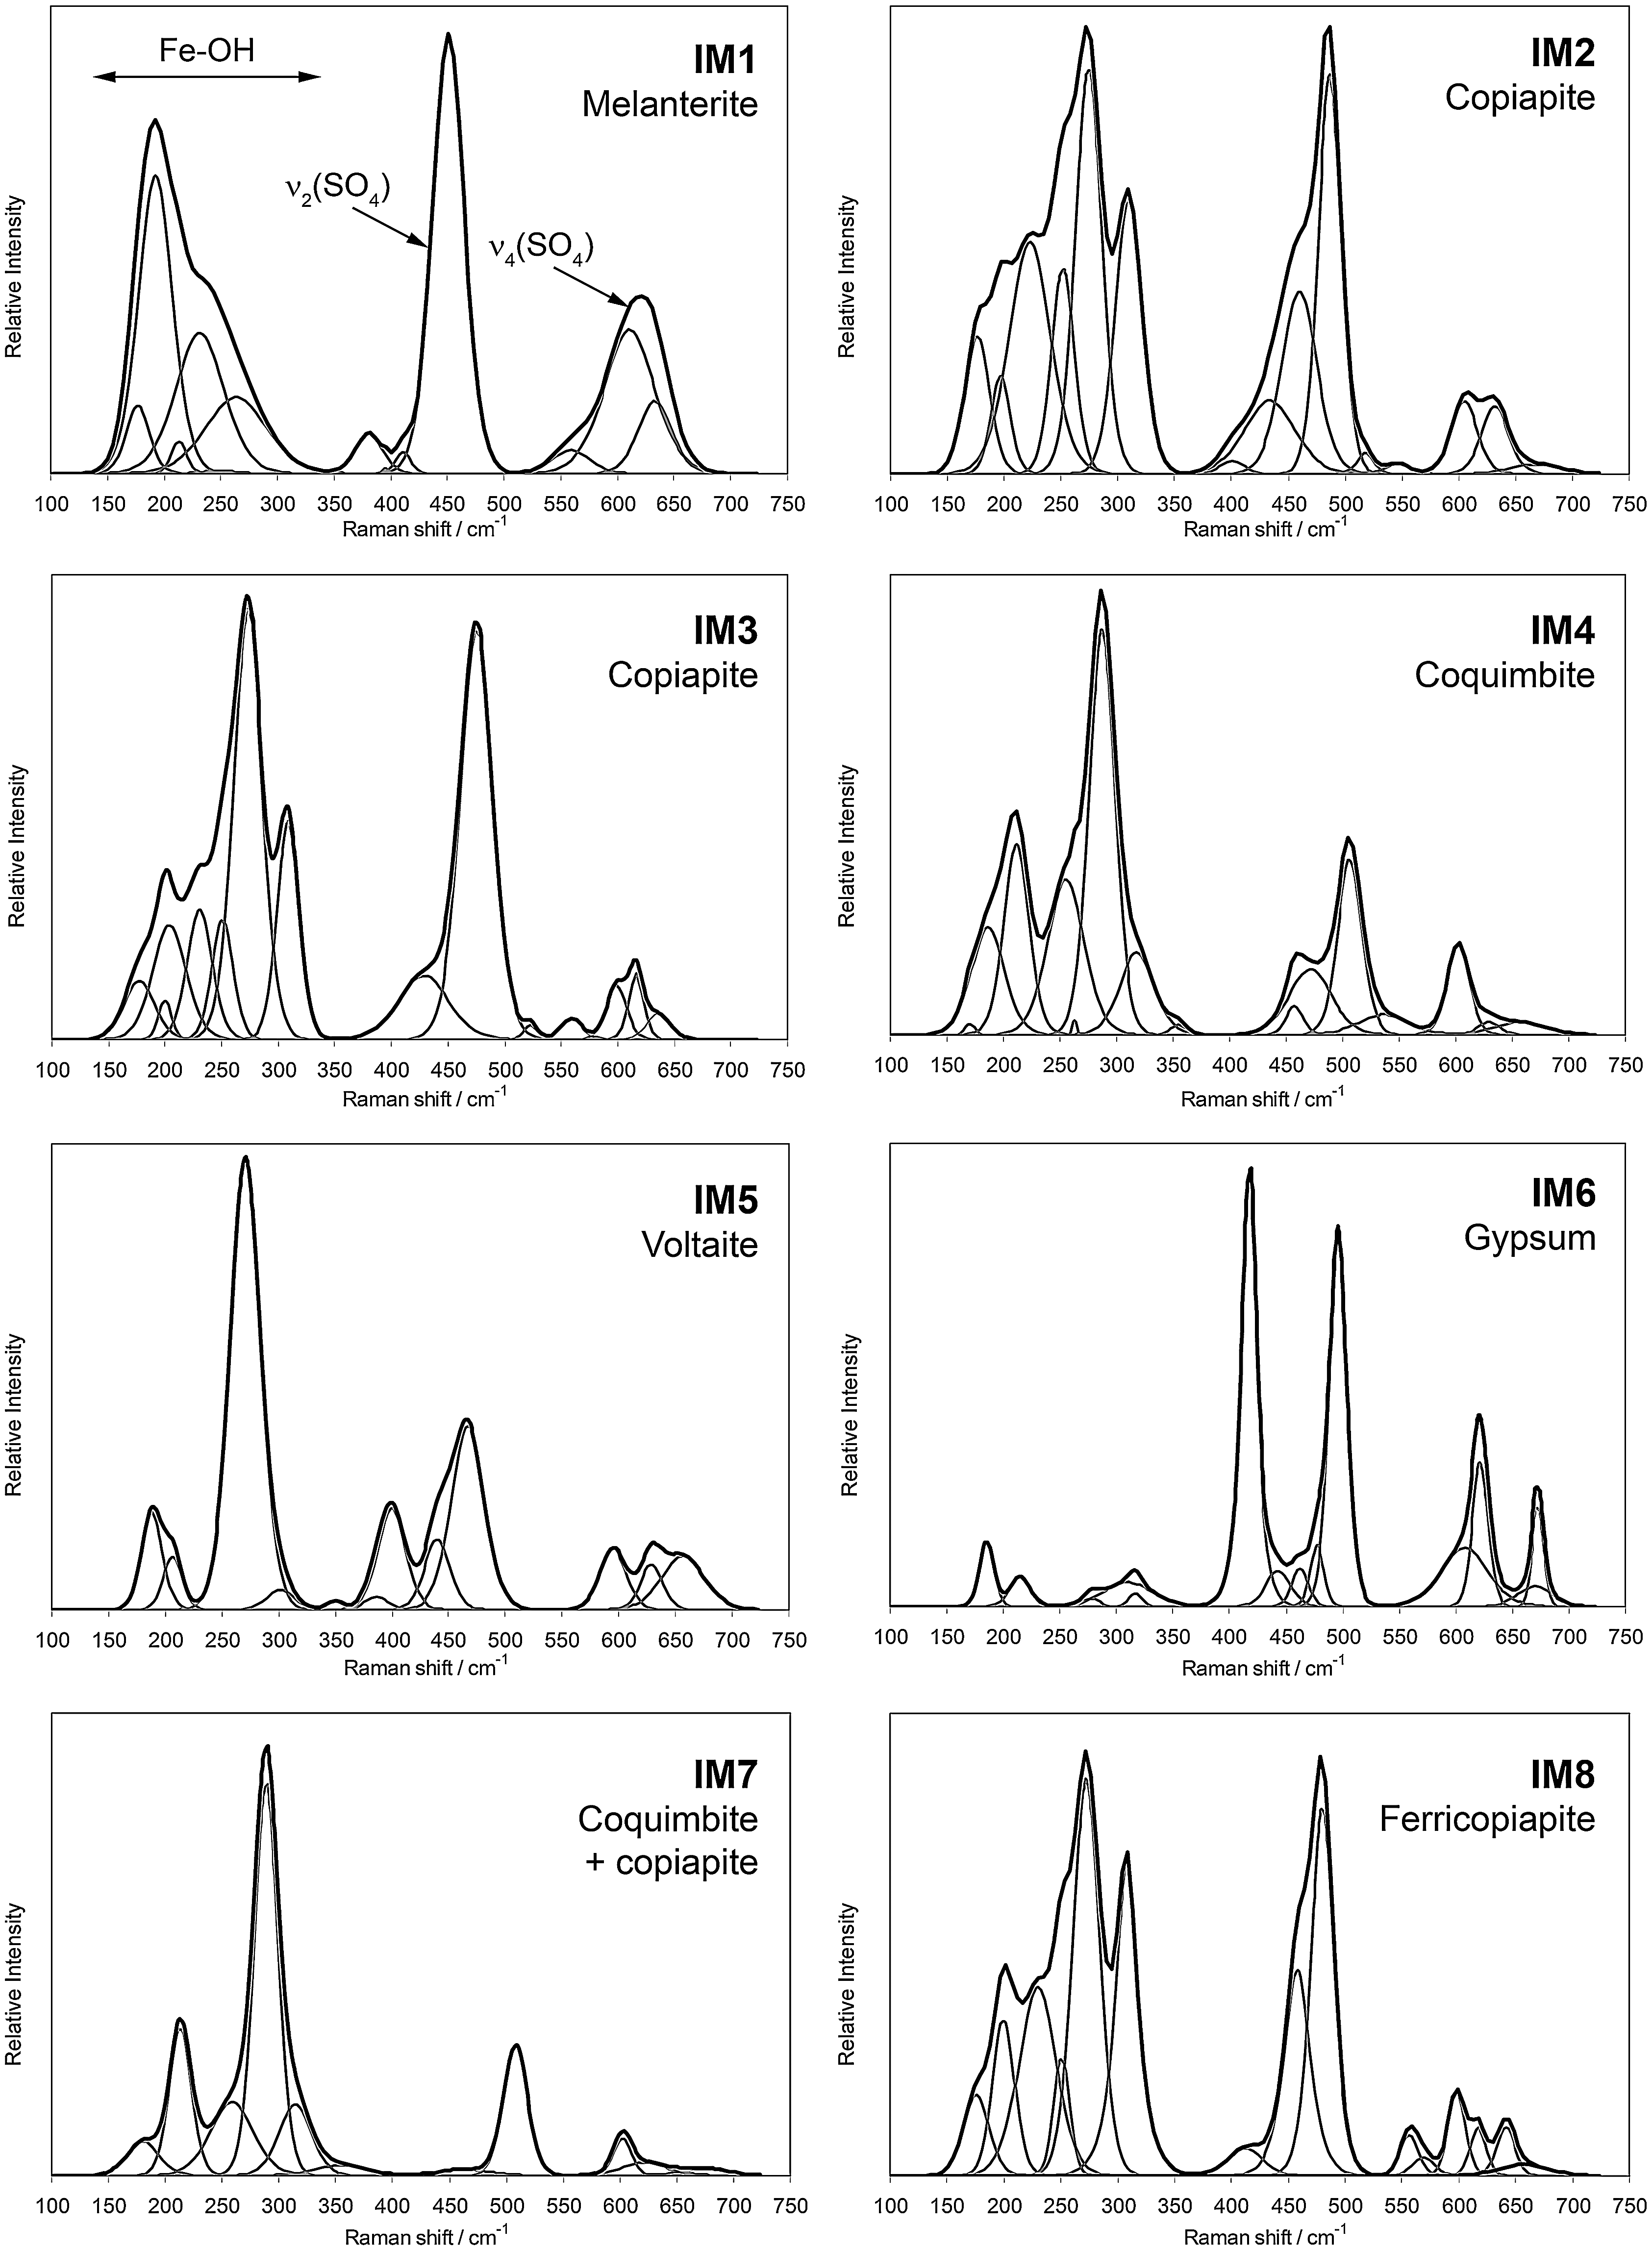
Raman spectra of the eight natural samples from the Iron Mountain Mine in the 100–750 cm−1 region. Black line, original Raman spectrum; gray lines, self-deconvolved bands.
The samples were placed on the 3-D-motion stage of a confocal Raman microscope (WiTec alpha300 R). Raman spectra were collected at a constant temperature of 293 K in the spectral range 100–3700 cm−1 with 20× magnification. The spectral resolution was 4 cm−1. The 532.4 nm line of a frequency-doubled Nd:YAG laser was used as the excitation source.
3. Results
The Raman spectra of the natural samples from the Richmond Mine are plotted in Figs. 1 –3. The spectra are normalized, offset, and split into three regions of interest: 100–750 cm−1, 800–1300 cm−1, and 2500–3700 cm−1 for clarity. The Raman spectra were first processed through a set of automated Fourier-analysis-based band-fitting routines to remove noise and baseline (Sobron et al., 2008). Fourier self-deconvolution and band-fitting routines were subsequently used to retrieve relevant band parameters (Sobron et al., 2008). Table 1 summarizes the relevant parameters: position, intensity, and HWHM (half width at half maximum) of the bands derived from the automated spectral analysis. These parameters were used to identify the mineral phases present in the natural samples.
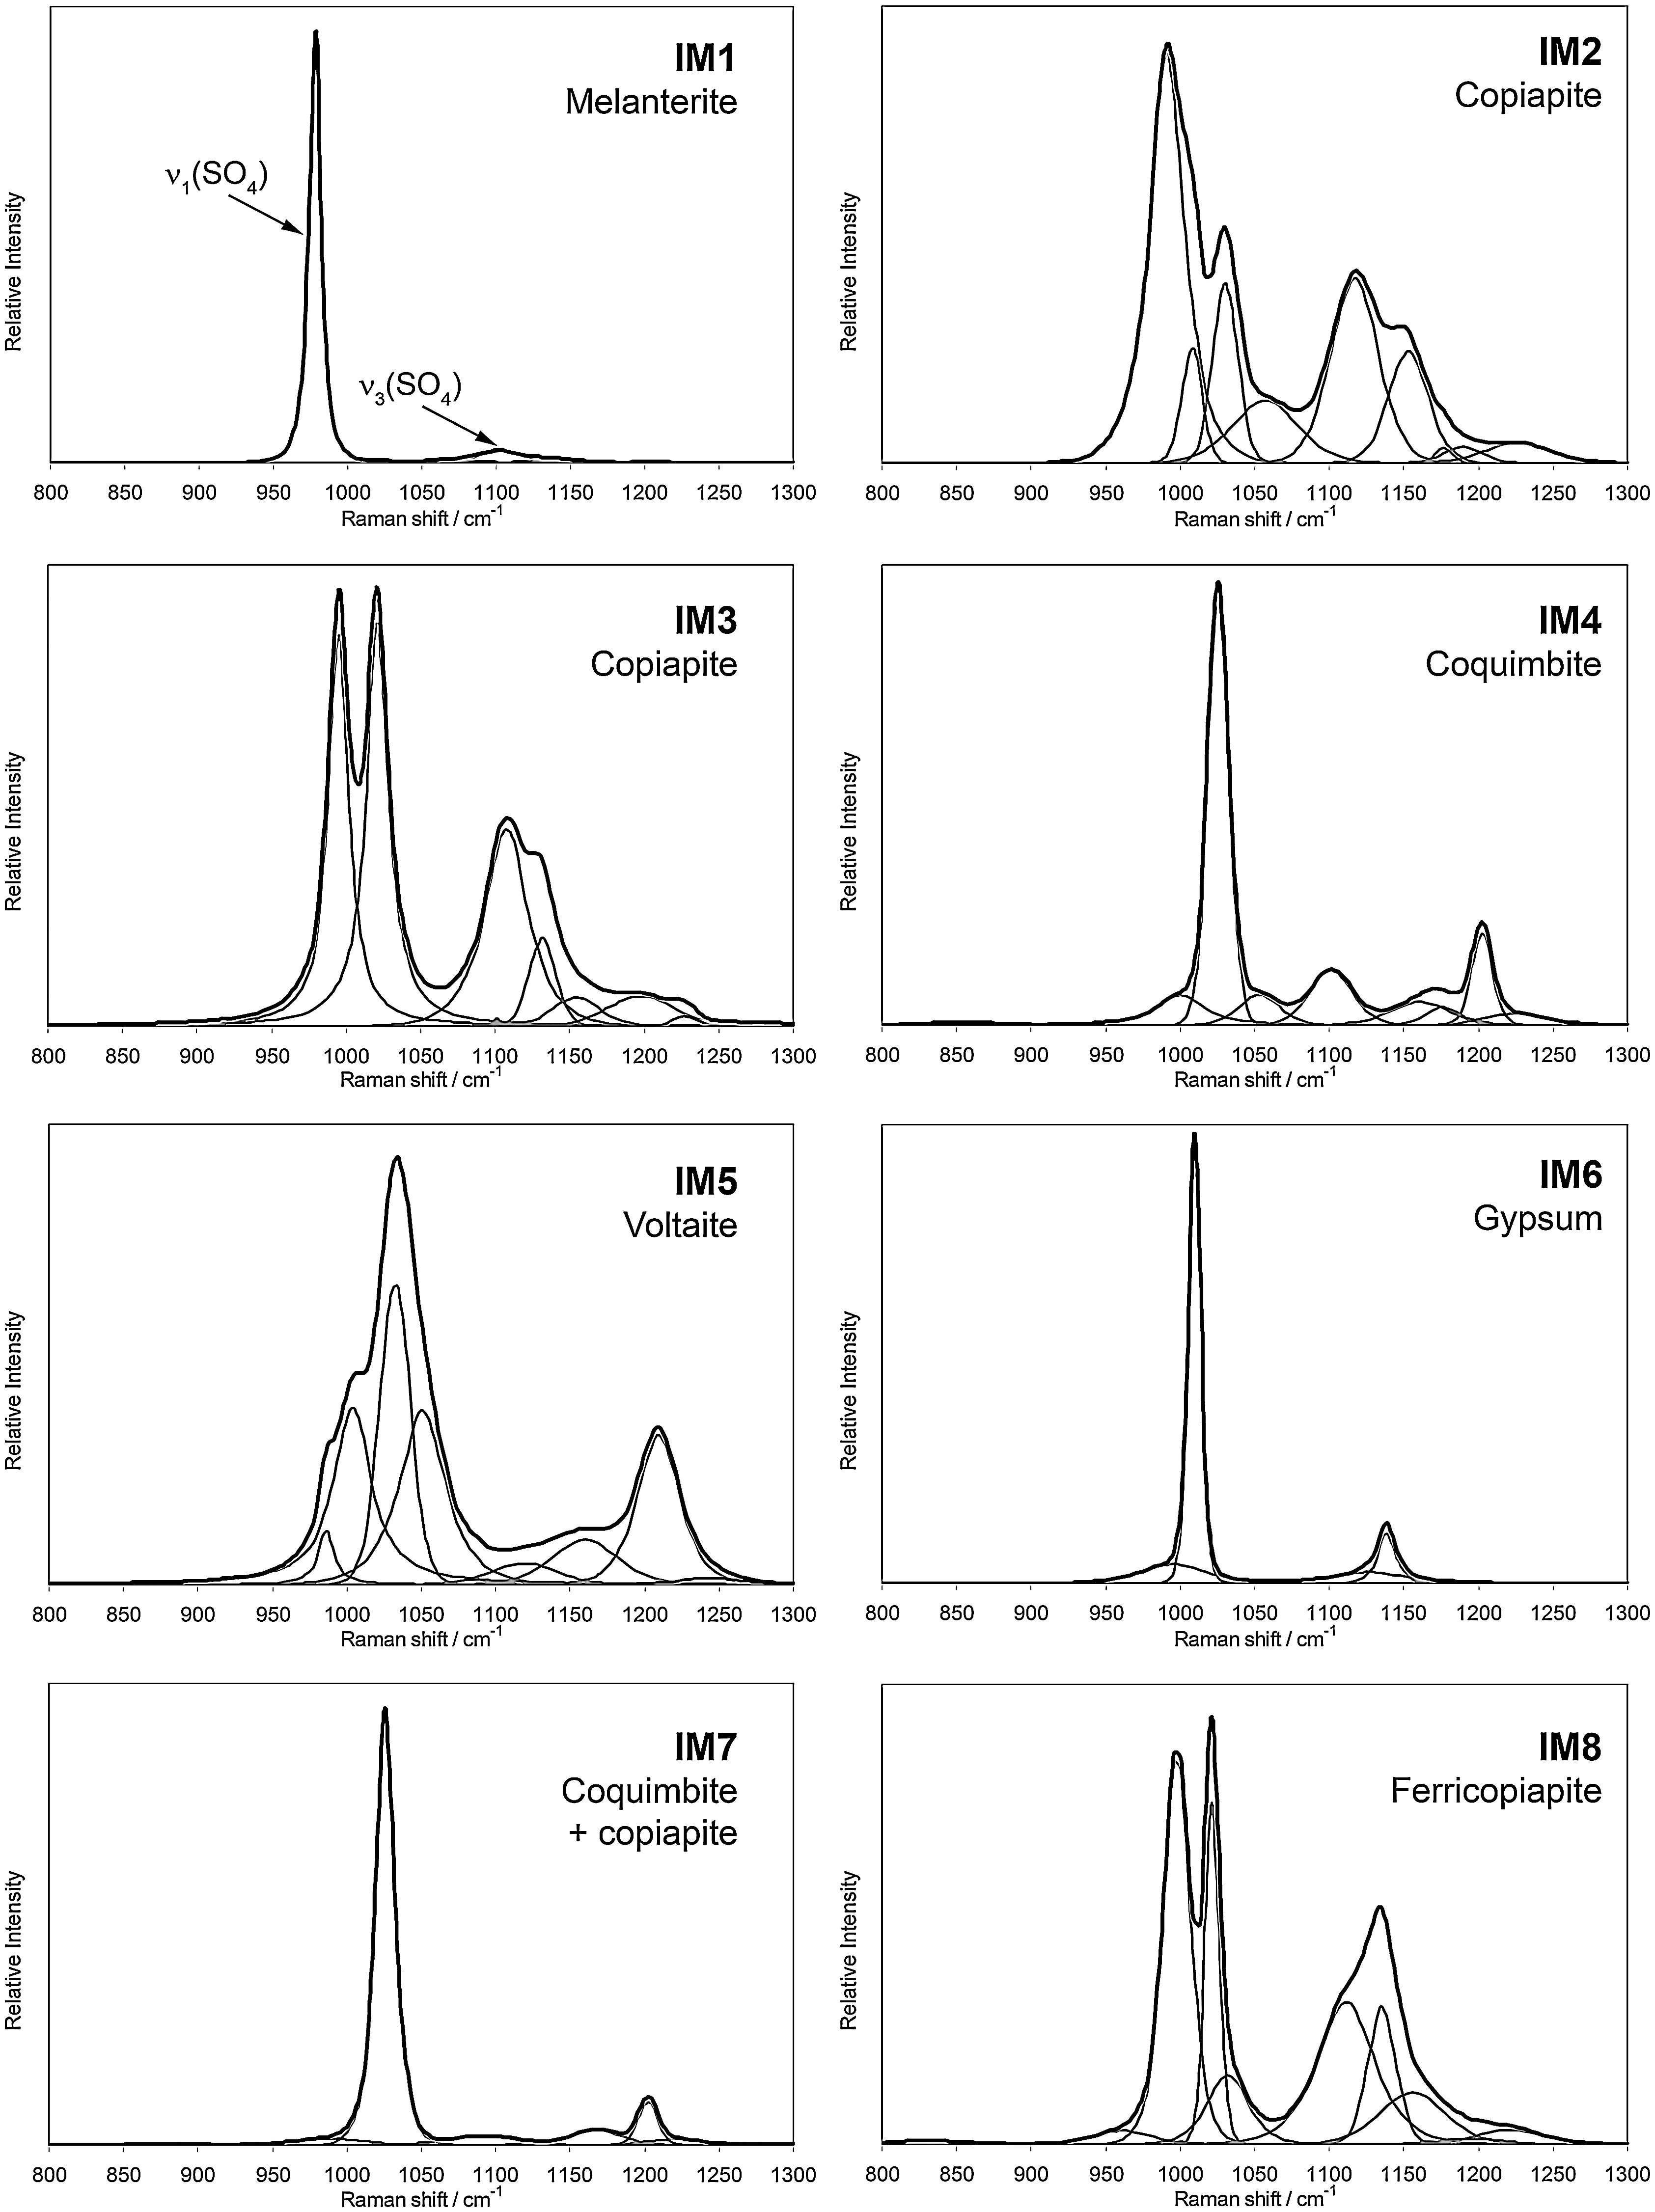
Raman spectra of the eight natural samples from the Iron Mountain Mine in the 800–1300 cm−1 region. Black line, original Raman spectrum; gray lines, self-deconvolved bands.
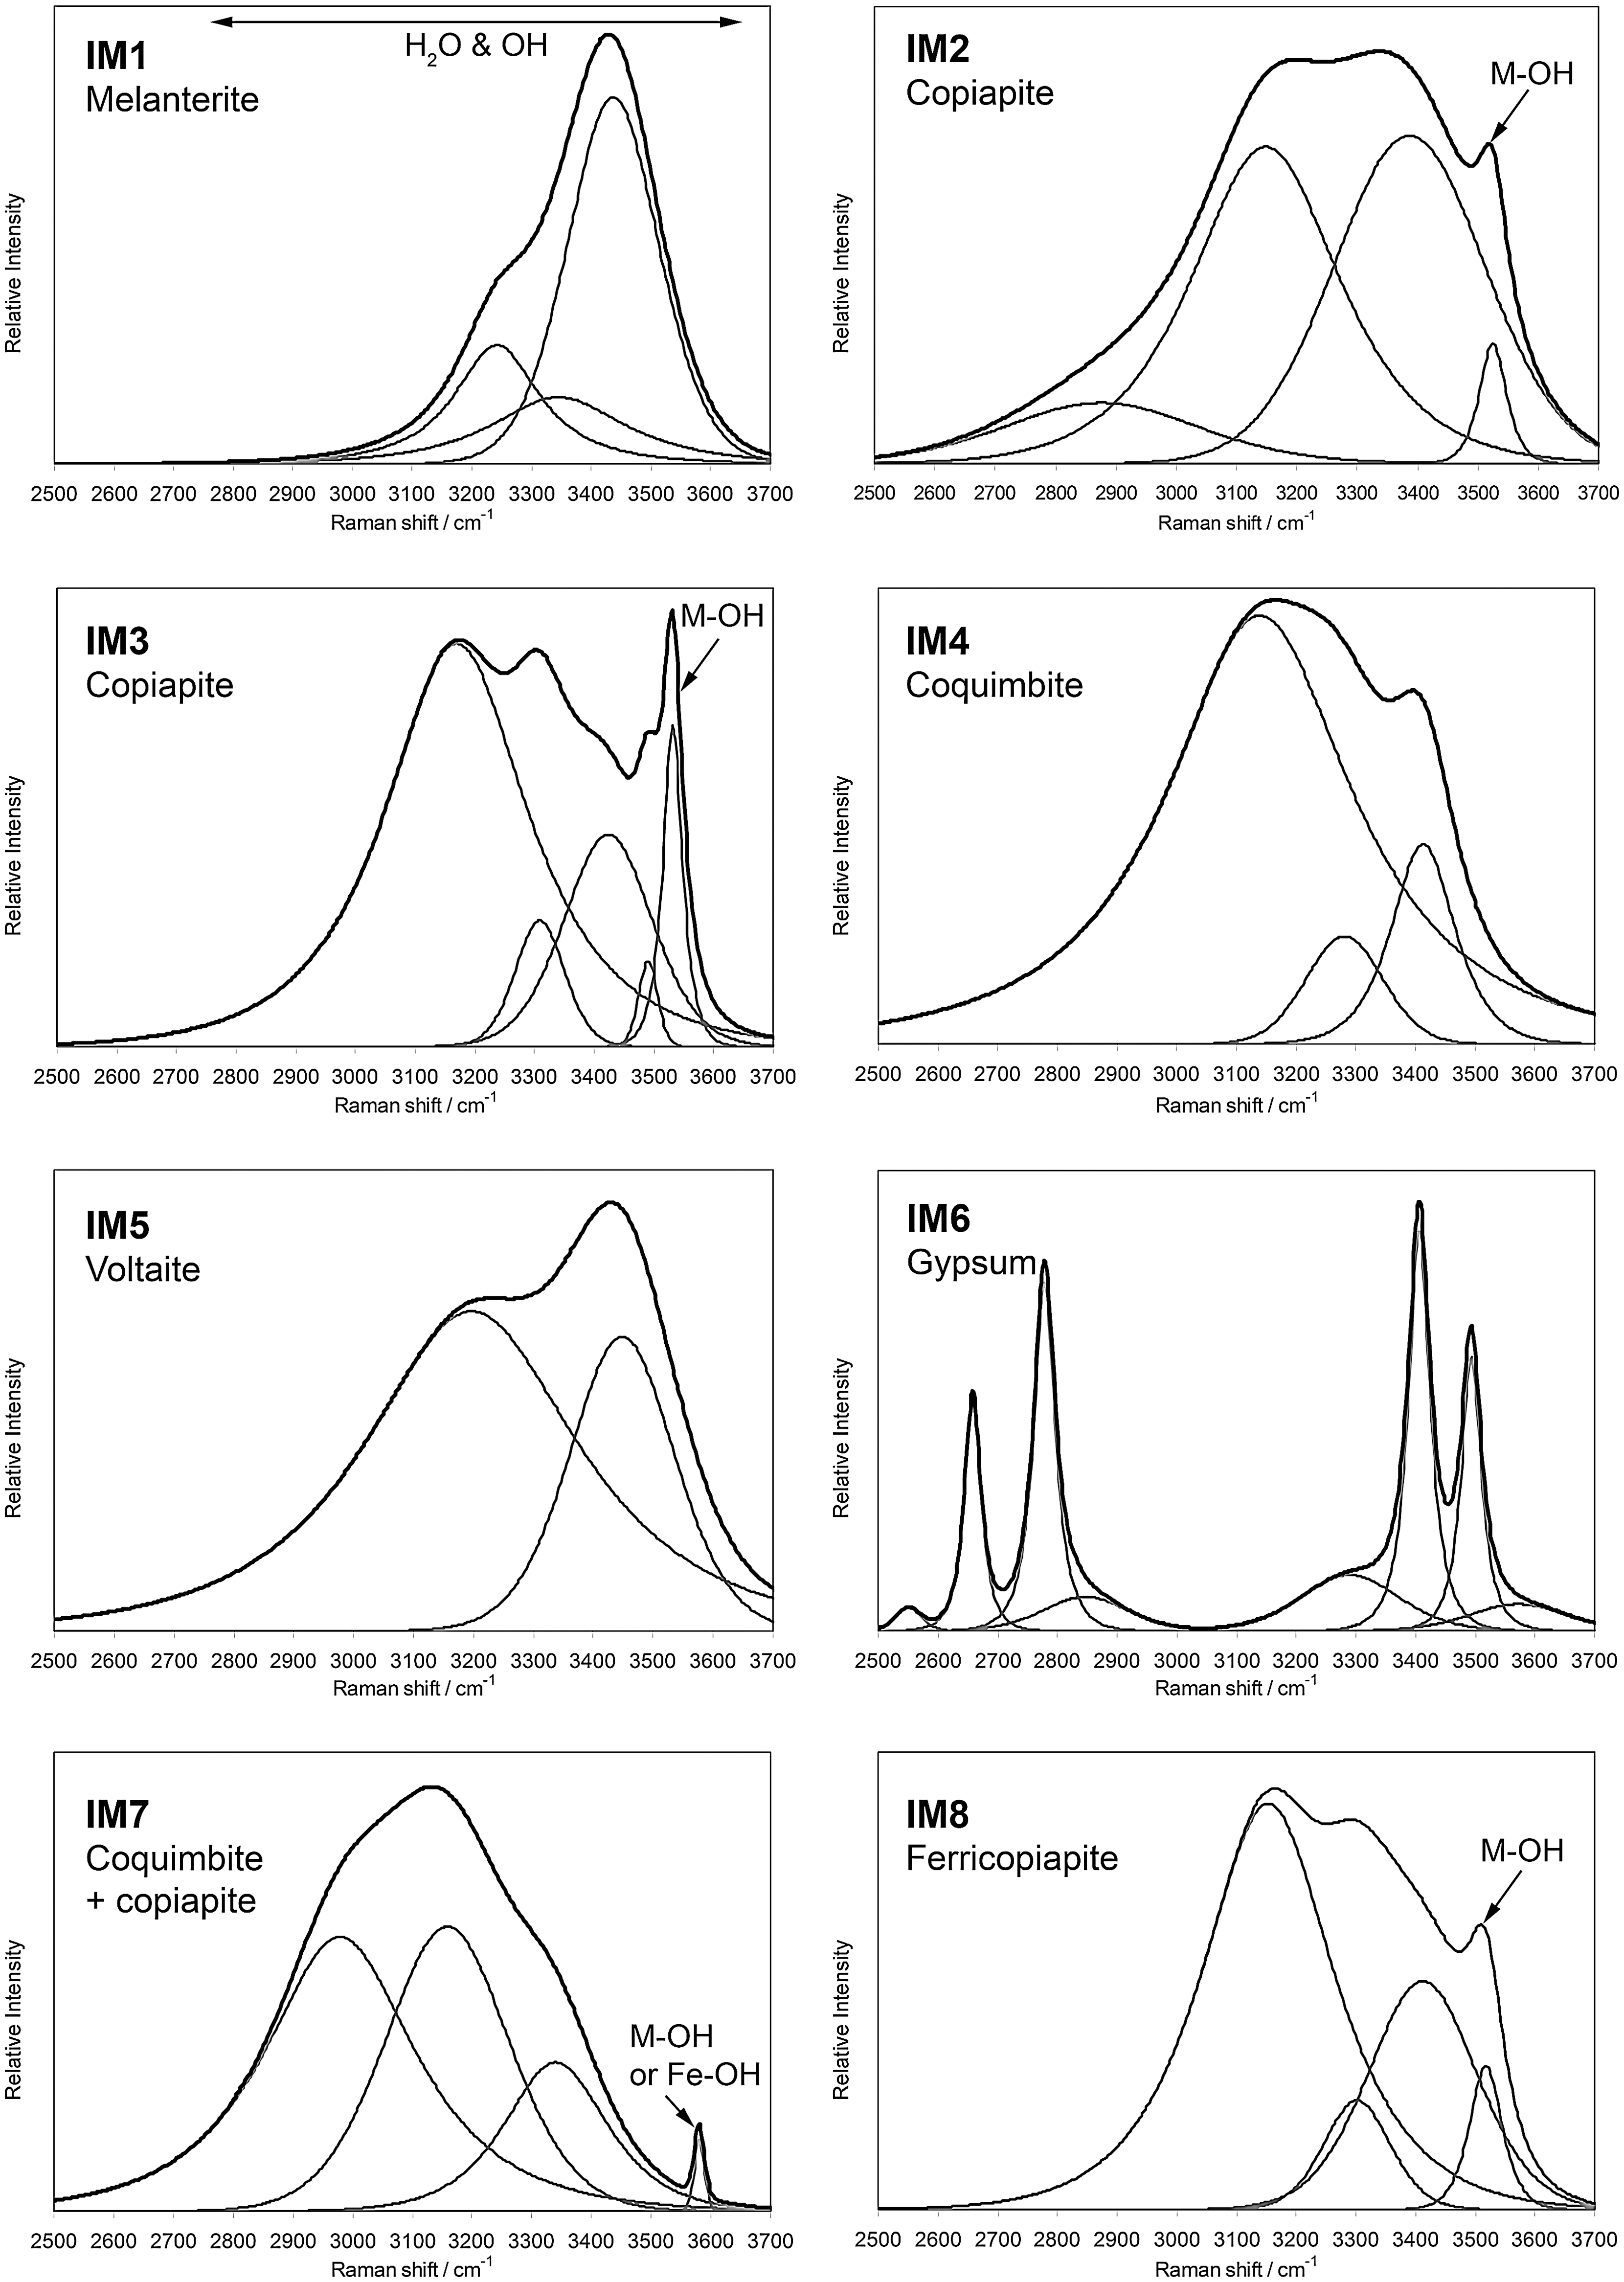
Raman spectra of the eight natural samples from the Iron Mountain Mine in the 2500–3700 cm−1 region. Black line, original Raman spectrum; gray lines, self-deconvolved band.
Values in cm−1 unless otherwise indicated.
Relative intensity ( × 103).
Half width at half maximum.
4. Discussion
In the following paragraphs, we will discuss the Raman spectroscopy of the eight natural samples from Iron Mountain. We will analyze three spectral regions of particular interest for this study of natural sulfates: the low wavenumber region, 100–750 cm−1; the mid wavenumber region, 800–1300 cm−1; and the high wavenumber region, 2500–3700 cm−1.
Bands arising from sulfate molecular vibrations and water dominate the Raman spectra of sulfate-bearing minerals. In their work on synthetic jarosites, Sasaki et al. (1998) assigned the band at 434 cm−1 to the Fe-O stretching vibration. However, this assignment was revised by Frost et al. (2005), who attributed the band to the ν2 mode of sulfate. In a previous paper, we showed that the Fe-O stretching vibrations characteristic of iron(III) hydroxides give rise to a set of bands around 300 cm−1 (Sobron et al., 2007b). This finding is in good agreement with the assignment reported by Frost et al. (2005). We use this band assignment throughout this paper.
A split of the sulfate vibrational modes into separate bands is observed in most crystal structures and is due to symmetry breakdown (e.g., Kong et al., 2011). Figure 1 shows the Raman spectra of the eight samples in the low-wavenumber region (100–750 cm−1). The results of the Raman spectral analysis are reported in Table 1. The eight spectra show two sets of bands centered around 450 and 600 cm−1, arising from the ν2 and ν4 vibrational modes of the sulfate tetrahedral oxyanions, respectively. Three sharp bands are observed for the IM5 sample at 400, 440, and 467 cm−1 and for the IM8 sample at 412, 458, and 480 cm−1. Four bands are observed for the IM2 sample at 400, 434, 460, and 487 cm−1. The fact that multiple bands are observed in the ν2 region of these sulfates indicates certain symmetry breakdown of sulfate tetrahedra, probably through the presence of different cations in the crystalline structures. On the other hand, two intense bands are observed for the IM3 sample at 429 and 475 cm−1, for the IM4 sample at 457 and 471 cm−1, and for the IM6 sample at 417 and 496 cm−1. It is apparent that the site symmetry is better preserved in these samples. Finally, a single sharp band is observed for the IM1 sample at 451 cm−1 and for the IM7 sample at 508 cm−1. The sulfate group in these two samples possibly presents higher site symmetry in comparison to the other samples, thus suggesting the presence of a unique M-SO4 group in the structure, where M denotes a cation. The shoulder near 380 cm−1 observed in the samples IM1 and IM5 is attributed to a vibration of the [Fe(H2O)6]2+ complex (Hester and Plane, 1964; Sobron et al., 2007a). Samples IM2, IM7, and IM8 show intense bands at around 310 cm−1. As discussed above, these bands are attributed to Fe-O stretching vibrations associated with iron(III). More specifically, these bands may arise from Fe-hydroxyl group interactions. Weak bands are observed at around 350 cm−1 for samples IM4, IM5, and IM7. Those bands may be assigned to Fe-O stretching modes as well. One intense band is observed at between 207 and 221 cm−1 in the Raman spectra of those samples whose spectra show bands at around 310 cm−1. Those bands are also believed to originate from Fe-O vibration modes. A complex set of bands between 160 and 290 cm−1, visible in all the spectra, may be assigned to M-O stretching vibrations.
Similar to the ν2 symmetrical bending vibrations, the ν4 vibrational modes of sulfate give rise to multiple bands in the Raman spectra centered upon 600 cm−1. These can be explained, as for the ν2 region, in terms of lowering of symmetry in the sulfate structures.
The Raman spectra of the eight samples in the region 800–1300 cm−1 are plotted in Fig. 2. Band splitting of the sulfate ν1 and ν3 vibrational modes is observed in the region 800–1300 cm−1 for all the Raman spectra. The two sets of bands between 978 and 1076 cm−1 and between 1100 and 1250 cm−1 are assigned to the ν1 symmetric stretching vibrations and ν3 asymmetric stretching vibrations of sulfate ions, respectively. The Raman shift of the ν1 sulfate stretching mode depends on the ionic radius of the cation bonded to the sulfate ion (Sasaki et al., 1998; Chio et al., 2005; Frost et al., 2005). The Raman spectra of samples IM1, IM4, IM6, and IM7 show a single intense band for the ν1 sulfate mode at 978, 1026, 1010, and 1026 cm−1, respectively. In accordance with Ross (1974) and Carey and Korenowski (1998), the low-intensity shoulders found around 850 cm−1 are assigned to water librational modes. Other shoulders in both sides of the most intense band and the series of low-intensity bands in the ν3 sulfate region in the spectra of samples IM4 and IM7 may be likely associated with distortions of the sulfate ion by hydrogen bonding and iron(III) direct complexation (Sobron et al., 2007b). Chio et al. (2005) observed an upshift (977 to 1018 cm−1) of the sulfate ν1 band position in the Raman spectra of various hydrated iron(II) sulfates as hydration, and therefore site symmetry decreases. The larger band position-shift (982 to 1026 cm−1) we observed for samples IM4 and IM7 may be explained if iron(III) is attached to the sulfate groups. The inclusion of oxygen atoms from sulfate units in iron(III) octahedra leads to a strong charge delocalization, hence a loss of symmetry in the sulfate tetrahedral structures. The loss of symmetry is reflected in the Raman spectrum by a shift in the position of the S-O symmetric stretching band toward higher wavenumbers. A typical hydrated iron(III) sulfate found in AMD-related sites is coquimbite, (Fe3+)2(SO4)3·9H2O, which often exhibits purple crystals such as those observed in the samples IM4 and IM7. While the spectra of these two samples look similar in the spectral region shown in Fig. 2, the relative intensities of the bands are different, likely due to the orientation of the crystal lattice (and optical properties of the crystal) and/or the presence of local impurities or irregularities in the crystal structure.
The band position of the ν1 (single line) and ν3 (doublet) stretching modes for sample IM1 is in excellent agreement with the Raman spectrum of melanterite (FeSO4·7H2O) reported by Chio et al. (2005). Further, the color of the sample is consistent with the presence of this mineral. The Raman spectrum of sample IM6 resembles that of gypsum (CaSO4·2H2O) reported by Dickinson and Dillon (1929). Also, the color and texture of the sample (white) are consistent with gypsum.
The observation of multiple bands in the ν1 and ν3 sulfate vibration region confirms the previous suggestion of the presence of different cations associated to sulfate groups in samples IM2, IM3, IM5, and IM8. Samples IM2, IM3, and IM8 show a similar envelope. Two pairs of intense bands are observed for sample IM3 at 995/1108 cm−1 and 1021/1132 cm−1. Sample IM8 shows the same pairs at 998/1113 cm−1 and 1021/1136 cm−1. These bands arise from two different types of sulfates in the structure of the samples. The band positions suggest that the first pair arises from the presence of iron(II) sulfate (Chio et al., 2005), whereas the second pair is due to the presence of iron(III) sulfate in the samples. The coexistence of iron(II)- and iron(III)-sulfate minerals is likely in an environment such as the Iron Mountain Mine, where iron(II) is readily oxidized to iron(III) in the presence of water, oxygen, and microbes (Edwards et al., 2000).
Two additional broad bands, centered at 961 and 1035 cm−1, are observed in the band analysis of sample IM8 with regard to that of the IM3 sample. They are due likely to hydrogen bonding among iron(III) octahedra. The relative intensity of the two bands at 1113 and 1136 cm−1 is 1:1 for the IM8 sample. The relative intensity for the equivalent bands (1108 and 1132 cm−1) in sample IM3 is 2.5:1. We suggest that this difference is due to distinct relative abundance of iron(II)-iron(III) sulfate. Both samples display yellow color. It is likely that copiapite, Fe2+(Fe3+)4(SO4)6(OH)2·20H2O, is present in sample IM3, whereas ferricopiapite, (Fe3+)2/3(Fe3+)4(SO4)6(OH)2·20H2O is the main mineral phase in sample IM8. The presence of iron(III) in two different symmetry sites may explain the split of the ν1 and ν3 vibrational modes of sulfate in two pairs in the Raman spectrum of this sample (IM8) discussed in the previous paragraph.
The Raman spectrum of sample IM5 shows a complex set of bands around 1030 and 1200 cm−1, thus suggesting the presence of various sulfate minerals. The analyzed spots showed black to dark blue prismatic crystals, which are consistent with voltaite, K2(Fe2+)5(Fe3+)3Al(SO4)12·18H2O. The presence of four different cations is also consistent with the series of overlapping bands in the ν1 sulfate region.
Figure 3 shows the Raman spectra of the eight samples analyzed in the region 2500–3700 cm−1. The OH stretching bands of the water units are found in this region. These bands generally overlap those arising from the hydroxyl stretching vibrations of the OH group. Particularly, the sharp band centered between 3525 and 3576 cm−1 in the Raman spectra of samples IM2, IM3, and IM8 is attributed to M-OH stretching vibrations of the hydroxyl units (e.g., Henning et al., 1990). This is consistent with the identification of these three samples as copiapite, copiapite, and ferricopiapite, respectively, as these minerals contain both water and OH units. A sharp but low-intensity band is observed at 3581 cm−1 for sample IM7. This band is also attributable to M-OH vibrations, although no hydroxyl groups are present in coquimbite. The broad and complex series of bands around 3200 cm−1 for IM7 is characteristic of water units, but the envelope is substantially different from that of sample IM4 (tentatively identified as coquimbite). This deformation of the spectra in the water region may be caused by the presence of different hydrated spheres associated to different cations as well as iron(III). We suggest that the sample IM7 contains coquimbite mixed with a small amount of some iron hydroxides, most likely copiapite, as both compounds are commonly found in association in metal-sulfide mineral deposits (Alpers et al., 2003).
Hydrated iron sulfates such as melanterite in sample IM1 and voltaite in sample IM5 display the characteristic set of broad water bands. The shape of the broad continuum is mainly determined by the hydration number, which defines the number of bridging water molecules (Chio et al., 2005).
5. Conclusions
Dedicated inspection of the Raman spectra allowed us to identify gypsum, ferricopiapite, copiapite, melanterite, coquimbite, and voltaite in the samples from the Richmond Mine at Iron Mountain, California. The Raman spectra of these samples are, however, difficult to analyze, showing overlapping bands and shoulders that may be due to the inclusion of unidentified sulfates, hydroxides, and other impurities in the main mineral matrix.
Recent advances in optics, lasers, and detector systems have allowed for the development of compact field instruments for in situ analyses. Particularly, the laser Raman technique has experienced outstanding advances in terms of portability and robustness in recent years, and light-weight, small, and rugged field-portable Raman spectrometers are commercially available. We believe that the Raman technique will become a routine analytical tool for field measurements in acid mine drainage–related sites, in the context of both environmental and planetary sciences. Further, a combination of Raman spectroscopy with other chemistry techniques such as laser-induced breakdown spectroscopy (LIBS) should be pursued, as it allows for definitive mineral phase identification and precise calculation of chemical and elemental concentrations; LIBS can reveal the relative concentration of major (and often trace) elements present in a bulk sample, whereas Raman yields information on the individual mineral species and their chemical and structural nature. Thus, the Raman/LIBS data provide definitive mineral phase identification with precise chemical characterization of all major, minor, and some trace mineral species (e.g., Sobron and Wang, 2009).
Footnotes
Acknowledgments
This work was partially funded by a research grant from The Lewis and Clark Fund for Exploration and Field Research in Astrobiology. S.K. Sharma, A. Misra, and L. Bonal are acknowledged for their assistance with the Raman analysis at the University of Hawaii at Manoa. The samples from Iron Mountain were obtained through cooperation with the U.S. Environmental Protection Agency. Any use of trade, product, or firm names is for descriptive purposes only and does not imply endorsement by the U.S. Government.