
Abstract
The Russian Phobos-Grunt spacecraft originally planned to return a 200 g sample of surface material from Phobos to Earth. Although it was anticipated that this material would mainly be from the body of Phobos, there is a possibility that such a sample may also contain material ejected from the surface of Mars by large impacts. An analysis of this possibility is completed by using current knowledge of aspects of impact cratering on the surface of Mars and the production of high-speed ejecta that might reach Phobos or Deimos. Key Words: Impact cratering—Ejecta transfer—Phobos. Astrobiology 13, 963–980.
1. Introduction
T
2. Models and Assumptions
A numerical procedure was implemented to compute the probability of impact on Phobos (or Deimos) for ejecta particles originating from surface sites on Mars that are associated with large impact craters. The procedure is based upon numerical integration of the trajectories that represent individual particles likely to be ejected as a result of an impact with the planetary surface.
2.1. Dynamical models
To accomplish the numerical integration of the ejecta trajectories, a dynamical model had to be developed that incorporated force models for the significant bodies in the system, that is, Mars, one of its moons, and an ejecta particle.
2.1.1. Gravitational model for Mars
In this simulation, Mars is the most massive body in the immediate vicinity; thus it offers the most significant gravitational contribution to the path of the ejecta particle as it departs from the planet. Although the planet is almost spherical, the analysis of the behavior of the ejecta requires the computation of trajectories that originate from the surface of the body, where subtle changes in the gravity description may influence the fate of the ejecta. Within this context, a higher-fidelity model is employed, incorporating spherical harmonics of second degree and order. The gravitational potential associated with this model is generally written in terms of Cartesian coordinates,
where
2.1.2. Phobos and Deimos
Phobos is a very irregular body; however, the body's size and dimensions are very small compared to Mars. Thus, the gravitational disturbance to the ejecta from this body is neglected in this investigation, and Phobos is modeled as massless. Also, Phobos is assumed to move along an equatorial circular orbit. Mars' second moon, Deimos, is also irregularly shaped, but the same observation is valid. Exact values for the physical parameters representing the orbit of each moon appear in Table 1, including the semimajor axis, eccentricity, inclination, and period of their respective orbits as well as the mean diameter of the body, α. Note that the inclination in the table is relative to Mars' equatorial plane.
Source for Phobos: STK, Analytical Graphics, Inc.
2.1.3. Ejecta and the ejecta curtain
Ejecta particles are orders of magnitude smaller than Mars and Phobos in terms of size and mass and of a wide variety of shapes. Therefore, they are also modeled as massless particles from a gravitational perspective. In addition, an ejecta curtain is generated by numerically integrating a collection of initial conditions lying on a cone of fixed angle, β, with respect to the local vertical, and with a fixed initial velocity magnitude labeled “ejection velocity.” The ejection velocity is always defined relative to the planet's surface. The discrete set of initial conditions to be integrated is assumed to be representative of the curtain of ejecta formed at a particular location on Mars corresponding to an impact site. As illustrated in Fig. 1, an ejecta curtain is associated with a pair of conditions: ejection angle β–ejection velocity V eje. The left schematic in Fig. 1 represents the cone of initial conditions as viewed from the surface of the planet, and the right diagram in Fig. 1 displays Mars and the cone at some corresponding location and orientation on the surface. Note that the cones in these figures are not a representation of the curtain of ejecta but only an illustration of the initial conditions employed to generate the curtain. Each simulation, however, involves the integration of an initial cluster of ejecta that share a common ejection angle β and velocity V eje but whose directions extend over the entire range of cone azimuths.
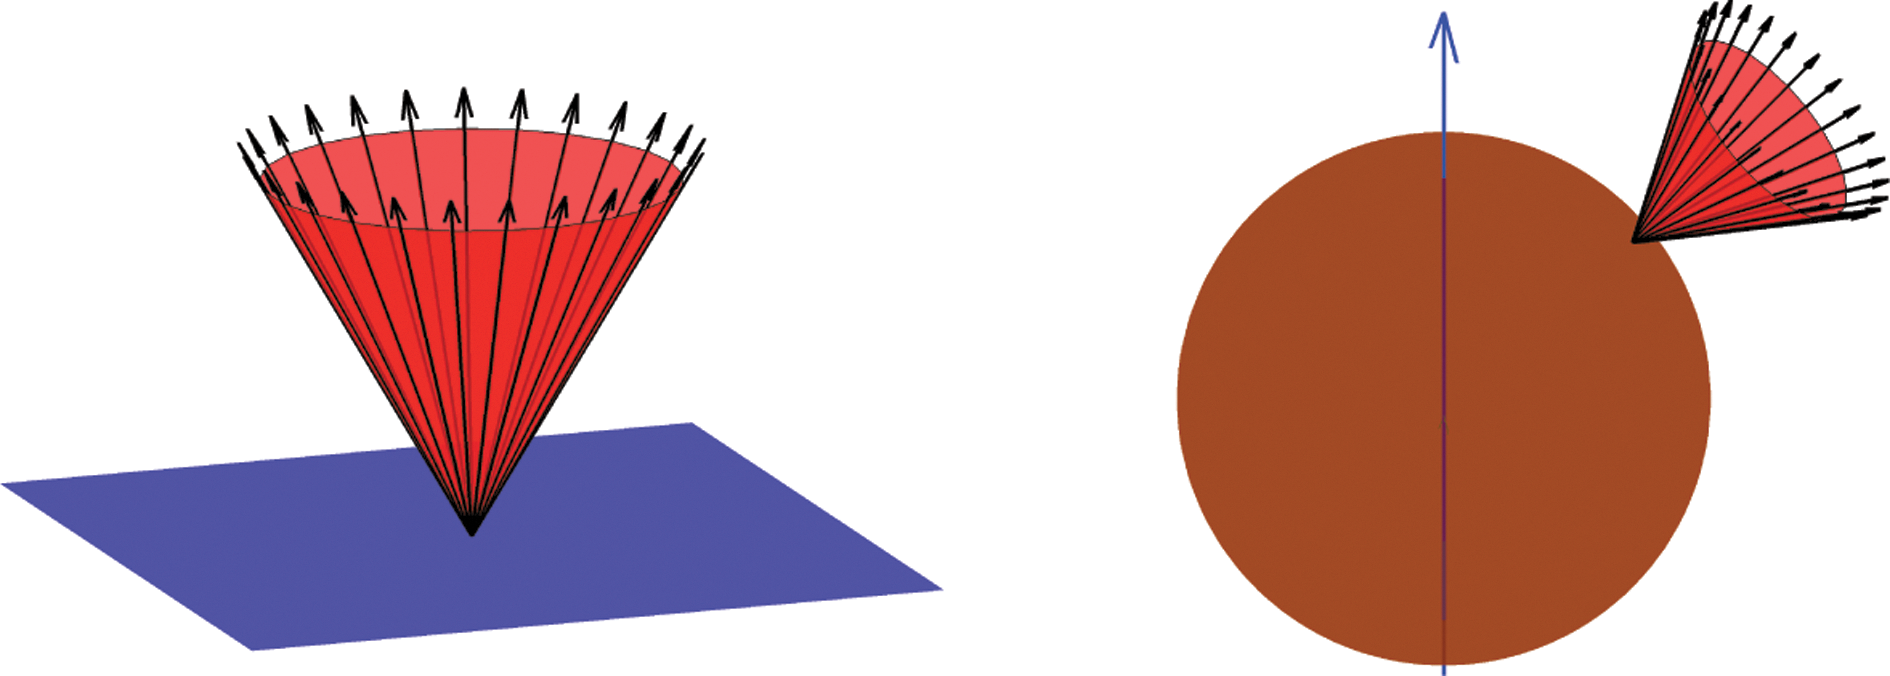
Initial conditions for the orbital path integration. Color images available online at
2.2. Mathematical model
The system is modeled in terms of a two-body problem composed of Mars (rotating) and an ejecta particle. The dynamical behavior of the two bodies, one modeled as a massless particle and the other as a tri-axial ellipsoid, yields additional complexities in comparison to a two-body point mass problem. To develop the appropriate differential equations, additional assumptions are included.
2.2.1. Assumptions
From a dynamical point of view, Mars is assumed to be rotating about a principal axis; in particular, the rigid body is assumed to spin about its axis of largest inertia at a constant rate ω. In reality, the axis of rotation is not exactly coincident with the principal direction, and its orientation varies slightly over time, with a precession period of approximately 26,000 years. Also, the obliquity of the equator varies with time, as much as 45 degrees in the last 5 million years. However, the satellites generally remain in the same plane with respect to Mars; that is, the orbital plane of the moons follows the variations of the obliquity of Mars' equator (Ward, 1992). Thus, for the bodies in this analysis, uniform rotation about a principal direction is a reasonable assumption. Besides an inertial reference frame, this rotational behavior motivates the definition of a rotating frame that is fixed in the body. As noted previously, this analysis is reduced to a two-body problem where the second body is a massless particle. Thus, the only gravitational force incorporated in the model is the force exerted on the ejecta particle by the irregularly shaped body. Other forces such as additional gravity fields or any other exterior forces are not included.
2.2.2. Equations of motion
The mathematical model that represents the behavior of the ejecta particles is based on the differential equations that govern the path of each individual particle. The equations of motion are derived from the gradient of the potential function associated with the second degree and order gravity model adopted for Mars, that is, expressed in terms of rotating coordinates,
where
where
3. Computation of the Total Probability of Impact
The total probability of impact is computed based on the results of the numerical simulations. An array of initial conditions is introduced to propagate representative ejecta particles. Each path is assessed to determine whether the particle enters a sphere of appropriate size that surrounds a specific moon. The algorithm is detailed below.
3.1. Numerical integration of the orbital paths
To develop an appropriate collection of initial conditions, a grid of points on Mars' surface is first defined. Recall that the model for Mars' gravity is equivalent to modeling the body as a tri-axial ellipsoid. Therefore, the grid is conveniently defined in terms of longitude–latitude, where the latitude is scaled with the cosine of the angle such that the surface elements defined by two longitude and two latitude points are conservative in terms of area. The grid of initial conditions models only half the planet, that is, the northern hemisphere; however, the model possesses symmetry properties with respect to the x-y plane such that the integrated trajectories for one hemisphere are mirrored across the equatorial plane, and similarly, the probability is the same. Thus, a set of initial conditions is defined at each point on the grid, corresponding to a particular curtain of ejecta, that is, a set of initial conditions at the location of the grid point lying on a cone of fixed angle with a given velocity magnitude. Note that initial velocities are defined to be relative to the planet-fixed frame. For any computation of standard orbital elements, such velocities are transformed to the inertial frame.
The entire grid of initial conditions is integrated by employing the equations of motion in Eq. 3 and using an impact detection strategy. The numerical scheme is implemented in a variable step predictor-corrector Adams-Bashforth-Moulton integration scheme. Two numerical issues are directly related to impact detection: the integrator step size and the spacing of two adjacent trajectories along the cone of initial conditions. A discrete set of initial conditions is integrated to generate the trajectories from the initial states on the cone that represents the curtain of ejecta; additionally, since impact detection is based on an assessment of a potential intersection of these trajectories with a target sphere surrounding the moon of interest, in this case Phobos, the spacing between two trajectories is also critical. To detect an impact, one that occurs at a distance from the center of Mars that is close to the orbit of Phobos, the distance between trajectories at this location must be sufficiently small compared with the size of the target sphere to ensure that no two adjacent trajectories “jump” the target. This challenge is resolved by (i) identifying each trajectory as a point at the crossing of Phobos' orbit, (ii) inspecting the distance between the two points that reflect two adjacent trajectories, and (iii) adjusting the number of initial conditions along one cone as is appropriate to ensure detection. The former issue is already partially addressed by considering an augmented target sphere rather than considering a volume model that is sized to perfectly reflect Phobos. However, for large velocities where the trajectories are generally straight and the integrator employs larger steps along the path, intersection with even the spherical target can be missed, so constant detection assessment is important during this simulation. Also, for lower velocities where the paths are largely curved and only a reduced section of the sphere target is “clipped” by the trajectory, the event may not be detected because of the very small size of the target. To remedy this problem, the event detection is decomposed into substeps. The algorithm initially detects a crossing of a distance that coincides with the orbital radius of Phobos, that is, a sphere of radius a Phobos, which is easy for the integrator to detect regardless of the integration step size. Then, the integration is reinitialized from the previous point with a finer step size to ensure the detection of any intersection with the target sphere.
3.2. Impact sphere representing a moon
A strategy to detect the intersection of the integrated path with Phobos is implemented within the integrator. The algorithm directly compares the integrated states of the ejecta particle with the position of Phobos at each time step along the integration path. However, given the relative dimensions of the two main bodies in the model, that is, Mars and Phobos, the dimensions of Phobos are very small with respect to Mars, resulting in significant numerical challenges to detect the intersection between an ejecta trajectory and Phobos' position along its orbit. Therefore, rather than considering Phobos directly, an augmented target, assumed spherical and of radius R
target=sphere×R
Phobos is used for the numerical computation and detection of impacts. The integrated position of the ejecta particle is compared with the boundaries of the target, that is, an oversized sphere, at each time step. Also, the fate of an ejecta particle depends on the initial position of Phobos on its assumed circular path. For the purpose of the numerical investigation, Phobos is arbitrarily placed along its orbit initially at

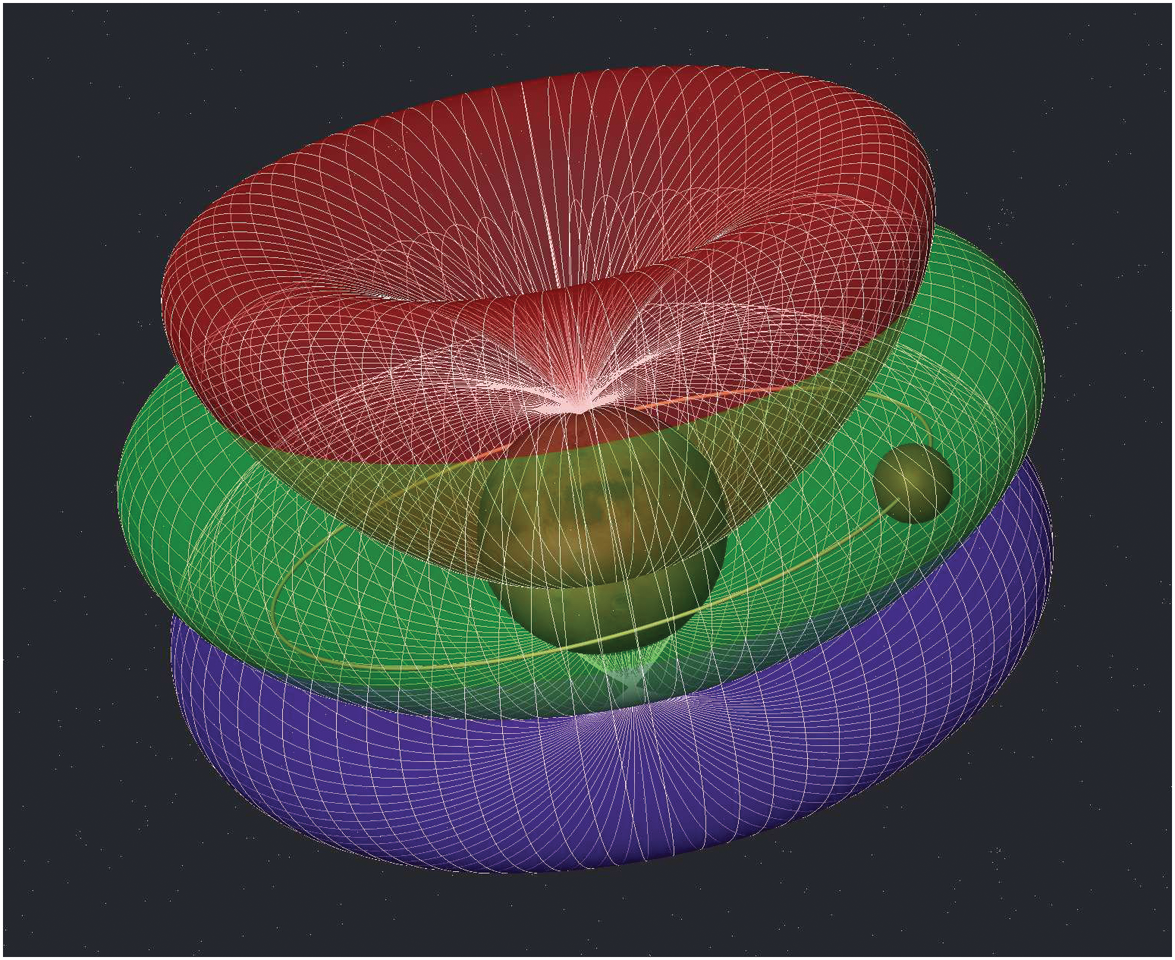
Sample curtain reflecting the trajectories of ejecta particles. Once an impact is detected, the grid is refined to better reflect the actual detection probability. Color images available online at
3.3. Probability computation
If any of the trajectories that belong to a curtain of ejecta yield an impact, the corresponding initial state is isolated. Additional sets of initial conditions that surround the impact are identified to produce a finer computation of the probability of impact. Essentially, additional initial state vectors are defined and integrated; any impacts are detected. Finally, for a given point on the grid, that is, for a given curtain of ejecta, the probability of impact is calculated as the ratio of impacting trajectories over the total number of trajectories, or p=N impact refine/N cone N refine, where N impact refine is the number of trajectories that impact the target after refinement, N cone is the number of trajectories initially propagated in one curtain of ejecta, and N refine is the ratio of the number of trajectories after refinement over the original number of trajectories. Ejecta curtains across the entire martian surface are simulated and probabilities summed to assess the likelihood of impacts with Phobos from ejecta emanating from all locations on the surface of Mars.
3.4. Sample craters
As an alternative to surveying the entire planet and defining a global grid of initial conditions, the simulation can also be run for specific locations corresponding to known martian impact craters. Essentially a reduction of the global approach, a grid of initial conditions is now composed of a unique location. However, due to the position of Phobos along its orbit, which varies over time, impacts on Phobos for a specific Mars location and a range of ejection velocities and angles may not be possible. To address this issue, a simulation is not initiated at a specific time, that is, for a unique initial position for Phobos on its circular path, as formulated for the global initial conditions grid. Rather, the orbit of the moon is discretized into a set of points appropriately spaced in angular position along the entire reference circular orbit. Then, the simulation is completed for every potential discretized initial position for Phobos to guarantee the complete capture of the impacting process on Phobos, independent of the original position of the moon. The procedure to compute the probability of impact is then the same as for the global approach. However, the probability of impact is less critical when considering a specific crater, since one crater at a given location is not representative of the overall impacting process on Mars. Other tools, however, are developed to gain insight into the problem, such as visualization of the curtain of trajectories as well as distribution of the impacts over the target surface.
4. Analysis Tools
4.1. Probability maps
Interpretation of the probability information, relevant to material transfer from Mars to Phobos, is accomplished with multiple types of output, including visual maps. The probability of impacting Phobos from a given location on Mars, and for a given velocity that corresponds to a particular ejection angle, is available through numerical integration of the ejecta trajectories. To visualize the probability of impact, a probability map is defined such that the horizontal and vertical axes represent the longitude and the latitude, respectively. The grid points then correspond to the initial conditions in terms of spherical coordinates. The initial conditions are subsequently integrated, and the color of a given point on the map is a function of the probability of impact that emerges from the simulation. Essentially, this tool allows visualization of the locations on Mars where ejecta from a crater, with the specified Mars-relative velocity and direction, results in impacts on Phobos. It is important to recall that Phobos is arbitrarily placed along its orbit when the simulation is initialized. Therefore, the maps are associated with a particular position of Phobos in its orbit, and the maps reflect an instantaneous footprint of the locations on Mars where ejecta from a crater results in impacts on Phobos.
4.2. Total probability curve
The individual probabilities, one associated with each point in the grid of initial conditions, are then summed over the entire set of points to define the total probability of ejecta particles reaching Phobos or Deimos. Recall that a set of initial conditions is composed of a number of curtains of ejecta defined at each point on the grid; for each of the curtains, the ejection angle and velocity magnitude are fixed. Thus, the total probability represents the averaged probability of impacting Phobos over all initial locations on Mars assuming a given ejection angle and velocity for a given initial location of Phobos along its orbit.
In interpreting the results for a given velocity magnitude, note that the velocities of ejection are relative to the surface of Mars, that is, the rotating frame. In contrast, because of Mars' rotation, with angular velocity assumed in the
4.3. Impact distribution on Phobos
The probability maps do not supply any information regarding the distribution of the impact trajectories at arrival over the surface of Phobos. To explore this issue, a visualization tool is introduced to represent the impacts on a three-dimensional sphere modeling the target. Thus, the Phobos arrival states available from the integrated trajectories are transformed from the Mars rotating frame defined for the integration procedure to a Phobos-fixed frame to illustrate impact locations. The
In addition to the distribution maps, the impact process on Phobos can also be visualized in terms of an occupancy map. Define a spherical grid in terms of longitude and latitude to map the target shape, that is, a sphere. The data used to generate a surface distribution of the impacts on Phobos include the position of the impact in terms of Cartesian coordinates as viewed from a Phobos-fixed frame. The grid is correlated with the impact data to count the number of impacts in each grid cell. The impact count for each cell represents the occupancy factor on Phobos and can be displayed as a two-dimensional map in terms of longitude and latitude over the sphere, that is, an occupancy map. In addition, the spherical grid can be transformed in terms of Cartesian coordinates to yield a three-dimensional view of the occupancy factors as displayed on a spherical target. The axes definitions in the three-dimensional map are identical to the surface distribution maps.
5. Application to Mars-Phobos System
5.1. Probability scaling relationships
The process of assessing the collisions of ejecta particles with Phobos assumes that Phobos is modeled as a sphere. Because of the significant difference in size of the bodies in the model, that is, Mars and Phobos, it is prudent to scale the size of the moon. Rather than modeling Phobos directly as an irregularly shaped body, an augmented target, assumed spherical and of radius R target=sphere×R Phobos is employed for the numerical evaluation of the impacts. However, the objective of this analysis is the probability of impact with an actual Phobos-sized target. Therefore, scaling relationships for the total probability as a function of the target size are necessary to evaluate the probability for phobian impact. To determine this relationship, the total probability of impact is computed for a range of speed and ejection angles but also target size. The probability of impact is expected to scale with the radius of the spherical target, that is, the cross section (R 2) or volume (R 3).
To investigate the correct scaling relationship, several different radii are numerically evaluated. First, the total probability for one angle and one velocity for different target sizes—for example, sphere=100, 75, 50, 25, and 10—is computed and compared for speeds relative to the surface equal to 4.2, 4.4, 4.7, and 5.0 km/s and ejection angle equal to 45 degrees. The results suggest that the total probability scales with the square of the radius for each of the four velocity magnitudes. The scaling relationship is then evaluated specifically. The total probability is computed for a wider range of velocities from 3.8 to 5.3 km/s for a 45-degree initial angle and sphere equal to 75, 50, 25, and 10. In Fig. 3, the total probability is scaled with the radius of the associated target and displayed as a function of velocity. The four curves appear to collapse altogether, confirming the proposed scaling relationship; that is, the total probability scales with the square of the radius of the target. Note that the curve for sphere=10 does not collapse perfectly. Given this small radius, numerical challenges emerge, specifically the detection of the intersection of a very small target with the integrated trajectory, compared to the other dimensions in the model as well as the step size in the integration algorithm. However, the general shape and most of the individual values are accurately represented. In all subsequent analysis in this investigation, the total probability of impact averaged over the surface of Mars for a given initial ejection velocity and angle is assumed to be consistent with the following relationship:

Total probability of impact as a function of ejection velocity for sample sphere sizes and initial ejection angle of 45 degrees averaged over all launch locations on Mars. Color images available online at
where sphere=R target /R Phobos with R Phobos=10.99 km is the averaged radius of Phobos. A single target size is subsequently selected to complete the various computations, a size that is sufficiently small to adequately represent Phobos but large enough to allow a reasonable numerical assessment process. After investigating probability maps and varying the size of the target, a size sphere=50 is selected for further analysis of the impact process. In the final evaluation of the probability of impact with Phobos, the probability is ultimately reduced to the actual size of Phobos by using the scaling relation in Eq. 6.
5.2. Analysis
5.2.1. Probability maps
For the selected target size, that is, sphere=50, simulations over a range of velocity magnitudes, from 3.8 to 5.3 km/s, and for three angles of ejection, that is, 30, 45, and 60 degrees, are completed. These simulations produced the data that generated probability maps. The color on the maps represents the probability of impact associated with a specific curtain of ejecta for a given angle and velocity of ejection as launched from the corresponding location on Mars. In all the maps, dark blue is associated with a zero probability; that is, out of the discrete set of trajectories that are propagated, none results in an impact of the target sphere. The intensity of the color, from blue to red, represents the increasing value of the probability. The regions of nonzero probability define structures on the map that characterize the fate of the ejecta depending on the initial location of the ejecta on the initial condition cone, for a given angle and speed of ejection. The plots in Fig. 4 represent the probability maps for a 45-degree angle of ejection over a range of velocity magnitudes from 4.0 to 5.1 km/s, in increments of 0.1 km/s. The evolution of the structures on the map as speed is varied is apparent.
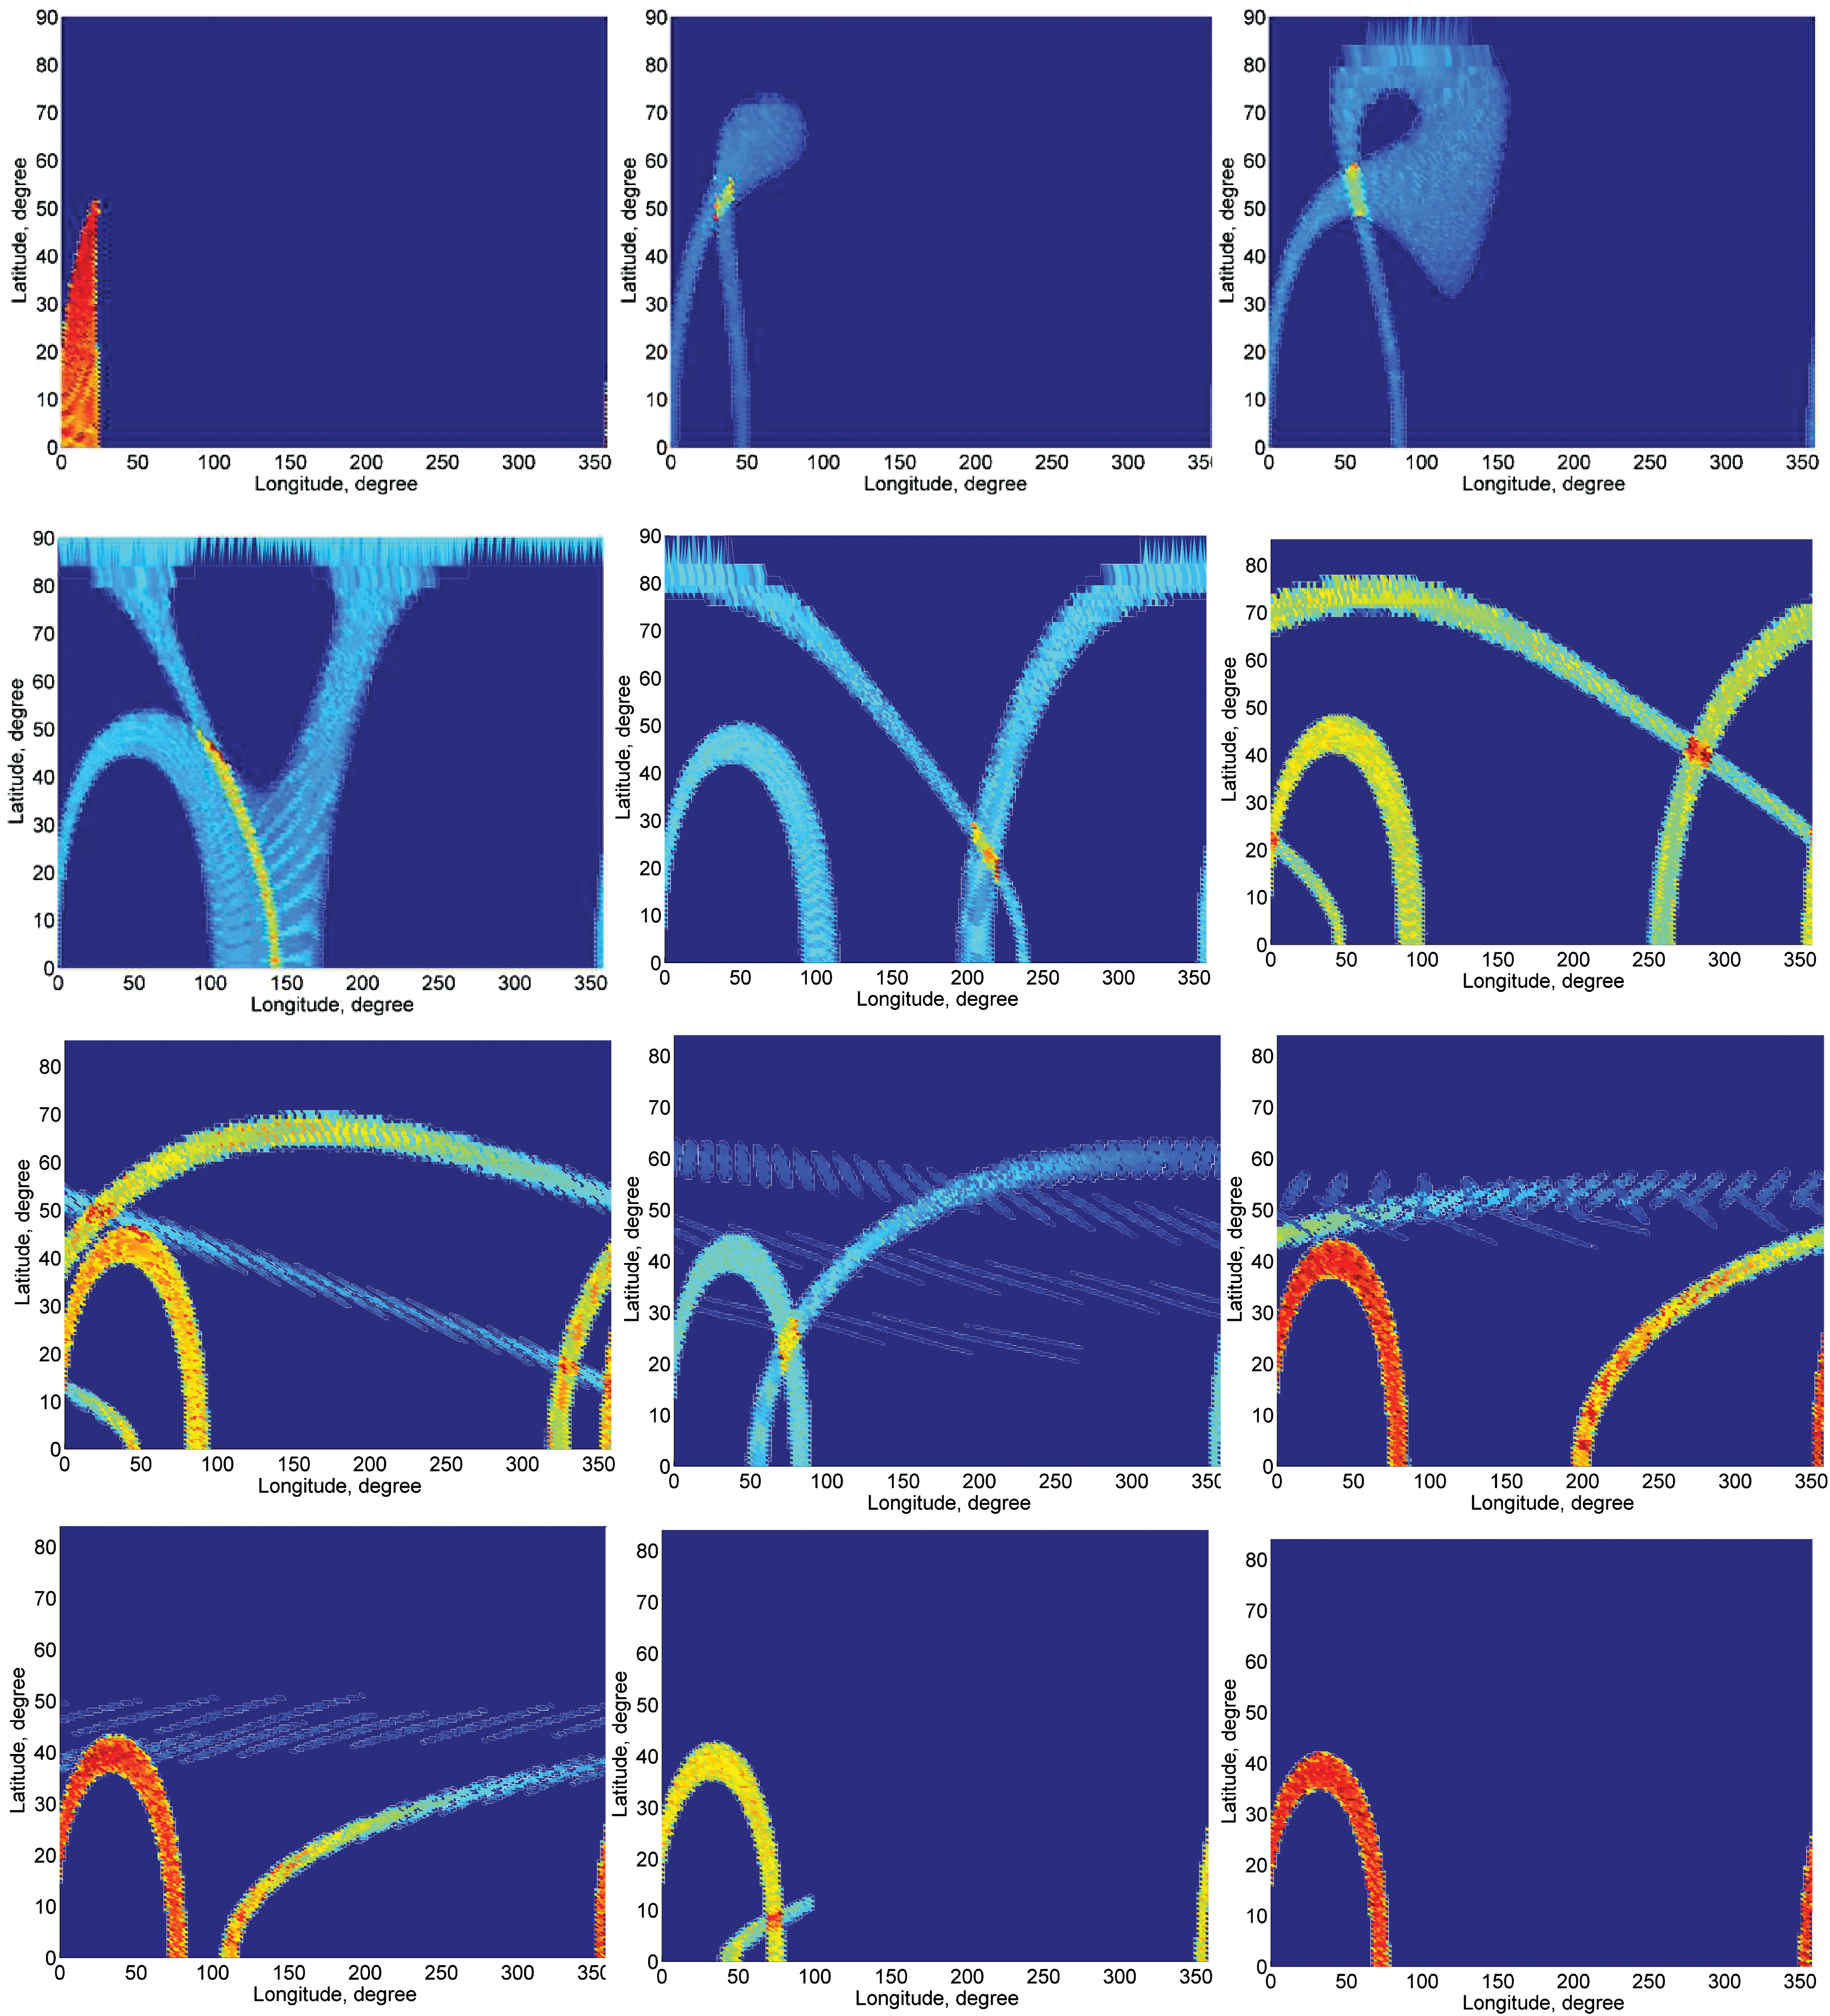
Probability maps for V
eje=4.0–5.1 km/s and β=45 degrees. Color images available online at
Different structures are identified on the maps depending on the velocity magnitude. The existence of two distinct structures that evolve as velocity changes is more obvious at the extremes of the range. One structure is associated with outbound impacts, that is, trajectories that hit the target with a positive component of radial velocity. Alternatively, inbound impacts, which are for trajectories hitting the target as the particle returns toward Mars, are associated with a different structure on the map. Note that for low speeds, such that the energy level of the particle allows an apoapsis that just barely reaches the orbit, only the structure with outbound impacts is apparent on the maps. Similarly, for large speeds, typically for velocities larger than escape speed, only the structure associated with outbound impacts is apparent. For intermediate velocities, where both inbound and outbound impacts are possible, the two structures appear and in some cases overlap.
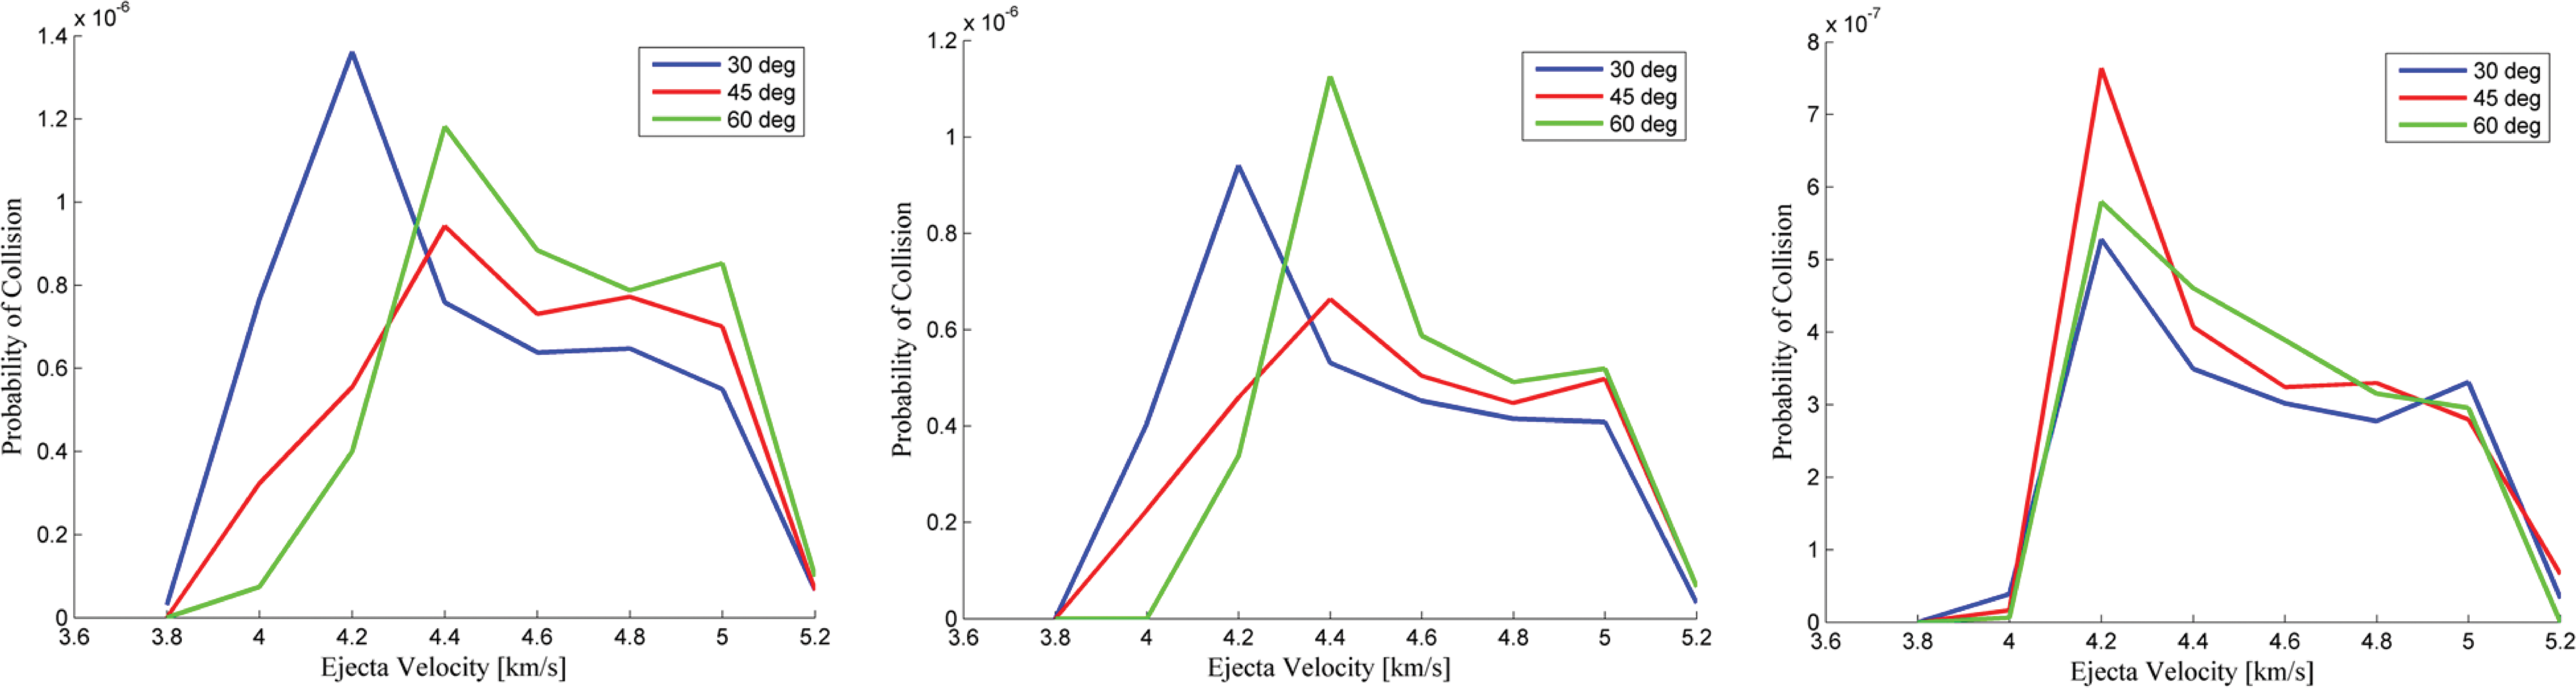
5.2.2. Total probability curve
From the individual probabilities in the maps, the total probability over the range of velocities and range of angles represented is computed for each velocity-angle pair. The total probability curves appear in Fig. 5 for each of the three angles. From this plot, the fate of the ejecta based on both velocity and angle of ejection is analyzed. First, for a given angle, the probability is not constant with velocity; instead, the curve exhibits a steep increase from zero impacts at 3.8 km/s in the 30-degree case to a maximum probability for approximately 4.2 km/s. Then, the probability decreases until stabilizing for velocities larger than 5 km/s. In contrast to the steep and regular increase before the maximum point, the subsequent decrease of the total probably is not as consistent. For velocities less than 3.8 km/s, for any angle, no trajectory reaches Phobos; that is, these trajectories all lack the energy to reach the orbit of Phobos. Then, the existence of a maximum probability results from the nonlinearity of the probability path. Depending on the ejection velocity, ejection angle, and location of the initial conditions on Mars' surface, the trajectories are ellipsoidal or hyperbolic but, from the curvature of the path and the fixed distance between the center of Mars and Phobos, some velocities offer more opportunity for ejecta to impact the target. For trajectories that evolve such that the curvature of the path results in a tangential approach to the target, the chances of impact are significantly increased. Similarly, once this optimal speed is surpassed, the probability decreases. Finally, for large velocities of ejection, typically for velocities larger than escape speeds, the trajectories are hyperbolic and can actually be approximated by straight outwardly directed lines that result in a rather constant probability for any velocity that is sufficiently large, as depicted by the eventual flattening of the curve in the plots in Fig. 5.
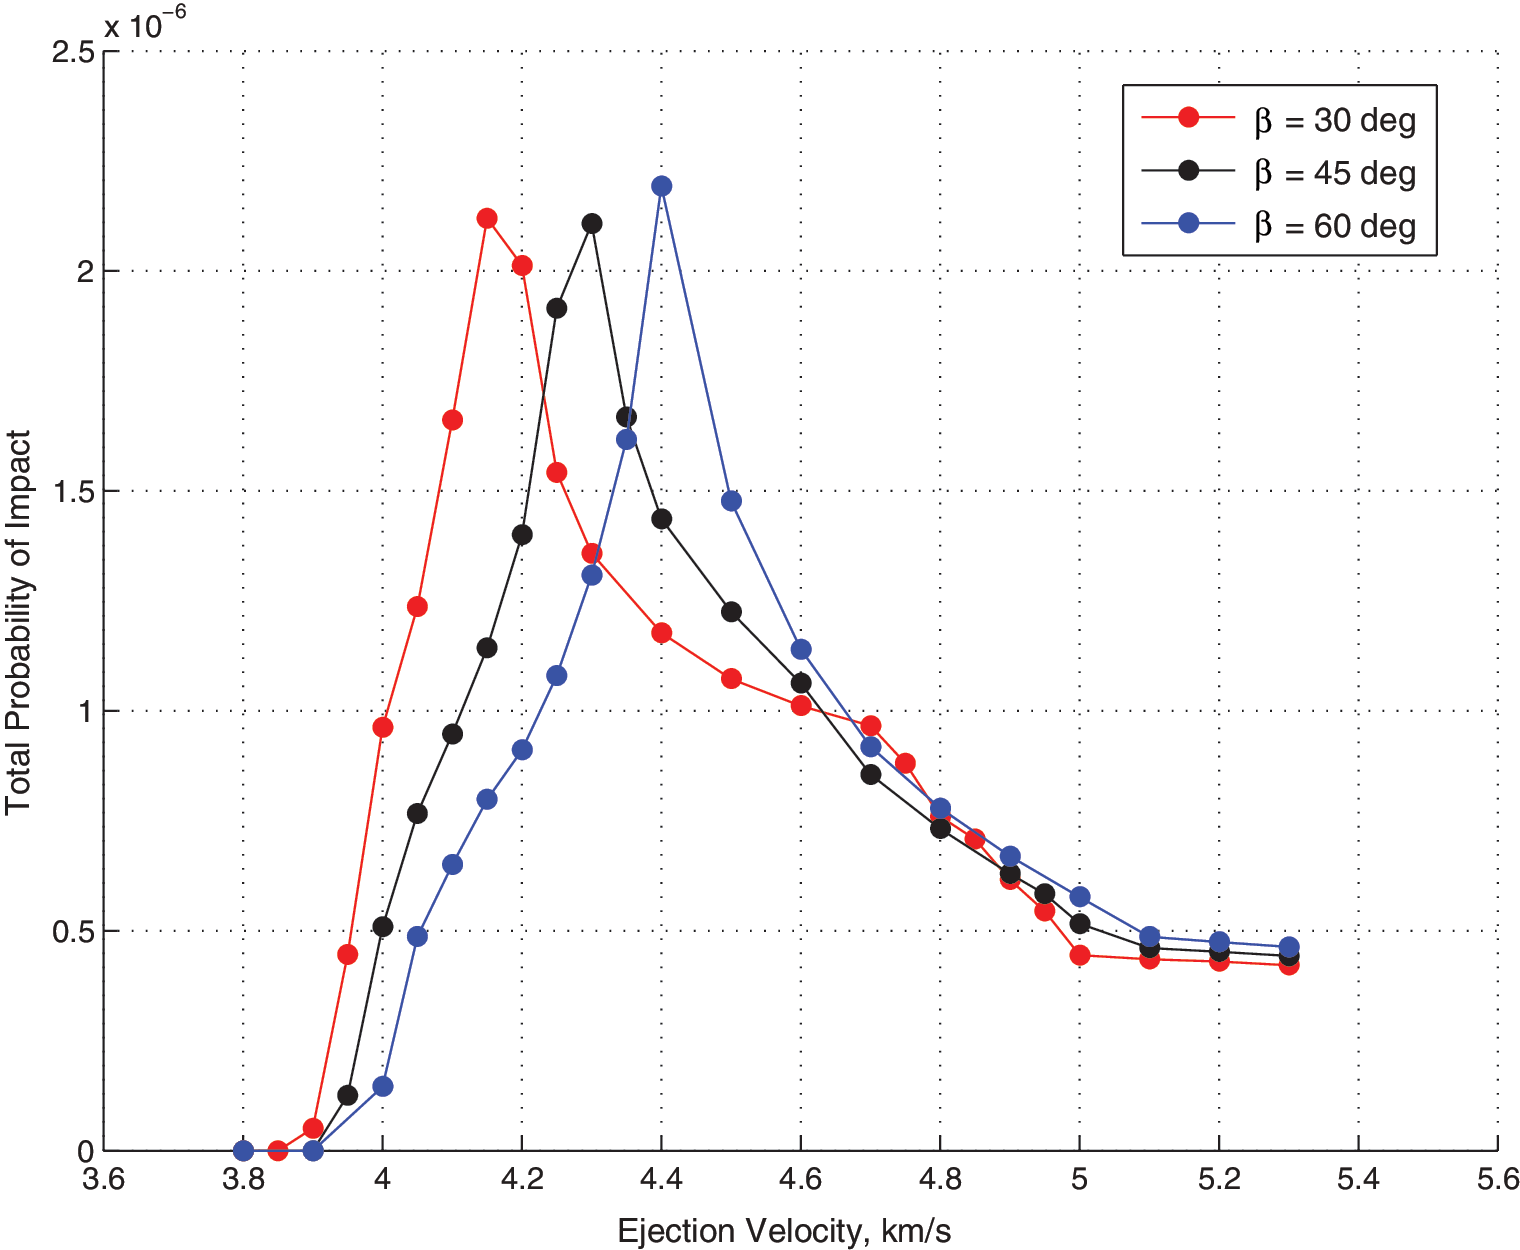
Total probability curve for V
eje=3.8–5.3 km/s, β=30, 45, 60 degrees and all three angles. Color images available online at
As a function of the cone angle defined for the ejecta, the probability curves can shift. First, the location of the maximum probability point, in terms of ejection velocity, varies depending on the angle of ejection. As the angle of ejection increases, the maximum probability point shifts to the right; that is, the velocity of ejection that yields the optimal curvature of the trajectories that maximizes the chance of impact is larger for larger angles of ejection. Also, as already noted, the decrease in the probability following the maximum point is decomposed into two parts, which is especially apparent for the 30-degree case. This break in the slope of the probability curve evolves depending on the angle of ejection. For the 30-degree case, this rupture is particularly extended from 4.7 to 5 km/s and shrinks with the angle; that is, it is almost not apparent on the 60-degree curve. Recall that in the plots in Fig. 5, the velocity of ejection corresponds to the initial velocity as viewed from the rotating frame.
5.3. Sample craters: Zunil, McMurdo, and Tooting
In contrast to a global grid of initial conditions that maps the entire surface of Mars and supplies a probability of impact on Phobos averaged over the surface of the planet, the contribution of individual craters is examined. Three known craters—Zunil, Tooting, and McMurdo—are selected for their size and locations. Simulations involving a particular crater allow for examination of additional aspects of the impacting process due to the curtain of trajectories as well as the distribution of the impacts on the moon target sphere. Information for the three craters is listed in Table 2 and includes the observed diameter of the crater and its location on Mars in terms of longitude λ and latitude φ.
5.3.1. Curtain of ejecta for sample ejection velocities and angles
Direct visualization of the orbital paths of the ejecta particles as a “curtain of ejecta,” that is, a surface, allows understanding and confirmation of the probabilities observed from the global approach. All the trajectories are displayed in Figs. 6 –10 from the perspective of the inertial frame; the colored surfaces then represent the curtains of ejecta. Phobos' orbit is illustrated as a gold circle and a sphere, which models the target, and is plotted to be 100 times larger than Phobos' actual mean radius and arbitrarily placed along the orbit. The first two figures, Figs. 6 and 7, reflect the curtain of ejecta for crater Zunil, located close to Mars' equator. The first view indicates the trajectories for a fixed initial ejection angle of 45 degrees and three different ejection velocities, 3.8, 4.2, and 5.0 km/s, represented in white, red, and green, respectively. The figure visually confirms observations from the probability maps; that is, the lowest velocity, 3.8 km/s, results in a curtain of ejecta with an energy level not sufficiently large for the trajectories to intersect the orbit of Phobos. Then, trajectories crossing Phobos' orbit and offering opportunities for the ejecta particles to impact the target when traveling first away from Mars and then back toward the planet result from an initial ejection velocity equal to 4.2 km/s. Finally, the green curtain associated with the ejection velocity of 5.0 km/s results in trajectories mostly hyperbolic; the particle on these trajectories can only impact the target as they leave the system.

Ejecta from Zunil Crater: V
eje=3.8 (white), 4.2 (red), and 5 km/s (green) with β=45 degrees. Color images available online at
Ejecta from Zunil Crater: V
eje=3.8 km/s with β=30 (white), 45 (red), and 60 (blue) degrees. Color images available online at

Ejecta from McMurdo Crater: V
eje=3.8 (red), 4.4 (green), and 4.8 km/s (purple) with β=45 degrees. Color images available online at
Ejecta from McMurdo Crater: V
eje=4.4 km/s with β=30 (red), 45 (green), and 60 (purple) degrees. Color images available online at
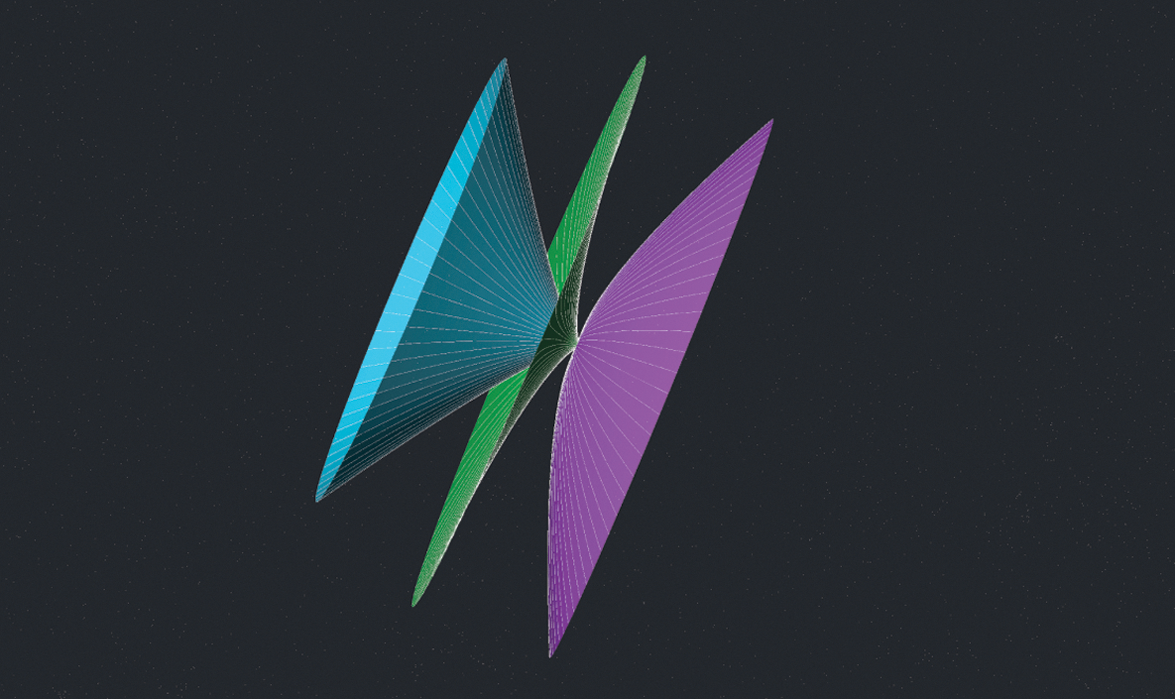
Ejecta from Tooting Crater at V
eje=5 km/s with β=30 (cyan), 45 (green), and 60 (purple) degrees. Color images available online at
Next, Fig. 7 shows curtains of ejecta for a fixed velocity, 3.8 km/s, and three different ejection angles, 30, 45, and 60 degrees depicted by the white, red, and blue surfaces, respectively. Note that independent of the ejection angle, none of these curtains possess energy values that permit the trajectories to reach Phobos' orbit. However, a smaller ejection angle results in curtains that reach out farther from Mars' surface; that is, the ejection velocity required to reach Phobos increases with the ejection angle.
Curtains of ejecta associated with McMurdo Crater are illustrated in Figs. 8 and 9. Similar to Zunil, the first figure represents trajectories for a fixed angle, 45 degrees, and three ejection velocities, 3.8, 4.4, and 4.8 km/s. It is interesting to note that, due to the location of McMurdo Crater, which is almost polar, only a few combinations of ejection angle and velocity create the conditions necessary to impact the target; the red and green curtains for 3.8 and 4.4 km/s never cross the orbit of Phobos. However, if these conditions are met, ejecta trajectories intersect with a large portion of the target orbit, as illustrated by the purple surface associated with ejection velocity of 4.8 km/s.
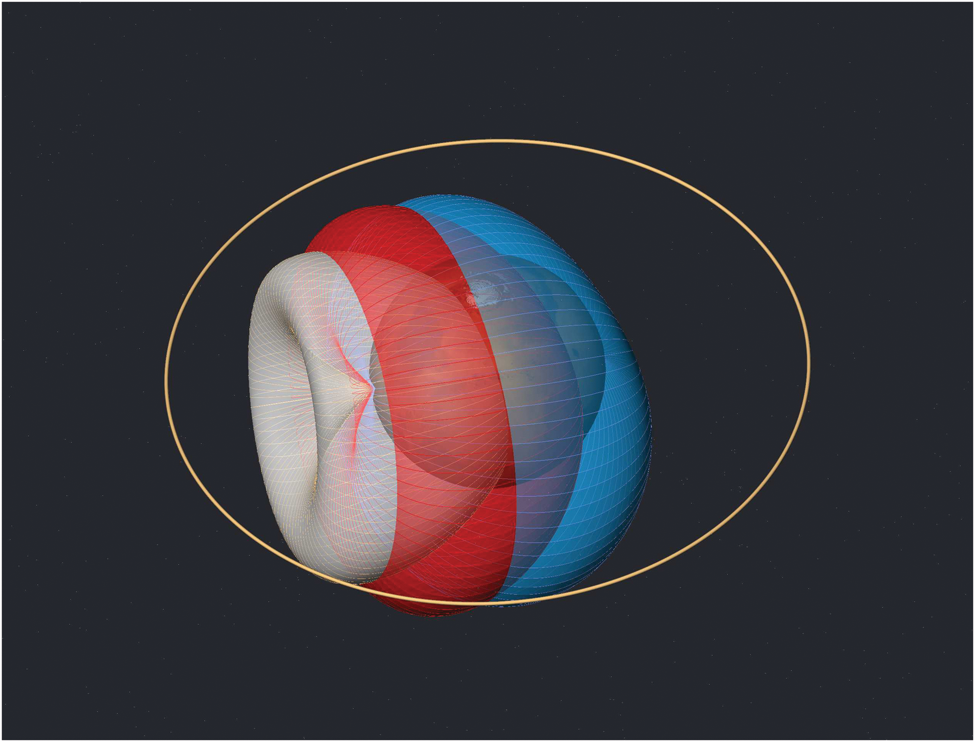
In addition to these observations, the illustration in Fig. 9 further emphasizes the discrete set of possibilities resulting in impacts for McMurdo Crater. Represented in this figure are curtains of ejecta for a fixed ejection velocity, 4.4 km/s, and the three ejection angles, 30 (red), 45 (green), and 60 degrees (purple). None of these curtains collide with the target, regardless of the position of Phobos along its orbit. Finally, high ejection velocity trajectories for the last crater, Tooting, are represented in Fig. 10. More precisely, an ejection velocity of 5 km/s for the ejection angles 30, 45, and 60 degrees yields the trajectories displayed in cyan, green, and purple, respectively. Compared to the previous figures, the scale is much larger here; Mars is not visible, although it is present at the common base of the three curtains. Note that, while all three curtains originate from a launch on Mars' surface and are directed to the upper right with the respecting ejection angles, the 60-degree curtain immediately reverses direction.
5.3.2. Distribution of impacts
The surface distribution of the impacts on Phobos for each of the three craters is generated for each combination of ejection angle and velocity. A commercial scientific visualization software package, Avizo, allows the three-dimensional visualization of the distribution spheres. Illustrated in Fig. 11 are the impact distributions with all velocities overlaid on a single sphere for the three ejection angles, that is, 30, 45, and 60 degrees for the Zunil Crater. The left illustration in Fig. 11 is a three-dimensional view of the 30-degree case, and the next two plots are views, looking down on the orbital plane, of results from the simulations initiated from ejection angles of 45 and 60 degrees. Recall that Zunil is located at 7 degrees of latitude, which is close to equatorial. In this representation, the x direction (red) is radial from Mars' center to the target, the y direction (green) corresponds to the direction of the motion of Phobos along its orbit, and consequently the z direction (blue) passes through the poles of the spherical target, that is, normal to the moon's orbital plane. Also on the sphere, blue points correspond to outbound impacts, that is, trajectories traveling away from Mars, while red points are associated with inbound impacts, that is, trajectories that collide with the target after reaching apoapsis and return toward the planet's surface. In the first representation, a heavy bombardment of the target is clearly observed with cleared regions at the North Pole. Also noticeable in the x-y view, the “back” face of Phobos, that is, the face opposing Mars, is also heavily bombarded. The only regions with no, or very few, impacts are those at the poles, those restricted to the close vicinity of the poles, and the trailing face of the target. Because the target moves along its own path, the relative velocity of the ejecta particle and Phobos, that is, the difference in the velocity of an ejecta particle and the orbital speed of Phobos, does not permit impacts on the trailing face of Phobos, whereas the leading face is heavily bombarded. The even distribution of the impacts results from the almost equatorial location of the crater. The surface distribution is very similar for all three ejection angles, and the overlay of the three cases only increases the density of impacts without occupying more space on the sphere than the individual examples.

Impact surface distribution for Zunil Crater for β=30 (left), 45, and 60 (right) degrees. Color images available online at
5.3.3. Occupancy maps
Occupancy maps are a visual representation of the density distribution of the impacts on the phobian sphere surface. Occupancy maps are generated from the same data previously employed to produce the surface distribution maps; an occupancy factor is defined to be representative of the number of impacts per unit of surface. The three-dimensional view of the occupancy factor as displayed on a spherical target is intuitive. The working frame in this case is also the moon-fixed frame to correlate with the surface distribution maps. In Fig. 12, the three-dimensional views for Zunil Crater appear for the 30-, 45-, and 60-degree ejection angles. Again, in this orbit-fixed frame, the x direction (red) is radial from Mars to the target, the y direction (green) corresponds to the direction of the motion of Phobos along its orbit, and consequently the z direction (blue) goes through the poles of the spherical target, that is, normal to the orbital plane. Clearly, a denser impact distribution is apparent on the leading face of the target, concentrated near the equator. However, this distribution does vary depending on the ejection angle.

Three-dimensional occupancy map for Zunil Crater for β=30 (left), 45, and 60 (right) degrees. Color images available online at
5.3.4. Relative velocity of ejecta hitting Phobos
Additional insightful information available from the simulation is the impact velocity magnitude on Phobos of the ejecta particles that collide with the martian moon. The relative velocity magnitude of an ejecta particle with respect to Phobos varies greatly depending on the location on Mars from which the particle originates, the ejection velocity magnitude, and the location along the particle's path at which the collision with Phobos occurs. The impact velocity magnitude ranges from 1 to 4.5 km/s for ejection velocity magnitudes from 3.8 to 5.3 km/s. However, some trends emerge: a higher ejection velocity from the surface of Mars results in a higher-energy path or a more elliptic trajectory and, in general, translates to a higher collision velocity magnitude. Also, for similar energy trajectories, the magnitude of the collision velocity with Phobos is also directly related to the relative direction of the ejecta motion along its path and Phobos' orbital motion: because Phobos is not stationary but traveling along an almost equatorial circular orbit, ejecta trajectories for which the plane that contains the ejecta path is the least inclined with respect to the phobian orbital plane exhibit the smallest collision speed; that is, a larger component of Phobos' orbital speed is subtracted from the ejecta absolute speed resulting in a smaller relative collision velocity magnitude.
6. Analytical Models
6.1. Öpik's model
In an analytical approach, the method presented by Öpik offers a formulation for the probability that a particle crossing the orbit of the planet will actually collide with the planet (Öpik, 1951). Various assumptions enable the application of this model to determine the probability that ejecta from Mars will collide with Phobos.
6.1.1. Approach
Öpik's model provides equations that relate orbital parameters to the probability of collision between orbiting objects. In this study, the larger orbiting object models Phobos, and the smaller body is considered to be the mass ejected from the surface of Mars. Actual characteristics of the orbit of Phobos are listed in Table 1. Consistent with the assumptions in this analysis, Phobos is assumed to be in a circular orbit around Mars with semimajor axis a Phobos=9377 km, zero inclination, and an orbital period of 7.65 h. The orbit of the small body is modeled as eccentric with orbital parameters a, e, i. To generate a probability of collision, the orbit of the small particle must cross the orbit of the planet, that is, r p<a Phobos<r a, where a Phobos is the radius of Phobos' orbit and r p and r a are periapsis and apoapsis of the particle's (ejecta's) orbit, respectively. When a Phobos<r p and a Phobos>r a, the probability of collision is automatically zero.
The probability of collision per revolution of the ejecta particle with the planet/moon is calculated from the orbital elements of both orbits, a, e, and i; the relative velocity, V
r; the orbital period, P; and the collision cross-sectional area, σ, which is a function of the radii and the masses of the two bodies. The equation for the probability of collision is given by
where σ is the collision cross-sectional area between the two randomly oriented objects of average radii r
1 and r
2 and masses m
1 and m
2, and is evaluated as
Then, V
e is the escape velocity, that is,
and G is the universal gravity constant. Recall that Öpik's model assumes circular and eccentric orbits for the larger and smaller bodies, respectively. There are some generalizations of Öpik's equation that allow both colliding bodies to follow eccentric orbits (Kessler, 1981); however, such modification will not be introduced in this study since it is reasonable to assume that Phobos is in a circular orbit in the equatorial plane.
There are other limitations to this approach as well. The orbit of the small body must be closed, that is, circular or elliptical, but not hyperbolic. Trajectories with an eccentricity e>1 and a<0 are not introduced in Öpik's model. However, the probability of collision for these hyperbolic trajectories is incorporated into the results with a different approach. Öpik also assumes that the time between encounters is long compared to orbital precession periods; thus, successive encounters are uncorrelated (Dones et al., 1999).
6.1.2. Results: elliptical trajectories
The following physical parameters are employed for Phobos and the ejected particle: radius of Phobos=10.99 km, mass of Phobos=1.0659×10¹⁶ kg, radius of ejecta=0.5 m, and mass of ejecta=1.5184×10³ kg. The mass of the ejecta is calculated assuming a spherical rock of radius 0.5 m and a density of that rock, that is, 2.5 g/cm3. A large number of trajectories are considered for the ejected mass and the probability of collision between each trajectory, and Phobos is computed by using Öpik's equation. These trajectories are selected by crater, initial ejection angle, and initial velocity. For one specific crater and one specific cone angle, a range of trajectories is selected to generate a range of seven initial velocities. Then, the probabilities of impact are averaged for each velocity. The three craters considered in this analytical model are Zunil, Tooting, and McMurdo, which are consistent with the craters considered in the numerical analysis. Three ejecta cone angles are also considered: 30, 45, 60 degrees. The initial velocities for the ejected particles from Mars range from 3.8 to 5 km/s in increments of 0.2 km/s. The radius of the phobian sphere is specified as R target=50×R Phobos, which is 549.5 km. The probability of collision is scaled by 502, which is consistent with the numerical analysis. The plots in Fig. 13 represent the probability of collision between the particles ejected from the three craters—Zunil, Tooting, and McMurdo—and the sphere Phobos as a function of the initial velocity of ejection. The curves in blue, red, and green represent the probabilities for cone angles of 30, 45, and 60 degrees, respectively. The results illustrated in Fig. 13 corroborate the results presented in the numerical section. The order of magnitude for the probability of collision is the same as the probabilities determined numerically, that is, 10−6. The probability curves as a function of the ejecta velocity possess similar characteristics. The highest probability occurs for ejecta velocities between 4.2 and 4.4 km/s. For velocities V eje>4.4 km/s, the probability of collision decreases to a steady value near 3×10⁻⁶, which is in agreement with the numerical results.

Probability of collision for elliptical trajectories only—Tooting (left), Zunil, McMurdo (right). Color images available online at
6.1.3. Results: hyperbolic trajectories
Öpik's model is limited to circular and eccentric orbits. However, as the initial ejecta velocity increases, the number of hyperbolic trajectories increases. Therefore, these trajectories must be incorporated into the results since these trajectories may have a large effect on the probability of impact as the ejecta velocity increases. A simple probability calculation is applied to this set of trajectories with a<0 and e>1. First, the probability of Phobos being at any point along its orbit is assumed equal. Thus, the probability of impact for these hyperbolic trajectories is given by
where R target is the radius of the sphere of Phobos and a Phobos is the semimajor axis of the moon's orbit. Then, the probability of impact between each hyperbolic trajectory and Phobos' orbit is considered. The orbital elements associated with each hyperbolic trajectory, that is, semimajor axis, a, eccentricity, e, inclination, i, and orientation, ω and Ω, are transformed into position components for the trajectory, x, y, and z, by using a transformation matrix. If a given hyperbolic trajectory intersects the orbit of Phobos, then the probability of impact is p hyp. If the trajectory does not hit the orbit of Phobos at any point, then the probability of impact is zero. This process is repeated for each hyperbolic trajectory, and the results are averaged for each set of initial velocities and cone angles. These results are then added to the results obtained with Öpik's model and plotted in Fig. 14. These plots represent the total probability of collision between the particles ejected from the craters (Zunil, Tooting and McMurdo) and the sphere representing Phobos as a function of the initial velocity of ejection. The curves in blue, red, and green represent the probabilities for cone angles of 30, 45, and 60 degrees, respectively. The order of magnitude for the probability of collision of all trajectories is consistent with the order of magnitude for the probabilities of the elliptical trajectories found when using Öpik's model. There is a decrease in the probability of impact for V eje>5 km/s, which corresponds to hyperbolic trajectories only. However, these hyperbolic trajectories have a small effect on the total probability corresponding to V eje<4.8 km/s.
Probability of collision for all trajectories—Zunil (left), Tooting, and McMurdo (right). Color images available online at
6.2. A statistical approach
A second analytical assessment was investigated by using a more statistical approach to calculate the collision probability of two orbiting objects given their error covariance matrices at the point of closest approach. The motivation to use a different method was to compare the results from Öpik's approach and obtain a formulation that includes all trajectories, independent of the eccentricity or semimajor axis values. In this approach, the proximity to Phobos of each trajectory is checked against a critical distance to determine whether a probability calculation is warranted. Once a potential collision is identified, the error covariances and state vectors of each ejecta particle near the point of closest approach are employed to compute the collision probability (Alfriend et al., 1999; Akella and Alfriend, 2000; Patera, 2001; Alfano, 2005a, 2005b, 2006). In this model, the relative velocity is considered constant during the encounter period, and the physical shape of each object is again assumed to be spherical. The type of orbit corresponding to each object is not a factor in this analysis since only the position and velocity states at closest approach are incorporated. The motion of the objects is represented by straight lines with constant velocities during the encounter because the time duration of the encounter is very small. There is no velocity uncertainty during encounter; the position uncertainty, however, is assumed to be constant. The positional covariances of the two objects are assumed to be independent and are represented by Gaussian distributions. Since one of the objects in this analysis, Phobos, is much larger than the intercepting object, the intercepting object can be considered a point mass (Akella and Alfriend, 2000).
The results obtained with this approach are in agreement with the results obtained numerically. The addition of reasonable covariance matrices to the model offers the advantage of calculating the probability of impact given position uncertainties. The probability of collision was found to be linear with respect to variation in the position uncertainty.
7. Mass of Martian Material and Ejecta Size Distribution
The overarching goal in this investigation was to assess the likelihood that mass originating from Mars is transferred to Phobos. Thus, the objective of the computation that follows was an approximation of the mass of material from impacts on Mars accumulating on Phobos over some period of time, 10 million years in this analysis. To complete this task, empirical results from impact cratering physics were employed to compute an approximation that reflects the mass of material. Already available from this investigation is the total probability of impact on Phobos from ejecta originating on Mars as a function of the ejection velocity. Here, the mass ejected from Mars that is representative of the martian impacting process over the last 10 million years as a function of ejection velocity is required to compute the total mass that likely impacts Phobos at a given initial ejection velocity.
7.1. Crater size distribution
In the strategy to compute an approximation of the mass of material from impacts on Mars that may exist on Phobos, the first step is to estimate the total mass of martian material ejected from the planet's surface over the last 10 million years. A sequence of craters is defined, in terms of diameter and the number of occurrences for each diameter, representative of the martian impacting process over the last 10 million years. Within this time period, there are four recognized martian meteorite launch events that provide a reasonable sampling of the time period selected for this analysis. These events occurred at approximately 1, 3, 4, and 10 million years ago. This task is achieved by exploiting crater size distribution observations on Mars; in particular, the Hartmann-Ivanov isochrons (Ivanov and Hartmann, 2007; Bart and Melosh, 2010) feature the cumulative crater count for increasing diameters over a given period of time, as illustrated in Fig. 15. From this sequence, the ejected mass associated with each crater is computed to approximate the total mass ejected from the surface of Mars during the specified time period. First, the observed diameters as defined in the crater sequence are transformed into transient crater diameter (Bart and Melosh, 2010), that is, d
tr=0.75d
obs. Then, a simple geometrical model (Richardson et al., 2007) for the crater is defined to compute the volume of a crater of a given diameter
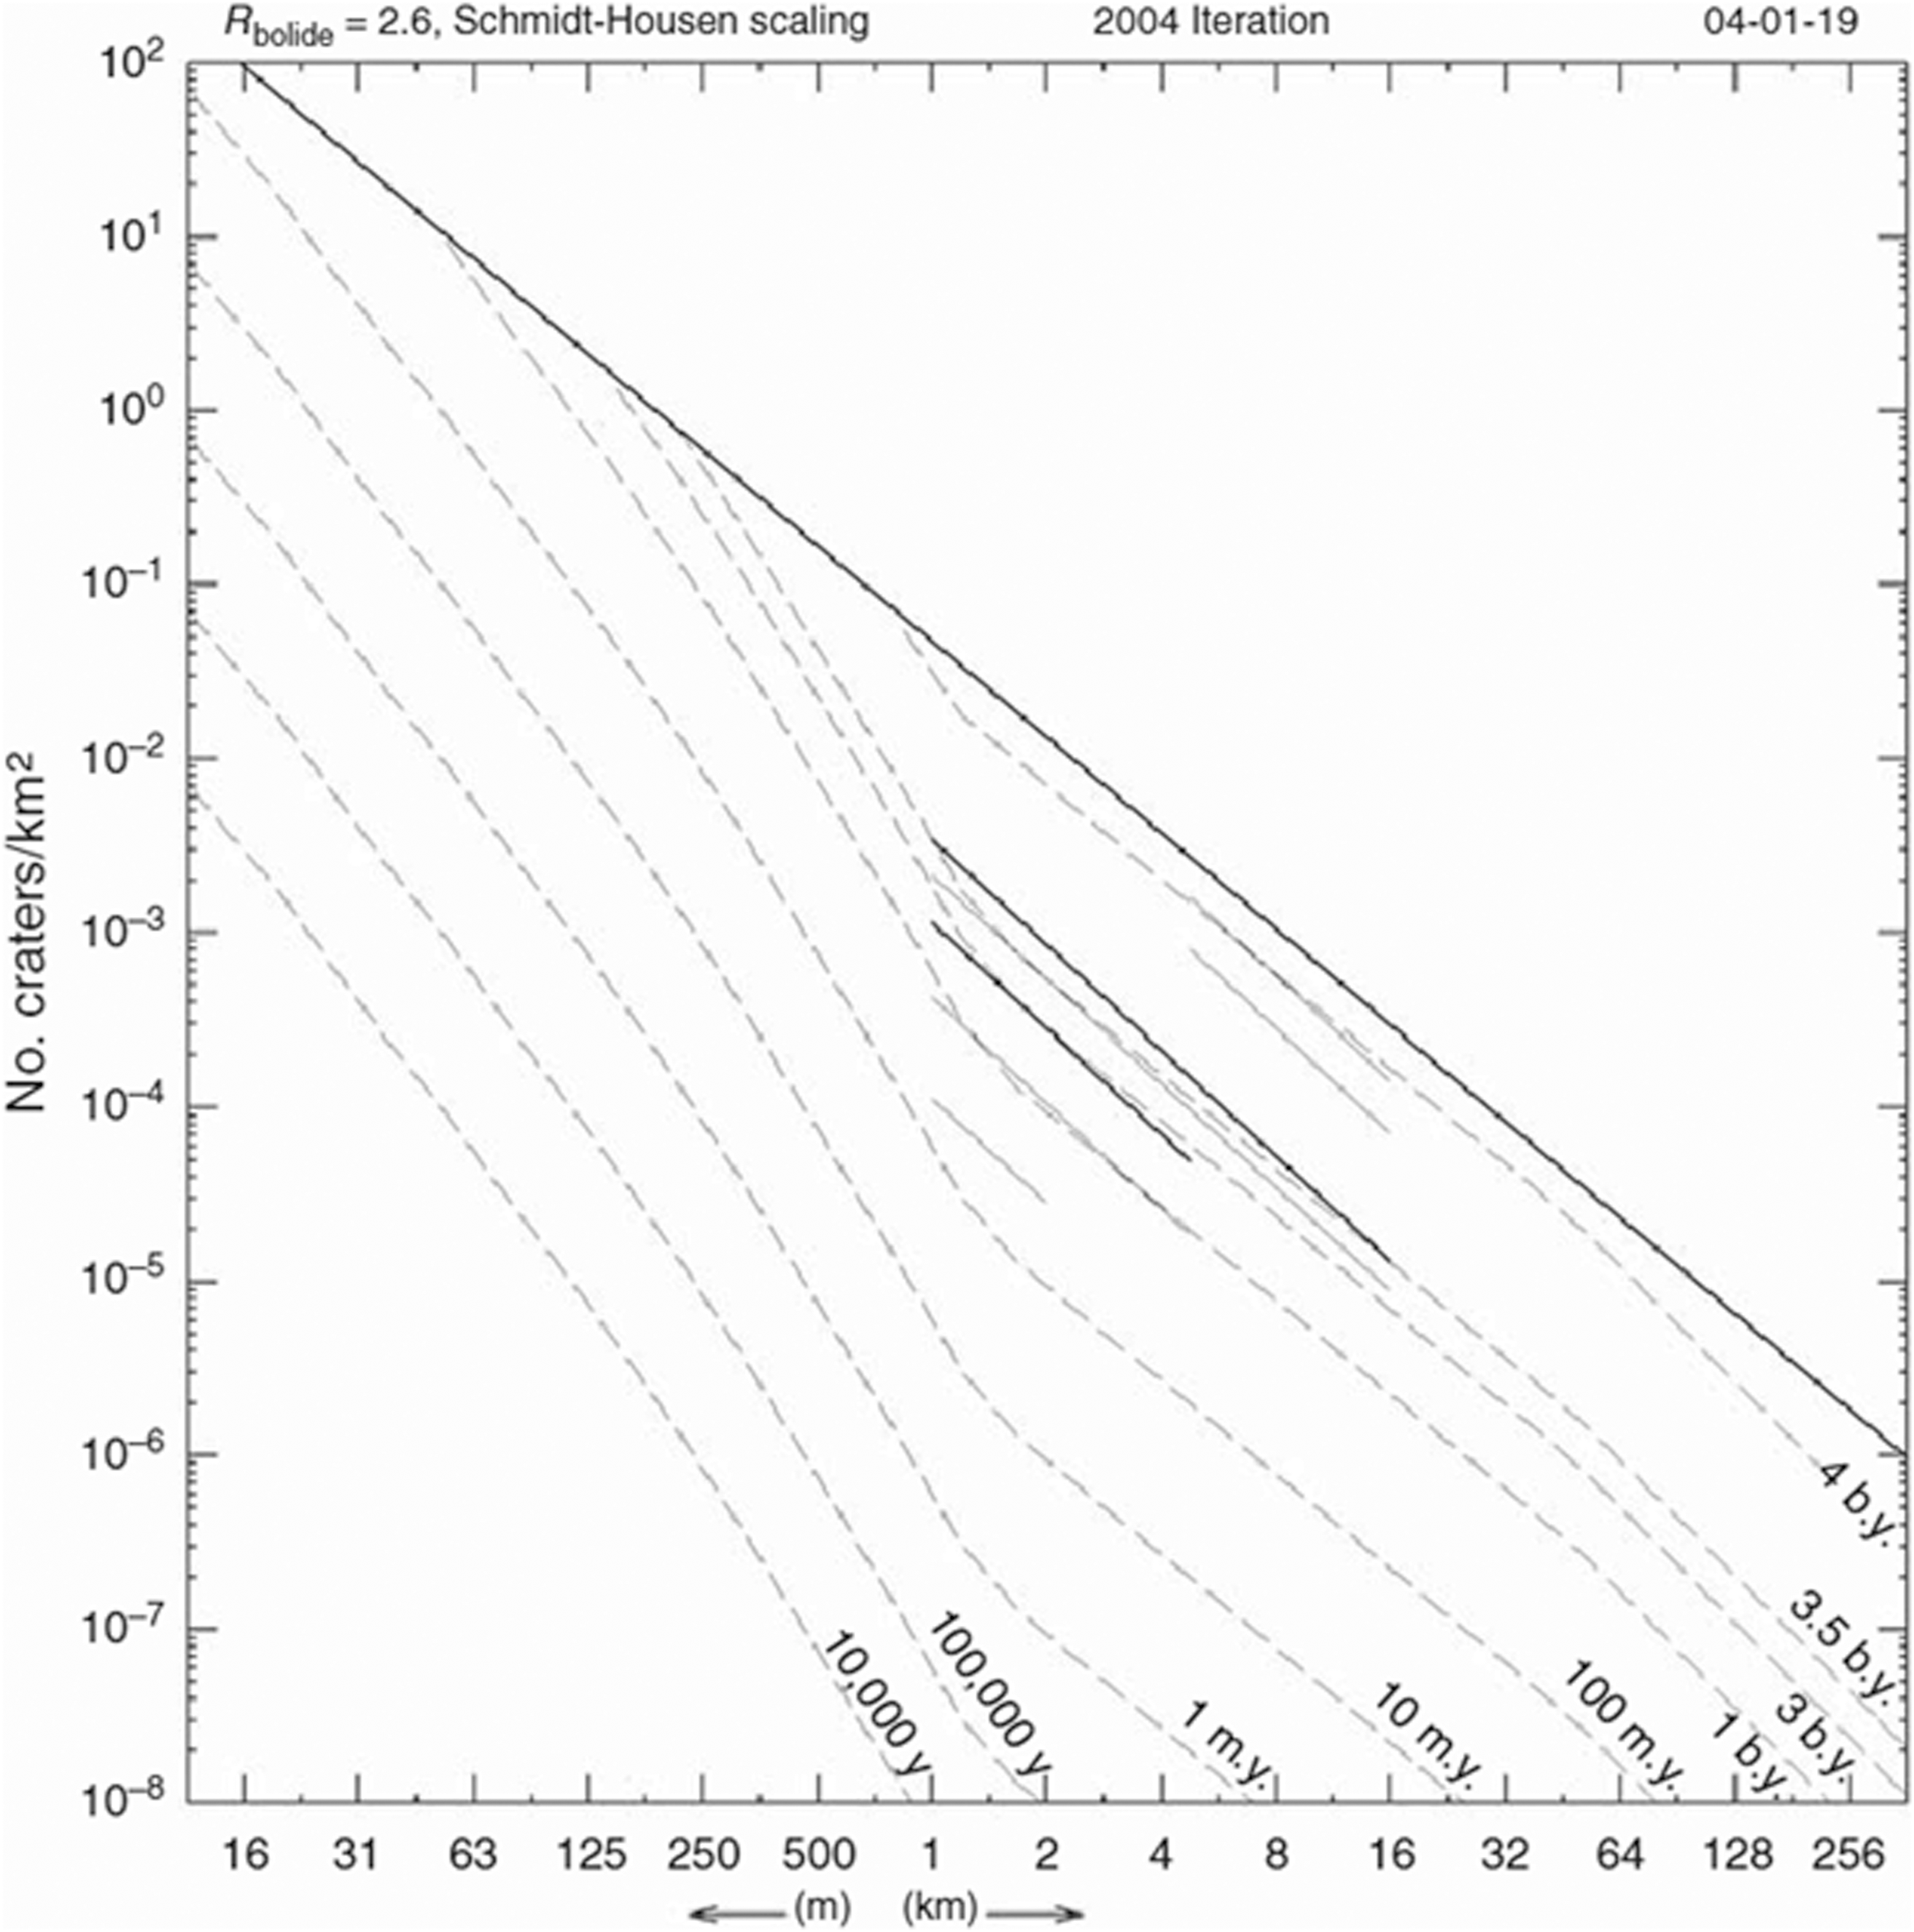
Hartmann-Ivanov isochrons (Ivanov and Hartmann, 2007) for martian crater distribution.
7.2. Mass ejected—velocity distribution
Total probability is computed for a given angle of ejection as a function of the velocity of ejection. From cratering physics, it is known that the mass ejected from a given crater is also dependent on the ejection velocity of the ejecta. Thus, it is necessary to relate the total mass ejected over 10 million years to the velocity of ejection. Although the exact law governing the mass distribution as a function of the ejection velocity is not known, it is generally assumed to follow an inverse power law distribution (Melosh, 1985; Gladman, 1997; Head and Melosh, 2000) where the power exponent ranges from 1.2 to 1.7. In this study, the value of 1.5 was adopted for the computation of the mass on Phobos. By differentiating the cumulative inverse power law distribution, the density distribution for the mass ejected as a function of velocity is obtained. First, we consider the cumulative distribution
Then,
where v
co represents the cutoff velocity magnitude for the power law and m
tot is an approximation for the total mass of material ejected from the martian surface due to a crater event. This expression supplies a law governing the mass ejected for a given ejection velocity as a fraction of the total mass ejected. The cutoff velocity
7.3. Integration of the mass of ejecta impacting Phobos
The probable mass that impacts Phobos at a given ejection velocity is then directly obtained by multiplying the probability of impact and the mass ejected, both expressed as a function of the ejection velocity. Then, the net mass on Phobos is obtained by integrating the probable mass over the velocity of ejection. Also, the mass over the total period of time is transformed into an average mass per year; that is,
where T=107 years=10 million years is the period of time considered in this investigation, and A Phobos is Phobos' area. Also, it is assumed that the ejected material is uniformly mixed in a regolith layer of depth d=1 m. Finally, the mass computed translates to 195 μg of possible material from Mars in a 100 g sample for a 45-degree ejection angle, assuming a mean density of 1.876 g/cm3 for Phobos' regolith. (Andert, 2010).
The same procedure is applied for the two other ejection angles considered in this investigation, that is, 30 and 60 degrees; the results from the mass integration are summarized in Table 3. Also presented in the last row of Table 3 are the results for the integrated mass assuming a constant probability rather than a velocity-dependent function. A simpler model for this problem is to consider straight radial trajectories that depart a sphere and impact another sphere. For large velocities of ejection, such as the velocities in the tail of the total probability plot, the trajectories are still curved due to Mars' rotation, but these paths are fairly straight. Therefore, considering a constant probability is equivalent to the probability of impact associated with the tail of the total probability curve and offers an independent consistency check of the velocity-dependant probability.
7.4. Ejecta size distribution
The size of ejecta particles that impact Phobos is another parameter of interest when investigating collisions with Phobos. However, estimation of the size of a particle is possibly the most uncertain parameter of our study. Semianalytic approximations based on observations of secondary impacts on Mars and the Moon are available (Vickery, 1986, 1987) and relate the size distribution of the ejecta particles to the ejection velocity. Unfortunately, for the secondary craters to be observable, these models are based on the study of medium and large craters. It is known that the larger ejecta fragments, which result in the larger secondaries, are ejected at lower velocities. Consequently, these models are built from the observation of large particles at low ejection velocities, generally less than 1 km/s. In contrast to these properties, the ejecta particles in the investigation of impacts on Phobos are characterized with much higher velocities, from 4 to 5.3 km/s in this investigation, which thus requires a substantial extrapolation of the observed data. The relations developed for the size, d, of ejecta particle are of the form
where A and B are constant coefficients for a given crater determined from the best-fit computation with the observation data. However, the coefficients for the power laws are specific to a given crater, and the crater diameters in Vickery's studies varied over a large range. In this analysis, a more global approach is adopted that consists of defining a sequence of craters in terms of diameter. Thus, to examine the size distribution of ejecta particles that impact Phobos, the size-velocity relations as defined in Eq. 10 must include the diameter of the crater. Relationships of the form
are sought, where D is the diameter of the crater and A′, B′, and C are constant coefficients to be determined. By using a best-fit algorithm, the coefficients for the new relationships are computed to fit data obtained from the already introduced Vickery laws, as listed in Table 4.
Next, rather than coefficients specific to a given crater, general coefficients that are independent from any crater are required to be applied to the global approach. Thus, the median coefficients from the list of coefficients that have been computed are considered, that is, A=8.015×10⁵, B=1.92, and C=0.4845. By substituting these median coefficients into the new relationships, new results are produced with the use of unique coefficients for all craters. These results are generated for low ejection velocities whereas ejecta particles that possess an energy level sufficient to impact on Phobos correspond to much higher ejection velocities. Similar curves are produced for velocities ranging from 3.8 to 5.3 km/s, accordingly to the ejection velocities considered in this analysis. From these results, the size of the ejecta particles ranges from 15 to less than 45 m for 3.8 km/s down to particles of diameter 10–20 m for an ejection velocity of 5.3 km/s, as illustrated in Fig. 16.

Ejecta size distribution as a function of the ejection velocity employing new relationships extrapolated for high ejection velocities. Color images available online at
Note that the Vickery laws originally represented the upper bound of the observed size distribution of particles; thus these estimates are the maximum size expected for the ejecta particles. A more relevant parameter is the mean size of ejecta particles that are expected for a given ejection velocity. In the current understanding of ejecta size distribution from observation of lunar boulders (Bart and Melosh, 2010), the cumulative count of particles as a function of particle size follows an inverse power law with an exponent, γ, varying around a value of 4. Defining a cutoff for the power law, which corresponds to a lower bound for the particle size distribution, d min=1×10⁻⁶ m, such a law can be exploited to generate a random sample of particles. However, because of the very steep character of the law, γ≈4, the mean particle size as computed from a random sample consistent with this power law is approximately equal to the minimum particle size. That is, the distribution is numerically dominated by the smallest particles. Moreover, with a power law as steep as that observed by Bart and Melosh (2010), the mass is also dominated by the smallest particles, so that most of the ejected material is fine dust, not large fragments. The minimum size for this distribution was selected rather arbitrarily as 1 micron; thus it is very difficult to produce a meaningful prediction of the particle size. At most, it is likely that most of the ejecta mass is in the finest particle fraction.
8. Extension of the Analysis to Deimos
8.1. Numerical analysis
For the moon Deimos, a procedure similar to the analysis of impacts on Phobos was employed to investigate the probability of ejecta material from Mars' surface reaching Deimos. The range of possible events was reduced due to the smaller size and more distant location of Deimos compared with Phobos. Similar to the investigation involving Phobos, simulations were performed to replace the target with a sphere of 50 times the mean radius of Deimos and locate it on a circular orbit with a radius equal to the semimajor axis of Deimos. The main information is the order of magnitude of the probability value, which is significantly lower than the already small values associated with Phobos.
8.2. Analytical method
A similar analysis to that detailed for Phobos was developed for the probability of collision of ejecta from Mars with Deimos. Öpik's model was again employed to calculate the probability of impact for the elliptical trajectories, and a more simplified analysis was used to incorporate the probability of impact associated with hyperbolic trajectories. The probability of impact is zero for initial ejection velocity values less than 4.6 km/s, which was expected since these trajectories possess smaller semimajor axis and will not reach the orbit of Deimos. Similar to the Phobos analysis, the probability of impact with Deimos decreases for V eje>4.8 km/s, reaching a steady value of 1×10⁻⁸.
9. Conclusion
Despite the early demise of the Phobos-Grunt spacecraft in Earth orbit, other space agencies have expressed interest in pursuing mission scenarios to Phobos and Deimos. Within the context of planetary protection policy, knowledge acquired during such missions is critical for the classification of the martian moons Phobos and Deimos. Also, in the event of a mission that involves a sample return scenario, a better understanding of the exchange of mass between Mars and the moons will be essential with regard to interpretation of any discoveries from the analysis of a soil sample. The present study has demonstrated that, on average, it can be expected that approximately 0.2 mg of martian surface material, launched within the last 10 million years, will be mixed into a 100 g sample returned from the surface of Phobos. The evidence is that the moons are as old as Mars, but their origin is still controversial (Burns, 1992). Nevertheless, there is no known way to form the moons substantially later than Mars itself. If the cratering rate has been constant for the past 3.5 billion years, since the end of the Late Heavy Bombardment, when the cratering rate is believed to have been much higher, then a total of 50 mg of martian surface material is likely to be included in the sample. If an ejecta particle is as small as 1 micron (10−6 m), then 0.2 mg corresponds to the order of 2.5×10¹⁰ individual particles. It thus seems very likely that a returned sample could contain material launched from the surface of Mars in the past 10 million years. A similar analysis performed for Deimos yielded generally similar results but with probable mass transfers reduced by a factor of nearly 100.
Several caveats, however, are in order. The principal one is that average probabilities, expressed in probable numbers of grams accumulated per year, yield a poor description of the actual cratering process. Also, the fate of ejecta particles is dependent on the instantaneous position of Phobos in its orbit. There is, thus, some likelihood that none of the large meteorite launch events that occurred within the past 10 million years emplaced ejecta on Phobos. Thus, assigning probabilities to some amount of material in a given sample is complicated by the stochastic nature of the impact process on Mars. In this analysis, we assume that the probability of ejected material colliding with Phobos is independent of the crater location on the martian surface, that is, an averaged probability. Also, the source of the material that may collide with Phobos is quantified by the observed crater size distribution on Mars noting that the overall mass ejected from the planet is dominated by the larger craters. For small craters, the number of occurrences per unit of martian surface area is sufficiently large to justify the average probability assumption; however, for larger craters with few to almost no predicted occurrences, the likelihood of an actual occurrence and the likelihood for the ejected material to collide with Phobos is very uncertain. In fact, a single large crater, for example, 60 km in diameter, favorably placed on Mars' surface, for example, near the equator, may eject and deposit on Phobos as much material as has been deposited by the entire last 10 million years of martian impacts, that is, up to approximately 0.2 mg in the 100 g sample for a single crater event. In addition, the most uncertain aspect of our predictions is the size distribution of the ejected fragments. This is an area in which there is very little fundamental knowledge, and it is unclear how to proceed to improve our understanding. We have also assumed that martian ejecta on Phobos is mixed by regolith gardening processes through a depth of about 1 m. This is a very crude estimate, but the mass fractions of Mars' surface material in a representative soil sample are a simple function of this assumption: If the mixing depth were only 10 cm in 10 million years, then the mass estimates reported here should be multiplied by a factor of 10. Areas of research to improve the reliability of our estimates include theoretical modeling of ejecta mass as a function of ejection velocity as well as estimates of the size distribution of such particles.
Footnotes
Acknowledgments
The authors are extremely grateful to Rune and Barbara Eliasen for their support of this research and funding for the Rune and Barbara Eliasen Visualization Laboratory at Purdue University. The authors also wish to thank the anonymous reviewers whose suggestions helped make this manuscript better. Also, this analysis was completed with the support of NASA under grant number NNX10AU88G (Supplement 2), in response to a request from NASA Planetary Protection Officer Catharine Conley.
Author Disclosure Statement
No competing financial interests exist.