
Abstract
Scytonemin is a cyanobacterial sheath pigment with potent UV (UVA, UVB, and UVC) absorbing properties. Di- and tetramethoxy derivatives of scytonemin have also been found and described in the literature. The importance of these biomolecules is their photoprotective function, which is one of the major survival strategies adopted by extremophiles in environmentally stressed conditions. Also, iron compounds [particularly iron(III) oxides] offer an additional UV-protecting facility to subsurface endolithic biological colonization; hence, banded iron formations (accompanied by zones of depletion of iron) in rock matrices have attracted attention with special interest in the method of transportation of iron compounds through the rock.
Di- and tetramethoxyscytonemin and their iron(III) complexes have been modeled and studied computationally by using density functional theory calculations at the level of B3LYP/6-31G** methodology. We propose new structures that could feature in survival strategy and facilitate the movement of iron through the rock especially for iron-rich stressed terrestrial environments exemplified by the Río Tinto system with the added potential of subsurface Mars exploration. This study represents a continuation of our previous work on scytonemin. The calculated Raman spectra of the proposed iron complexes are compared with those of their parent compounds and discussed in relation to structural changes effected in the parent ligand upon complexation. This information leads to new insights to be gained by experimental Raman spectroscopists and the characterization of spectroscopic biosignatures for the database being compiled for the remote Raman analytical interrogation of the martian surface and subsurface being proposed for the ESA ExoMars mission planned for launch in 2018. Key Words: Raman spectroscopy—Spectral biosignatures—Scytonemin—Methoxyscytonemin—Iron complexation—Terrestrial Mars analog sites. Astrobiology 13, 861–869.
1. Introduction
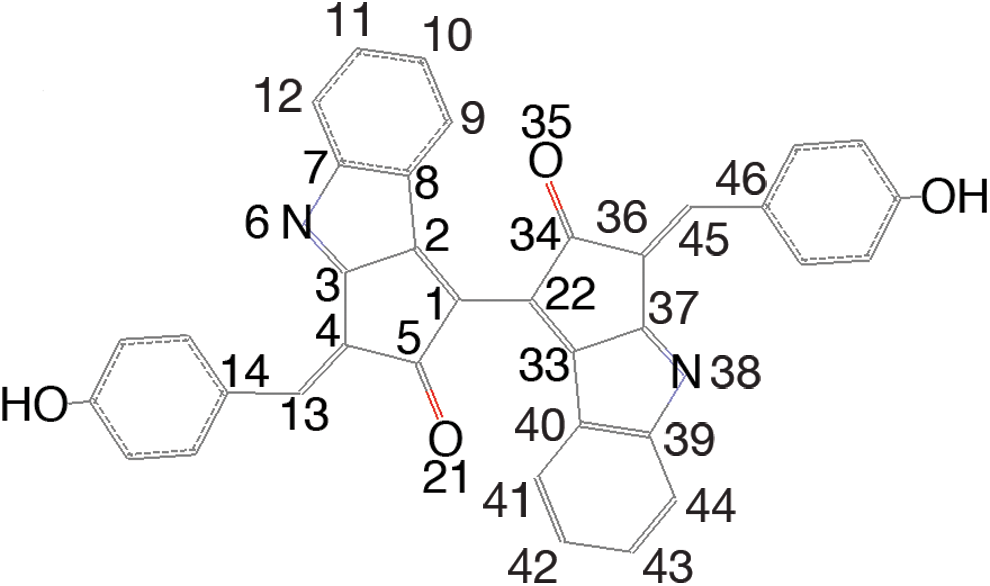
Scytonemin structure with numbering used in the text and tables. Color images available online at

The optimized conformation for (
The present study considers the complexes that could be favorably formed energetically between the known methoxy derivatives of scytonemin and iron(III), which is present in several important iron-rich extreme terrestrial environments and for which there is already evidence of some form of complexation resulting in the movement of iron through the geological matrix, such as that exemplified by the endolithic colonization of Beacon sandstone in the McMurdo Dry Valleys in Antarctica that results in the formation of iron-rich and iron-depleted stratigraphic zones (Fig. 3) (Wynn-Williams and Edwards, 2002). The next stage will be a Raman spectroscopic experimental interrogation of Mars analog sites such as the Salar Grande in the Atacama Desert and Río Tinto, Huelva, Spain, which will use the wavenumber predictions of this paper to search for evidence of this complexation from which it may be necessary to revise the existing database being constructed for future planetary exploration.
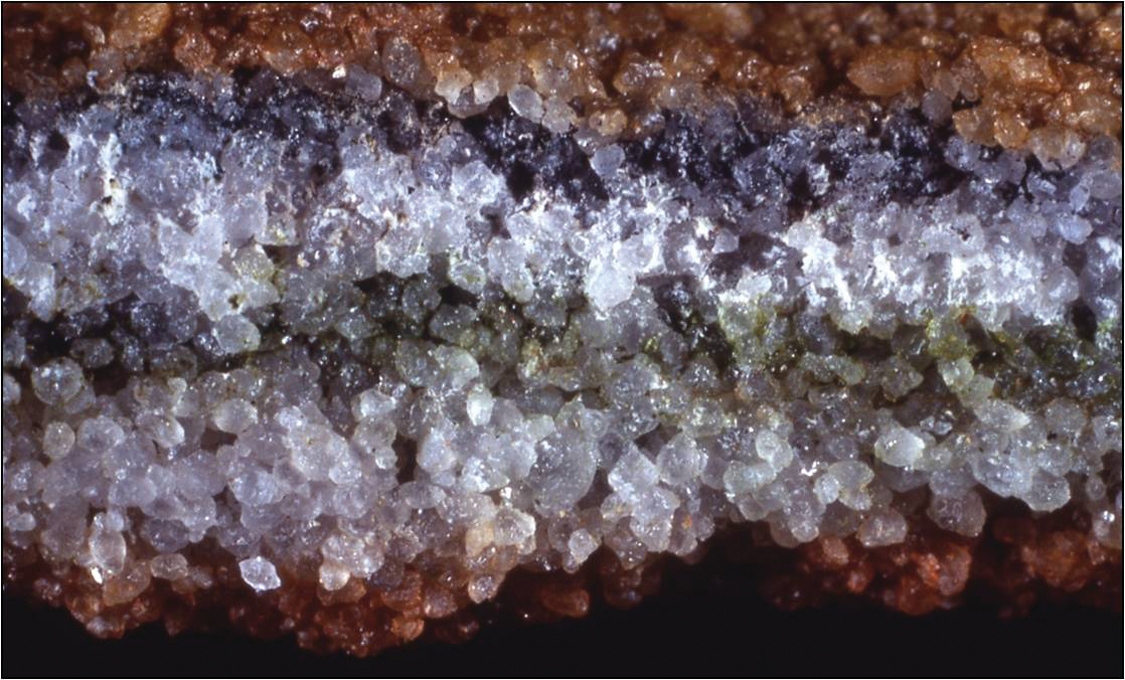
A biogeologically colonized specimen of Beacon sandstone from Antarctica showing zones of iron enrichment and depletion caused by the chemical movement of iron(III) through the rock substrate, possibly resulting from iron-scytonemin complexation. Color images available online at
These methoxy derivatives and iron(III) complexes of di- and tetramethoxy derivatives of scytonemin are the subject of this work, which is a continuation of our studies on scytonemin (Varnali et al., 2009; Varnali and Edwards, 2010a, 2010b, 2013).
2. Computations
Density functional theory (DFT) is an attractive quantum chemical method for obtaining molecular properties of metal-ligand complexes, particularly for large structures and multiply ligated complexes. B3LYP calculations have been found useful for ionic transition metal–benzene complexes in the literature (Klippenstein and Yang, 2000). Zvereva et al. demonstrated that hybrid DFT methods (B3LYP being the most cost-effective choice) offer excellent quantitative performance in the prediction of relative IR intensities and relative Raman activities for the bands of vibrations (<2300 cm−1) of not only small but also medium-sized molecules (Zvereva et al., 2011).
We have already carried out DFT calculations for scytonemin and the iron-scytonemin complexes (Varnali and Edwards, 2010a, 2013), making use of B3LYP functional with 6-31G** basis set, in our previous studies after first exploring whether the methodology proposed gives the correct ground states for iron (Kaczorowska and Harvey, 2002) and comparing with experimentally available data. The calculated ionization energies for the Fe atom are compared to experimental values in Table 1 (Sugar and Corliss, 1985) and are in satisfactory accordance. At this level, the calculated atomic excitation energy from 3d64s1 (6D) to 3d7 (4F) configuration is 0.67 eV; however, this has also been reported to be 0.25 eV (Holthausen et al., 1995).
Having set a satisfactory methodology in our previous studies (Varnali and Edwards, 2010a, 2013), we modeled iron-coordinated structures and carried out computations for di- and tetramethoxyscytonemin and their iron(III) complexes.
Coordination to iron(III) (multiplicity 2 and 6) by one carbonyl group or a carbonyl group and a methoxy oxygen of dimethoxyscytonemin showed preference for multiplicity 6, but both complexes were of higher energy compared to the complex involving an aromatic ring, with the same multiplicity (relative energies 29.45 and 36.40 kcal/mol, respectively).
The modeling of complexes involving an aromatic ring was created by first rotating the C–C bond between the carbons bearing the methoxy groups in such a manner that the phenol group is located over the scytonemin backbone facing the carbonyl group of the other half of the molecule and then placing an iron in the space created in between (Fig. 4a). Tetramethoxyscytonemin has a second rotatable bond that allows the rotation of the second phenol group over the backbone facing the carbonyl of the other half of the molecule, and this has enabled the formation and modeling of a complex with two iron atoms (Fig. 4b). The calculations for these complexes that involve aromatic rings show preference for multiplicity 6 over 2, and they indicate that complexes with multiplicity 4 are of lowest energy. Relative energies of complexes with multiplicity 6 and 2 are 2.03 and 7.96 kcal/mol for the iron complexes of dimethoxyscytonemin and 1.04 and 8.59 kcal/mol for the iron complexes of tetramethoxyscytonemin, respectively.
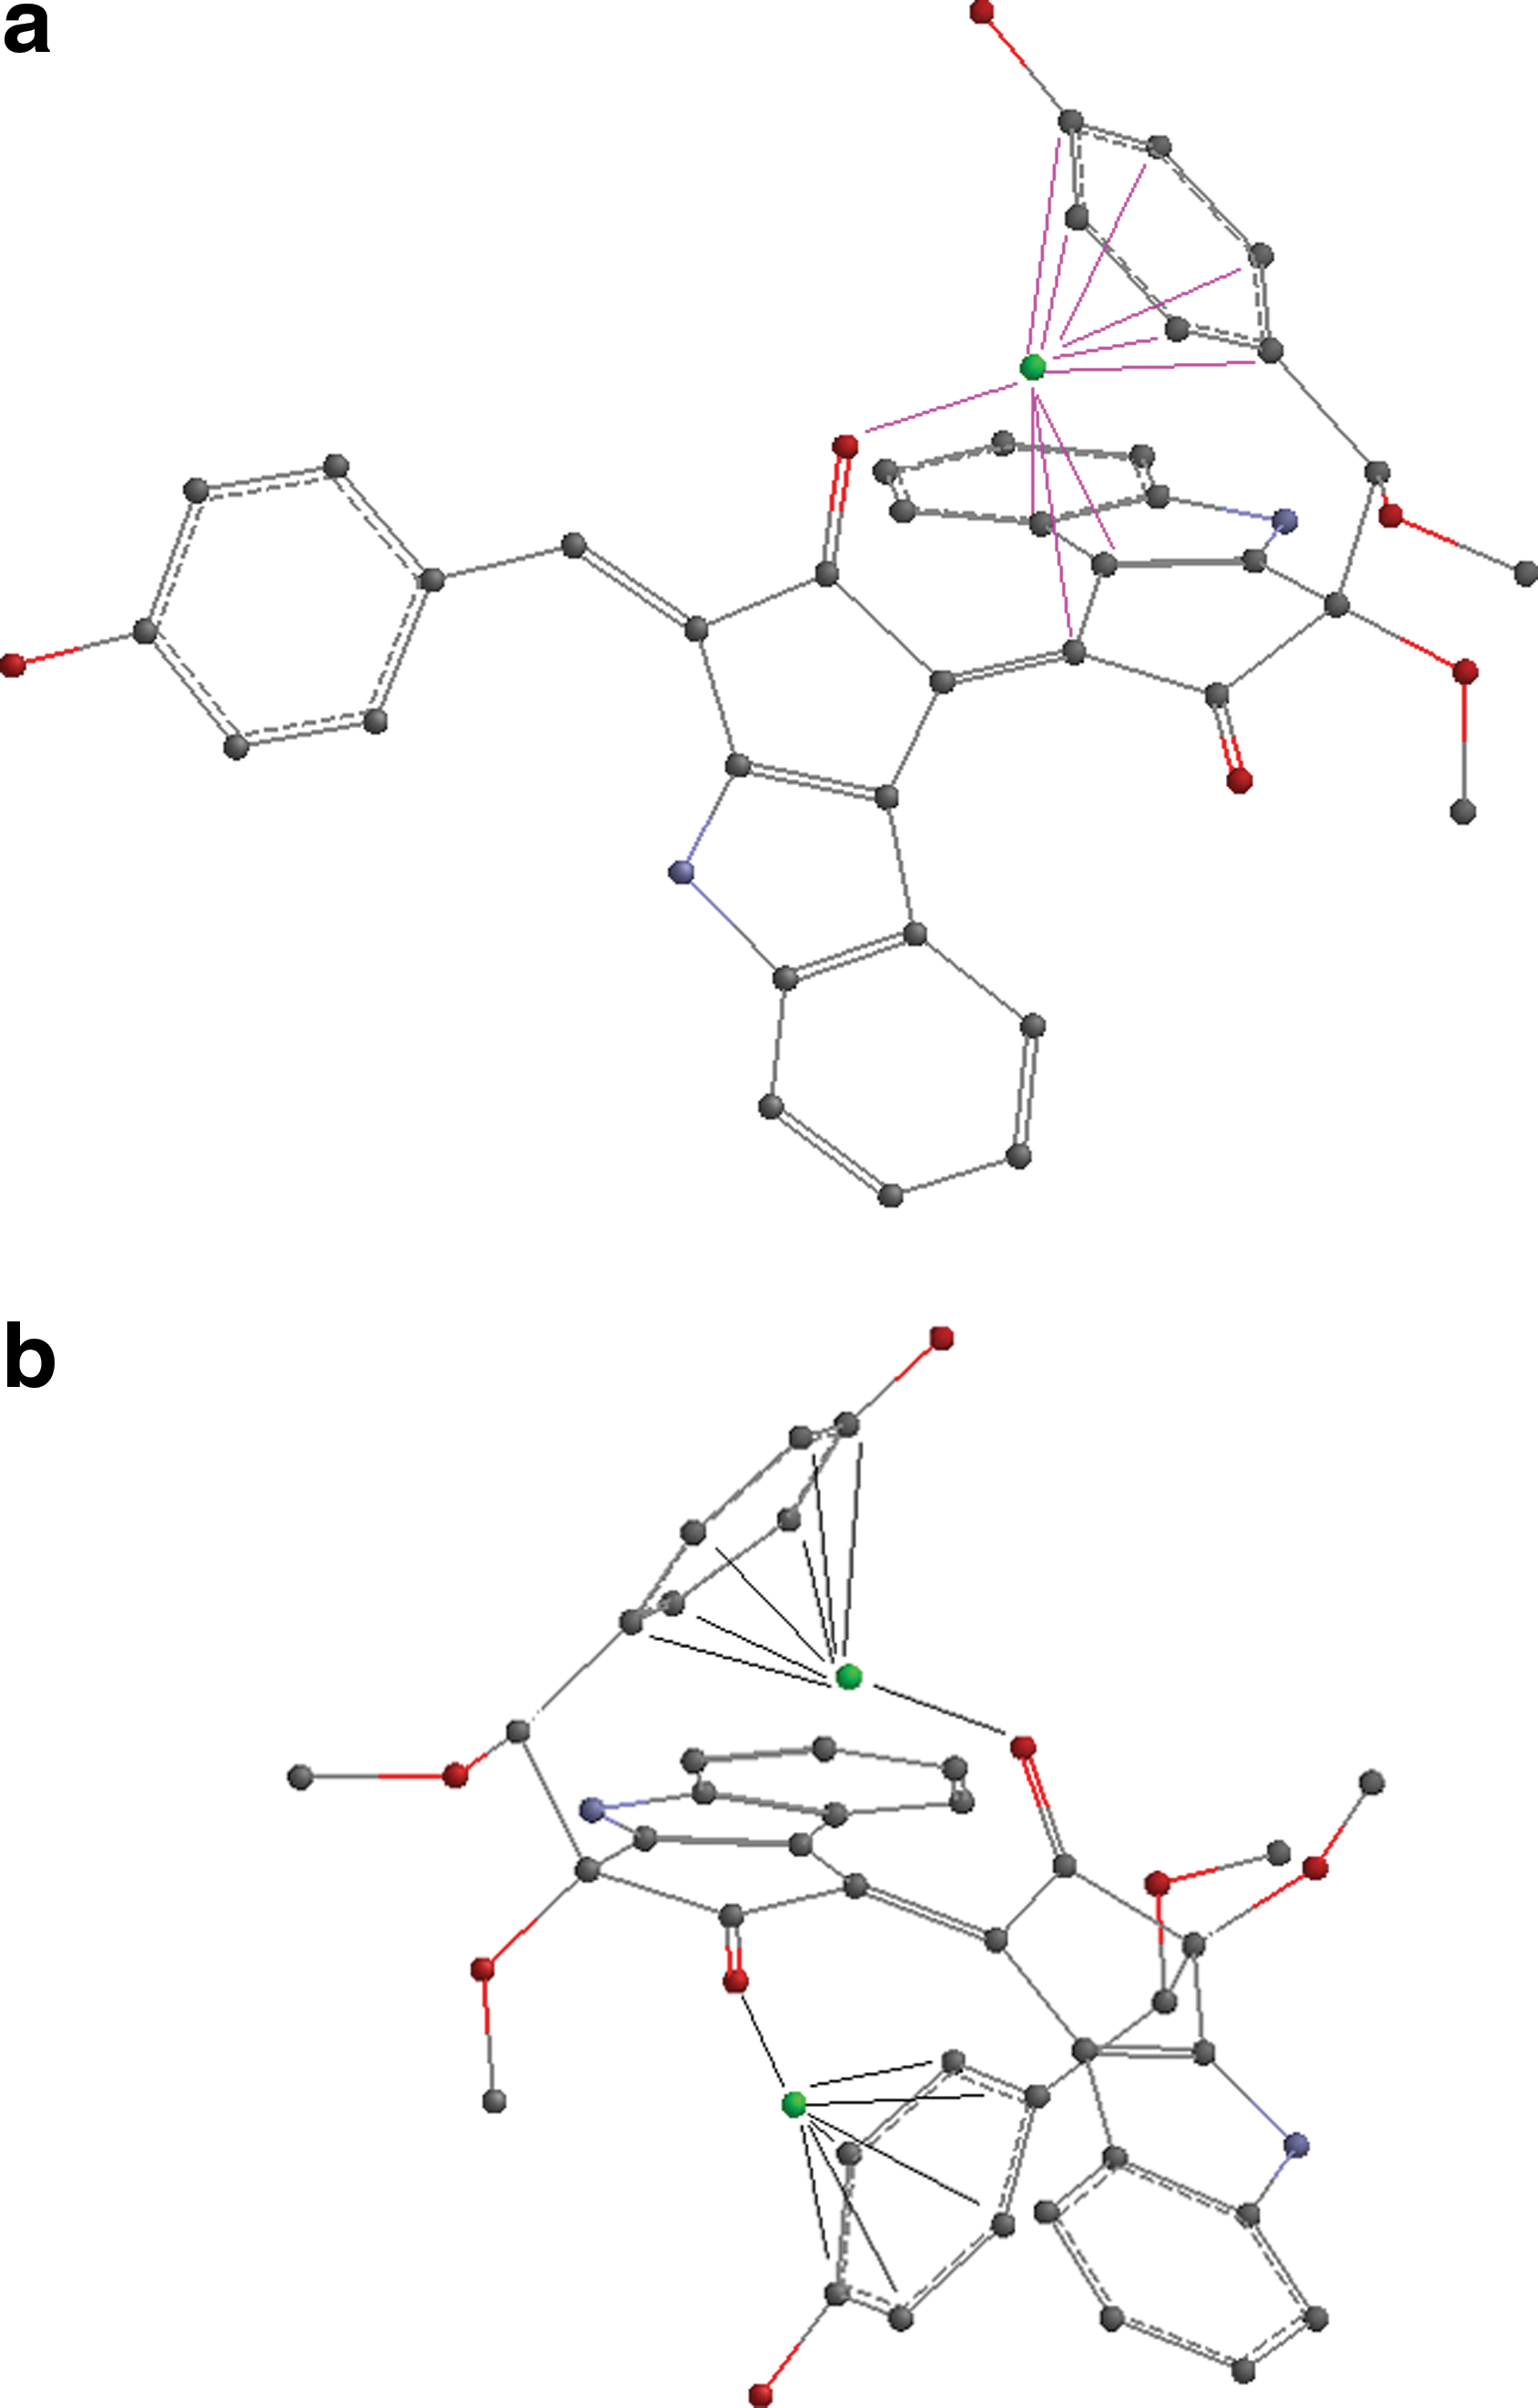
Display of the structures with bonds drawn on them to show where/how the iron was placed to model the (
The geometry optimizations for each structure, the frequency calculations for verification of minima, and obtaining the Raman bands have all been done at B3LYP/6-31G** level of sophistication with the program package Gaussian 09 (Frisch et al., 2010). Frequencies were multiplied by 0.9613, a constant for scaling purposes (Foresman and Frisch, 1996). The optimized structures for the iron complexes of both methoxy derivatives are presented in Fig. 5, and their spin distributions are shown in Fig. 6.
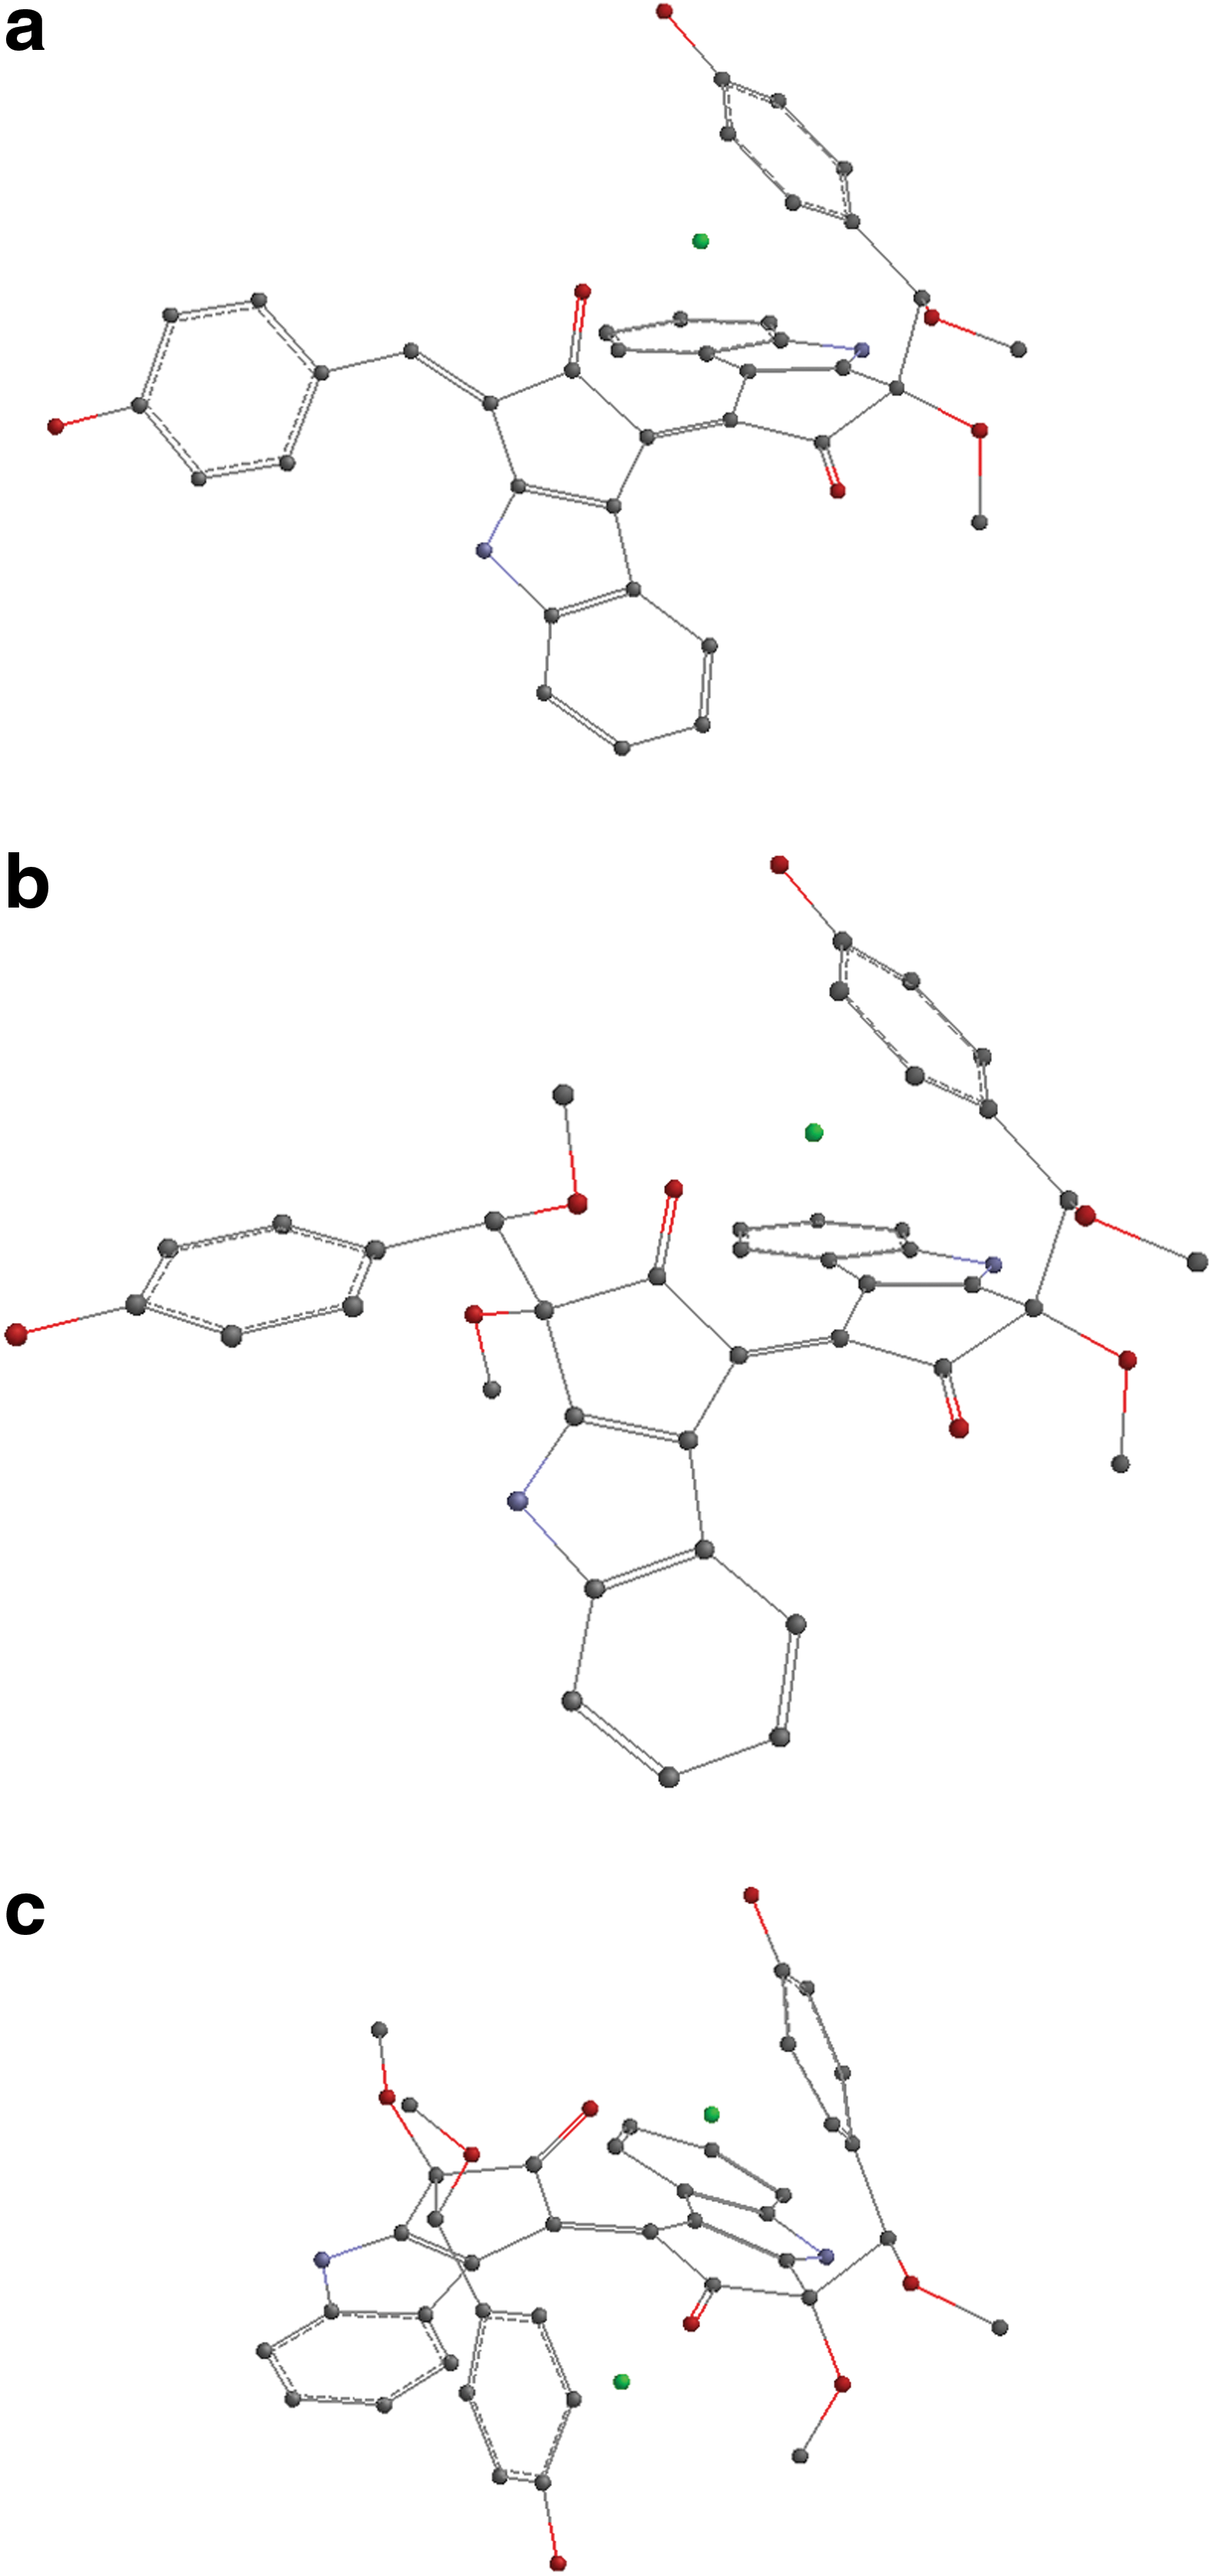
Optimized structures for (
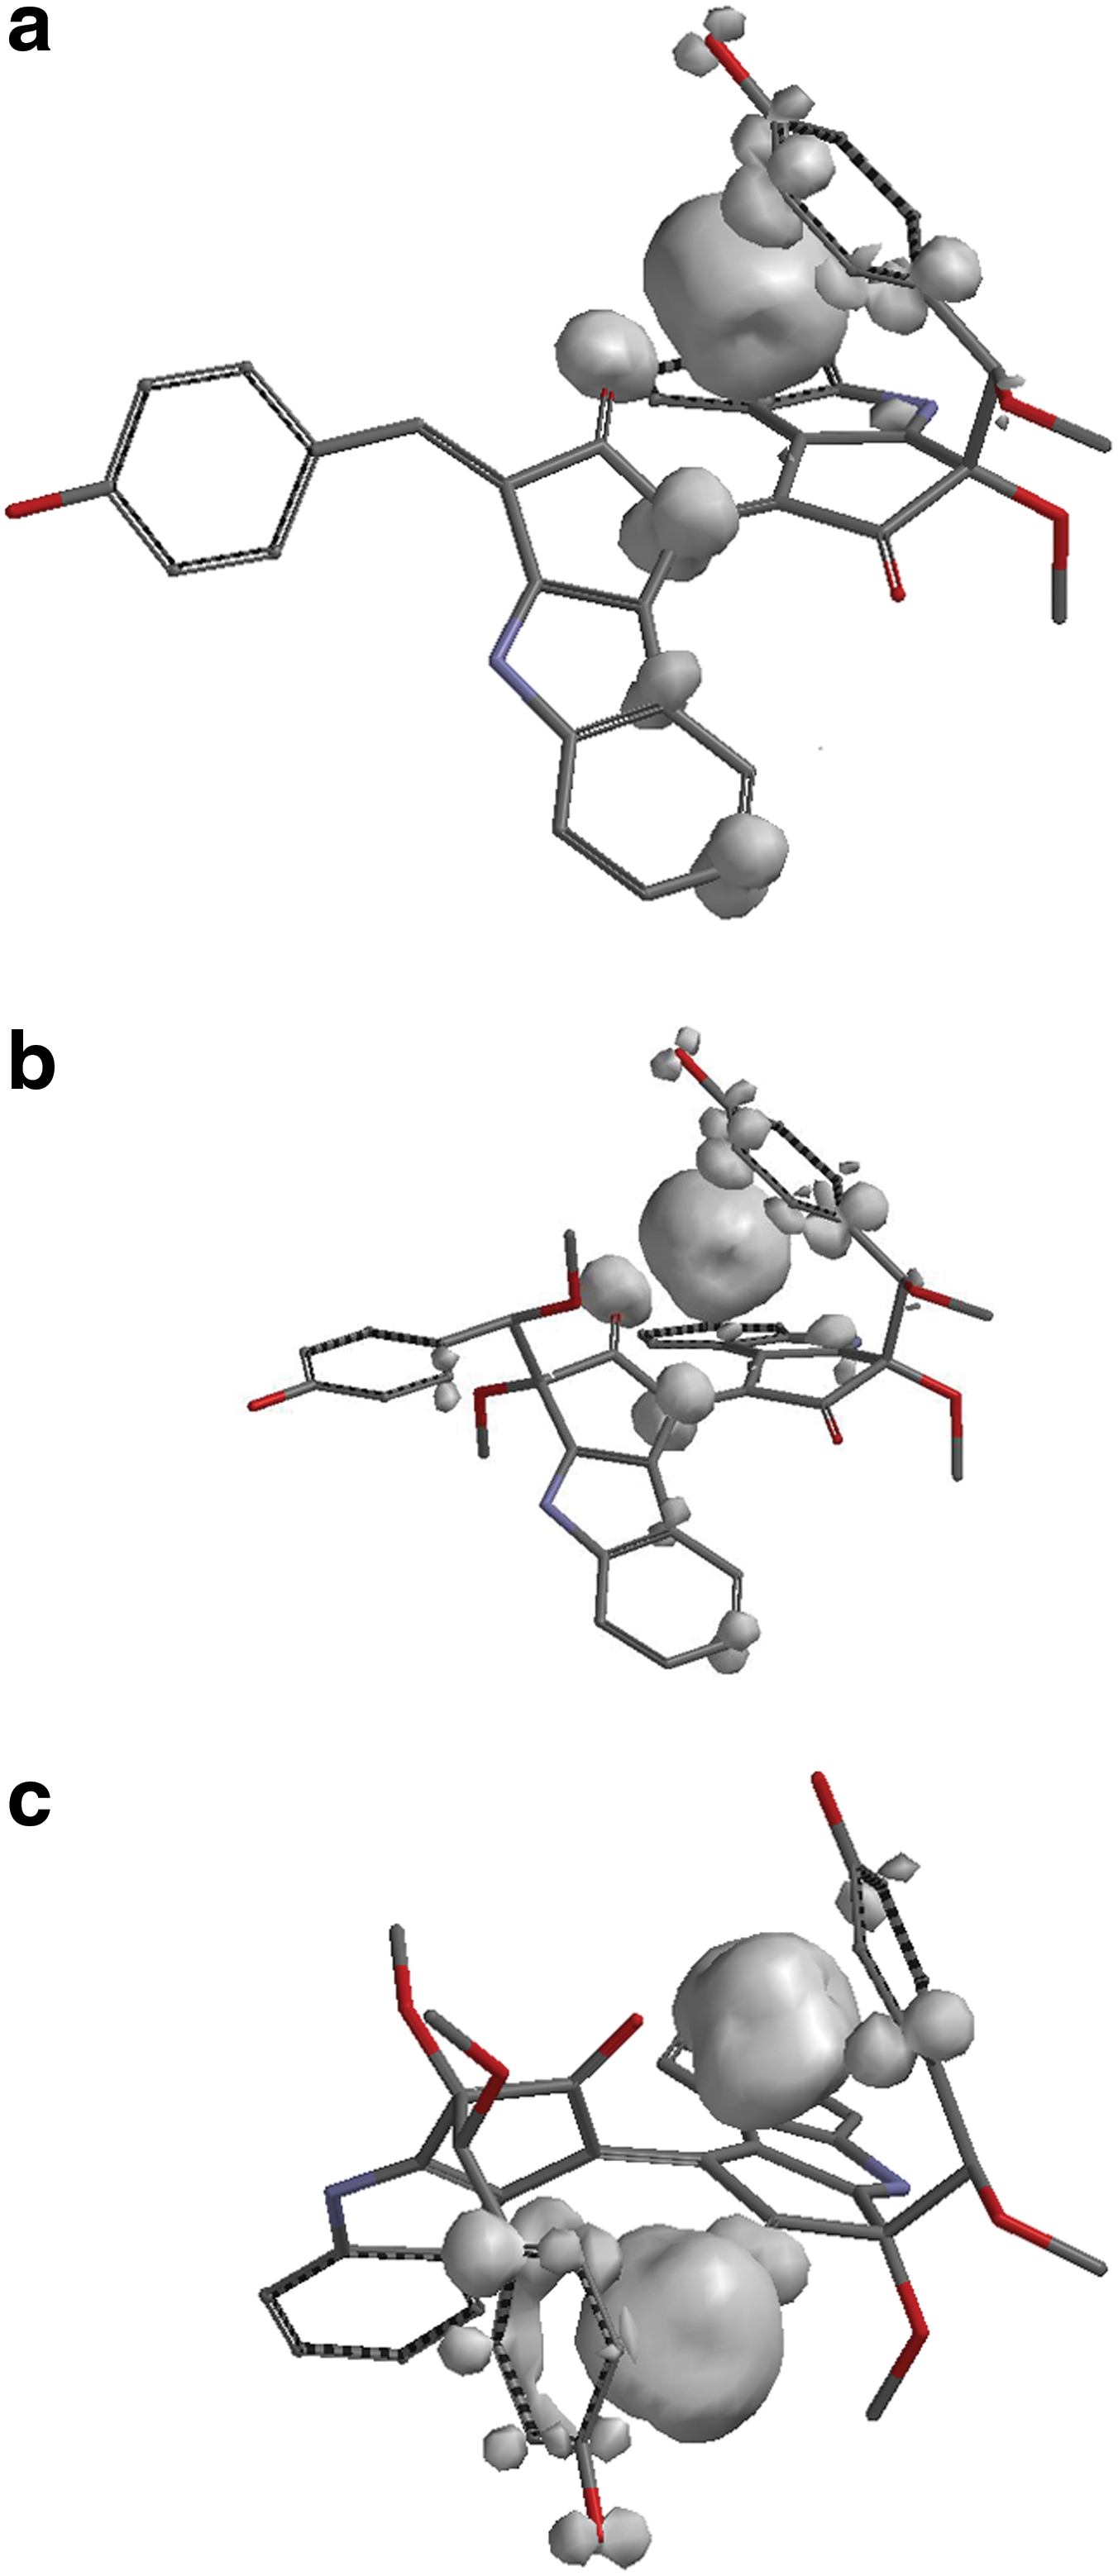
Spin distributions for (
3. Results
The geometrical parameters of the optimized structures for di- and tetramethoxyscytonemin derivatives and the structures proposed for their iron complexes are presented in Table 2. The dihedral angles showing the geometry of the phenol group over the scytonemin backbone are shown in Fig. 7a and are almost the same for both di- and tetramethoxyscytonemin derivatives. Similarly, the dihedral angle C5–C1–C22–C34, around the central C1–C22 bond linking the two halves of the molecule is 143° and 146°, respectively. The two-iron complex structure has different dihedral angles around C4–C13 and C36–C45, the carbons bearing the methoxy groups, as shown in Fig. 7b, and significantly different appearance as shown in Fig. 5b with the dihedral angle C5–C1–C22–C34 being 76°.
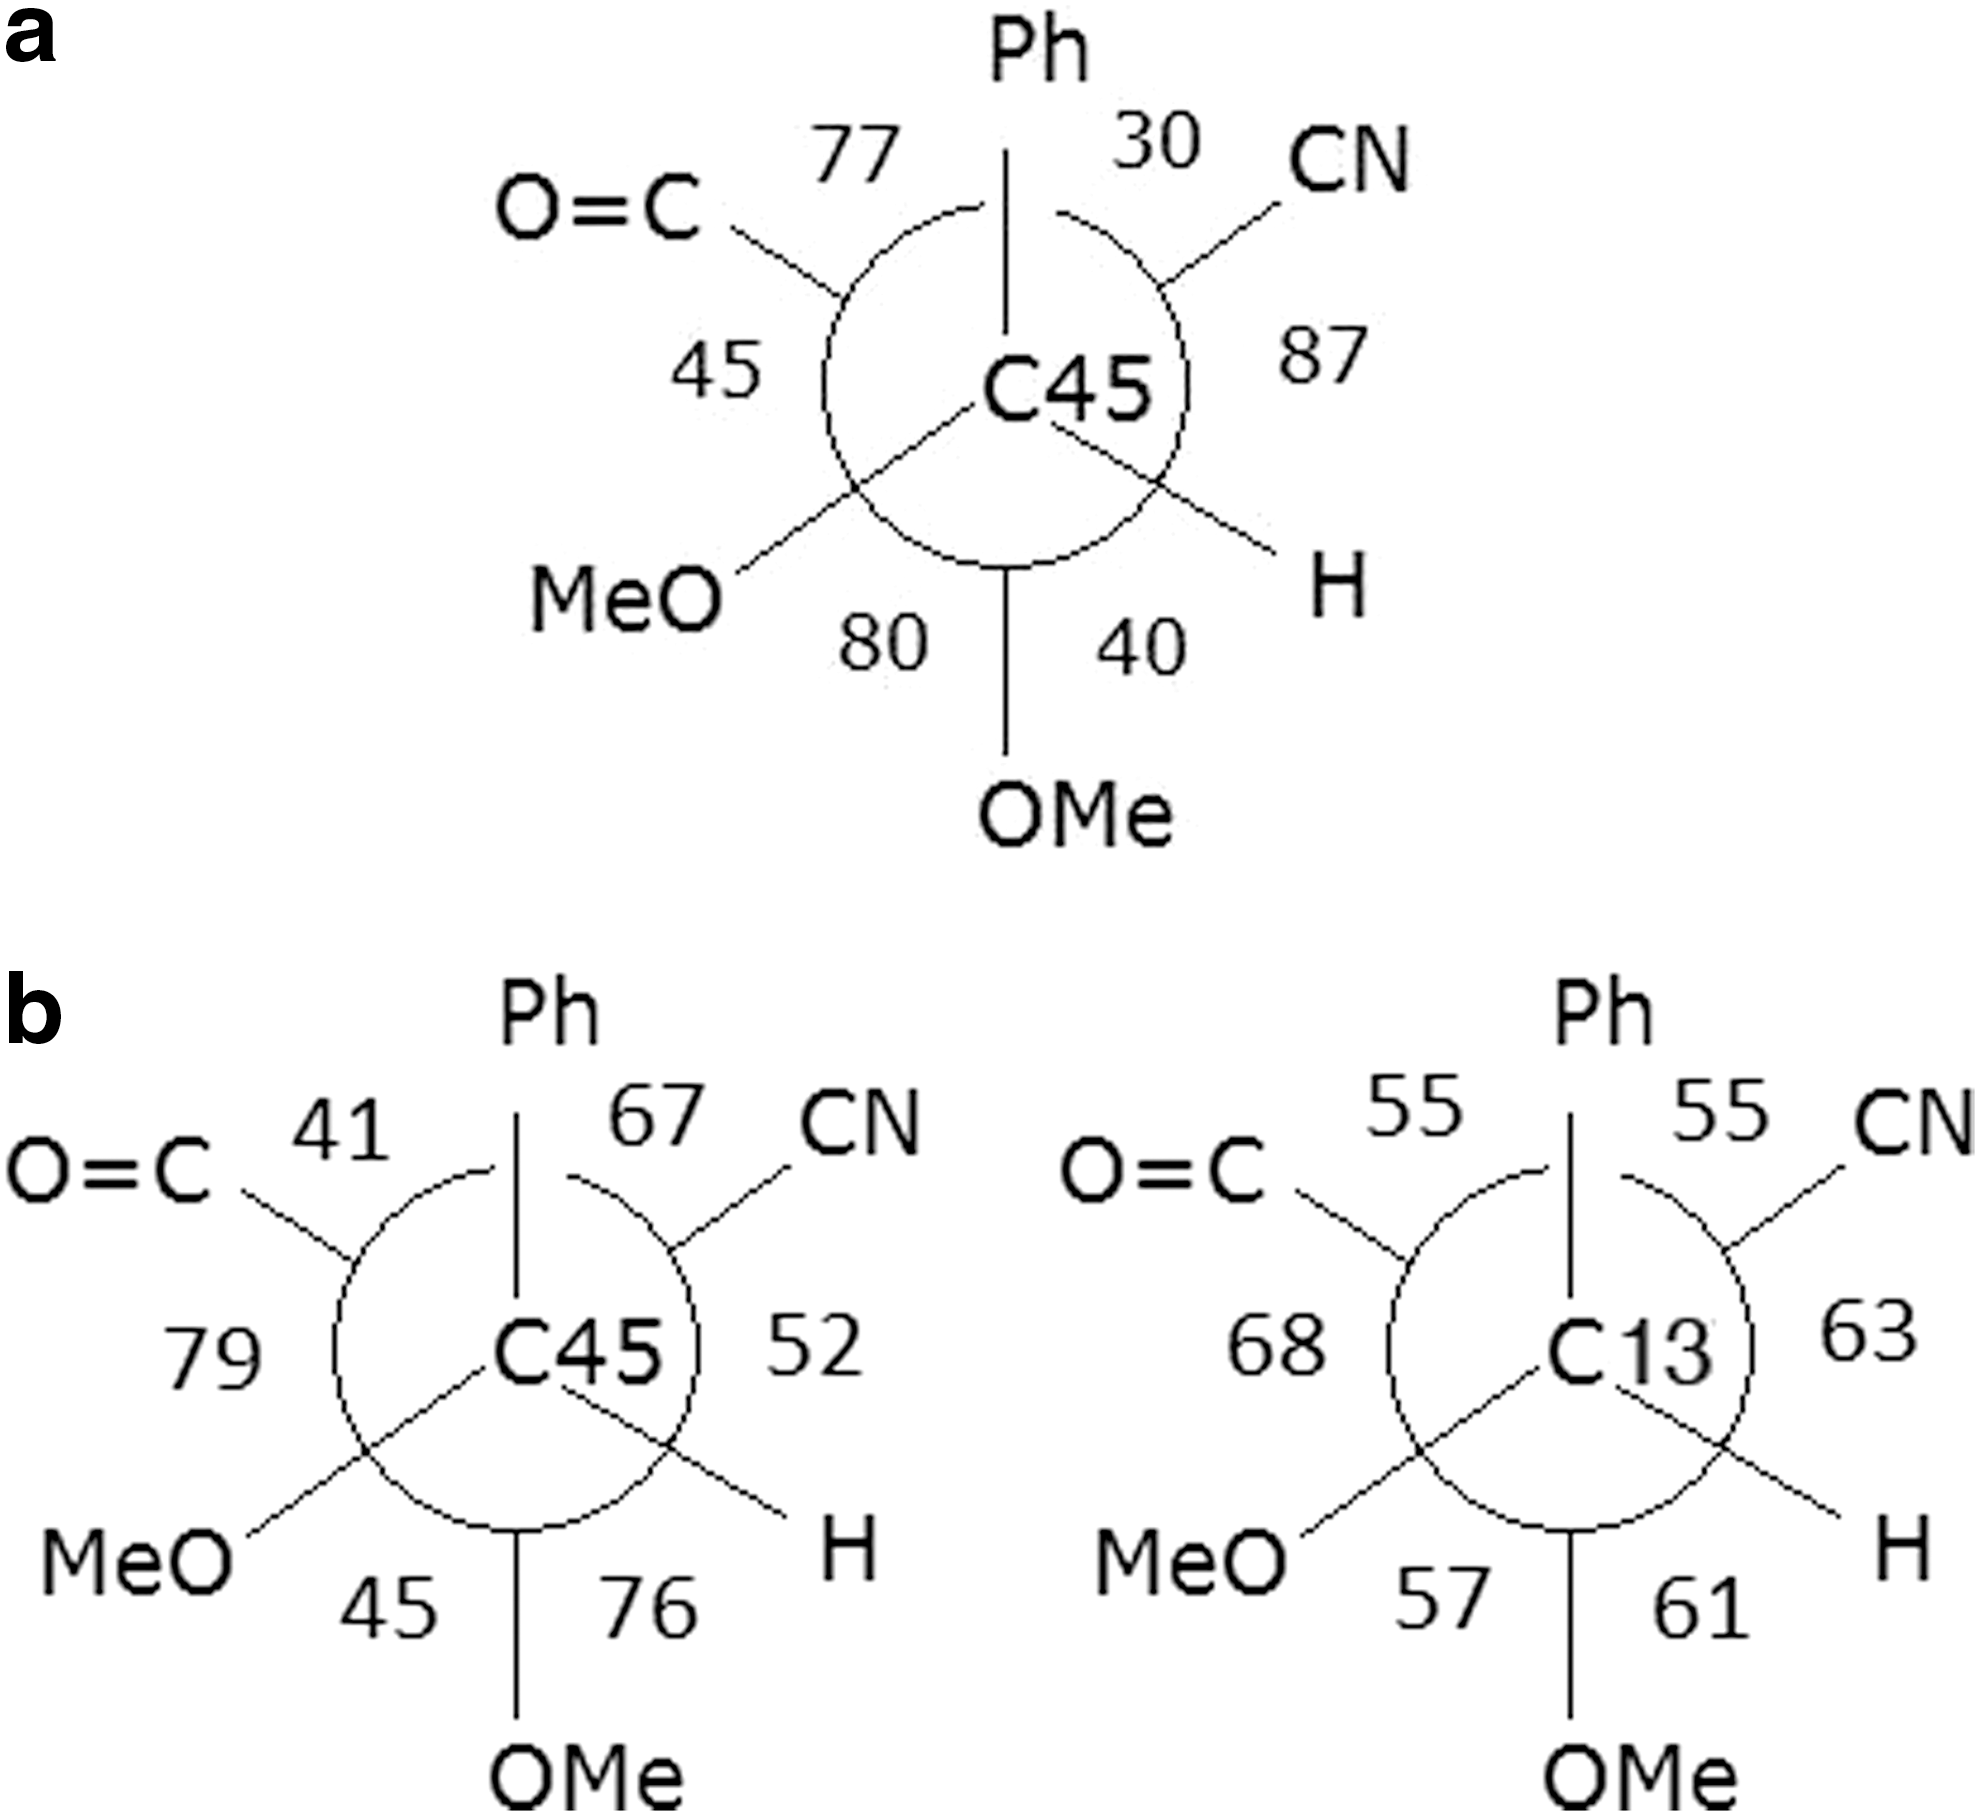
Newman Projections to explain the dihedral (torsion angles) angles (°) around C36–C45 (
The frequency calculations for the optimized structures were all positive (no imaginary frequencies were predicted), ensuring that the geometries obtained belong to structures of minimum energy. Then, the geometrical parameters (Table 2) were analyzed to discern the changes that took place upon complexation, and the Raman data were evaluated for each structure along with the proposed assignments. Comparisons were made with the analogous modes for the parent molecules (Tables 3 –6), and it was then possible to derive the substantive wavenumbers that could be designated as significant differences for the experimental spectral diagnosis of these complexed species.
Predicted geometrical parameters
Structural changes that occur in the methoxyscytonemin derivatives and their complexes can be summarized as follows: the phenol group complexing the iron expands; the Cphenyl–OH bond shortens; the carbonyl group involved in the complexation lengthens, while the other C=O bond shortens; the bonds C1–C2, C1–C5, C4–C5, C2–C8, and C7–C12 shorten; the bonds C1=C22, C2–C3, C33–C37, C7–N, C39–N, C4–C13, and C36–C45 lengthen significantly. The C4–C13 and the C36–C45 lengths, which are 1.355 and 1.554 Å, respectively, for dimethoxyscytonemin become 1.407 and 1.621 Å for its iron complex, and those bonds which are 1.553 Å for tetramethoxyscytonemin become 1.575 and 1.621 Å for its iron complex. For the tetramethoxyscytonemin complex with two irons, these bonds are even longer, 1.650 and 1.653 Å, respectively.
The Fe–Cphenol distances are found to lie between 2.4 and 2.5 Å. The Fe distance to the oxygen of the carbonyl is 1.943 Å for the dimethoxyscytonemin complex and 1.992 Å for the tetramethoxyscytonemin complex. The distance of Fe to the closest three carbons (C22, C33, C40) on the backbone is 2.2–2.7 Å. It is worth noting that the complex with two iron atoms is not symmetrical, as can be seen from the geometrical parameters listed in Table 2. The Fe distance to the oxygen of the carbonyl is 1.925 Å on one side and 1.932 Å on the other side with an iron-to-iron distance of 4.650 Å.
Predicted Raman data
Both methoxy derivatives have similar bands and relative intensities except for the vinylic C–H stretch at 3031 cm−1, the C=C stretch at 1626 cm−1, and the aromatic ring C–C mode at 1598 cm−1 for dimethoxyscytonemin, all of which are absent for tetramethoxyscytonemin. These three bands can therefore be adopted as definitive diagnostic bands to differentiate between the two types of derivative.
Comparison of the Raman data for the methoxy derivatives and their complexes shows similar trends, as follows:
(1) the bands for O–H, N–H, C–H (CH2 type geminal to the methoxy group) stretching, and the aromatic ring C–C modes are all at lower wavenumbers for the iron complexes; the complex with two irons has a second C–H (CH2 type geminal to the methoxy group) stretching at higher wavenumber and also more active.
(2) the aromatic C–H, methyl C–H, and carbonyl stretching (the carbonyl that is not involved in complexation) bands are all at higher wavenumbers for the single iron atom complex, whereas the complex with two iron atoms has methyl C–H stretching bands with lower wavenumber and higher predicted intensities (the major bands). In contrast, however, the complex with two iron atoms has no carbonyl stretching band at all.
(3) new bands between 1400 and 1300 cm−1 appear for the complexes.
4. Discussion
Detailed comparison of the data for the methoxy derivatives and their complexes reveals that the single OH and NH bands each become two bands for the complex. The two carbonyl bands present in the methoxy derivatives (1710, 1729 cm−1 for dimethoxy and 1721, 1733 cm−1 for tetramethoxy) now appear at higher wavenumbers as only one band in the complexes (1761 cm−1 dimethoxy, 1751 cm−1 tetramethoxy), because one of the carbonyls is involved in the complexing to the iron. The two-iron complex in which both carbonyl groups are involved in complexation has no carbonyl band.
The 1603 cm−1 band becomes a band at 1584 cm−1 for the one-iron complexes and at 1593, 1572, 1567 cm−1 for the two-iron complex. The 1547 cm−1 band of dimethoxyscytonemin (1550 cm−1 for tetramethoxyscytonemin) becomes two bands at 1538 and 1527 cm−1 (1552 and 1525 cm−1 for tetramethoxyscytonemin) for the one-iron complexes, and at 1552, 1540 cm−1 for the two-iron complex. The 1474 cm−1 band becomes 1469 cm−1 for the dimethoxy, 1467 cm−1 for the tetramethoxyscytonemin one-iron complexes, and 1478 cm−1 for the two-iron complex.
Although the computational analysis reveals some key vibrational features that could be verified by experimental Raman spectroscopy, it is not possible to ascribe individual idealized group motions to the complex vibrations that occur below 1400 cm−1 due to extensive coupling of modes. The 1338 and 1348 cm−1 weak bands of dimethoxyscytonemin become stronger, and 1387, 1377, 1364, 1357, 1335, and 1321 cm−1 bands appear for its complex. The 1336 cm−1 band of tetramethoxyscytonemin becomes stronger and appears at 1335 cm−1, along with new bands at 1383, 1362, 1357, 1320, 1312 cm−1. In this region, 1327 cm−1 is the only active band for the complex containing two iron atoms.
5. Conclusion
The complexation of iron with each of the methoxy derivatives of scytonemin discussed here has created a new structure that should be identifiable experimentally in the Raman spectra of specimens of biological colonies that produce scytonemin in iron-rich stressed environments. The current experimental situation is that scytonemin has been observed as a result of protective survival strategies adopted by cyanobacterial colonization of geological niches in stressed environments. Recent spectroscopic work on carotenoids (Oliveira et al., 2010) has indicated that some caution needs to be taken in the assignment and interpretation of carotenoid Raman spectra in natural specimens; a major factor in this spectral misassignment can occur where complexes have been formed between proteins and the carotenoids, which can significantly alter the spectral appearance and the wavenumber values of even well-established modes of vibration, such as the C=C and C–C vibrations of the conjugated polyene chain. These same wavenumbers are proposed as definitive biomarkers in astrobiological search-for-life mission scenarios, so it is critically important that the wavenumber shifts and spectral intensity changes resulting from complexation are understood and evaluated. Other factors that play a role in carotenoid spectral interpretation in addition to chain conjugation length and complexation are the presence or absence of pendant methyl groups and matrix electronic effects in the geological mineral substrates. Although these problems are now appreciated and are being addressed in the case of carotenoids, no such situation exists currently for the equally important biomarker scytonemin.
The prime purpose of this study, therefore, has been to identify possible sources of error in Raman spectral interpretation caused by the presence of hitherto unsuspected chemical complexes of the type identified for the carotenoids and to highlight as well the predicted outcome of complexation between the parent methoxyscytonemins and the iron atoms in the geological matrices; an early observation of the Raman spectra (Wynn-Williams and Edwards, 2002) of characteristic zones of iron depletion adjacent to Chroococcidiopsis cyanobacterial colonies in Beacon sandstone in the appropriately named Mars Oasis in Antarctica generated much thought as to the mechanism by which the cyanobacteria moved the iron(III) ions through the geological substrata. The present study and its predecessors could provide a chemical means that involves favorably energetics by which the iron atoms are transported in the matrix with, as our above calculations have shown, the added advantage of providing even more effective radiation screening potential for the biological colonies against increased UV insolation, especially in Arctic and Antarctic communities.
Footnotes
Acknowledgment
This work is funded by Bogazici University Research Funds, Project Nos. 08B508 and 5183.
Author Disclosure Statement
No competing financial interests exist.
Abbreviation
DFT, density functional theory.