
Abstract
On future human Mars missions, surface sojourn duration and resources will be limited. One possibility to approach a positive cost-benefit ratio of a human Mars mission will be to maximize the scientific research on the martian surface within the operational, environmental, and experimental limitations. Sophisticated mission operations and advanced planning strategies will be a basic requirement for Mars exploration and make operational methods an important research subject during current Mars analog missions conducted by the Austrian Space Forum.
The Morocco Mars analog field simulation MARS2013, with a duration of 4 weeks and a simulated time delay of 10 min for communication between field and mission support, was the most advanced Mars analog mission conducted by the Austrian Space Forum so far. Due to these constraints, planning strategies based on real-time adjustments and ground control were not applicable, leading to the development of the “3-days-in-advance” planning strategy. Applying this methodology, 45.7% of the total EVA time was used for scientific experiments that satisfied 75.8% of the planned science goals. Taking into account all activities (donning of the suits included), the fraction of time used for scientific experiments made up only one-third of the total time, whereas it was planned to be above 50%. Here, we present details on the application of the 3-days-in-advance planning and on the results of the efficiency analysis of MARS2013. Key Words: 3-Days-in-advance planning—Planning strategy—Field activity plan—Science goals—Efficiency analysis. Astrobiology 14, 377–390.
1. Introduction
T
Here, we assess the performance of the planning strategy for MARS2013 in terms of its efficiency and its scientific value.
2. Overview of the Planning Strategy for MARS2013
To meet all science objectives as well as the organizational and operational goals of MARS2013, the Flight Plan team (FP) developed the 3-days-in-advance planning strategy. Rather than a real-time planning strategy for which immediate action and reaction would be required, the activity plan was prepared 3 days in advance. The main reasons for this new approach were the 10 min time delay, which renders real-time planning difficult, and the amount of different experiments conducted. An overview of the experiments can be found in the work of Groemer et al. (2014 in this issue). In addition, the previous Dachstein Mars simulation demonstrated that last-minute changes, that is, changes made within 24 h, should be kept to a minimum (Hettrich, 2012). Table 1 shows the benefits and drawbacks of a real-time and a 3-days-in-advance planning strategy.
The planning process can be divided into the pre-mission phase and the in-mission phase, which will be discussed in the following sections.
2.1. Pre-mission planning
During the first 3 months of the MARS2013 planning, every experiment involved was assigned a category, such as technological, psychological, geological, biological, or medical, and had certain requirements regarding resources, infrastructure, and time allocation, as stated by the principal investigator (PI). The PI information also allowed for the estimate of the Technology Readiness Level and the Documentation Readiness Level for better risk assessment and resource allocation of the experiments. The Technology Readiness Level categories were based on those used by NASA (Mankins, 1995); the modifications for use within the OeWF together with the definition of the Documentation Readiness Level can be found in the work of Sans Fuentes (2012). Relevant for planning were also limitations for the extravehicular activity (EVA) duration, such as battery lifetime or human factors, as well as limitations regarding the locations of experiments, namely, the spatial coverage of communication infrastructure.
This information enabled the iterative development of the Mission Plan (MP), a rough activity schedule, which provided an overview of the mission activities and the resource allocation for the full mission duration and served as a basis for in-mission planning. An excerpt of the MP can be found in Fig. 1.
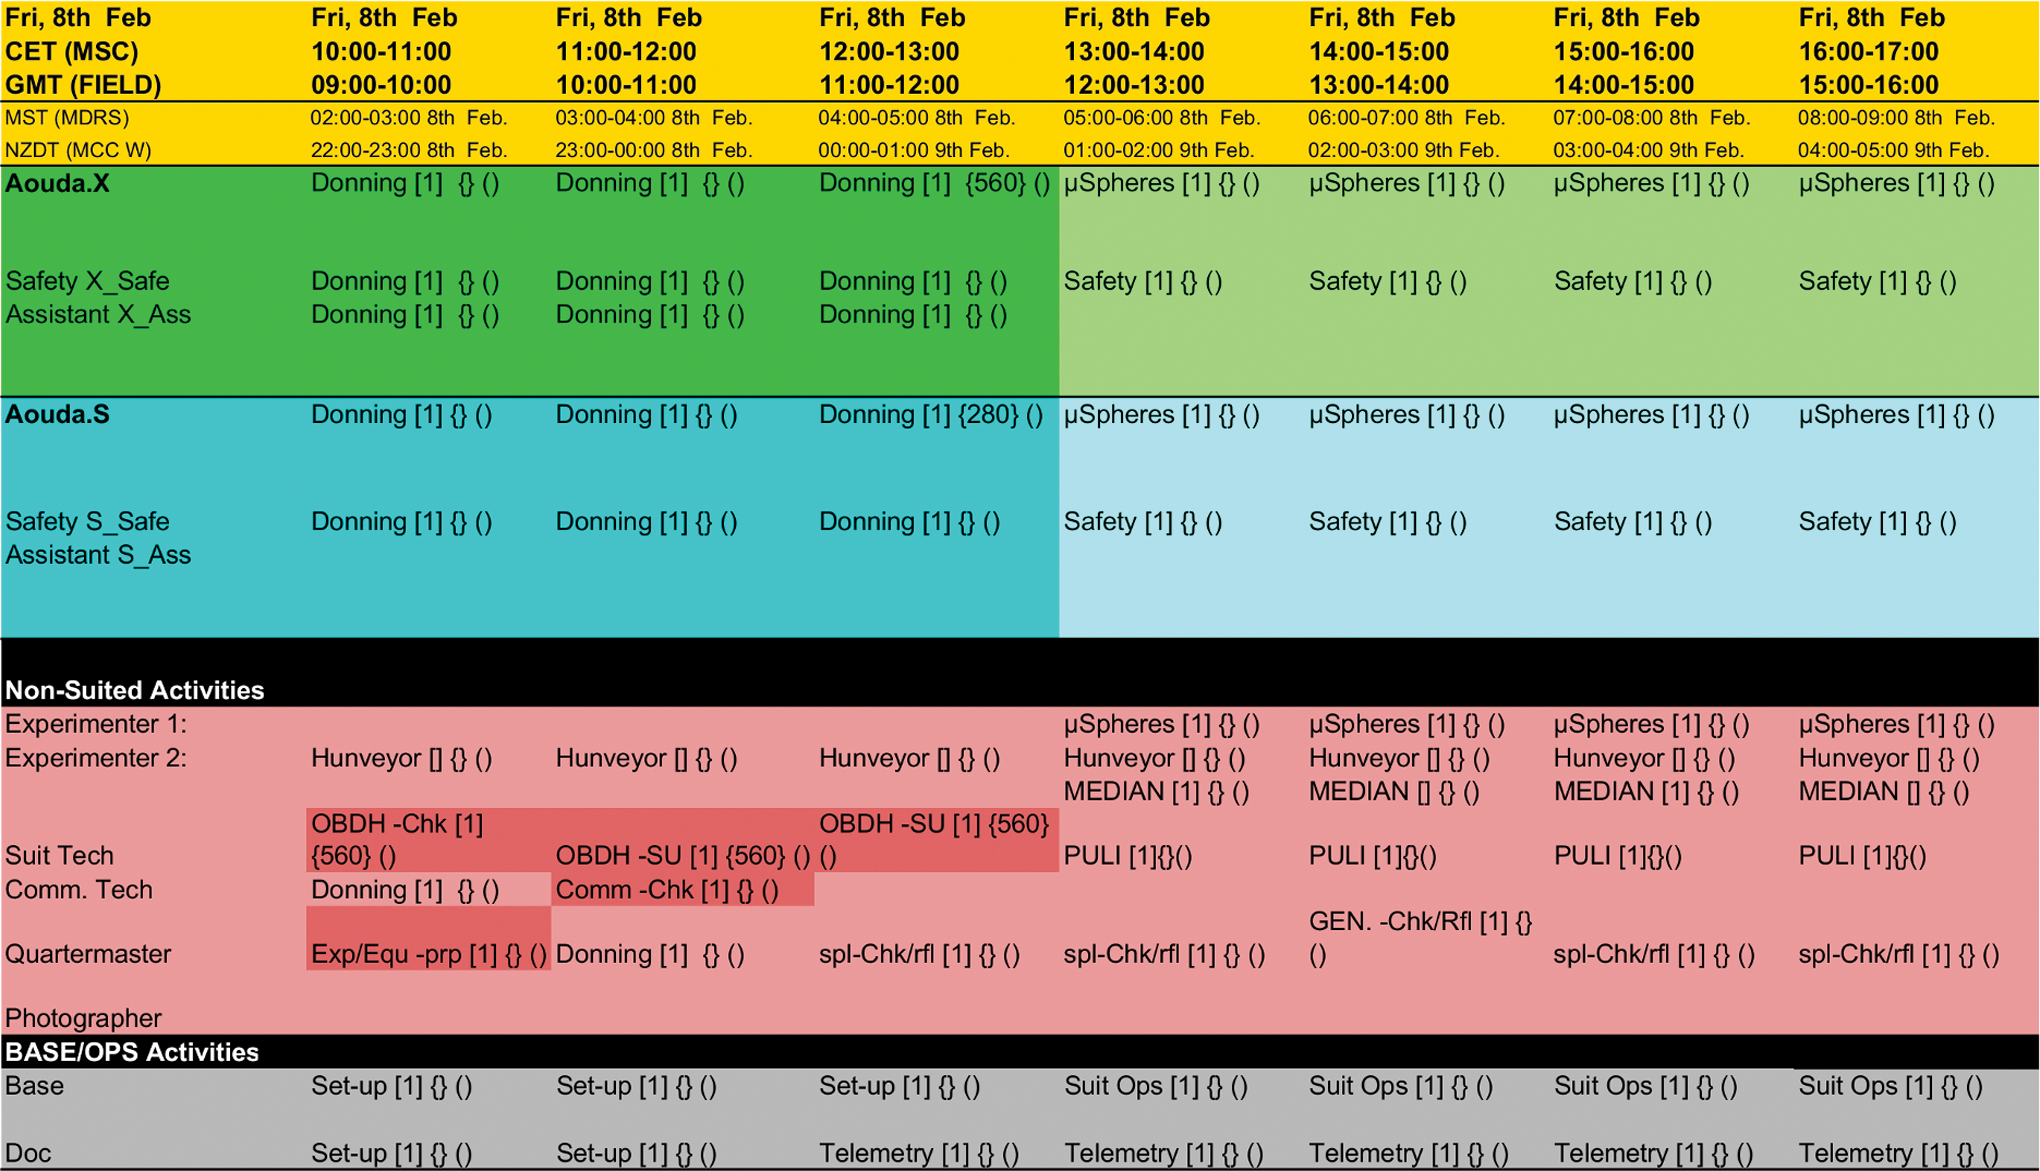
Part of the MP for one day of the mission (not all information shown). This document consists of the rough schedule for the whole mission and serves as a starting point for in-mission planning. (Color graphics available online at
2.2. In-mission planning
Based on the MP, the Daily Activity Packages (DAPs) were generated during the mission. A DAP consisted of a single document containing all necessary information about the daily activities such as the Field Activity Plan (FAP) and the Traverse Plan (TP).
The development of the FAP for each day included the temporal distribution of experimental and organizational activities into a schedule with 15 min accuracy, with respect to available and necessary resources and manpower. An example FAP is displayed in Fig. 2. The TP was also established during the mission—unlike, for example, for the NASA Desert Research and Technology Studies (Desert RATS) 2010 field simulation (Hörz et al., 2013)—and was based upon a set of various Google Earth maps provided by the Remote Science Support (RSS) team that showed suitable experiment locations, communication coverage areas, and potential geographical dangers (Losiak et al., 2014 in this issue). Finally, the additional information part of a DAP included updates on weather, procedures, or contingencies. Figure 3 shows the TP for one activity as part of the DAP.
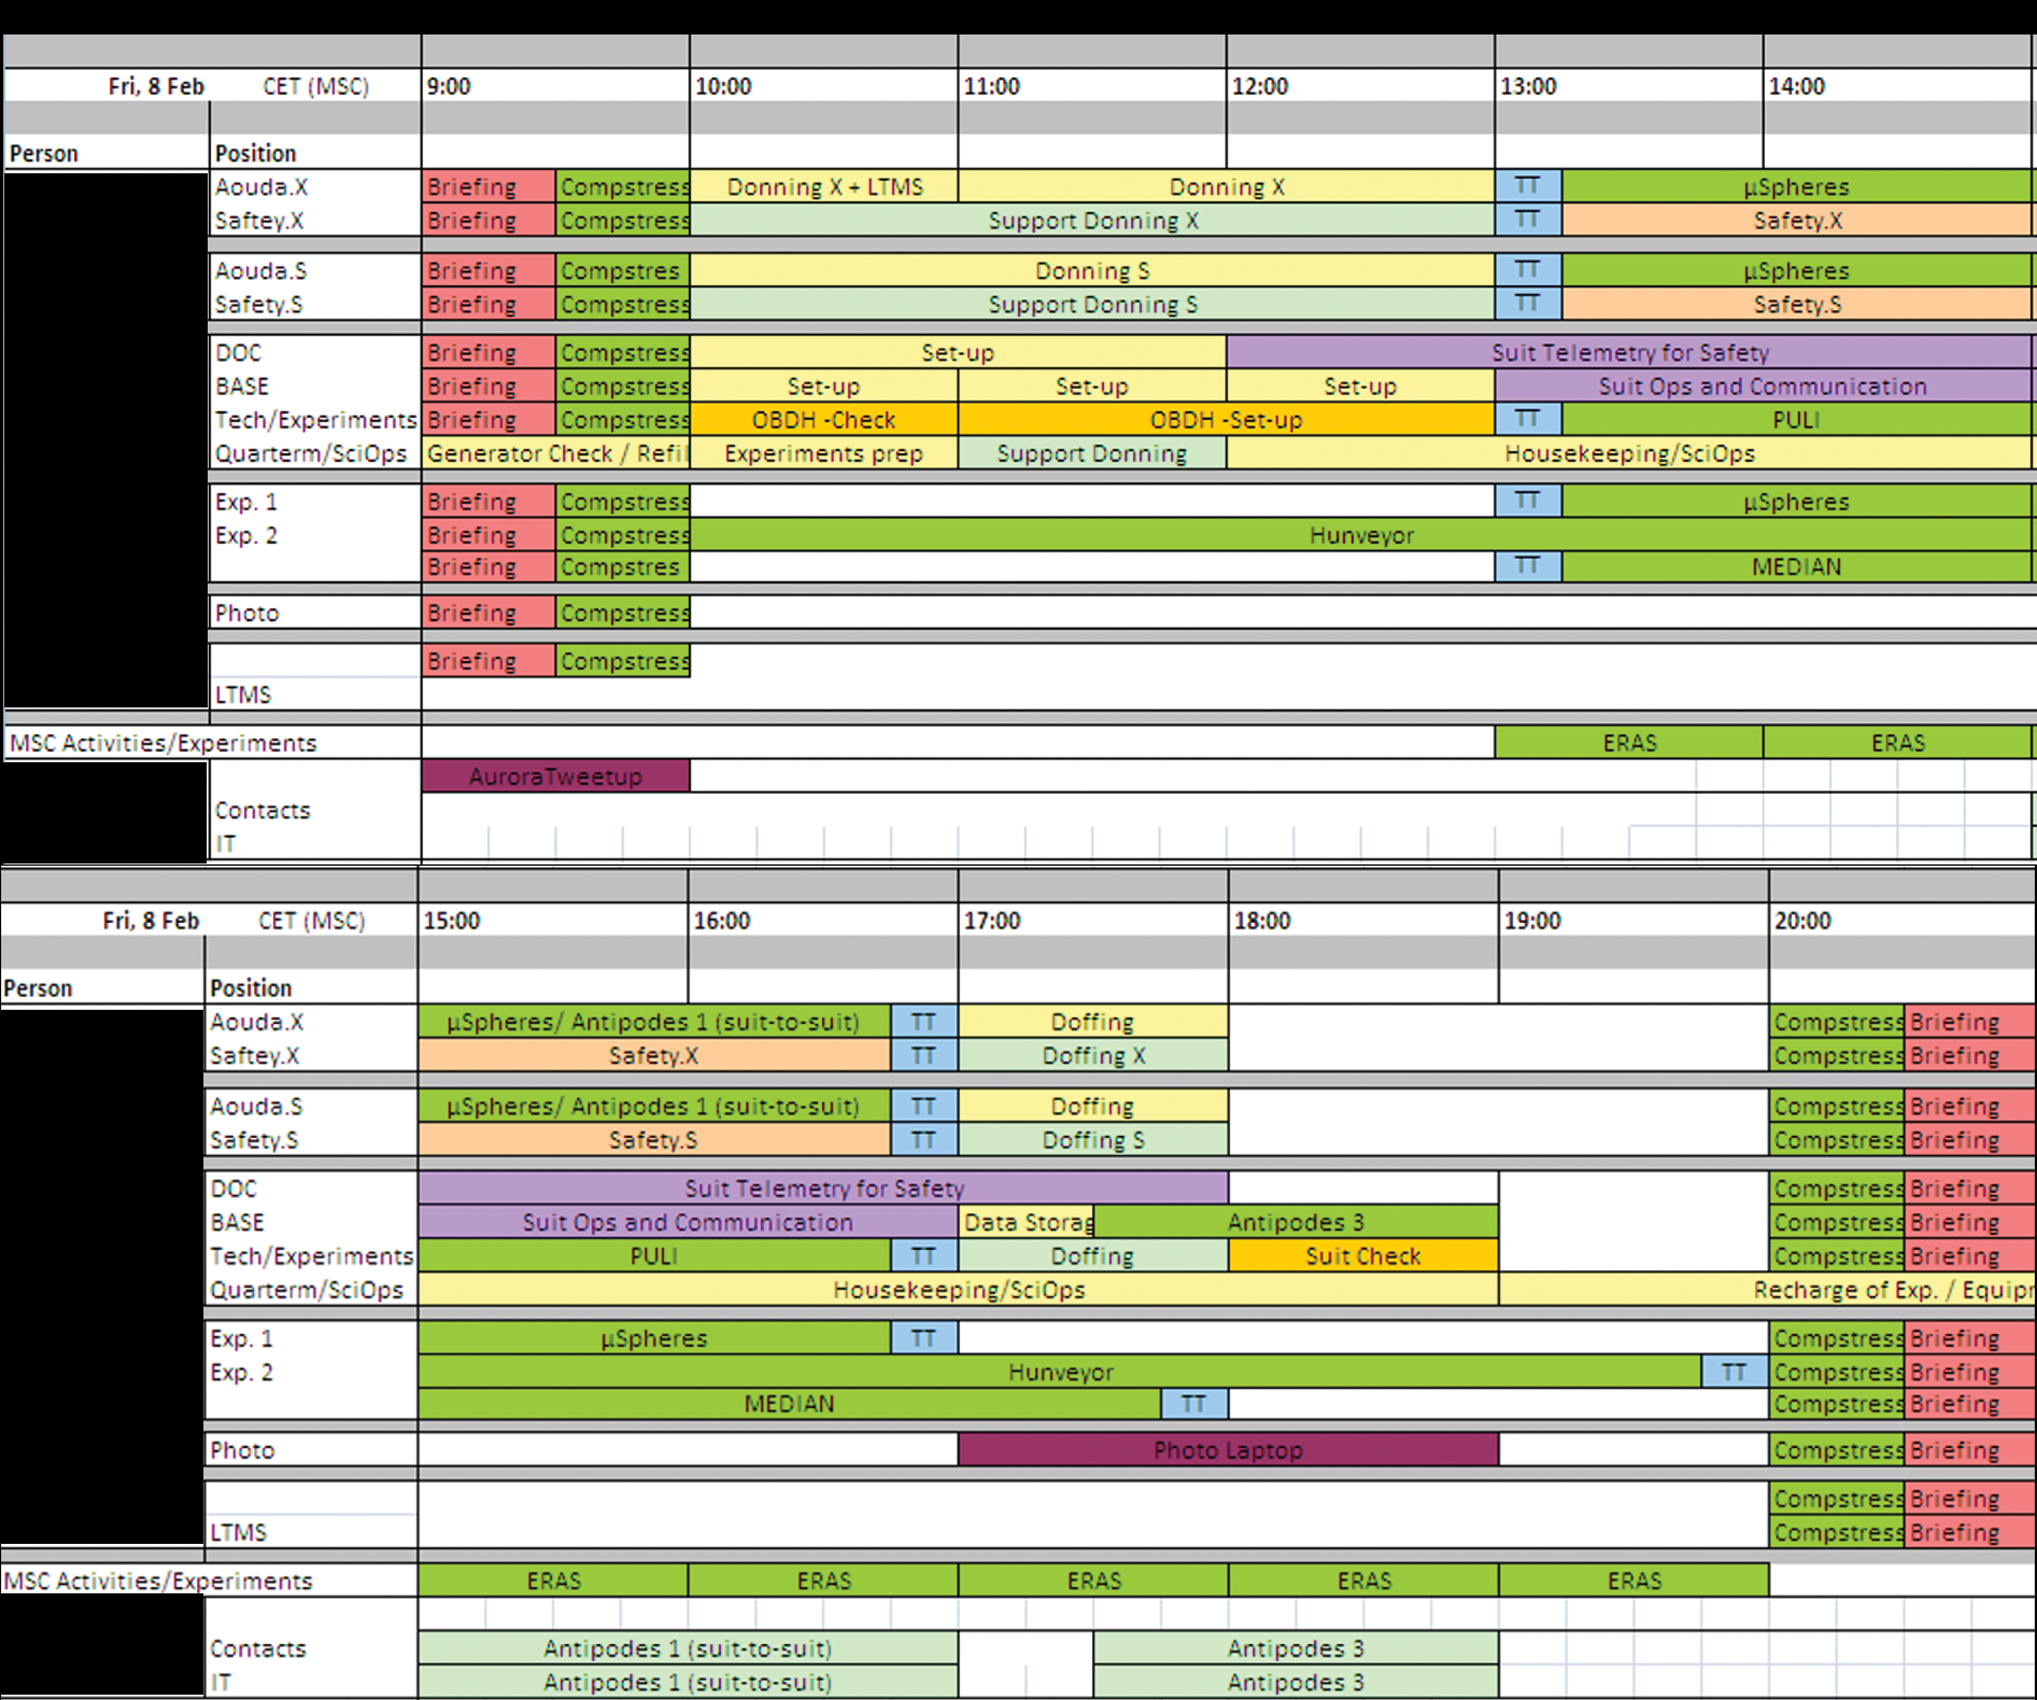
Example FAP that shows the schedule of all activities to be carried out in the field. (Color graphics available online at
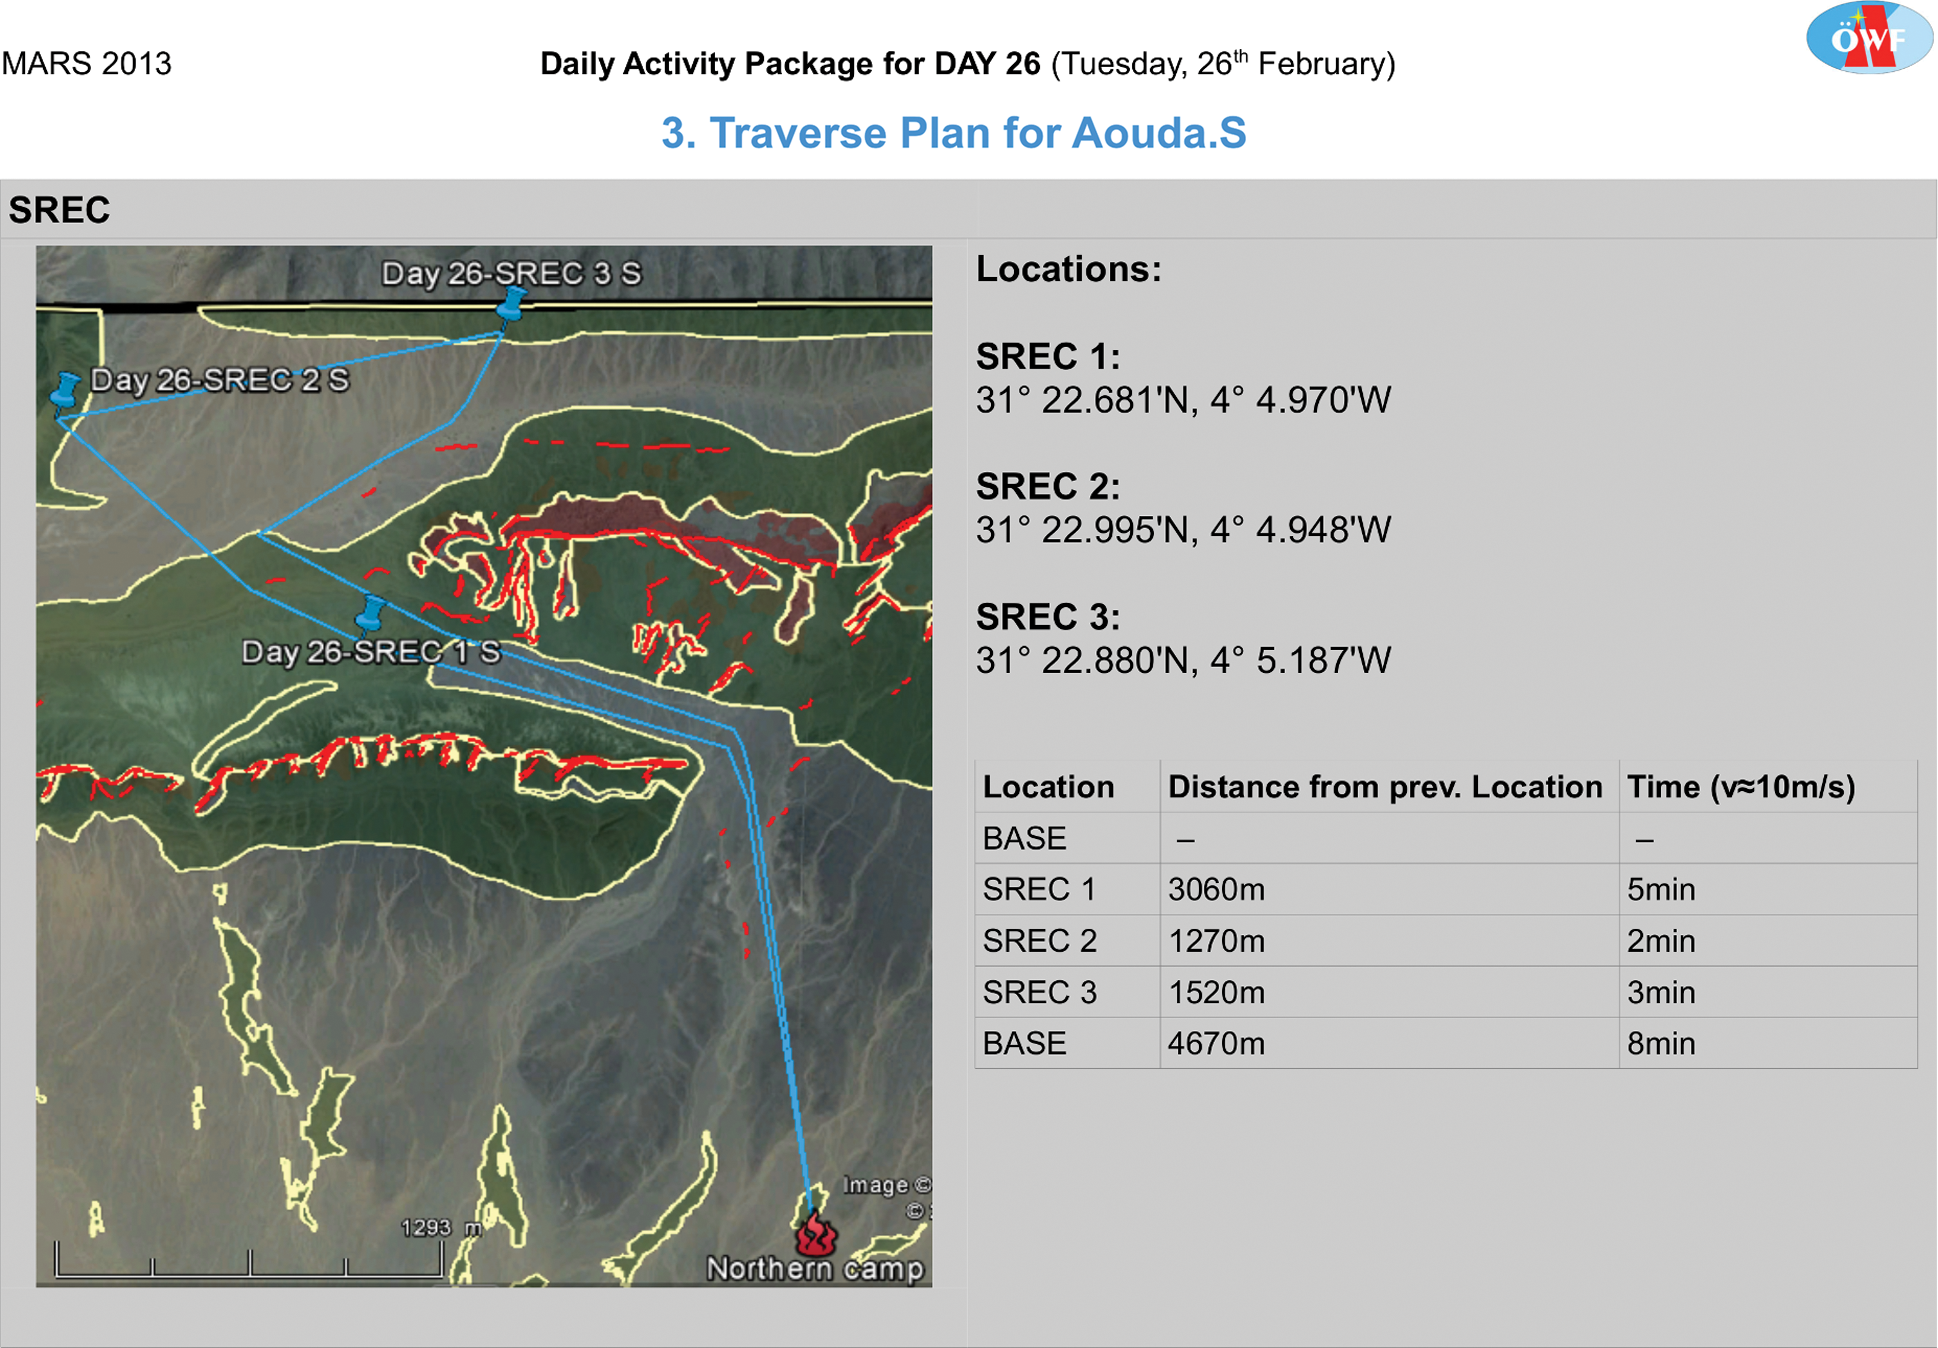
The TP for each activity is part of the DAP. Shown is an example for the SREC experiment. (Color graphics available online at
For the 3-days-in-advance planning strategy, the DAPs were prepared 3 days before the target day to allow for best-possible familiarization by the crew and for urgent changes if necessary. Therefore, feedback and requests from the field crew or the RSS team of the Mission Support Center (MSC) had to be considered. The implementation took into account the general constraints regarding activity and traverse planning, for example, battery lifetime of suits [4 h per set of batteries, see Groemer (2013)], access to experiment sites, or Wi-Fi range. To keep up the 3-days-in-advance planning, the results of this feedback were included in the DAPs for the upcoming target days, which thus became effective in the field after 3 days. Only the most urgent issues were considered and applied for the next day.
From the start of the mission and throughout, we received feedback that resulted in a change of the FAP. This feedback included
• RSS/PI: data is faulty and experiment needed to be repeated, change in experiment location due to scientific interest, new insights in geography of region classifies selected experiment locations as dangerous, more/less science runs needed
• Field crew: too many/too little experiments scheduled, updates on activity duration, crew exhausted/ill
• Flight Control/field crew: operational changes (e.g., work flows, information transfer)
• Experiments/vehicles/communication faulty
• Unforeseen events demanded attention/action or prevented experiment execution
3. Determining the Scientific Value of Mission Activities
Planning a scientific planetary mission requires the choice of a suitable and efficient planning strategy. Assuming that a suitable planning strategy increases the success of a mission, the analysis of a mission's scientific value reflects the quality of the planning strategy behind it. Choosing a planning strategy for future missions can then be aided by the scientific value of previous missions and their planning approaches. To determine the scientific value of a mission, its results and activities need to be analyzed for efficiency. By comparing MARS2013 to previous Mars analog missions in terms of their scientific value, we can examine different planning strategies and detect improvements. This requires a standardized quantitative method for mission analysis.
So far, no standardized method for the evaluation of the scientific value of missions exists that would be readily applicable to a variety of Mars analog missions. Only a few authors have performed an analysis of the time allocation, for example, at the Mars Desert Research Station, Utah (Thiel et al., 2011), or at the Flashline Mars Arctic Research Station, Devon Island (Binsted et al., 2010). In the study of Thiel et al. (2011), the time development of different daily activities throughout the mission is shown, as well as an overview of the average durations for these activities. Binsted et al. (2010) also analyzed the time spent on different mission activities, but both papers focus on human crew-related activities. Their subcategories are not comparable to ours, and their findings can only partly be compared to our analysis. Other research groups, like the NASA Desert RATS, focused mainly on traverse planning and science prioritization systems but did not provide a quantitative analysis of their activity planning strategies (Hörz et al., 2013).
For the analysis of the efficiency of MARS2013, we therefore used a method that we first introduced for the Dachstein Mars simulation in 2012. There, we focused on assessing the percentage of achieved science goals, the duration of different activities according to Marquez (2010) for Apollo 14, and the types of causes for delays (Hettrich, 2012). Additionally, we monitored the change of duration for specific activities to see the time evolution throughout the mission.
4. Basic Concepts of the Efficiency Analysis
Our efficiency analysis evaluates the scientific mission outcome and planning strategy that allows for comparison between missions with different planning strategies. The analysis methods thus need to be, in principal, independent of the absolute number of science goals and the specific types of experiments. The main focus lies on applications for Mars analog missions, but the concept can be extended to include other types of simulations and/or real planetary explorations; parts of the methods are rooted in the Apollo 14 mission (Marquez, 2010). To fulfill the comparability criterion, we introduce a Relative Science Analysis: executed activities are evaluated with respect to planned activities. The actual number, type, or details of the activities can then be neglected. This assumes an overall satisfactory science plan; that is, the mission is seen as scientifically successful if all experiments are conducted to the extent foreseen by the experiment PIs. Using the Relative Science Analysis, we can determine the overall success of the planning strategy by considering the executed and planned number of runs/samples—the science goals—for each experiment. This allows for a comparison over a broad range of different missions and only requires the science goals to be well defined and the successful science goals to be counted.
To increase the depth of the efficiency analysis, especially with regard to the quality of the planning strategy in itself, the time properties and the nature of the executed activities are investigated further. This includes answering the following questions: How does the time used for each activity compare to the scheduled time? How do the time used and the scheduled time for an activity evolve over the course of the mission? Here, the activities are divided into different categories; this allows us to see the fraction of time that each kind of activity takes up each day.
By comparing the duration of executed and planned activities and monitoring their evolution, we can identify sources of divergence between planned and executed schedule, track and eliminate causes for delay, and identify activities that require adjustments of their planned duration over the course of the mission together with the response of the FP to these changes in duration. Crucial for this kind of time analysis are time stamps for each activity and a true record of the nature of all executed activities, that is, experiment start time, experiment stop time, break start time, break stop time, and so on.
Finally, the above analysis can be applied separately to different subjects, that is, individual suited and/or non-suited activities. Suit-specific behavior and potential difficulties can be tracked, such as permanent overestimation or underestimation of activity time for a specific suit due to suit-specific technical properties. Ideally, for the mission outcome, the fraction of activities that counts toward science output would be as large as possible.
By evaluating these relative science analyses and activity time-properties, we can make a statement about the absolute success and efficiency of a planning strategy. When using the same analysis for a variety of missions and obtaining these values, different planning strategies can be compared. It is clear that this analysis and a comparison of different missions are limited, as the efficiency of a mission depends on more than planning alone. Other parameters, such as experimental procedures, equipment in the field, or physical conditions of the analog astronauts, also have to be factored in. But we can assume that a good planning strategy favors an efficient mission.
5. Efficiency Analysis of the 3-Days-in-Advance Planning Strategy
The data for the MARS2013 planning strategy efficiency analysis were obtained from the DAP files, RECORDS log files, SCIOPS log files, science log files, and several experiment data files. We used data regarding when activities were conducted, their respective duration, who performed them, and the number of runs/samples. For these, we compared executed activities versus planned activities. The following sections present details regarding the individual parts of the efficiency analysis, that is, achieved science goals, time use, and duration per activity, which serve as a basis for the evaluation of the planning strategy later on.
5.1. Achieved science goals
One important aspect of the mission objectives was the science outcome. The evaluation of achieved science goals therefore is a key performance indicator of mission success. A science goal analysis states how many of the planned science goals were actually achieved. A science goal was defined as either a complete run of an experiment or one collected sample, depending on the type of experiment. The number of planned science goals can be defined differently by the PIs or by the FP. The PIs provided a minimum amount of runs or samples required to consider their experiment conducted successfully. The planners, on the other hand, might schedule a larger number of runs or samples to increase the success rate of the experiments, which would lead to a more satisfactory mission outcome; missions have shown that, generally, activities performed during a mission—especially if performed with a space suit simulator—take longer than unsuited activities under laboratory conditions (Hettrich, 2012). This was confirmed during MARS2013 with the DELTA experiment (Soucek et al., 2014). Taking the findings from previous missions into account for MARS2013, we planned longer time-slots and more science goals than requested by the PIs. This also served as a buffer for possible problems and invalid data, and it provided the scientists with some extra data. For MARS2013, we thus ensured that the MP and the DAPs had enough time allocated for every experiment to meet its goals.
Planning extra time for the experiments proved to be successful; most experiments achieved at least 100% of the number of runs requested by the PI. The only two experiments that were far from reaching 100% were the μEVA experiment, where the field crew prematurely ran out of supplies, and AMFS, for which the experimental data analysis was not concluded at the time of writing, which left us with incomplete information about the achieved science goals. Zero entries are due to either cancelled participation in the mission (COMPSTRESS/iMAMO) or unclear/nontrivial formulation of science goals (Geoscience—number of required samples was hard to define; requirements changed throughout the mission). Thus, apart from exceptions for which the experiment either did not take place or no data were available, we met almost all scientific mission objectives required by the PIs.
The next step was to examine how well the executed activities match the planned activities. We started by looking at the ratio of executed versus planned science goals by the FP, for which Fig. 4 suggests a less-positive statistic. Only three experiments reached 100% or more. As before, COMPSTRESS and iMAMO are still listed in the diagram. Note that AMFS—consisting of AMFS-SEG and AMFS-MEDINC, which uses questionnaires (Luger et al., 2014 in this issue)—also has a zero entry, because it required only a short time and did not need to be explicitly scheduled in the FAP.
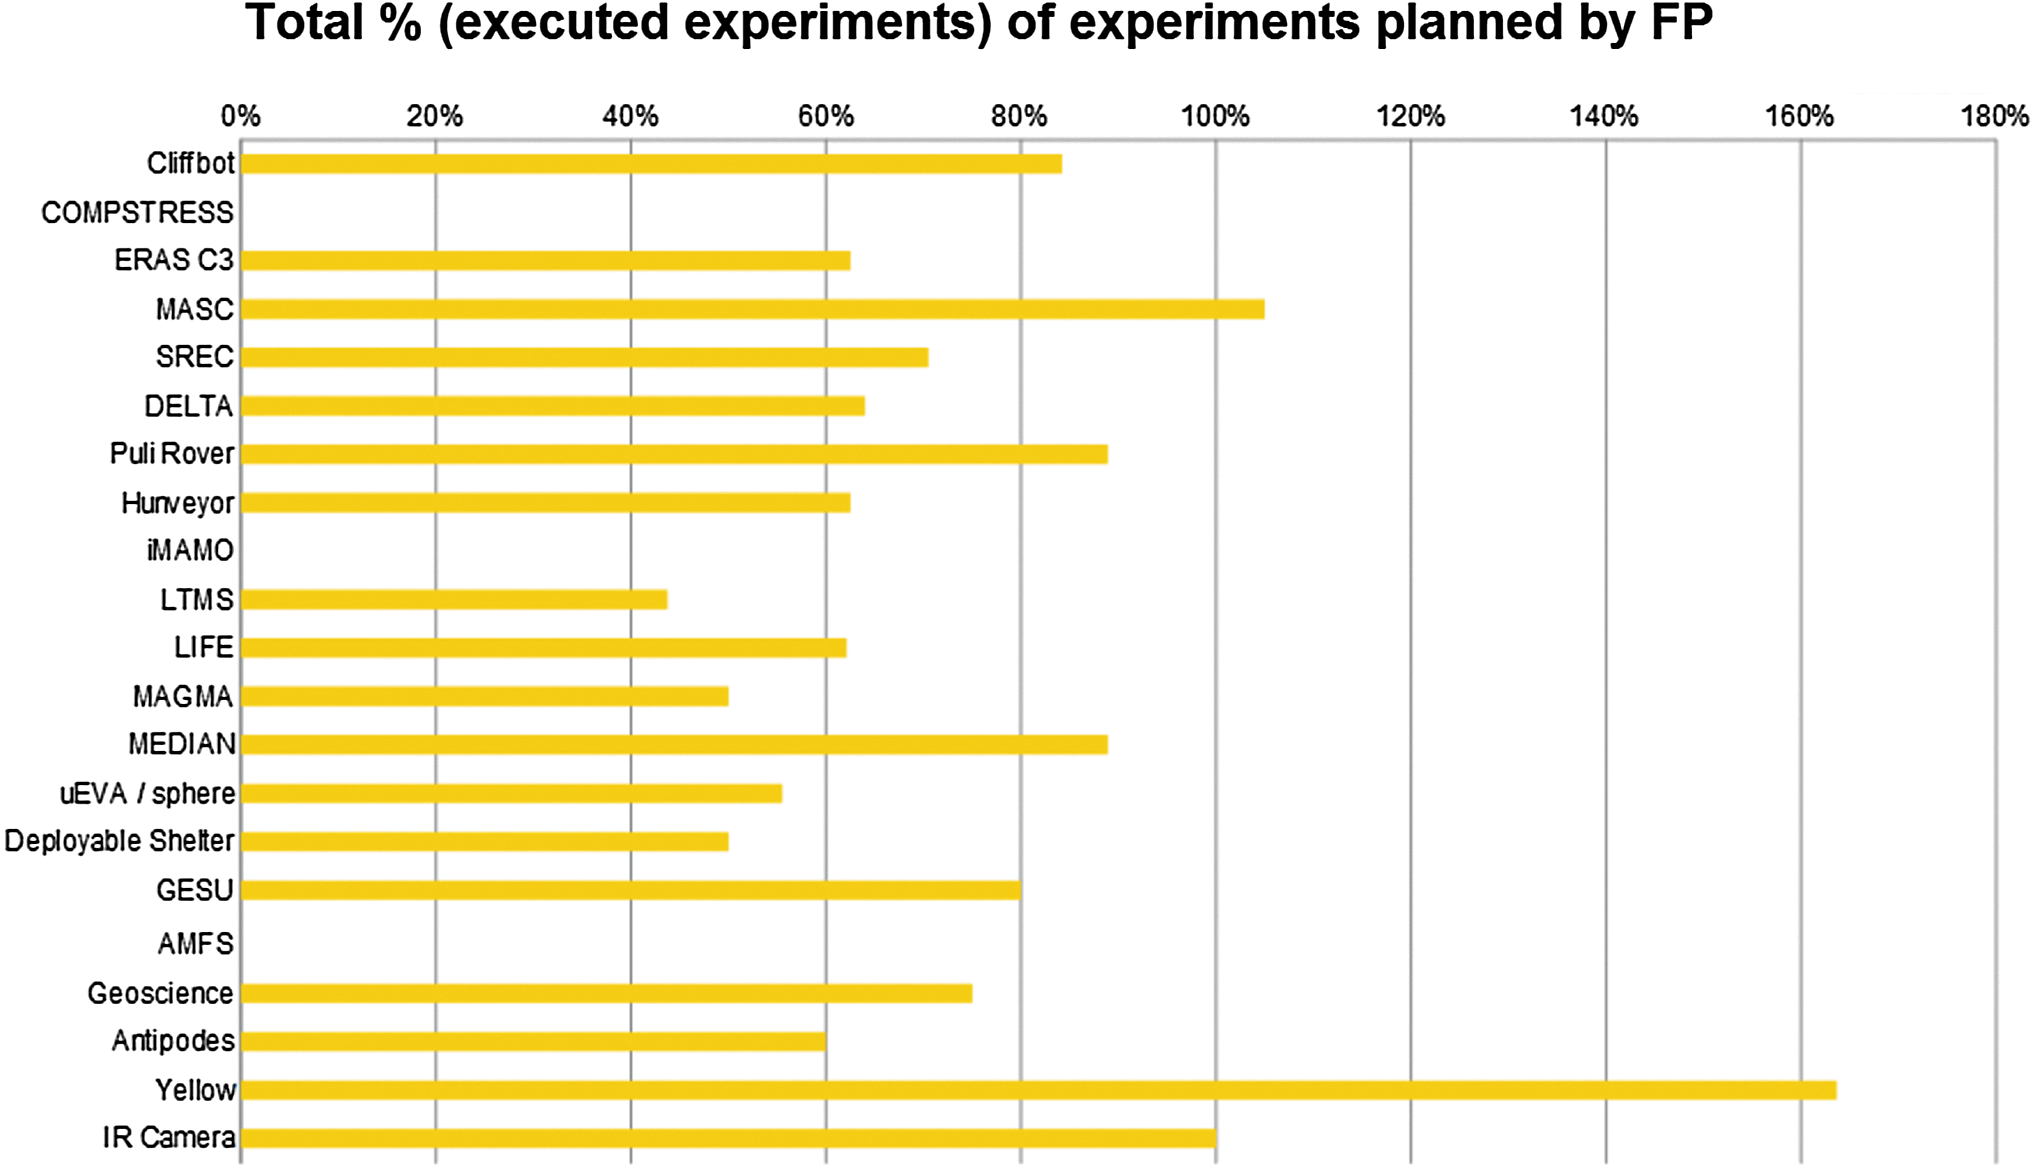
Achieved science goals with respect to the planned ones. (Color graphics available online at
For a more detailed science value analysis, we divided the data into different subsets. We compared accomplished science goals versus planned ones during the mission separately for the two space suit simulators and the non-suited experiments. We found that in total each of the suits fulfilled around 87% of the planned tasks, while only 77% of the unsuited planned activities were conducted.
5.2. Time use
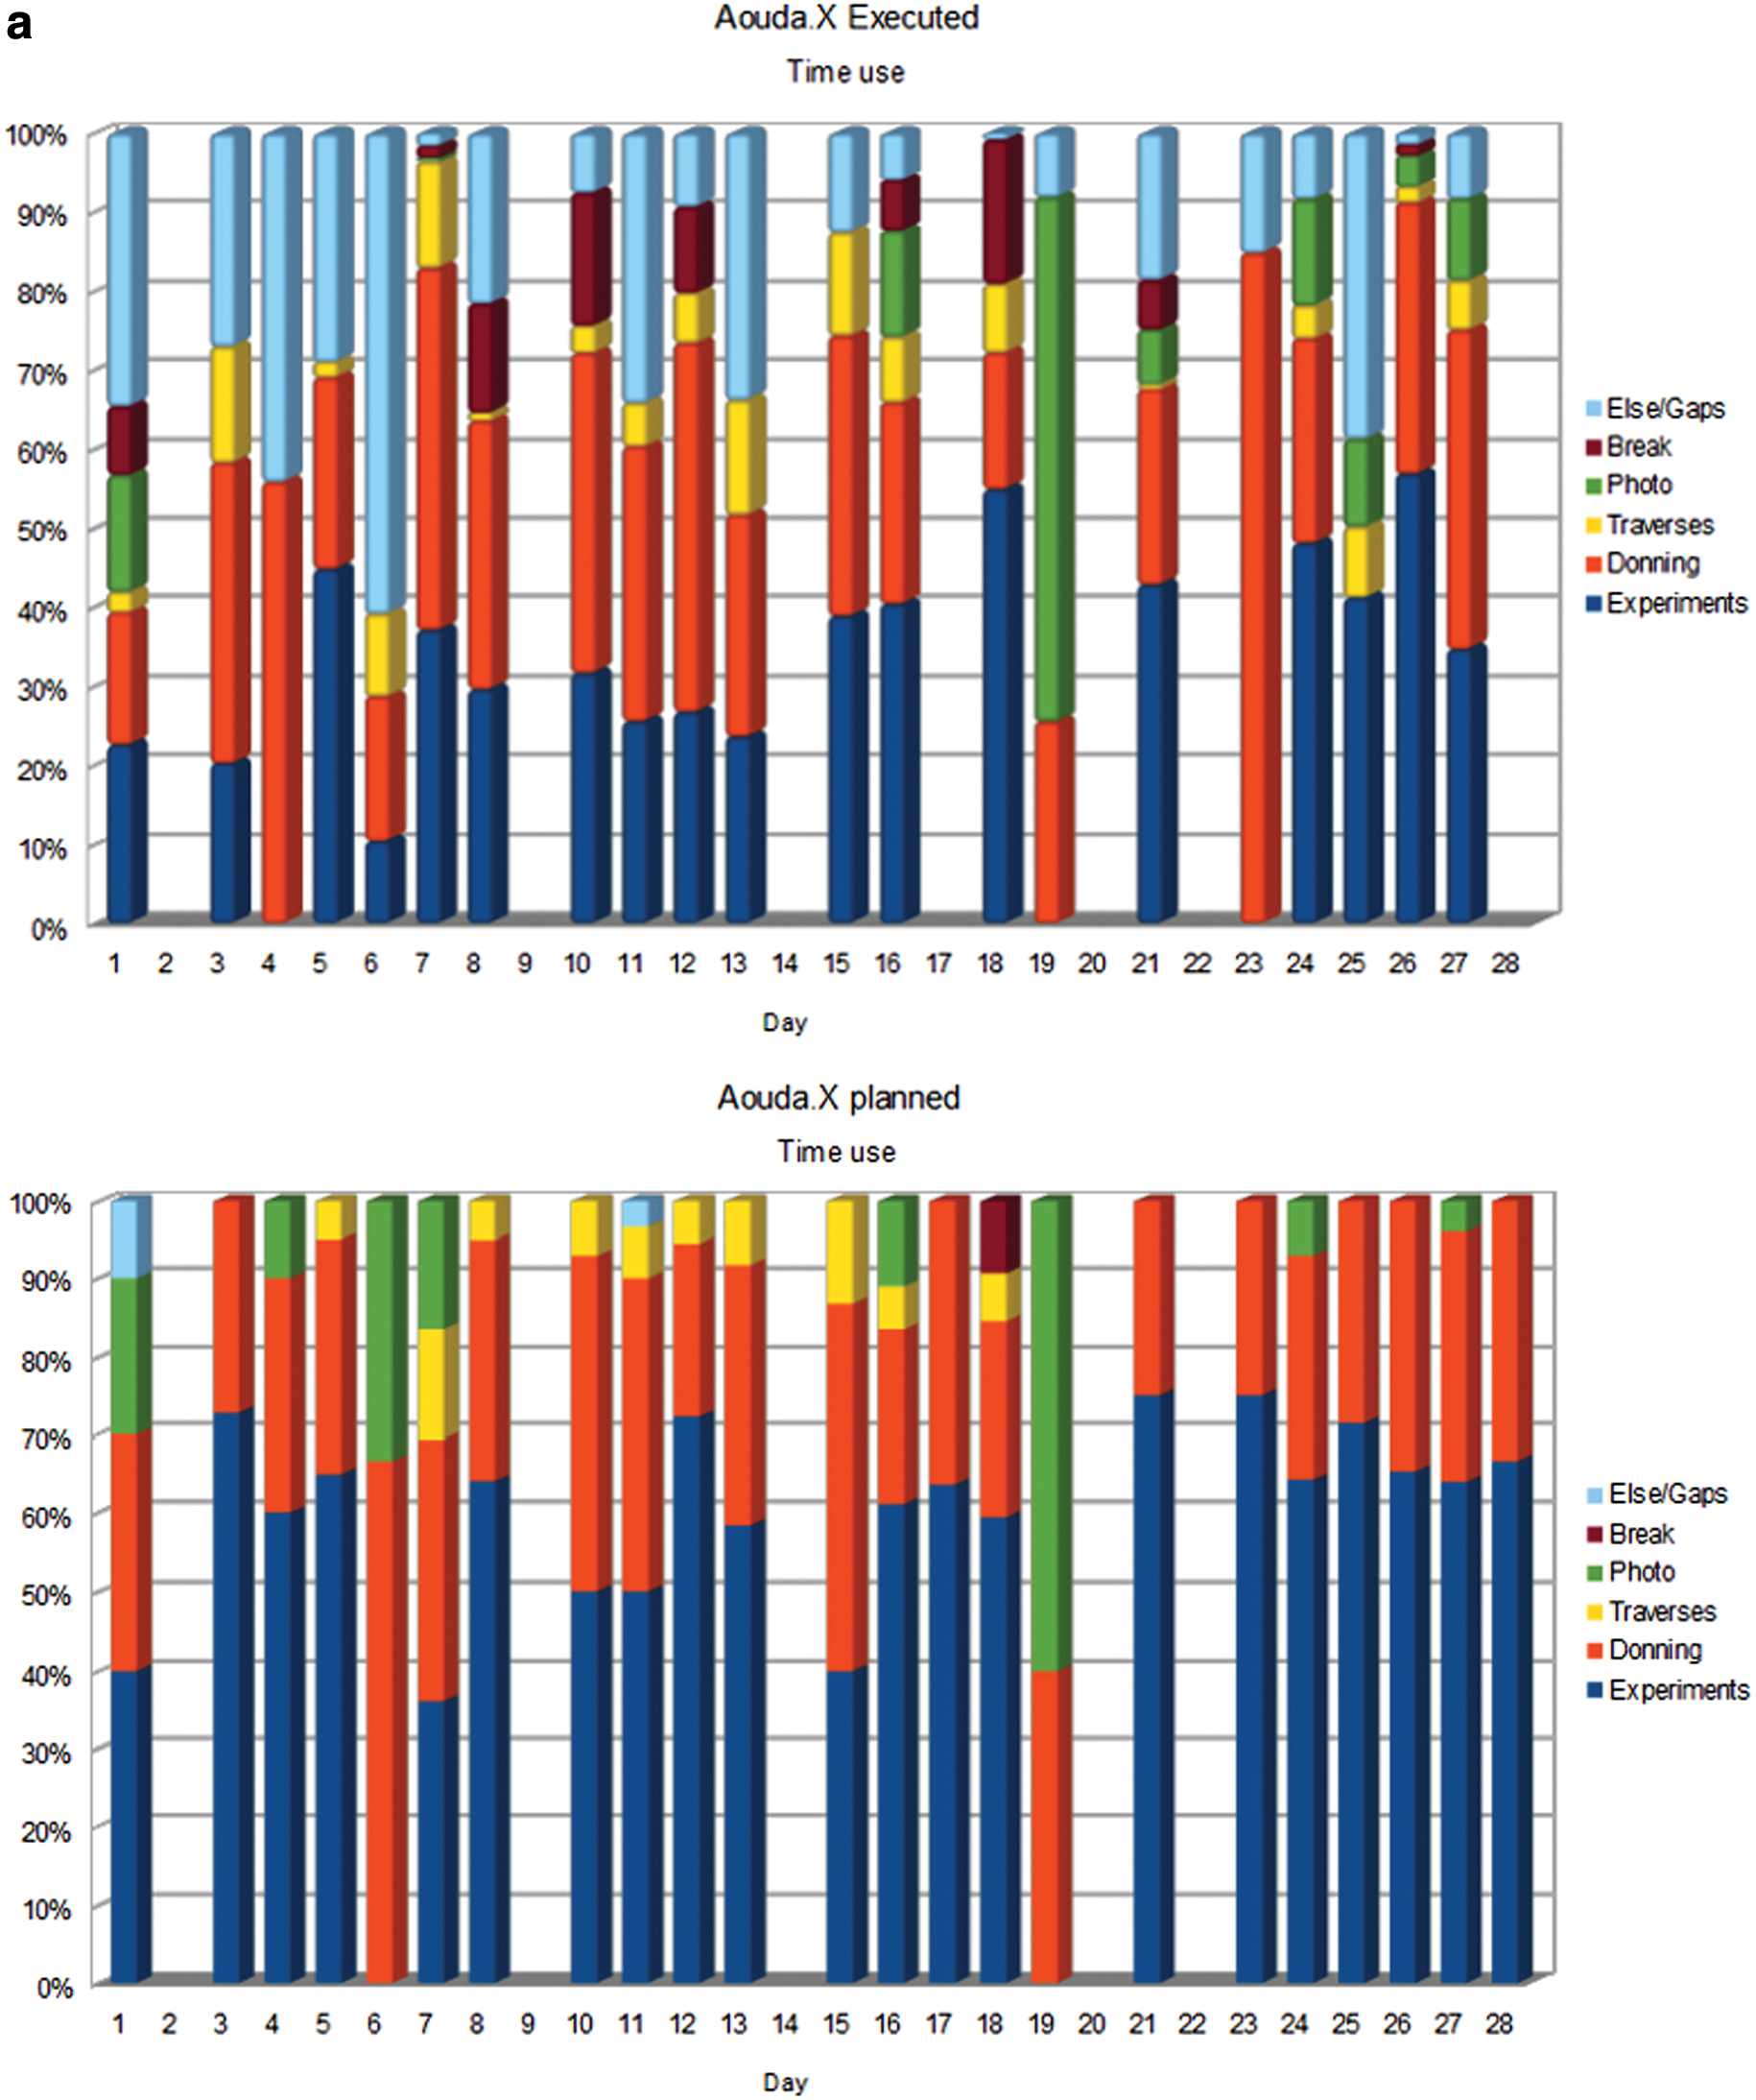
In accordance with the analysis of EVA activities during the Apollo 14 mission, we discuss the actual time use versus time allocated for an activity (Marquez, 2010). This provides an additional method of analysis with which to evaluate a mission's efficiency; it has already been applied to the Dachstein Mars simulation in 2012 (Hettrich, 2012). In comparison to the study of Marquez (2010), the categories used for our analysis deviate due to the different types of activities performed during the OeWF analog missions. We separated the activities into the following categories: experiments, donning time, traverses, photo shoots, breaks, and Else/Gaps. Figures 5a and 5b show the percentile distribution of the time use for the two space suit simulators, Aouda.X and Aouda.S, for the duration of the mission. Of main interest here are data in dark blue for the experiments and light blue for the Else/Gaps. Else/Gaps refers to activities that did not provide enough information and/or were not scheduled, for example, check and repair activities. The nature of this category will be explained in further detail in Section 7. Unscheduled gaps may refer to gaps in the time logging; that is, not all information was available for analysis. Gaps within the planned activities account for scheduled equipment checks.
(

Three days were planned without scientific experiments (two for Aouda.X, one for Aouda.S). Those days were reserved mainly for photo shoots; as a result, the donning time dominates the activities (red and green bars). Apart from one exception, no dedicated meal breaks were planned—previous missions showed that the astronauts usually eat before and after the EVAs and take their breaks to rest when needed.
The mean experiment fraction was 32% for Aouda.X and for Aouda.S. We note a slight increase of experiment fraction for the Aouda.X EVAs over the duration of the mission (see Fig. 5a). No such trend is apparent for Aouda.S. The mean value of the planned experiment time comprised 59% and 53% of the total time for Aouda.X and Aouda.S, respectively.
A larger fraction of gaps in the executed activities compared to the planned activities suggests that large amounts of time were spent on activities that were not properly logged or reported. On the last day of the mission, February 28, no EVAs took place, although Aouda.X was planned for a short half-day EVA. On other days, EVAs had been cancelled due to crew health, repairs, or infrastructural inconveniences, for example, due to the excursion to Station Payer.
Note the following special case: on February 23 a sandstorm led to all activities being aborted, which resulted in 100% of the Aouda.S EVA time being marked as gaps; Aouda.X only shows donning and gaps.
In Fig. 6, the time use for both space suit simulators and the full amount of EVAs is added up and compared with the planned distribution. In total, 301.5 h of activities were planned, of which 190.73 h were executed. The comparison of the distribution between planned (outer ring) and executed (inner ring) reveals that more than half the total time (54%) was originally planned for scientific experiments, whereas it made up less than a third (32%) of the executed activities. The donning fraction in both distributions is comparable, but for the executed activities the gaps rise to almost 19% of the total. The divergence between planned and executed activities leaves room for improvement of the planning strategy to achieve higher scientific mission outcome. The reasons for this divergence and how to overcome it should be subject to further studies.
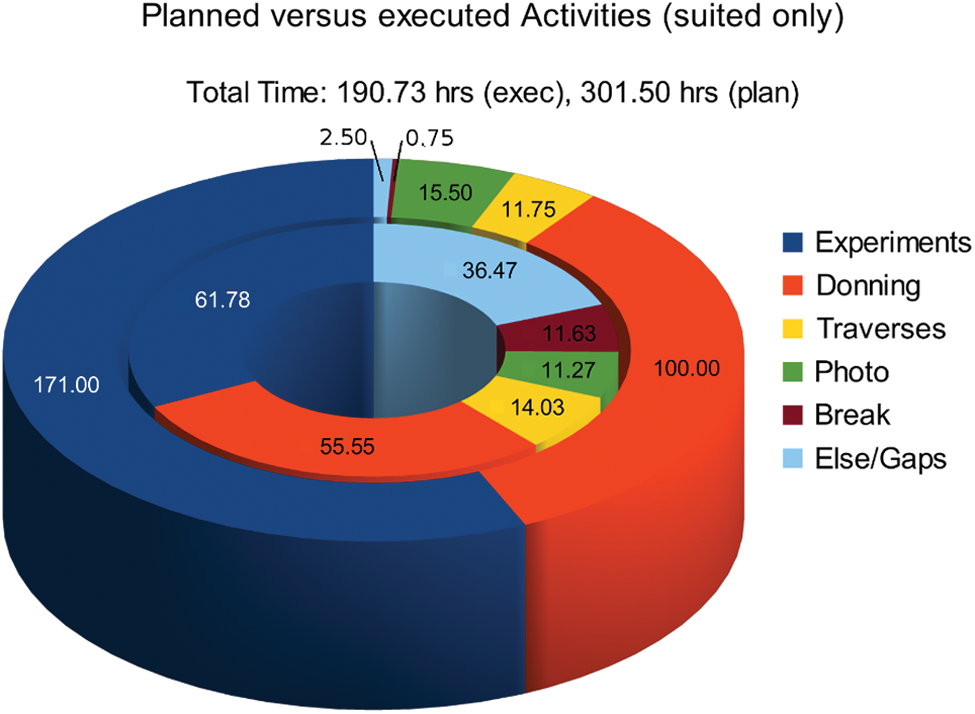
Distribution of suited activities during MARS2013 planned (outside) versus executed (inside). (Color graphics available online at
5.3. Duration per activity
To determine the efficiency of the MARS2013 planning strategy, it is necessary to consider both the number of achieved science goals and their duration. We can then evaluate the time evolution per science goal and compare the executed to the planned duration. The planning strategy efficiency increases if the difference in time per run/sample (TPR) between theoretical (planned) and practical (executed) decreases. For a mission that also consists of experiments that have never before been tested in the field, the duration estimated prior to the mission, which served as the primary planning input, and the actual duration for the conduction of this experiment can differ greatly. Additionally, the duration might vary throughout the mission since the astronauts will become familiarized with procedures and hardware, thus decreasing the TPR. To perform efficient activity planning, it is therefore essential during the mission to adapt the scheduled times for activities in future DAPs to follow the trend of their duration. This ensures that EVA time will be used with optimum efficiency. For MARS2013, this was not yet fully implemented due to limited resources; in most cases, a detailed assessment of experiment durations was only available toward the end of the mission. The adaptations of the planned TPR during the mission were therefore mostly based on updated estimates of the field crew (see Section 2.2).
This analysis was not restricted to experiment activities. Examining the duration of the EVAs in total, we found that, toward the end of the mission, the planned EVA times approximated the executed ones. If we looked at the donning times only, the approximation between planned and executed would have been more apparent (see Fig. 7). Regarding the experiments, there was only one experiment during MARS2013 that provided enough complete data sets that were consistently in the same constellation and location such that solid TPR analysis could be performed throughout the entire mission. By definition, this was the DELTA experiment (Soucek et al., 2014). This development is shown in Fig. 8, where one experiment refers to one complete run of all 10 sub-experiments of which DELTA consisted. This experiment was new and had never been performed before on any other Mars analog mission. Therefore our initial estimate (180 min for Aouda.X) was far from the actual necessary time (on average 50 min for Aouda.X). During the mission, we gained experience with this experiment, so that planned and executed durations approached each other toward the end.
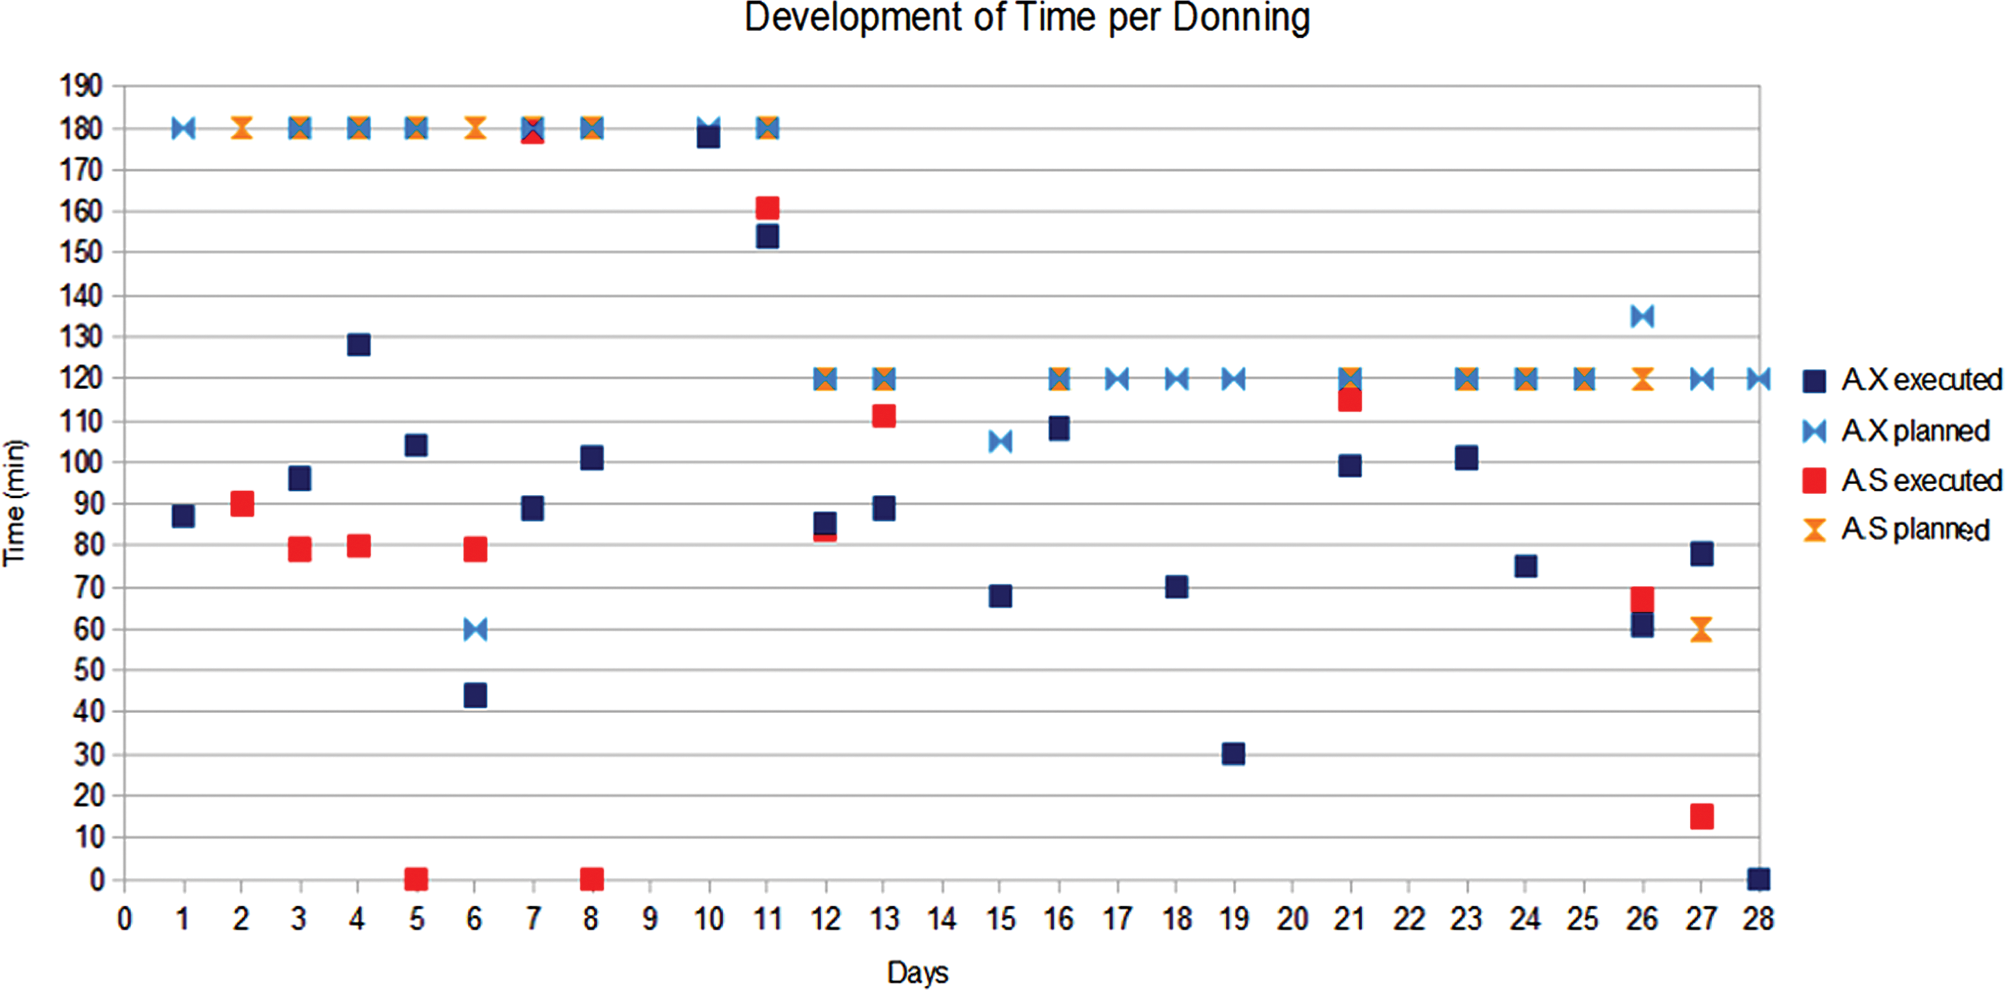
Development of donning times during the mission. (Color graphics available online at

Development of time per DELTA experiment. (Color graphics available online at
6. Performance of the MARS2013 Planning Strategy
After introducing the working principle of the planning strategy for MARS2013 and the methods of analysis, we now discuss the overall performance of the 3-days-in-advance planning strategy. In general, we experienced the mission as divided into two different time periods: before and after February 11. The main reason for this divide was the need for familiarization of planning strategy, procedures, and organizational structures at mission start.
The following list documents different factors that caused difficulties in the planning for and during the first phase of the mission: • Operational and logistics problems in the field. Several hardware items, including communication, were not yet fully available until February 2, thus affecting the planning until February 5. Until the beginning of the isolation phase of MARS2013 on February 8, equipment setup and checks, as well as activities of external groups, resulted in less attention paid to science activities and the reports for the MSC. • Organizational problems in the MSC. For the first few days, the MSC lacked some of its key personnel. This had an impact on all scientific experiments conducted, and it affected necessary map updates used for traverse planning and resulted in a delayed optimization of the work-flow procedures between RSS and FP (Losiak et al., 2014 in this issue). • Unfamiliarity with the 3-days-in-advance planning strategy. MARS2013 was the first OeWF mission to use a time delay and, therefore, the 3-days-in-advance planning strategy (Groemer, 2013). All previous missions were dedicated to real-time planning (Groemer, 2012b). The field crew and the MSC team were not familiar with this new strategy. Even though everyone was briefed and the basic explanations were recorded within the Mission Manifest Release 3, much of the first week was spent resolving questions and confusion about the planning strategy. • Unclear field autonomy. With an advance planning strategy as for MARS2013, real-time changes should not occur. As a result, the field has to have the autonomy to adjust the FAP if necessary. The extent of the autonomy and guidelines as to how changes are to be handled were unclear.
During the early phase, the time delay was not yet implemented. As a result of available real-time adjustments and unclear field crew autonomy, serious re-planning requests, such as changes in the crew due to health reasons or redefinitions of experimental procedures that needed to be implemented within the DAPs, were not submitted in advance but in real time. At this point, we had to deviate from our planning strategy—advance-planning and real-time adjustments were run in parallel until the time delay was introduced with the beginning of the isolation phase on February 8. On February 11, the official MSC media day, everyone was familiar with the 3-days-in-advance planning, and real-time adjustments could finally be abandoned.
The planning for the second phase of the mission was much smoother. With the start of the isolation phase, the field crew was not occupied with accommodating the various external teams and their needs. This relief of strain resulted in more precise reports on available infrastructure, resources, and personnel skills. Supported by the reports of some of the bridgehead crew members who returned to the MSC after the February 8, we were able to improve the DAPs' structure (less text, important things highlighted), content (use of personnel skill list, number of planned runs, later: resource estimation of necessary cars and GPS devices), and layout (fixed size of FAP) to better match the needs of the field crew. It helped, for example, to reduce the document by taking out general information, which remained unchanged over the course of the mission, such as the FAP legend, the user instructions, and well-known activity guidelines. Toward the end of the mission, the 3-days-in-advance planning provided a fully working concept, which is compatible with planetary (analog) missions that suffer a time delay between astronauts and the MSC. Further improvements are still desirable; a list of lessons learned is presented below. The most pressing demands for future missions in terms of the efficiency analysis concern the logging process and the logged information. Incomplete data from insufficiently logged activities result in gaps in our efficiency analysis. This issue is discussed in the following section.
7. Lack of Information
Log files served as a source to reconstruct, analyze, and learn from the proceedings of the mission. These were kept in the MSC as well as in the field and included all information that was considered relevant concerning the field activities.
Despite the amount of log file data we were able to extract from MARS2013, the information on start times and durations of experiments and activities, in some cases, was not continuously relayed or logged. Figure 9 shows the percentage of conducted experiments that lacked proper time-keeping of (a) planned activities and (b) not planned activities. We ascribe those activities the attribute of lack of information (LoI), meaning that it was noted that the activities had occurred, but no proper time stamps were given. A total of 352 activities were planned during the entire mission, of which 156 lacked either start and/or stop times or confirmation on cancellation. Interestingly, the first half of the mission, with the exception of February 6 and 11, stayed below the mean value of 44.3% for LoI on planned activities. In contrast to that, the second half showed days with very high LoI (nearly 90%), alternating with days with a more moderate amount of non-reported information. In general, the data show that the average LoI on unsuited experiments is 63.8%, whereas only 30.1% of the suited activities have no proper time stamps. We assume that we received a better logging for suited activities due to the increased attention and monitoring compared to unsuited activities. Additionally, 10.9% (55 extra activities, 6 LoI) of the unplanned activities—mostly extra activities or cases where the field crew used their autonomy to adjust the schedule—were not logged with correct start and end times.

Lack of information (LoI) on activities during MARS2013. (Color graphics available online at
This LoI on activity duration data therefore made it difficult to provide a solid mission analysis. Because the LoI for the unsuited experiments was beyond the threshold for a representative data analysis, we focused mainly on the suited activities. Here, we excluded the doffing times from the analysis, which at 49.2% comprised the major part of the 61 planned suited activities with LoI. Another substantial fraction of experiments with LoI came from the LTMS experiment, which comprised 18.0%. The remaining LoI consisted of check/repair activities, photo shoots, and donning and were accounted within the so-called “Else/Gaps” category of Figs. 5a, 5b, and 6.
8. Comparison to the Dachstein 2012 Mission
We used the science and efficiency analysis to compare the planning strategy of the MARS2013 mission with a previous mission by the OeWF, Dachstein 2012. The mission analysis for Dachstein 2012 is not directly equivalent to the analysis performed on MARS2013; differences in the analysis methods are pointed out where they occur. Here, we aim to provide a more standardized analysis method for future missions so that comparison will be made easier.
The following discussion of the Dachstein 2012 analysis is based on the results of Hettrich (2012). The two missions were compared with regard to their science goal analysis, EVA times, and experiment time in the following, based on the analysis methods introduced above in Section 5. Table 2 shows a summary of the analysis for both missions in comparison.
Dachstein 2012 results taken from Hettrich (2012).
denotes the virtual EVA time; the numbers in parentheses are the EVA durations if the donning excess (dne) is not included (see explanation in text).
8.1. Science goals in total
We calculated the ratio between executed and planned science goals. The analysis for Dachstein 2012 stated that 41.7% of the planned science goals were achieved. Here, the number of science goals set by the FP was equal to the number required by the PIs (Hettrich, 2012). The planned science goals for MARS2013 differed from the PIs' minimal requirements; we consider the number of science goals planned by the FP. Because several of the experiments during MARS2013 reached a value higher than 100%, two cases are considered. In the first case, it is assumed that each science goal contributes equally, resulting in a ratio of almost 85%. But because experiments that reach more than 100% of their planned science goals can in reality not make up for missing runs of other experiments, this evaluation needs to be rescaled. The corrected version does not allow for an experiment to have more than 100% accredited for this analysis, lowering the total science goal value by 10% to ca. 76%.
8.2. EVA times
Two space suit simulators, Aouda.X and Aouda.S, were used during MARS2013, while only Aouda.X was used for Dachstein 2012. For each suit, the ratio between executed and planned EVA time was calculated. The EVA time was defined as the time between the end of donning and the beginning of doffing. Almost 80% of the planned EVA times for both suits could be reached for MARS2013. The time use evaluation for Dachstein 2012 consisted of an activity “donning excess” (dne), which refers to the problems that appeared during or after donning (Hettrich, 2012). If we add this to the donning time, we reach only 73.9%, whereas if we add it to the EVA time, we are at 107% of the planned EVA times. Whether this dne time belonged to the EVA or was a problem during the donning process was not further specified in the Dachstein 2012 analysis and therefore limits a direct comparison with MARS2013, but this emphasizes the need for a standardized analysis method.
8.3. Experiment time
This evaluation shows how much of the EVA time was used for science activities. For MARS2013, the EVA times listed are “virtual times” rather than the actual EVA times. This is to account for experiments that were non-exclusive and were able to be conducted concurrently with another experiment. The overlap time therefore contributed twice. In this case, the virtual EVA time would be twice as long as the actual EVA time. Here, the virtual times were taken for the analysis of all non-exclusive experiments, while for Dachstein 2012 this has not been done—despite several non-exclusive experiments, for example, Antipodes (Hettrich, 2012). The values for the EVA durations at Dachstein are given with dne time as part of the EVA, the values in parentheses stating the durations without dne. For Dachstein 2012, an average fraction of 74.8% of the daily EVA was planned for experiments; for MARS2013 this number was 84.9%. The executed experiment time was 41.1% (59.5%) and 45.7% for Dachstein 2012 and MARS2013, respectively.
9. Conclusions
Overall, we saw an improvement of the achieved science objectives by applying the 3-days-in-advance planning strategy, compared to previous OeWF missions that were based on real-time planning. The fraction of executed versus planned science goals increased from 41.7% to 75.8% (value corrected for experiments with more than 100% achieved science goals). However, the experiment time per EVA did not improve, and it would be desirable to increase this value in future missions. Here, the analysis was partially hindered by LoI from incomplete logging. The 3-days-in-advance planning strategy not only increased science output but also decreased stress and workload of the FP. After the busy initial phase, all team members in the MSC and the field were accustomed to the new planning strategy and the requirements it brought (i.e., identifying potential problems and requesting changes in advance). We found experiences and documentation from previous missions helpful; we were able to implement several of the lessons learned, especially from Dachstein 2012. For example, planning extra time per experiment proved to be successful to achieve almost all the science goals requested by the PIs. As a result of the increased experience of the team and the setup of clearly defined inter-team work flow during the first mission week, the application of the 3-days-in-advance planning strategy became increasingly smoother throughout the mission. To monitor efficiency for MARS2013, as well as Dachstein 2012, we applied a mission analysis that evaluated achieved science goals, time use, and activity duration. This is a first step toward a standardized method for efficiency analysis during and after Mars analog missions that allows for comparison between the missions.
From the analysis of the MARS2013 planning strategy regarding achieved science goals and time use, we can summarize the following lessons learned:
• Preparation (bridgehead crew sets up on the field) and mission (starting with the first EVA) should be separated by an “acclimatization period” of 2–3 days. This time period can be used to set up and staff the MSC, which then receives first resource updates by the bridgehead crew and has enough time to develop the DAPs for the first mission days. The MSC must be fully functional with the start of the mission.
• Clear work flow and data flow need to be established within the MSC between the different teams—such as RSS, the Flight Control Team, the FP, and Media Communications—to avoid confusion during the critical mission phases. Especially in the beginning of MARS2013, the distribution of work between the different MSC positions was not entirely clear. This can be prevented by establishing a well-defined structure and setting up distinct procedures for the interactions prior to mission start, which would be tested during the acclimatization phase.
• We propose an improved records logging strategy based on clear definitions of standardized activities such as donning, doffing, EVA start/end, SIM start/end, experiment start/end. This would provide a better overview on information, for example, by applying a more practical structure of the records file, to decrease the amount of LoI.
• Activity analysis can improve efficiency—our data show that recurring activities (such as donning, frequent experiments) tend to decrease in duration. By using the logged times and durations of activities, the FP can do a quick analysis during the mission, to adjust allocated times for experiments.
• An early feedback from the bridgehead crew before the mission as well as from the field crew during the mission regarding location, resources, crew status, and planning provides a crucial input for the proper development of the DAPs. Additionally, it is of advantage for the FP to have a skill sheet of the abilities and experiences of the field crew regarding the scheduled activities, to be able to assign all tasks adequately.
• The importance of preparation cannot be stressed enough: PIs have to prepare their experiment procedures well ahead of the mission start to ensure that they can be checked for mission usability. As we saw during Dachstein 2012, procedures coming in late add many unknown variables to the planning of a mission and result in low numbers of achieved science goals. PIs need to ensure that changes to procedures during the mission are kept to a minimum. This demands increased preparation before mission start, such as optimizing procedures and knowing which data is necessary. Here, the integration of the field crew in the procedure development process is beneficial for achieving the science objectives.
• The science data quality could be evaluated by the PIs during the mission to identify faulty data and insufficient samples. The FP would use the feedback to adjust the activities, for example, reschedule experimental runs or change locations to optimize the total science outcome.
Although we proved the successful application of the 3-days-in-advance planning strategy to a mission of several weeks, including time delay, there is still room for future improvements. This includes the documentation, the MSC work flows, and the implementation of the above-named lessons learned into the planning strategy to raise the scientific efficiency and make a refined version of the 3-days-in-advance planning strategy a competitive candidate for future Mars missions.
Footnotes
Acknowledgments
We would like to thank the entire MARS2013 team, the PIs, and our international partners for their compliance, support and valuable inputs that made this work possible.
Author Disclosure Statement
No competing financial interests exist.
Abbreviations
DAP, Daily Activity Package.
dne, donning excess.
EVA, extravehicular activity.
FAP, Field Activity Plan.
FP, Flight Plan team.
LoI, lack of information.
MP, Mission Plan.
MSC, Mission Support Center.
OeWF, Austrian Space Forum (Oesterreichisches Weltraum Forum).
PI, principal investigator.
RSS, Remote Science Support.
TP, Traverse Plan.
TPR, time per run/sample.