




Abstract
A common goal for astrobiology is to detect organic materials that may indicate the presence of life. However, organic materials alone may not be representative of currently living systems. Thus, it would be valuable to have a method with which to determine the health of living materials. Here, we present progress toward this goal by reporting on the application of laser-induced breakdown spectroscopy (LIBS) to study characteristics of live and dead cells using Escherichia coli (E. coli) strain K12 cells as a model organism since its growth and death in the laboratory are well understood. Our goal is to determine whether LIBS, in its femto- and/or nanosecond forms, could ascertain the state of a living organism. E. coli strain K12 cells were grown, collected, and exposed to one of two types of inactivation treatments: autoclaving and sonication. Cells were also kept alive as a control. We found that LIBS yields key information that allows for the discrimination of live and dead E. coli bacteria based on ionic shifts reflective of cell membrane integrity. Key Words: E. coli—Trace elements—Live and dead cells—Laser-induced breakdown spectroscopy—Atomic force microscopy. Astrobiology 15, 144–153.
1. Introduction
T
Laser-induced breakdown spectroscopy (LIBS) has the capability to provide rapid spectrochemical analysis of various samples of any type in laboratory settings, in situ, and stand-off, as well as in hostile environments, including on the Mars Science Laboratory rover (Markushin et al., 2010; Wiens et al., 2012; Sivakumar et al., 2013, 2014; Melikechi et al., 2014). Recent results have shown the benefit of LIBS with nanosecond (ns) or femtosecond (fs) laser pulses to identify bacterial strains and specifically E. coli bacteria. Among others, Morel et al. (2003) proposed a cumulative intensity ratio as a quantitative criterion to differentiate among eight species of bacteria and pollens in pellet form. The authors report that time-resolved ns-LIBS is a promising candidate for a sensor of hazards either on surfaces or in ambient air. Other researchers employed fs-LIBS on microbiological samples to show that the concentration profile of trace elements, such as Na, Mg, P, K, Ca, and Fe found in different bacteria, allows unambiguous discrimination (Baudelet et al., 2006). Similarly, bacterial pathogen species and strains have been distinguished with ns-LIBS in a blind study (Dixon and Hahn, 2005; Multari et al., 2010). Solely utilizing chemometric analysis of the LIBS data, the authors were able to differentiate the bacterial pathogens E. coli, three clonal methicillin-resistant Staphylococcus aureus (MRSA) strains, and one unrelated MRSA strain. The use of LIBS is expanding and may be applied in numerous biological applications (Cremers and Radziemski, 2013).
The extensive use of E. coli bacteria in LIBS and other detection techniques is due to the fact that E. coli is a genetically well-characterized bacterium (Blattner et al., 1997). Its outer membrane contains divalent cations such as Mg2+ and Ca2+ (Singleton, 2004) that may be probed by LIBS. These features make E. coli an excellent indicator organism to test environmental samples but also a suitable microorganism model to simulate basic states of alive and dead, as it relates to life on Earth.
In this study, we sought to investigate whether LIBS can differentiate between live and dead E. coli strain K12 cells, as well as cells subjected to two types of inactivation treatments: autoclaving and sonication. To achieve this, harvested samples were deposited and air-dried overnight on plexiglass sample holders and analyzed with fs laser pulses. The LIBS spectra obtained reveal that the diverse emissions from specific inorganic components and phosphate components play a key role in determining the life state of an organism and can be used for identification and distinction of live and dead bacteria. In addition, we compared the results obtained with ns-LIBS to those obtained with fs-LIBS. We concluded that sensing the health of a cell by LIBS is feasible on E. coli strain K12 cells.
2. Materials and Methods
2.1. Cultivation of E. coli and sample preparation
Laboratory cultures were grown from stocks of competent cells (Invitrogen, Inc., Carlsbad, CA). Cultures were streaked on Luria broth (LB) plates and grown overnight at 37°C. Single colonies were picked and inoculated into 200 mL LB media and grown overnight with shaking at 37°C. The media was divided into 50 mL sterile tubes and centrifuged at 10,000g for 20 min to pellet cells. The supernatant was removed, and the cell pellet was resuspended in 15 mL of sterile 1× phosphate-buffered saline (PBS). Cells were centrifuged again as described, and the supernatant was discarded. This time the cell pellet was resuspended in 3 mL of sterile 1× PBS and divided into 1 mL portions. One portion stayed on ice. A second portion was subjected to sonication on ice with a Vibracell microtip sonicator (Sonics and Materials, Inc., Danbury, CT) at 60% amplitude for 1 min with 4 s pulses. A third portion was placed into a glass beaker and autoclaved at 122°C, 15 psi for 20 min. All samples were centrifuged at 10,000g post treatment, and supernatant was removed. The cell pellet was resuspended in 1 mL sterile 1× PBS. Dilutions of these preparations were made in additional PBS and plated onto LB plates and grown overnight at 37°C. Additional treatments were attempted with resuspension in sterile distilled water in place of PBS to determine whether the buffer was having an effect. A total of 60 μL of each treated sample was loaded into a plexiglass sample holder, then air-dried overnight at room temperature, and finally interrogated with fs laser pulses.
2.2. LIBS experimental setup and procedure
A schematic overview of sample preparation procedure and a typical automated LIBS experimental setup is shown in Fig. 1. A detailed description of the LIBS experimental setup used for this work can be found in previous publications (Sivakumar et al., 2013, 2014). A CPA-Series Ti-sapphire 150 fs ultrashort laser (Clark-MXR, Model 2210) operating at 775 nm with pulse energy 1.4 mJ per pulse was focused on the sample surface to generate a laser-induced microplasma by using a fused silica biconvex lens of 50 mm. The focused laser spot diameter at the sample's surface was about 100 μm, which is much greater than the size of the microorganism (typically 0.5–5 μm in length). A motorized stage with x-y translation was used, which automatically translates to a fresh sample location for each laser shot. To reduce the effect from the surrounding atmosphere, measurements were performed in a chamber kept at a constant pressure of helium. Optical emission from the plasma was collected by a fiber collimation lens at 45° with respect to the laser beam and focused onto an optical fiber. The other end of the fiber was coupled into an Echelle spectrograph (Andor Technology, ME 5000). Dispersed light from the spectrograph was recorded with a thermoelectrically cooled iStar intensified charge-coupled device (ICCD) camera (Andor Technology, DH734-18F O3). Emission from the plasma was collected 50 ns after the laser pulse with an integration time of 700 μs by an onboard digital delay generator of the spectrograph.

Schematic overview of sample preparation procedure and LIBS experimental setup for the detection and classification of live and dead Escherichia coli.
To better understand the LIBS emission lines from E. coli samples, we compared the spectra measured with femtosecond to those obtained with nanosecond laser pulses. Nanosecond laser ablation was achieved with the Q-switched Nd:YAG (B.M. Industries Thomson-CSF Series 5000) operating at the fundamental wavelength of 1064 nm, with a pulse duration of 10 ns and pulse energy of 20 mJ. The rest of the experimental setup, including the introduction of He gas to the chamber, was essentially the same as the fs-LIBS one.
2.3. Data processing and multivariate analysis
To improve precision and reproducibility and reduce the statistical errors of the LIBS measurements, spectra from 25 consecutive laser shots were averaged. In addition, several batches of samples were prepared, including that of blanks to determine the level of background interference. The intensities of emission lines were estimated with the following procedure. First, the relative spectral intensity response of the detection system (grating spectrograph and detector) was corrected with the combined source data from a deuterium lamp and a quartz tungsten halogen reference lamp (Model DH-2000-CAL, Ocean Optics, Inc). Second, the continuum background was estimated by fitting to a second or higher order polynomial in the wavelength range of interest for individual spectral line. Third, the fitted background curve was subtracted from the original spectra. Finally, the intensity of the emission line was determined by curve fitting of the spectral emission lines with Gaussian or Lorentzian functions. The background and emission line fittings were accomplished with a Wolfram Mathematica-based semi-automated custom-written software. Furthermore, for a given emission line, the intensity obtained after the fitting procedure was normalized to the maximum intensity of the same emission line from the total batch of samples.
Clustering of the averaged spectra (of 25 single laser shot spectra measured on each sample) was achieved by principal component analysis (PCA) (Unscrambler X, CAMO Software, Inc.). PCA is a dimensionality reduction technique that can be used to extract important information from the data, represent it as a set of new orthogonal variables called principal components, and facilitate qualitative visualization of patterns (Abdi and Williams, 2010; Vance et al., 2010). To avoid contributions from the excitation laser at 775 nm, we considered only the spectral range from 220 to 700 nm. We then evaluated the quality of the PCA by the segmented cross-validation technique, in which segmentation was performed randomly. The uncertainties of the analysis were estimated by applying the Marten's uncertainty test in terms of variable selection and stability. Finally, we used Soft Independent Modeling of Class Analogy (SIMCA) (Unscrambler X, CAMO Software, Inc.), a classification technique based on adding new samples to one of the established classes of samples (Esbensen et al., 2002). In SIMCA analysis, first a PCA is performed on each class of data set and then used to represent each class of data set. As the first three principal components account for about 85% of the variations, these were the only ones retained for the SIMCA analysis for each of the three training classes of samples: live, sonicated, and autoclaved cells. New samples were projected onto each class and assigned to the closest training class with a 25% significance level (Esbensen et al., 2002). For this analysis, 90% of the entire spectral data were used as a training set, and the remaining 10% were used as partitioned test sets. Although not attempted for this work, it is worth noting that others have reported that using a set of ratios of selected spectral lines rather than the whole LIBS spectrum (or possibly, as is the case for this work, a large part of the whole spectrum) could lead to better and statistically meaningful discrimination (Gottfried, 2011).
3. Results
Each treatment was plated to recover live cells that remained post-treatment to be sure that we were manipulating cell membranes and killing the cells as anticipated. Growth was determined by overnight colony development on LB solid growth media at 37°C. These test results reveal that the untreated samples were alive (counted colonies were held as 100% live), the sonicated cells were in intermediate stages of live and dead cells (counted colonies were between 40% and 60% as abundant as live samples, depending on day of preparation), and the autoclaved cells were in various stages of being killed (counted colonies were 0–20% of live samples). Furthermore, atomic force microscopy (AFM) images of cells offered an estimation of the impact of these treatments on the live cell population in the sample. AFM images of the bacteria after no treatment, sonication, or autoclave treatment confirm the results of the live/dead tests and reveal that the live cell population produced smooth colony-type structures, whereas sonicated cells were more dispersed and autoclaved cells conglomerated (Fig. 2).

(Left to right) AFM images of the bacteria after no treatment (
In Fig. 3, we show the fs- and ns-LIBS emission spectra of E. coli cells with various treatments (live, sonicated, and autoclaved); cells were resuspended in distilled water after each treatment. The spectral peaks associated primarily with elemental composition of the samples such as Ca, Na, Mg, K, O, H, C, and P were detected. These essential salts are required for regulatory roles of the cell functions and form important ion pools that are managed by the cellular membrane. Although the elements S, Cd, Ni, and Co have been identified in the microorganisms (Helbig et al., 2008; Kaiser et al., 2012), they are not detected in this work for reasons that are unclear at present. However, we did detect species associated with the organic molecules such as rovibrational emission lines of C2 and CN, which were previously observed by other researchers (Ma and Dagdigian, 2011; Fernández-Bravo et al., 2013). In Fig. 4, we show the relative intensity of the fs-LIBS atomic and molecular band emission lines from distilled water–washed E. coli cells with various treatments, where the intensity of each emission line was normalized to the maximum of intensity. The error bars represent the standard deviation from 23 batches of samples.

LIBS emission spectrum of Escherichia coli after various treatments and resuspended in distilled water. The spectrum was averaged over 25 laser shots at the surface of sample. Emission from the plasma was collected 50 ns after the laser pulse with an integration time of 700 μs in helium as background gas. (
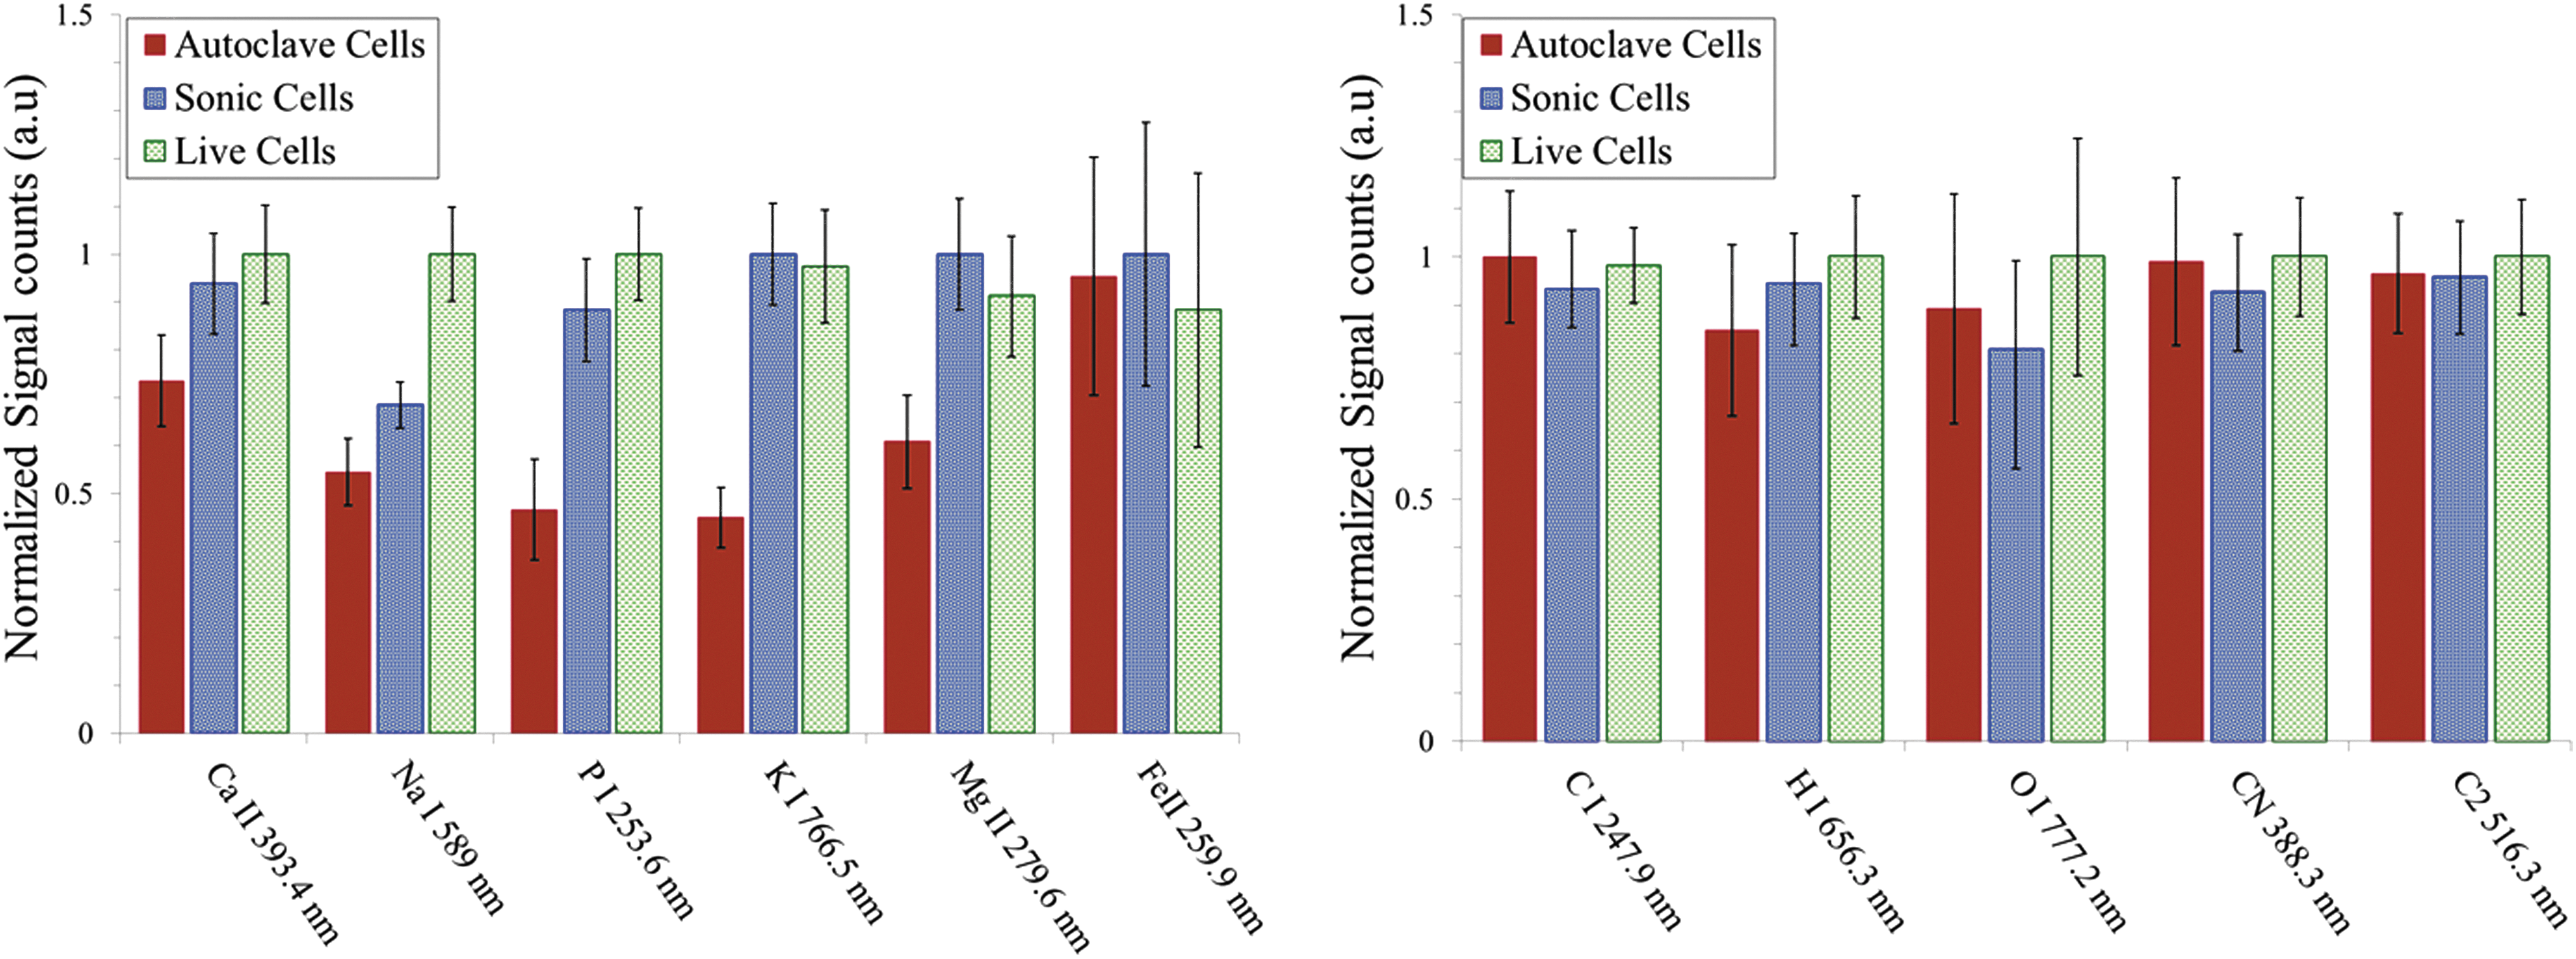
Escherichia coli after treatments—live, sonicated, and autoclaved, washed and resuspended in distilled water—were analyzed with fs-LIBS. Relative intensity of atomic and molecular band emission lines for E. coli with various treatments. The error bars represent the standard deviation from 23 batches of samples. The intensity obtained for each element is normalized to the maximum of intensity.
The measured LIBS spectra from the bacterial samples show a statistically significant difference in elemental composition with the ratio of live to dead cell populations. The results indicate that, for Ca, Na, and P, the live (no treatment), sonicated, and autoclaved treatments yielded the strongest, the intermediate, and the weakest peak emissions, respectively. This can be attributed to the loss of the inner cell material due to the treatment. In addition, trace elements Mg and K emission lines are stronger for live samples and for the sonicated samples than they are for the autoclaved samples. However, the spectral emission lines of Fe as well as species associated with organic molecules such as C, O, N, and CN and C2 molecular bands display similar spectral features for each of the three types of cells.
To further investigate the distinguishability of the different types of samples (live, sonicated, and autoclaved), we performed a SIMCA analysis on the fs-LIBS data. First, we calculated a score plot of the three principal components (shown in Fig. 5a). This result reveals three distinct clusters that consist of the same type of samples. In Fig. 5b, we show the variance as a function of the number of principal components (PCs). This demonstrates that the first three principal components account for about 90% of the variance. Line plots of X-loadings for the first three principal components as a function of the wavelength are shown in Fig. 5c. This shows that the variables with larger positive or negative loading, such as Na, Ca, P, and Mg, contribute to the first three selected principal components (PC-1, PC-2, and PC-3). In Fig. 5d, we show the orthogonal distances (or the Coomans plot) from all new samples (Test Autoclave TA-1 and TA-2, Test Sonicated TS-1 and TS-2, and Test Live TL-1 and TL-2) to two selected samples (Live and Autoclaved). Clearly, the new test samples belong to an already existing group of similar samples.
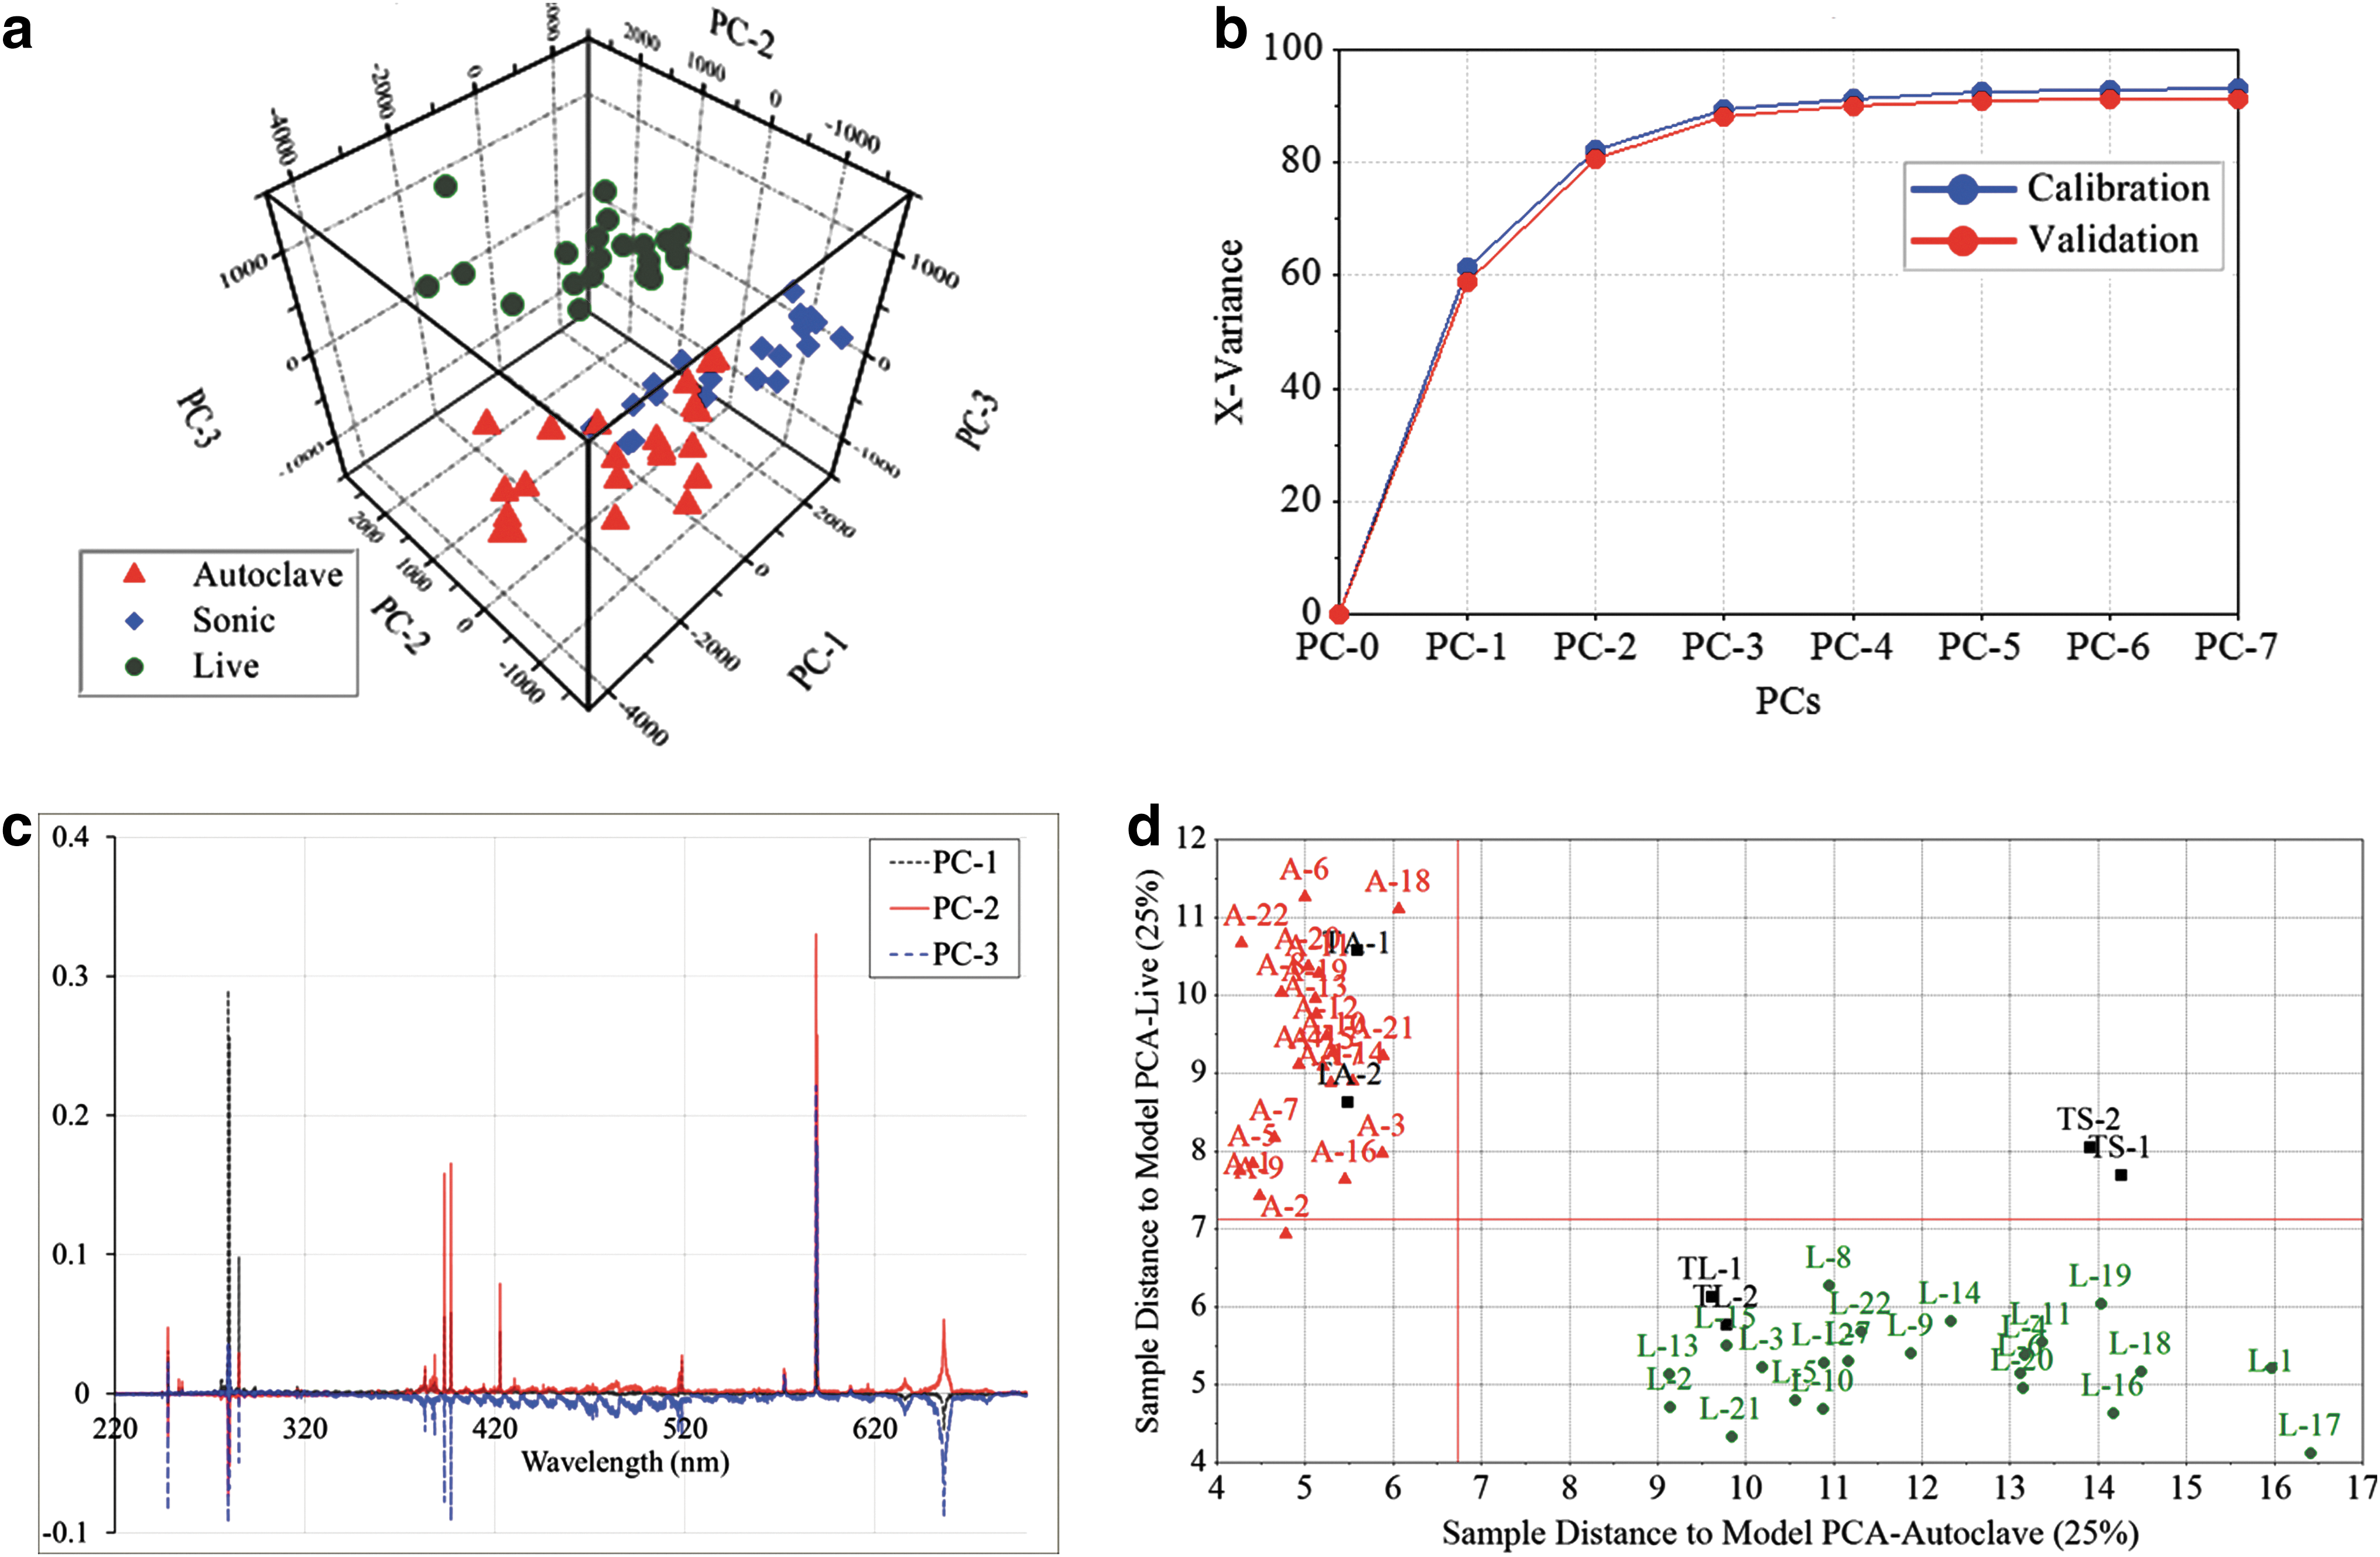
Multivariate analysis of E. coli with various treatments, where red triangles are autoclaved cells, blue diamonds are sonicated cells, and green dots are live cells. Here, the samples were washed and resuspended in distilled water and analyzed with fs-LIBS. (
We also investigated the ability of LIBS to distinguish between live, sonicated, and autoclaved E. coli cells prepared in PBS. In Fig. 6, we show the fs-LIBS relative intensity of atomic and molecular band emission spectra for the different treatments of bacteria with PBS, where the intensity of each emission line is normalized to the maximum of intensity. PBS is a water-based solution that contains sodium chloride, sodium phosphate, potassium chloride, and potassium phosphate. PBS buffer, while likely to keep cells alive with a proper ionic balance, was expected to give misleading results for LIBS due to the potential for natural interference with Na and P concentrations. However, the results show a statistically significant difference in the intensities of the emission lines of trace elements such as Mg, Ca, and K (but not P and Na) with the ratio of live to dead cells. In addition, we performed SIMCA analysis of the spectra. The results of this analysis show a reliable discrimination between live cells and autoclaved cells (dead bacteria), but sonicated samples do not show much separation (see Fig. 7a). The variance plot and line plots of X-loadings as a function of wavelength are shown in Fig. 7b and 7c. SIMCA classification also shows that the new test samples of autoclaved and live cells belong to an already existing group of similar samples. However, this is not the case for the sonicated samples (Fig. 7d).
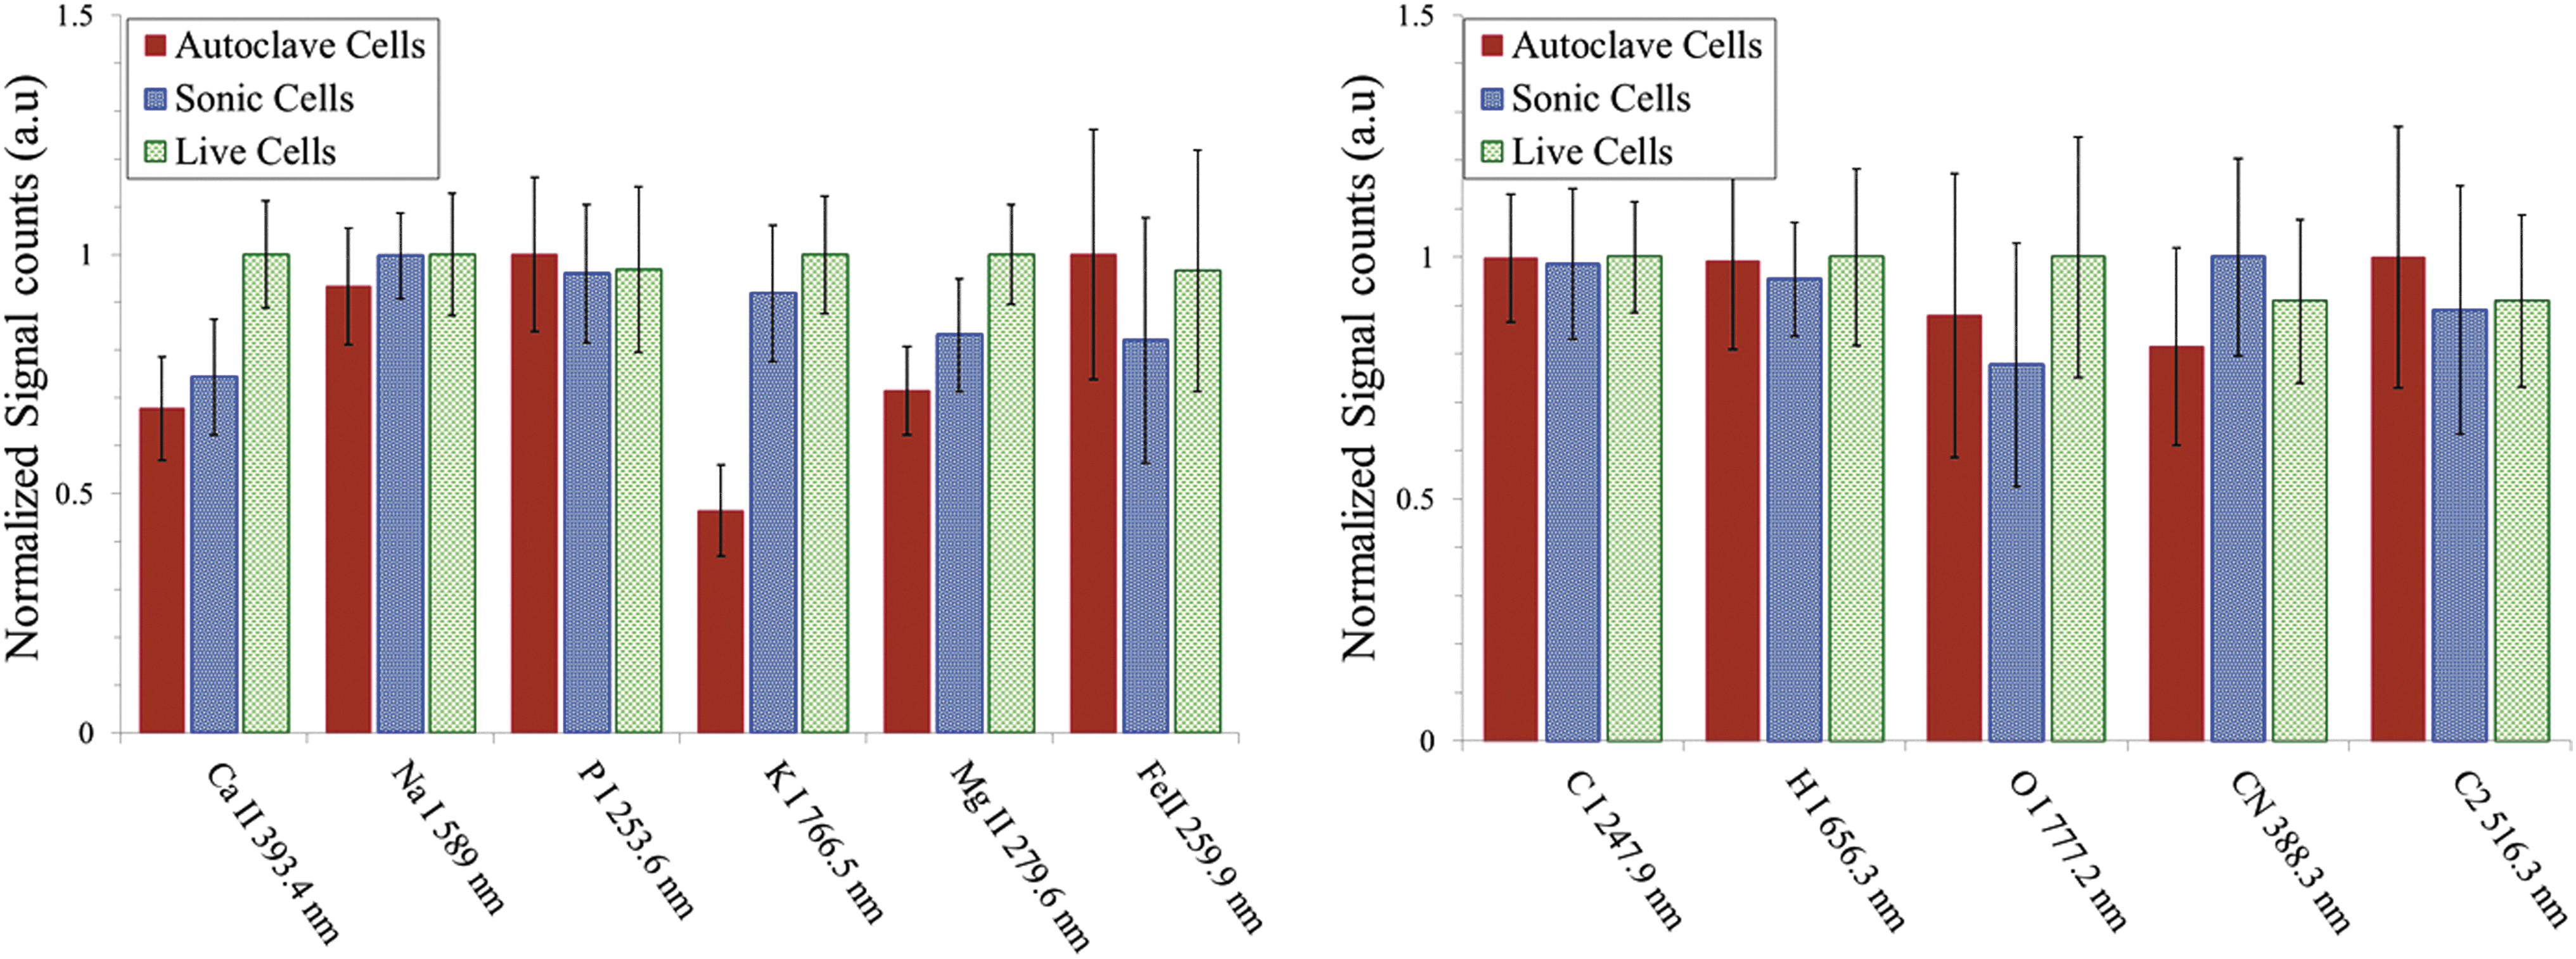
Escherichia coli after treatments—live, sonicated, and autoclaved, washed and resuspended in PBS buffer—were analyzed with fs-LIBS. Relative intensity of atomic and molecular band emission for E. coli with various treatments. The error bars represent the standard deviation from 25 batches of samples. The intensity obtained for each element is normalized to the maximum of intensity.

Multivariate analysis of E. coli with various treatments, where red triangles are autoclaved cells, blue diamonds are sonicated cells, and green dots are live cells. Here, the samples were washed and resuspended in PBS buffer and analyzed with fs-LIBS. (
Finally, we show the relative intensities of atomic and molecular band emissions for E. coli with various treatments prepared in distilled water (Fig. 8) and PBS (Fig. 9) measured with ns-LIBS. Due to splashing, the error bars are larger than those obtained with fs-LIBS, and as a result the distinction between the three types of samples is less obvious.
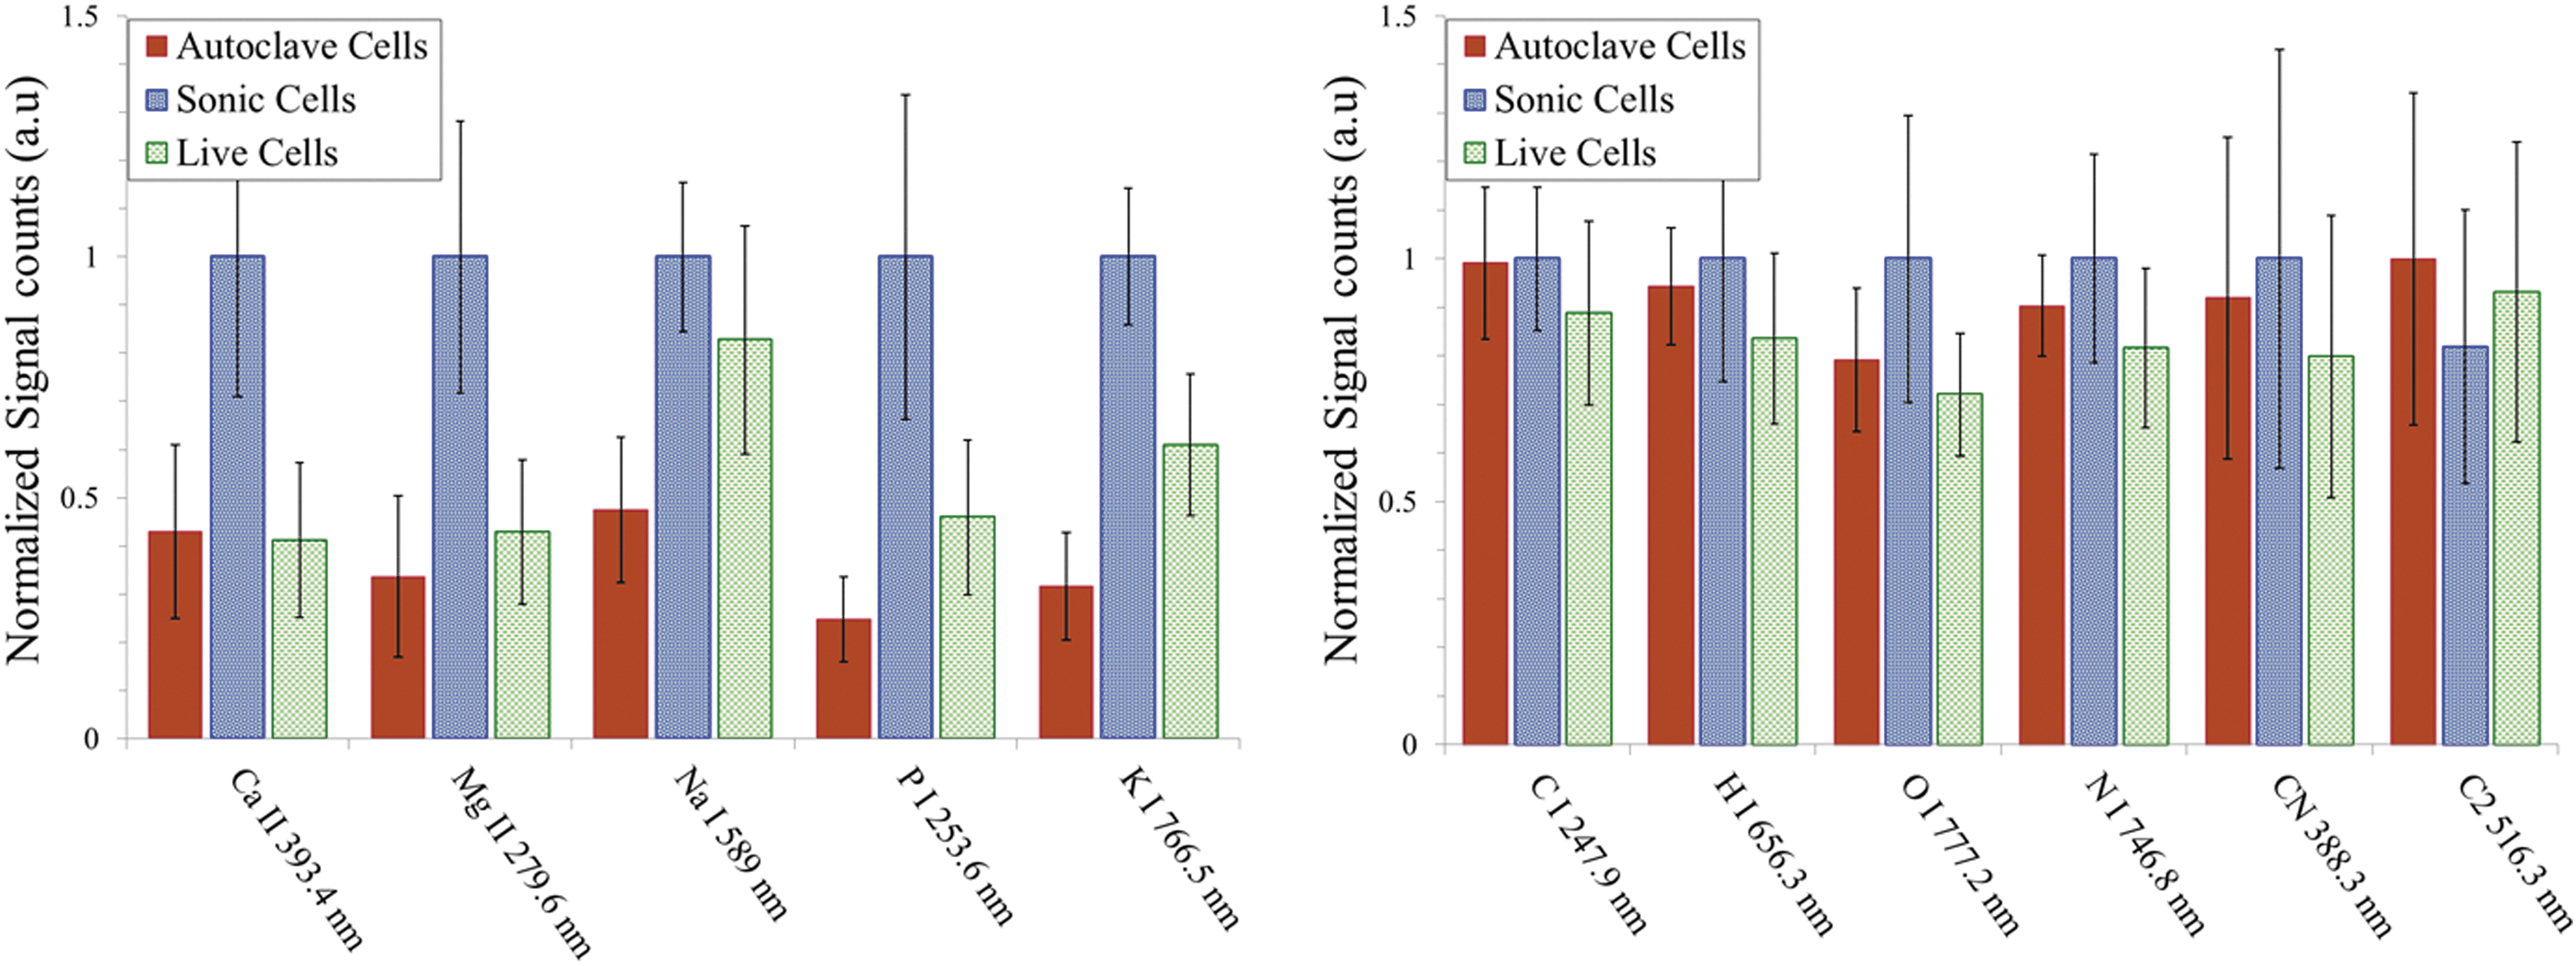
Escherichia coli after treatments—live, sonicated, and autoclaved, washed and resuspended in distilled water—were analyzed with ns-LIBS. Relative intensities of atomic and molecular band emissions for E. coli with various treatments are plotted. The error bars represent the standard deviation from 14 batches of samples. The intensity obtained for each element is normalized to the maximum intensity.
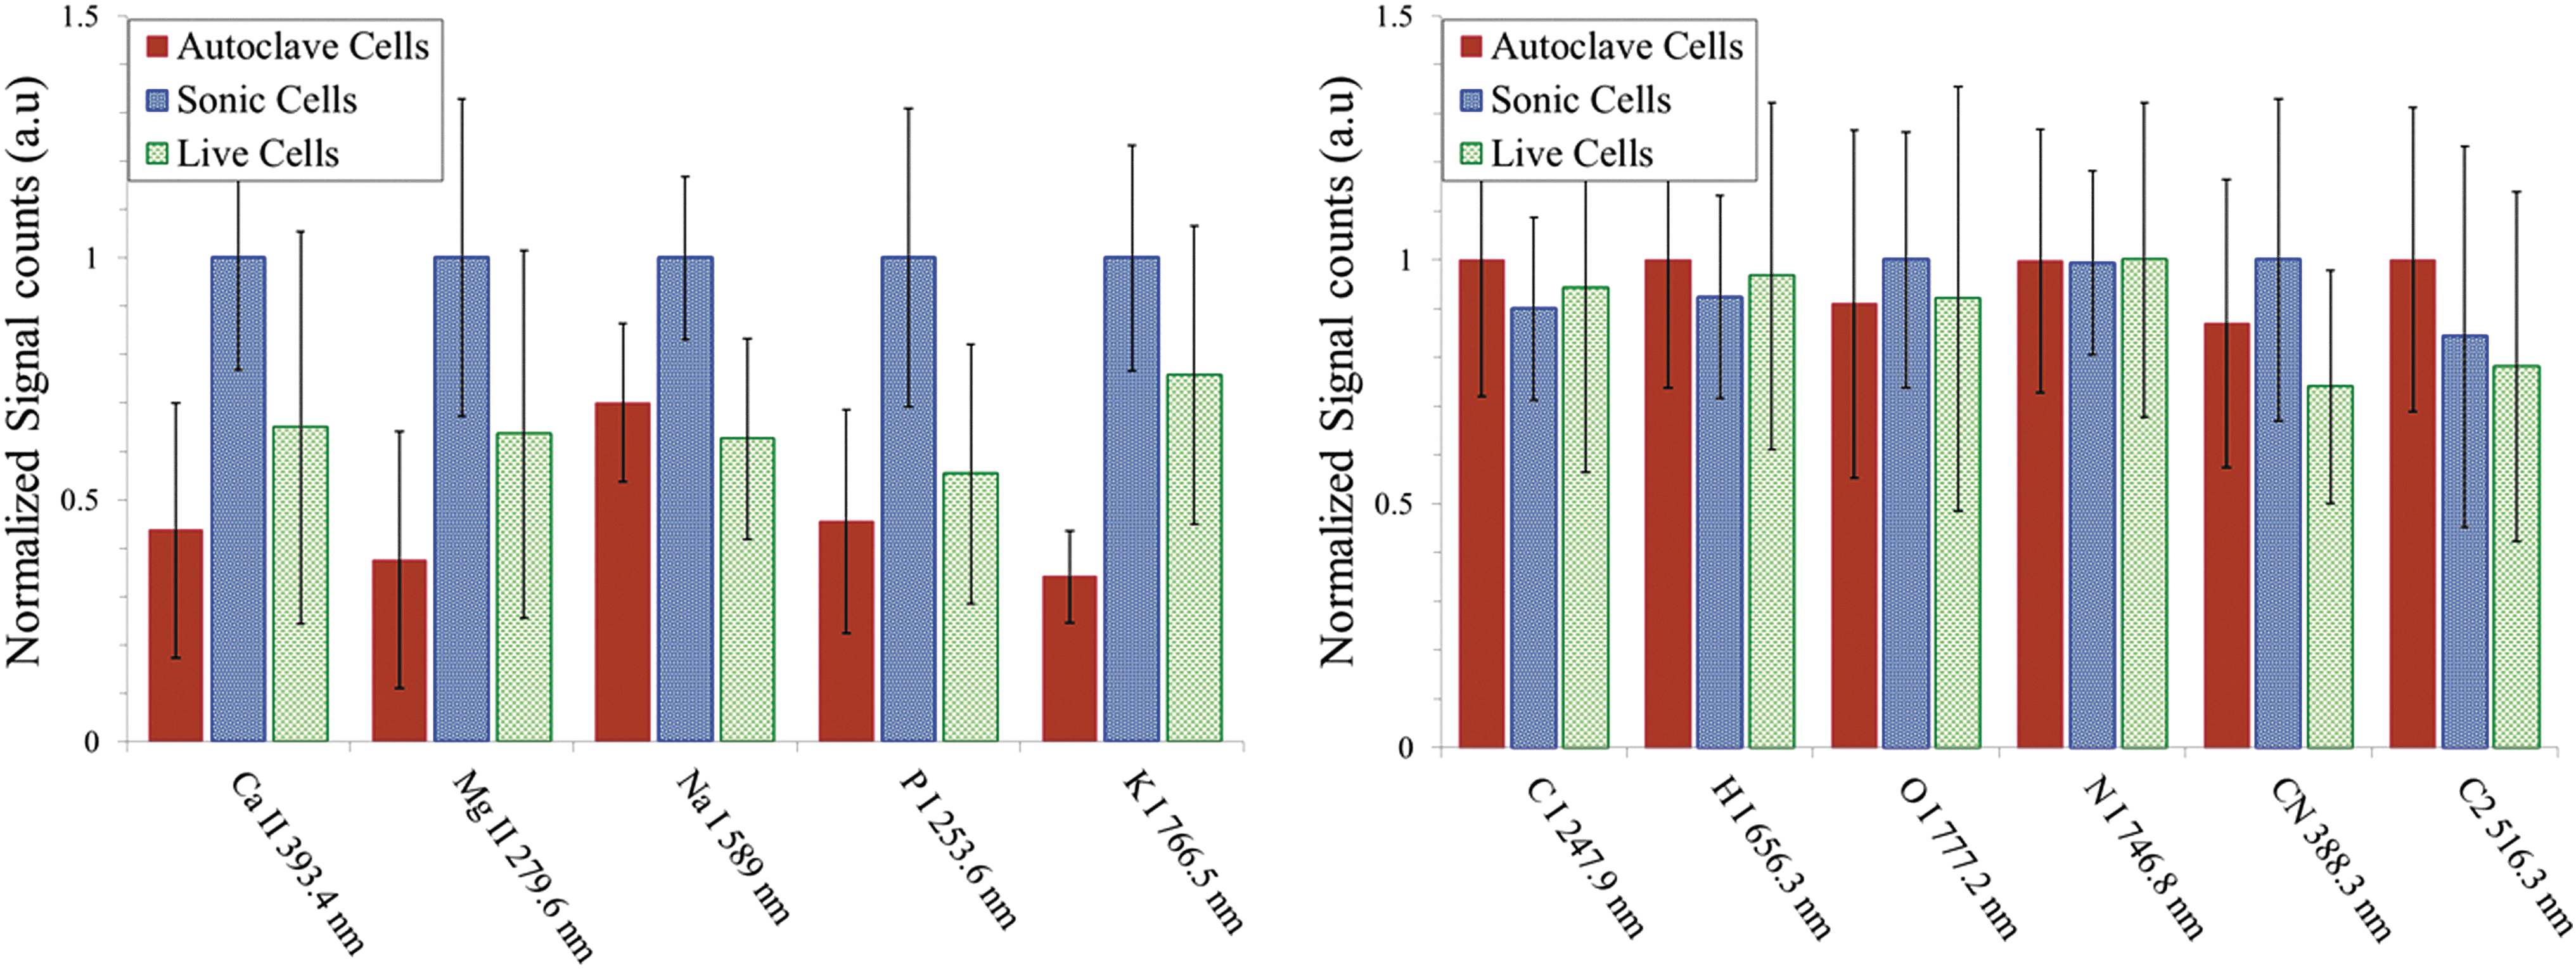
Escherichia coli after treatments—live, sonicated, and autoclaved, washed and resuspended in PBS buffer—were analyzed with ns-LIBS. Relative intensities of atomic and molecular band emissions for E. coli with various treatments are plotted. The error bars represent the standard deviation from 14 batches of samples. The intensity obtained for each element is normalized to the maximum intensity.
4. Discussion
The fs-LIBS spectra of distilled water–washed E. coli with various treatments indicate that the amount of P contained in the samples is very sensitive to cellular activity (Fig. 4). The LIBS intensities of P in the bacteria are much weaker at the vegetative state or dead state than those of live cells. The diverse emissions from the phosphate component and from the inorganic elements such as Ca, Na, Mg, and K are potentially usable to distinguish the live and dead bacteria (see Fig. 4). Our hypothesis for the change of LIBS spectra with the state of population of cells (live or dead) is that the treatments would disrupt the cellular membranes in different ways, and this could be seen by elemental composition changes. The live cells have intact membranes, and the intracellular contents are held intact and, as such, are able to maintain ion gradients and nutrients. However, the cells with compromised membranes or dead cells that become permeable allow the ions and nutrients to leak into the supernatant; they are then washed out with buffers such as water through the process of washing immediately after centrifugation. In fact, our hypothesis is supported by the work of Feliu et al. (1998) and that of Russell and Harries (1968), which demonstrated that lysis of E. coli by moist heat (autoclave) or sonication results in the release of pentoses (monosaccharides). Although no independent chemical analysis was performed for a better understanding of chemical changes in the bacterial cells with different types of treatment, the previous studies strongly support the above findings. Thus, the information on ratios of ions and life-important elements can be used to identify whether the bacteria are dead or alive and the method of treatments. Elemental composition changes in P, C, Mg, Ca, and Na were previously used to discriminate between species of bacteria, so in an environmental setting our approach would be best applied to a sample where it is observed while being challenged by sonication or heat in order for the elemental abundances to reflect a change in life state of the cells and not the species composition (Rehse et al., 2010).
Nanosecond laser ablation causes splashing of the bacterial cells, which complicates tremendously the analysis (see Figs. 8–9) (Harilal et al., 2014). As the treatments kill bacteria, the dead cells open the plasma membrane and release intracellular components to the media. These released intracellular components in the buffer lead to a viscous form of samples and more stickiness between the sample and the sample holder for the autoclaved and sonicated treated cells than live cells. Living cells instead present a higher splashing compared to that of sonicated or autoclaved bacteria. This complicated greatly the analysis for all three treatments, as the experimental conditions were not well controlled.
A spectral analysis of the treated E. coli with different washing media (distilled water or PBS buffer) for fs- and ns-LIBS resulted in the observation of several emission lines, such as those of Na, K, Ca, Mg, and P. Some of the lines occur only with fs-LIBS, such as Fe, while others, such as N, are seen only with ns-LIBS. As somewhat expected, Cl is seen only in the measurements performed in a PBS solution. These results suggest that, despite the influence of washing buffer composition and laser pulse duration in LIBS spectra, there is a significant correlation between the intensity distribution of specific emission lines and population of live cells in the sample. The diverse emissions from inorganic components and phosphate are closely related to the population of live cells and may be used for fast identification of live and dead bacteria with LIBS. This implies that the intensity distribution of LIBS spectra can play a key role and may be used as a fingerprinting of detection of live and dead bacterial cells.
5. Conclusions
We have shown that it is possible to use fs-LIBS to monitor the cellular health of a model bacterial organism. Notable differences between sonicating and autoclaving treatments to kill or injure bacteria are observed as dissimilar spectroscopic features based on emission intensities of key elements, Mg, P, K, Na, and Ca, which are useful for the discrimination of living/dead bacteria. We suggest that these elemental composition differences are caused by the fact that the intracellular components that can be maintained by intact cellular membranes are sensitive to live, sonicated, and autoclaved treatments. Cells with compromised membranes and/or dead cells “leak” and eventually experience changes in their elemental compositions that can be accessed by LIBS. Finally, the nanosecond laser excitation work shows that, despite the presence of splashing due to a lower stiffness to the surface, the sonicated and autoclaved bacteria are distinguishable from live bacteria.
Footnotes
Acknowledgments
This research was supported by grants from NSF CREST (0630388) and NASA (NX09AU90A) and by funds from the University of Delaware College of Earth, Ocean, and Environment. We thank Dr. Amir Wafa, Optical Science Center for Applied Research at Delaware State University, for providing atomic force microscopy images of the E. coli.