
Abstract
We present a photostability study of two nucleobases, guanine and uracil. For the first time, the photoabsorption cross-section spectra of these molecules in the solid phase were measured in the VUV and mid-UV domain (115≤λ≤300 nm). They show a quite similar absorption level throughout this wavelength range, highlighting the importance of considering the whole VUV and UV domain during photolysis experiments in the laboratory. Their photolysis constant (J) can be estimated from those measurements as follows: 2.2×10⁻² s−1±11% for guanine and 5.3×10⁻² s−1±14% for uracil. This work shows that (i) measuring kinetic constants from a direct and “traditional” photolysis of a thin sample in the laboratory suffers strong limitations and (ii) achieving this measurement requires comprehensive modeling of the radiative transfer that occurs in any sample not optically thin (i.e.,≤2 nm). Moreover, this work has provided other data of interest: the refractive index of solid guanine and of uracil at 650 nm are 1.52 (±0.01) and 1.39 (±0.02), respectively, and the integrated IR band strengths (A) of solid guanine between 3700 and 2120 cm−1 (3.4×10⁻¹⁶ cm·molecule−1±13%) and of solid uracil between 3400 and 1890 cm−1 (2.1×10⁻¹⁶ cm·molecule−1±21%). Key words: Nucleobases—Photochemistry—VUV spectrometry—Absorption cross sections—Astrobiology. Astrobiology 15, 268–282.
1. Introduction
G
In the 1960s, works conducted by Oro and Kimball showed that polymerization of concentrated HCN solutions heated at 80–90°C can lead to adenine (C5H5N5) synthesis in yields up to 0.5% (Oro, 1960; Oro and Kimball, 1961, 1962). Since then, the abiotic synthesis of purines and pyrimidines from the polymerization of HCN under various conditions has been achieved in different environmental conditions. As an example, Yuasa et al. (1984) suggested guanine formation by reacting methane, ethane, and ammonia in electrical discharges. The identification was only tentative, since the production yield was 1.7 ppm. Levy et al. (1999) produced guanine in a “one-pot” synthesis from the polymerization of 0.1 M of ammonium cyanide (NH4CN) at yields of 35 ppm. Such high concentrations of precursors are obtainable only by freezing; thus this guanine prebiotic synthesis would be effective only in frozen regions of primitive Earth. Senanayake and Idriss (2006) obtained guanine from formamide (CH3NO) under UV-irradiation conditions in the presence of TiO2, the most active photocatalytic semiconductor found in nature (no yields were reported). Mechanisms have also been proposed for the prebiotic synthesis of pyrimidines: in 1961, uracil was obtained by heating an anhydrous mixture of malic acid, urea, and phosphoric acid in a range of temperatures from 100°C to 140°C. Only yields at 130°C were reported, and they were very low: from 40 to 1400 ppm. Later, the most effective route known to date was proposed, which is that cytosine pyrimidine (C4H5N3O) can be produced in yields of 30–50% from the reaction at 100°C of cyanoacetaldehyde (C3H3NO) (formed by hydrolysis of cyanoacetylene) with urea (Robertson and Miller, 1995). Thus, uracil can be formed by cytosine hydrolysis.
But the relevance of pyrimidine synthesis from reactants such as urea and cyanoacetaldehyde has been a topic of discussion for some time. Indeed, these compounds are very chemically active and may be decomposed by hydrolysis or react easily with other compounds present in the environment such as amino acids. Their chemical vulnerability runs counter to the establishment of a sufficient concentration to react one onto another and thereby form cytosine and then uracil (Shapiro, 1999, 2002).
Regardless of the production efficiency of these nucleobases on early Earth, their abundance was increased by extraterrestrial import. In fact, carbonaceous meteorites, micrometeorites, and comets could have been a major source of organic matter on prebiotic Earth.
Stoks and Schwartz (1981) analyzed samples of the Murchison, Murray, and Orgueil meteorites with a combination of analytical techniques (gas chromatography, high-performance liquid chromatography, and mass spectrometry); guanine was detected in all these meteorites in concentrations ranging from 143 to 234 ppb. Guanine has also been found in the Yamato meteorites of the Antarctic (Y-74662 and Y-791198) at concentrations of 230 and 430 ppb by using HPLC with UV spectroscopy (Shimoyama, 1990). Recently, formic acid extracts of six carbonaceous chondrites were analyzed by liquid chromatography–high resolution mass spectrometry; guanine was detected at concentration levels ranging from 25 to 250 ppb (Callahan et al., 2011). In addition to this identification, this group concluded the following about its extraterrestrial origin: three additional nucleobases' analogues absent in terrestrial biology (purine, 2,6-diaminopurine, and 6,8-diaminopurine) were also identified in the samples and not in the procedural blanks. This strongly supports the extraterrestrial origin of nucleobases even if it is not excluded that samples could potentially contain traces of terrestrial contamination. Regarding uracil, it is the only pyrimidine of biological importance (out of uracil, thymine, and cytosine) that has been identified in meteorites. This molecule was found in water and formic extracts of Orgueil, Murchison, and Murray chondrites in concentrations of 46, 30, and 19 ppb, respectively, by using specific fractionation techniques and ion exclusion chromatography with UV spectroscopy (Stoks and Schwartz, 1979). Furthermore, Martins et al. (2008) reanalyzed a Murchison meteorite sample and reported compound-specific carbon isotope values for uracil of δ13C=+44.5‰. To assess terrestrial contamination, a soil sample collected in 1999 in the proximity of the meteorite's 1969 fall site was also analyzed; uracil extracted from this soil had a δ13C value of −10.6‰ (±1.8‰), which matches the expected terrestrial molecule ratio (Sephton and Botta, 2005). This carbon isotope ratio is clearly distinct from that of a Murchison sample and thus strongly suggests the extraterrestrial origin of uracil detected in the meteorite.
Micrometeorites are extraterrestrial particles with sizes ranging from 20 μm up to a few 100 μm that survive atmospheric entry. They are the present-day dominant source of extraterrestrial material accreted by Earth (Love and Brownlee, 1993). Bland et al. (1996) estimated the current meteorite flux as≈10 tons/year, whereas dust flux has been estimated as 40,000±20,000 tons/year (Love and Brownlee, 1993). The average organic content of micrometeorites is around 2 wt % (Engrand and Maurette, 1998; Matrajt et al., 2003). Among them, particles containing large amounts of carbonaceous matter have been identified: ultracarbonaceous Antarctic micrometeorites, which contain up to 50% of organic matter and high nitrogen content (Dartois et al., 2013; Dobricǎ et al., 2009). These particular classes of micrometeorites are believed to be of cometary origin and thus seem to be cometary grains (Dobricǎ et al., 2009, 2012).
In 1986, an international fleet of spacecraft (Giotto, Vega 1, Vega 2, Suisei, Sakigake, and ICE) encountered comet 1/P Halley. In situ measurements of cometary grains by mass spectrometers showed that they contained a large amount of organic material in solid phase (Kissel et al., 1986a, 1986b; Huebner et al., 1989; Fomenkova et al., 1994). It has been proposed that, among that organic material, purines and pyrimidines were present in the fragments analyzed by Giotto and Vega mass spectrometers (Kissel and Krueger, 1987). However, their presence is highly speculative because of the limited mass resolution of instrument analysis. Cometary samples returned to Earth by NASA's Stardust spacecraft showed several amines and amino acids but so far no nitrogen bases (Sandford, 2006; Elsila et al., 2009). Rosetta, an ESA mission launched in March 2004, will perform the most exhaustive study of a comet ever attempted (comet 67P/Churyumov–Gerasimenko) in 2014 and 2015. One of the orbiter instruments is notably fitted with a high-resolution mass spectrometer: the COmetary Secondary Ion Mass Analyzer (COSIMA). The spectrometer has a mass resolution m/Δm at 50% (FWHM) of 2000 at mass 100 amu that is 20 times higher than the one used during the Vega missions. It will collect and analyze cometary grains and may then provide further information on their chemical composition (Lawler et al., 1989; Kissel et al., 2007). It has been established that COSIMA should have the capability to analyze nucleobases. In the frame of these measurements, it is necessary to understand dust chemical evolution between its ejection from the nucleus and its analysis by the COSIMA instrument. Such studies will be useful for the interpretation of spectra measured and thus to the understanding of the cometary chemical composition. In a larger context, it would help to understand how comets and cometary grains could have played a role in the establishment of an available organic matter reservoir at the time of life's origin on Earth.
This chemical evolution at the surface of cometary grains is notably linked to the photochemical stability of organic molecules under Solar System conditions, that is, submitted to energetic VUV/UV photons (λ <300 nm). Photochemical studies in the VUV domain and the determination of photolysis constants (J) are then crucial to know the extent of the extraterrestrial contribution of comets and cometary grains to the origin of life. In this context, many experiments in photochemistry have been conducted with the intent to derive kinetic data of prime importance to the assessment of the photostability of organic molecules. These experiments are commonly done in the laboratory, where different lamps can be used to simulate a part of the solar spectrum. Because these lamps do not faithfully simulate the entire UV/VUV range, exposure experiments in low-Earth orbit (LEO) have been conducted (UVolution, PROCESS) (Guan et al., 2010; Bertrand et al., 2012; Cottin et al., 2012). To address irradiation data from all these experiments, the absorption cross-section spectra in the UV and VUV range are necessary. This article presents new results on the measurement of the VUV cross-section absorption spectra of thin organic films: the purine guanine and the pyrimidine uracil. Photodissociation rates derived from such measurements will be compared to measurements after direct exposure to the Sun in LEO. Advantages and limits of each method will be discussed.
2. Material and Methods
Here, we present the procedure to measure the absorption cross-section spectrum of uracil and of guanine in the VUV/UV domain (more details are given in Saïagh et al., 2014). Solid organic films were prepared and then analyzed with IR and VUV/UV spectroscopy. The absorption cross-section spectra were deduced from VUV/UV transmission data. This calculation requires an accurate value of the sample's thickness, which was measured with a surface profiler.
2.1. Sample preparation
Samples were prepared on magnesium fluoride (MgF2) windows that were inserted into an aluminum cell. MgF2 cutoff is at 115 nm in the VUV domain and at 1000 cm−1 in the IR domain.
Uracil and guanine were purchased from Sigma-Aldrich (purity >99%), and the MgF2 windows were provided by Crystran (thickness: 1 mm, diameter: 9 mm).
Solid samples were prepared by sublimation and recondensation of the studied molecule on MgF2 windows by using a reactor as described in Saïagh et al. (2014). The thickness was monitored in situ by laser interferometry.
With this setup, the laser beam undergoes reflections inside the organic layer and at the surface of the MgF2 window. The reflected beams are superimposed and create interference patterns. As the thickness of the deposit increases, the intensity of the reflected signal is measured on a photodiode and shows a profile of fringes (Fig. 1).
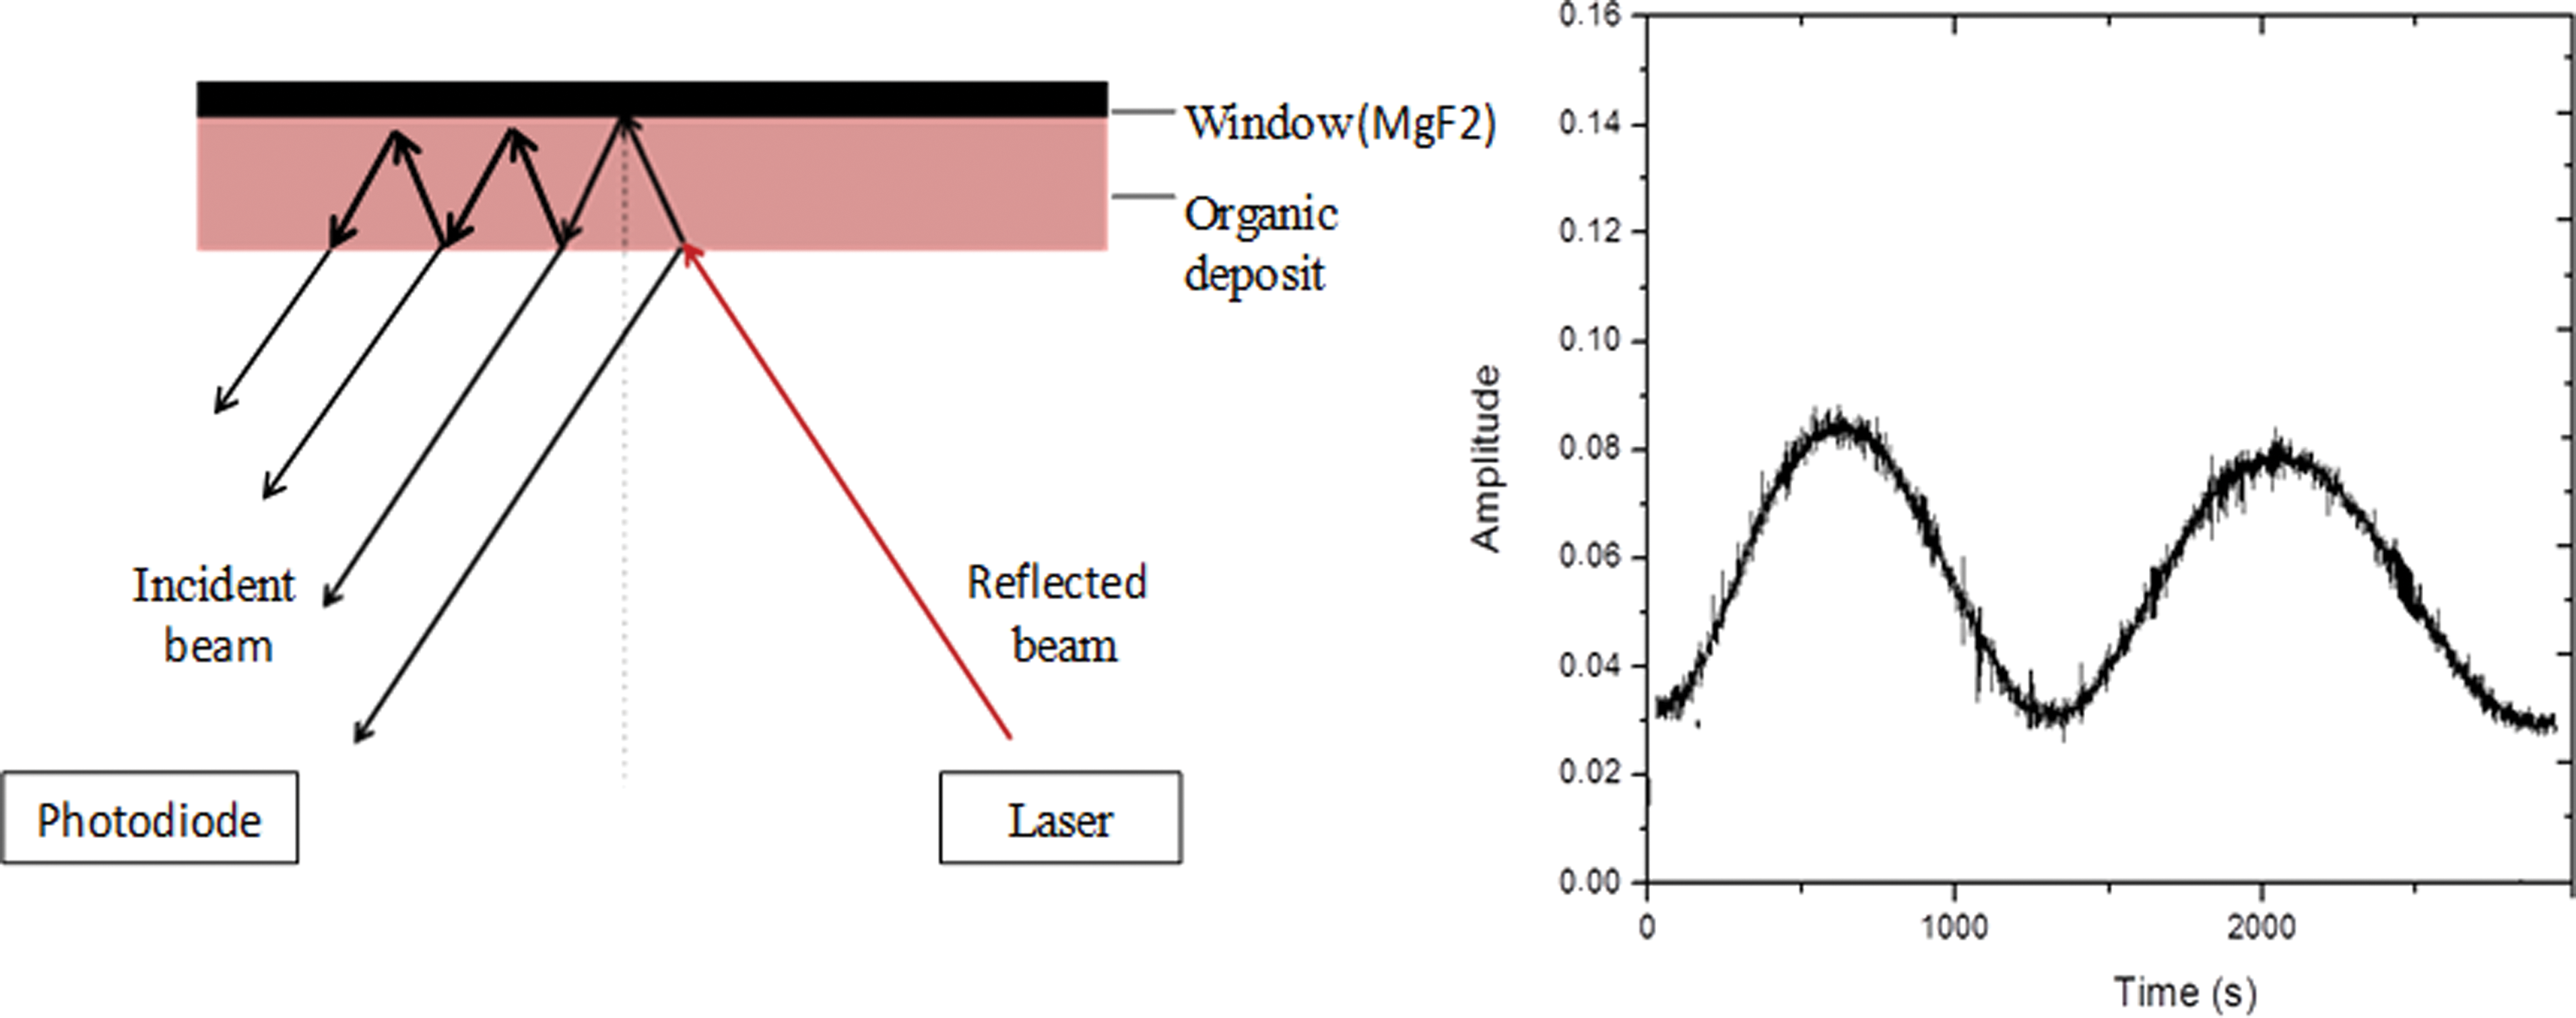
On the left, schematic explanation of the principle of optical interference observed during the deposit. At one side of the bottom of the reactor, a diode laser emits a light beam (650 nm) that is reflected both by the deposit and the cell's window. A photodiode receives the reflected light and measures variations in intensity related to the thickness of the growing deposits as shown on the right, where a typical measurement recorded by the photodiode is presented: a guanine film of 2 times equal thickness (2 fringes). (Color graphics available at
The experimental temperature and pressure at which film samples were obtained were 260°C and 10−5 mbar for guanine and 70°C and 10−5 mbar for uracil.
2.2. Analysis
2.2.1. Infrared analysis
The IR analysis of organic films on MgF2 windows was performed with a Fourier transform infrared spectrometer (Bruker Vertex 70). The absorption spectra were measured between 4000 and 1000 cm−1 with a resolution of 4 cm−1. Each spectrum was averaged on 32 scans.
2.2.2. VUV/UV analysis
Transmission spectra were acquired with a Horiba Jobin Yvon spectrometer fitted with a monochromator H20-UVL (grating: 1200 grooves per mm, dimensions 40×45×7 mm, opening of slits 130–160 μm) covering the 115–300 nm range (Saïagh et al., 2014). In the case of uracil, spectra were also acquired between 300 and 400 nm with the Agilent Cary 60 UV-vis spectrophotometer. Data were recorded in transmission mode. A spectrum of an MgF2 window without deposit was recorded before each sample and used as a reference. Thus, we can measure the incident (Io) and transmitted (I) intensities from which transmission spectra are calculated.
Photoabsorption cross sections σ (cm2) of each sample were calculated by using the following relation derived from the Beer-Lambert law:
with N, column density (molecule/cm2),
where z is the thickness of the film (cm); N a is Avogadro's number; ρ is the density of guanine or uracil, 1.72 g·cm−3 or 1.67 g·cm−3, respectively (Kilday, 1978, 1981); and M is their molar mass, 151.13 g·mol−1 or 112.08 g·mol−1. It is true that the actual densities of our films could differ from that which was taken from the literature, since our experimental conditions were not the same as those used by Kilday (1978, 1981). This may have resulted in a systematic bias on thickness determination and, hence, in the calculation of the absorption cross sections. We believe, however, that this uncertainty is negligible compared to that which is discussed later in this paper.
Thus, to measure the absorption cross section, the thicknesses of the films had to be previously characterized.
2.3. Thickness measurement
2.3.1. Surface stylus profiler
A surface profiler (Dektak 150) was used to measure sample thickness with a precision of 1 nm. The measurement of the deposit thickness required a step height. To accomplish this, a furrow was traced into the deposit once all the spectra had been measured. A stylus was moved vertically in contact with the organic film and then moved laterally across the sample. This technique leads to the registration of profiles in x direction, which indicates the height difference between the top and the bottom of the sample.
2.3.2. Infrared spectra
Infrared analysis was used to calculate the thickness of samples below approximately 30 nm, since these were too thin to be measurable with the profiler. Even the thinnest samples displayed significant IR features that could be used for thickness estimation. With a good correlation between the area of a spectral feature and the thickness measured with the profiler, it was possible to deduce the thicknesses of all the samples from the IR spectrum, even the thinnest ones. The IR band pattern considered was between 3700 and 2120 cm−1 in the case of guanine (called α band in this paper) and between 3400 and 1890 cm−1 (called β band in this paper) in the case of uracil.
3. Results
3.1. Infrared analysis
The IR spectrum of a film of guanine and the assignments of IR peaks are presented in Fig. 2 and Table 1. Uracil IR spectrum and peak assignments are shown in Fig. 3 and Table 2.
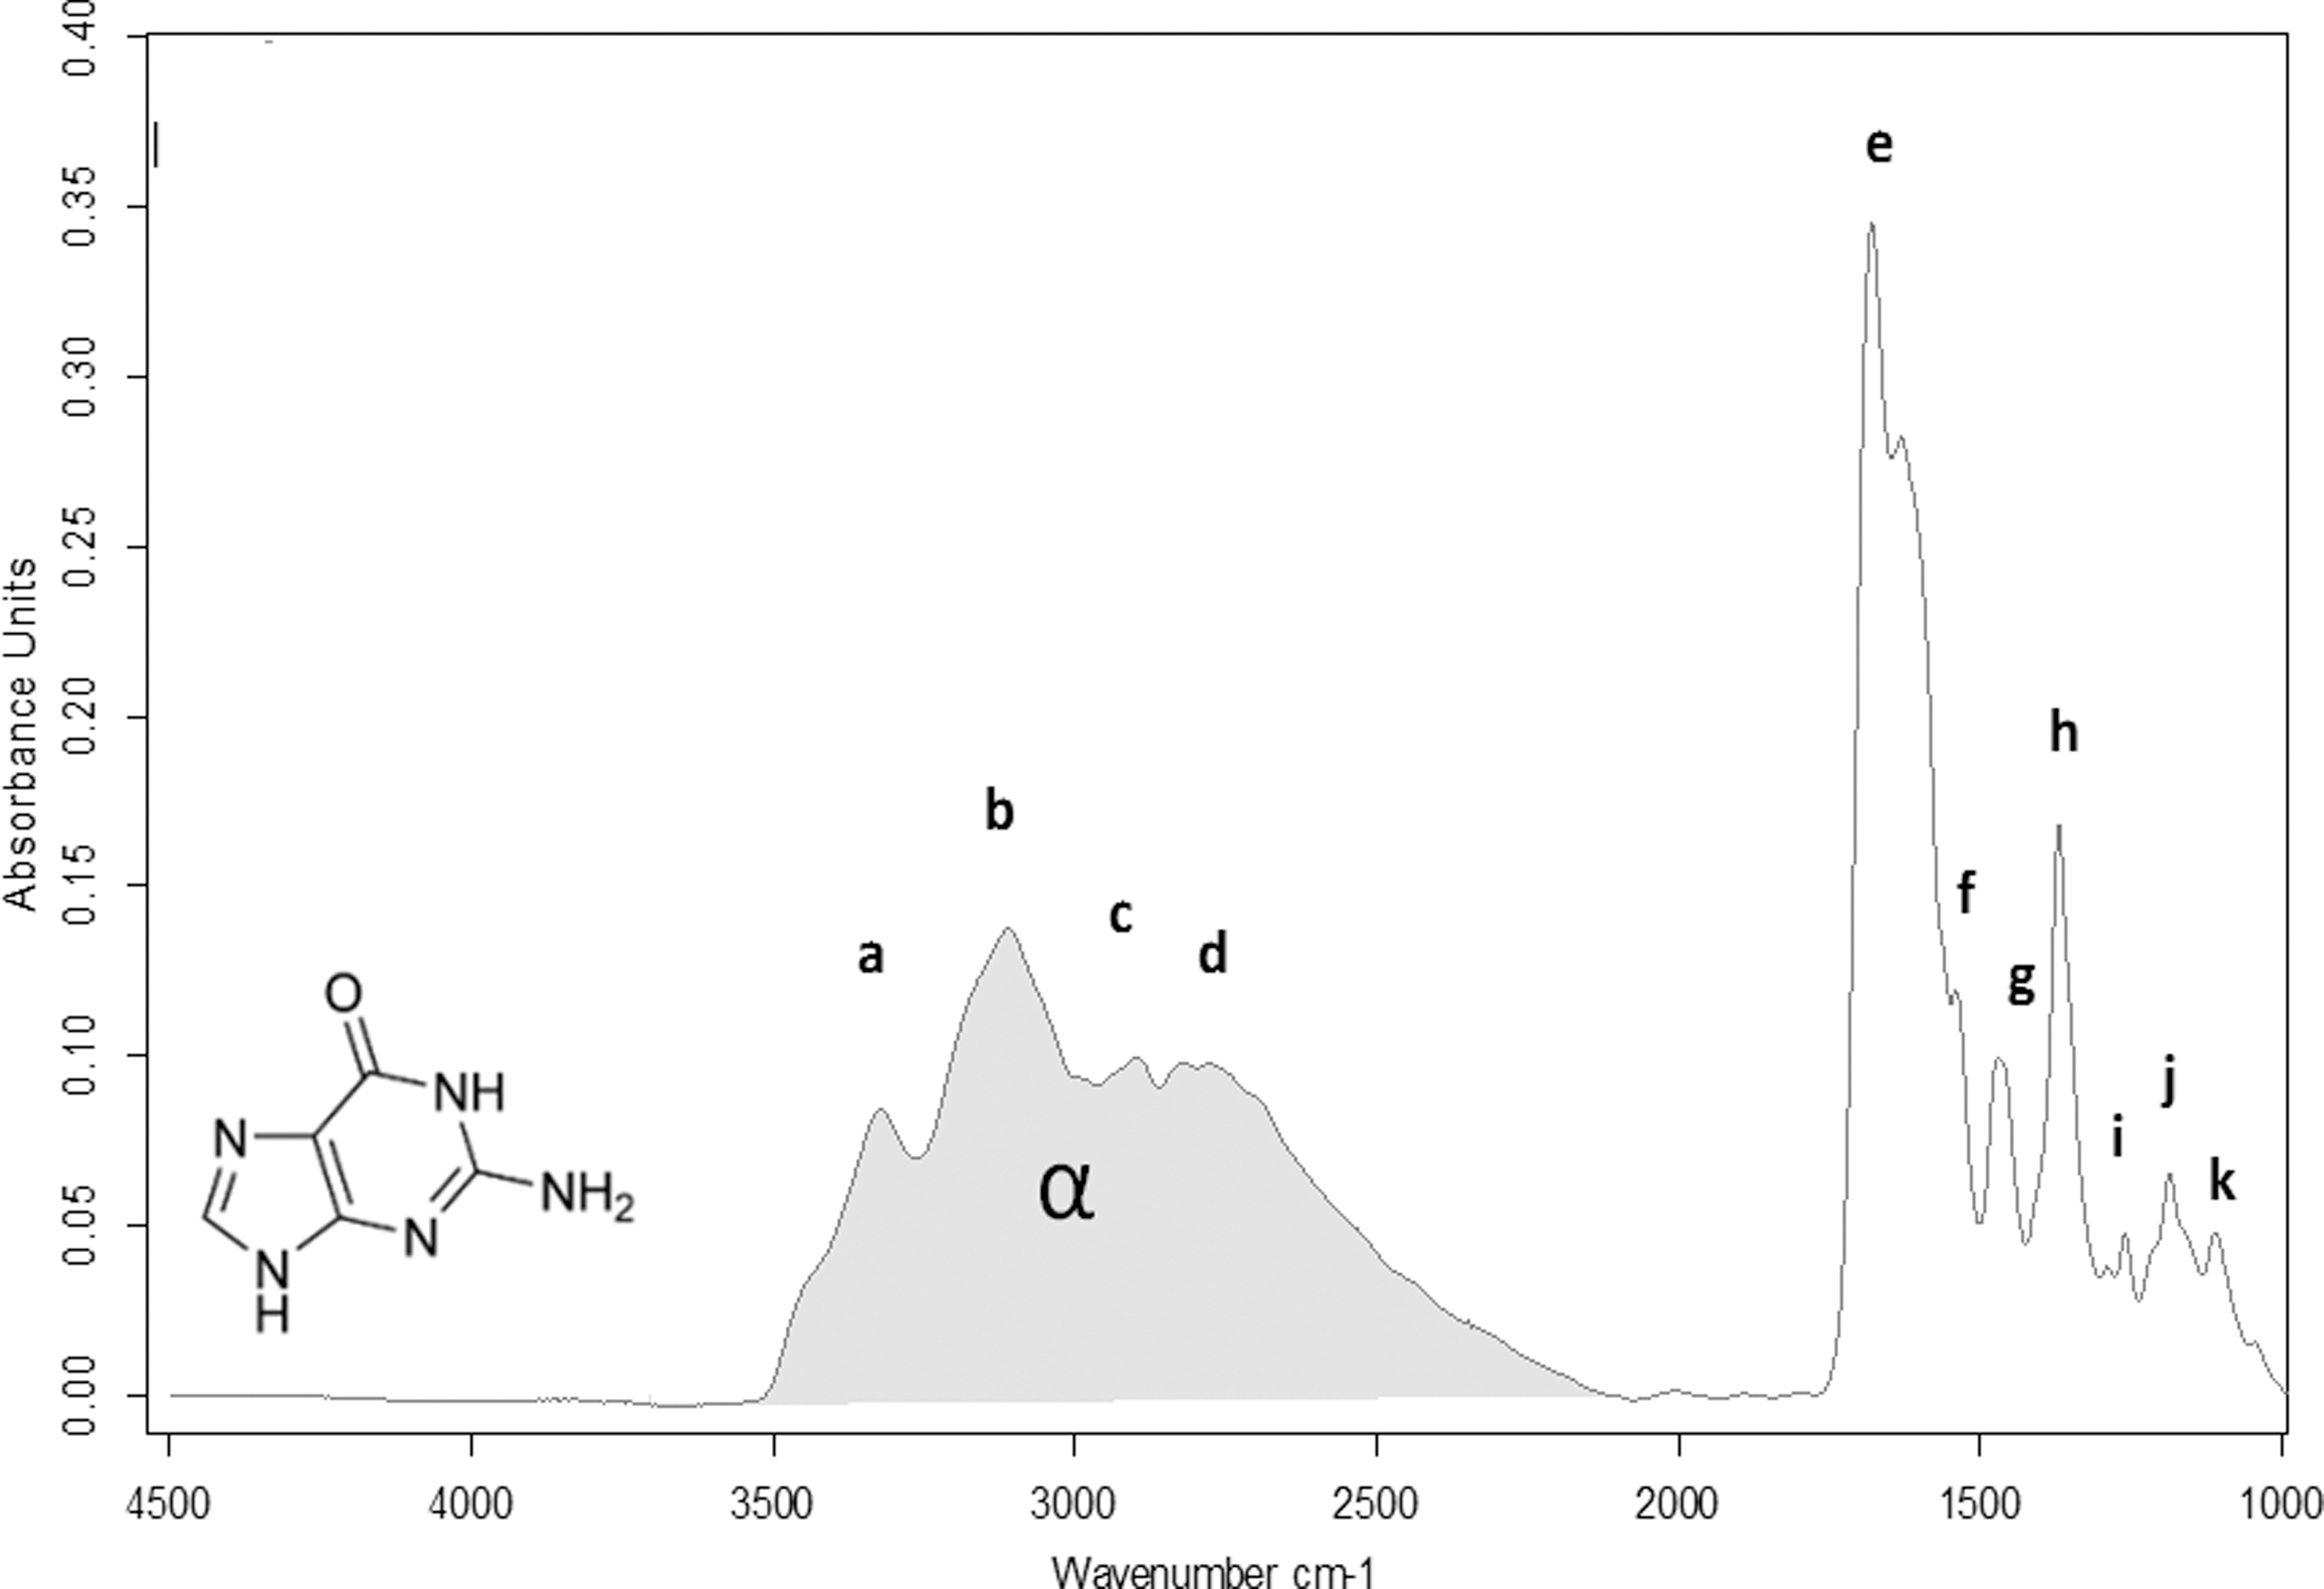
Infrared spectrum of solid guanine in the range 4000–1000 cm−1. Gray area is the band pattern called α band in this paper.
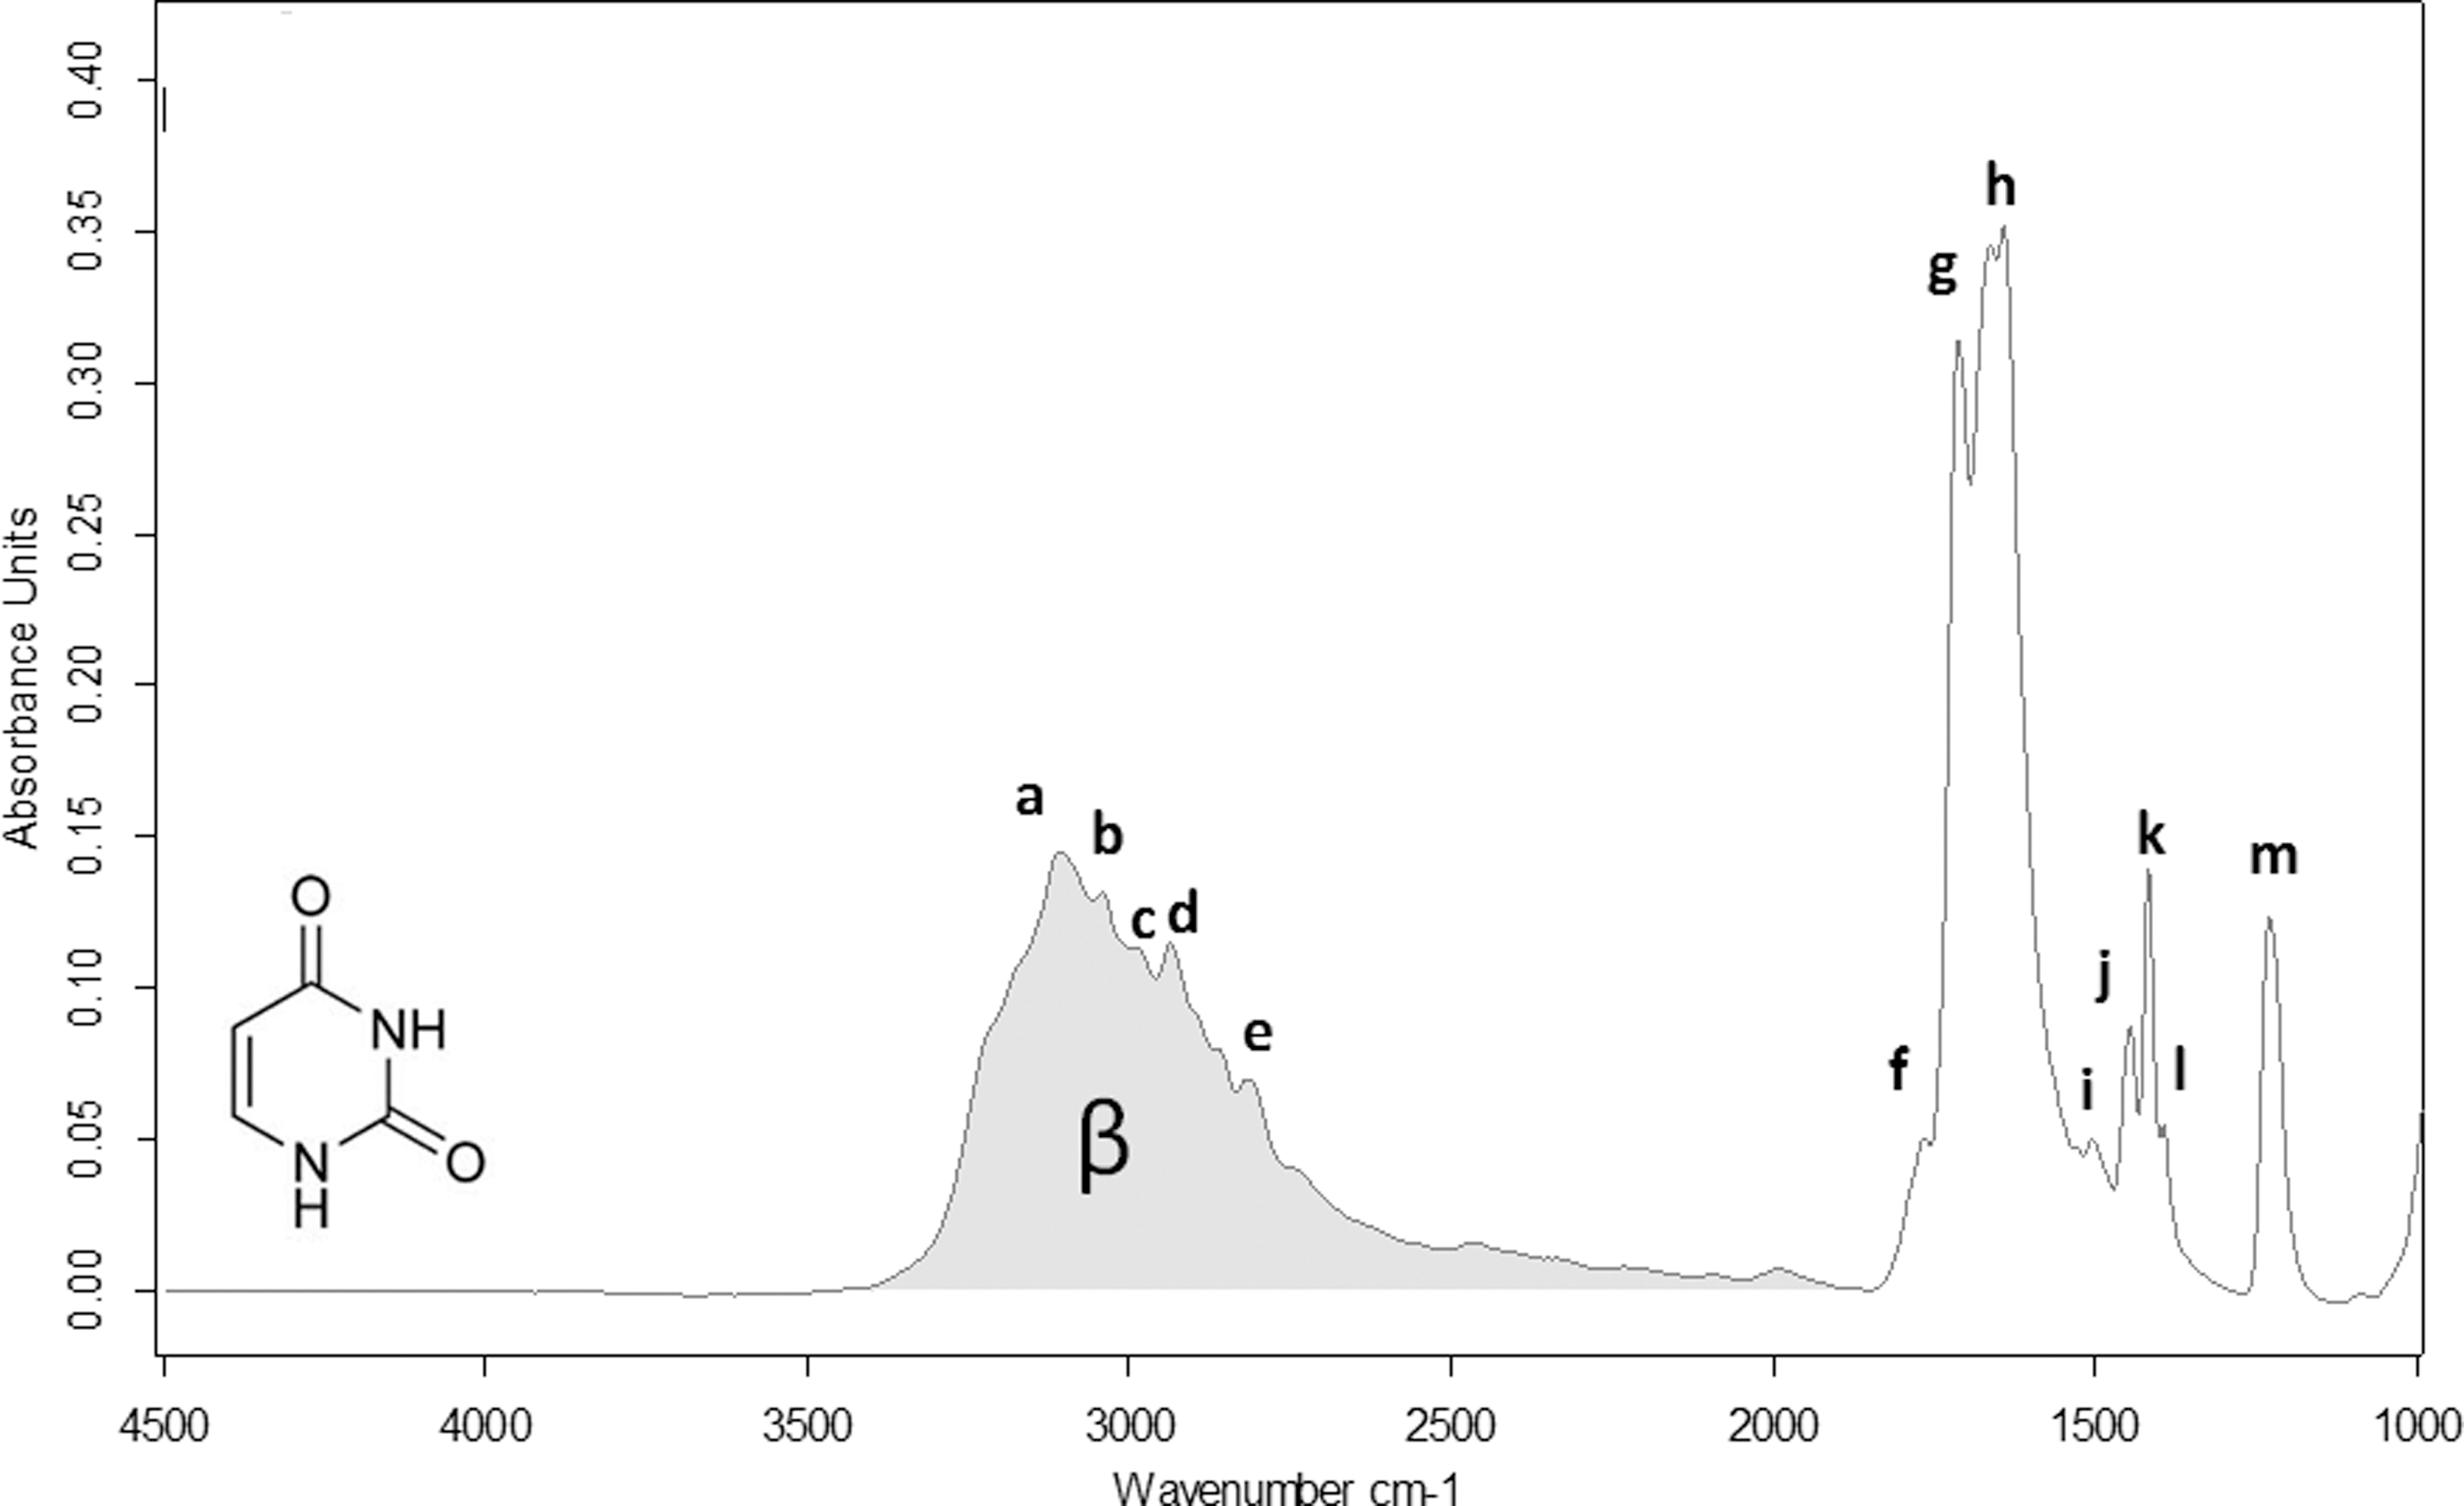
Infrared spectrum of solid uracil in the range 4000–1000 cm−1. Gray area is the band pattern called β band in this paper.
The assignments of the IR band characteristics of guanine and uracil confirm that the samples were not altered by the sublimation process during their preparation.
Twelve guanine samples and 10 uracil samples of various thicknesses were prepared. The integrity of all guanine was checked by IR spectroscopy and displayed the same spectrum as the one shown in Fig. 2.
Concerning uracil, two polymorphs were identified. Figure 4 presents IR spectra of two uracil samples with the same thickness more or less 10%. In fact, their preparation in the sublimation reactor led to the registration of the same interference fringes “number.”
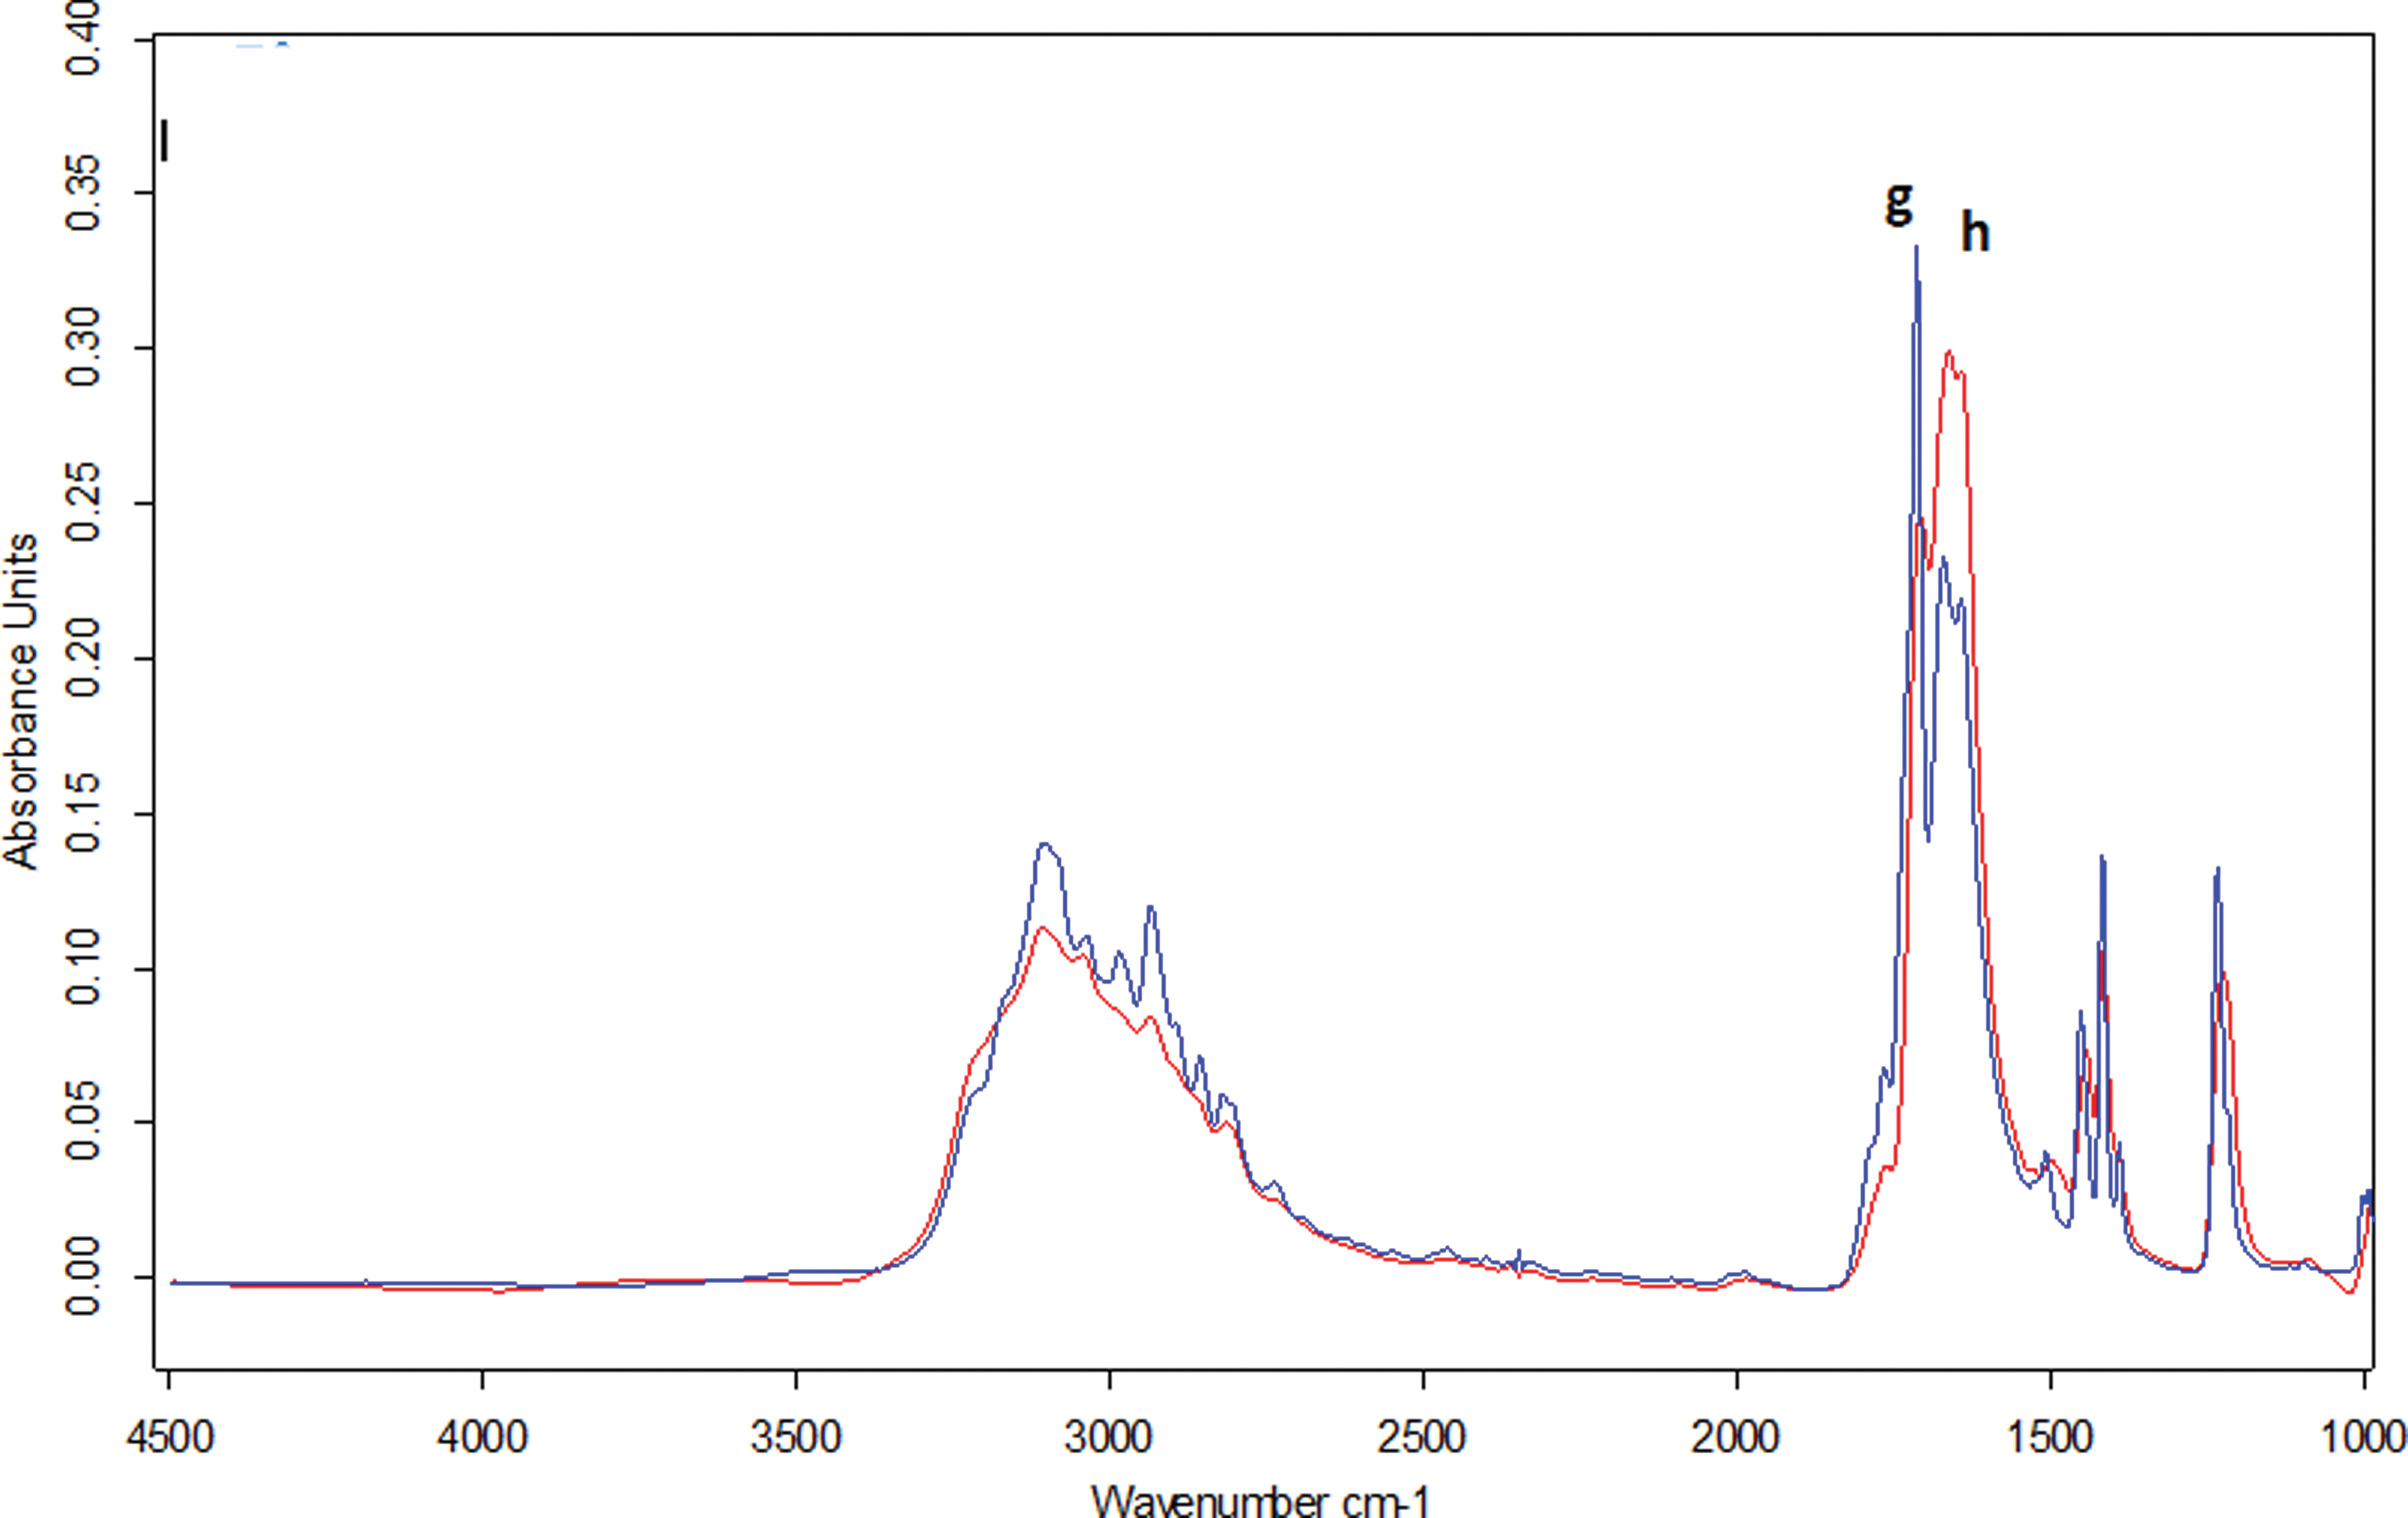
Infrared spectrum of two solid uracil samples in the range 4000–1000 cm−1. (Color graphics available at
No new band appeared, but differences of vibration intensities can be noticed in the β band, which correspond to the stretching of the N-H and C-H bond. In shorter wavenumbers, a difference in intensity of the bands νC=O (g) and νC=C (h) between the two spectra presented in Fig. 3 can also be noted. In one form (called form A, in blue), the stretching of the C=O group is more intense than that of C=C; for the other form (called B, in red), it is the opposite (Fig. 4). Those dissimilarities seem to be related to two crystallization modes in which, by definition, the establishment of hydrogen bonds is done differently. In fact, uracil molecules form a planar, hydrogen-bonded structure that impacts the length of the N-H and C-H bond (Portalone et al., 1999). Furthermore, the hydrogen bonding is also the factor responsible for differences that affect the molecular geometry of the sixth membered ring (Portalone et al., 2002).
3.2. Thickness measurement: surface stylus profiler
Four samples of guanine and four samples of uracil were prepared to be thick enough to be analyzed with the surface profiler. Two perpendicular furrows were dug with a sharp tip. In that way, 10 measurements located at four different positions (see Fig. 5) were done for each sample.
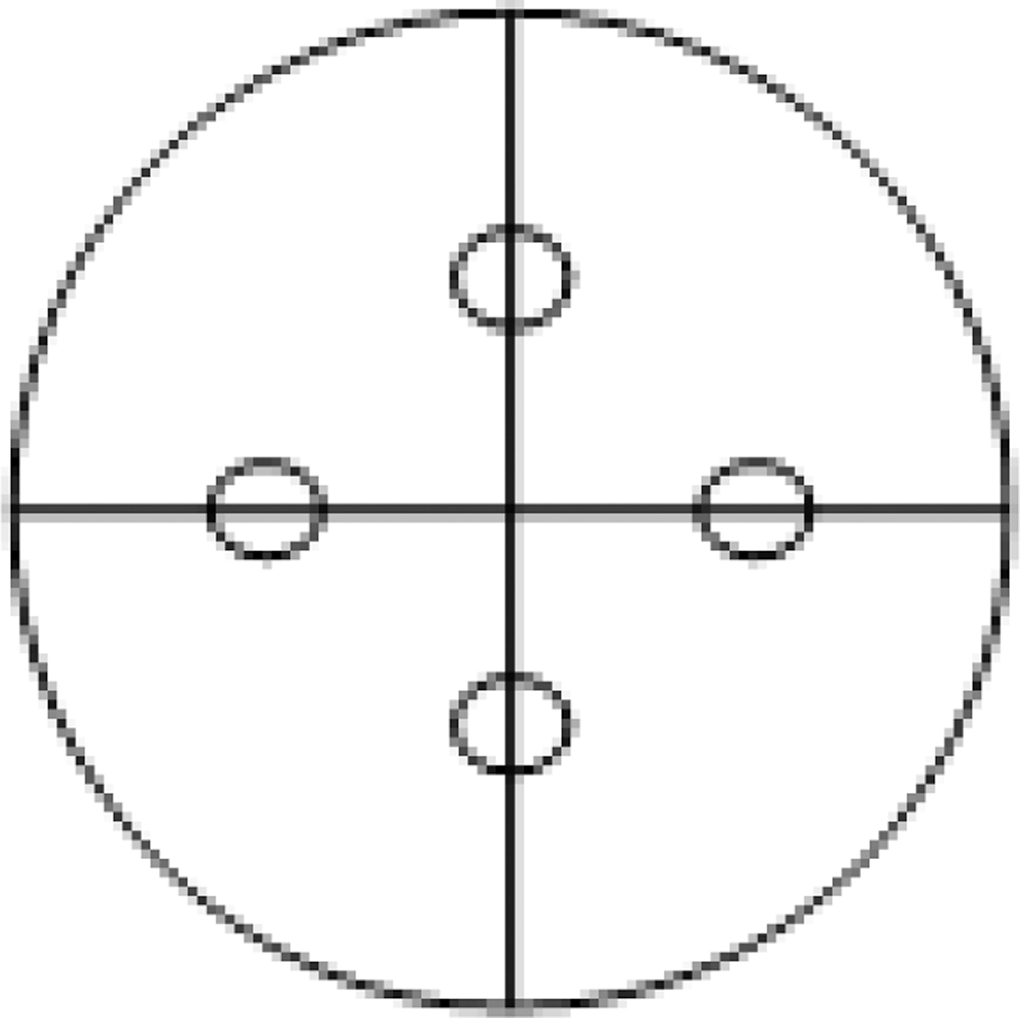
Thickness measurement by surface stylus profiler on a sample. Each measurement position is indicated by a circle.
Thickness is estimated as the average of each measurement on the sample±t (n-1) * σ with n the number of measured zones (40) and t the Student coefficient at 99% confidence level. Values can be quite dispersed on a single sample, which can be explained by thickness heterogeneity of the organic deposit along the window. Also, some of the samples had a bigger dispersion than others. This was due to their position in the sublimation reactor during the deposit. In fact, the orientation of some MgF2 windows was more tilted than others with respect to the oven containing the molecule before sublimation. However, several zones of each sample were measured to ensure a representative average of the film thickness was obtained.
Thicknesses of the four samples as a function of IR area band are reported in Figs. 6 and 7.
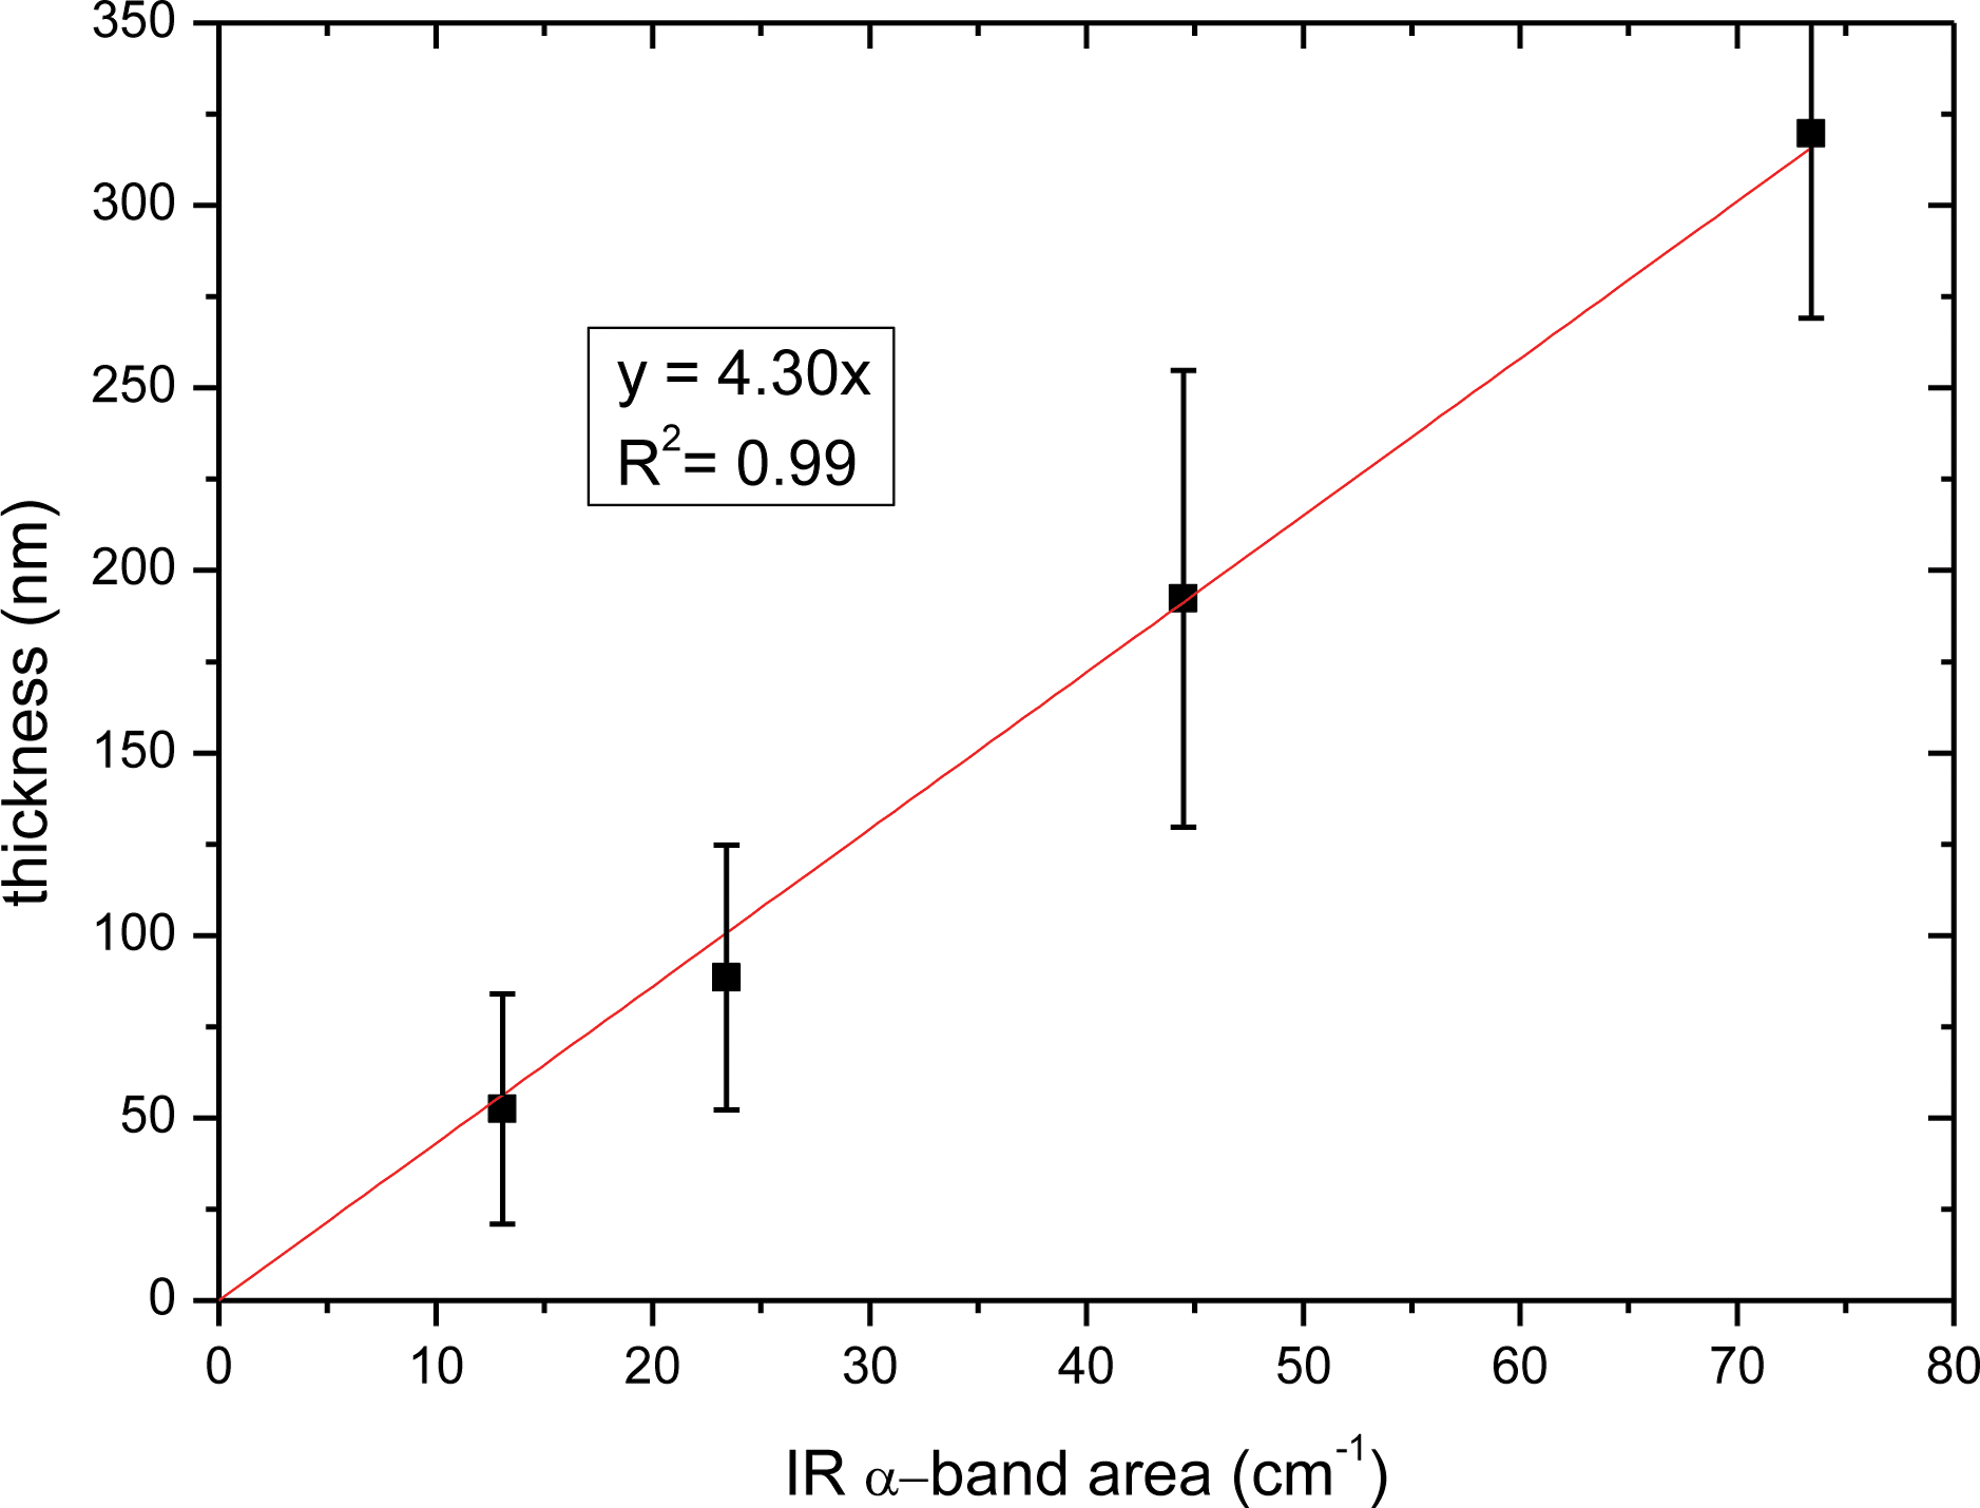
Guanine film thicknesses (in nm) measured by surface profiler as a function of IR α-band area (in cm−1). (Color graphics available at
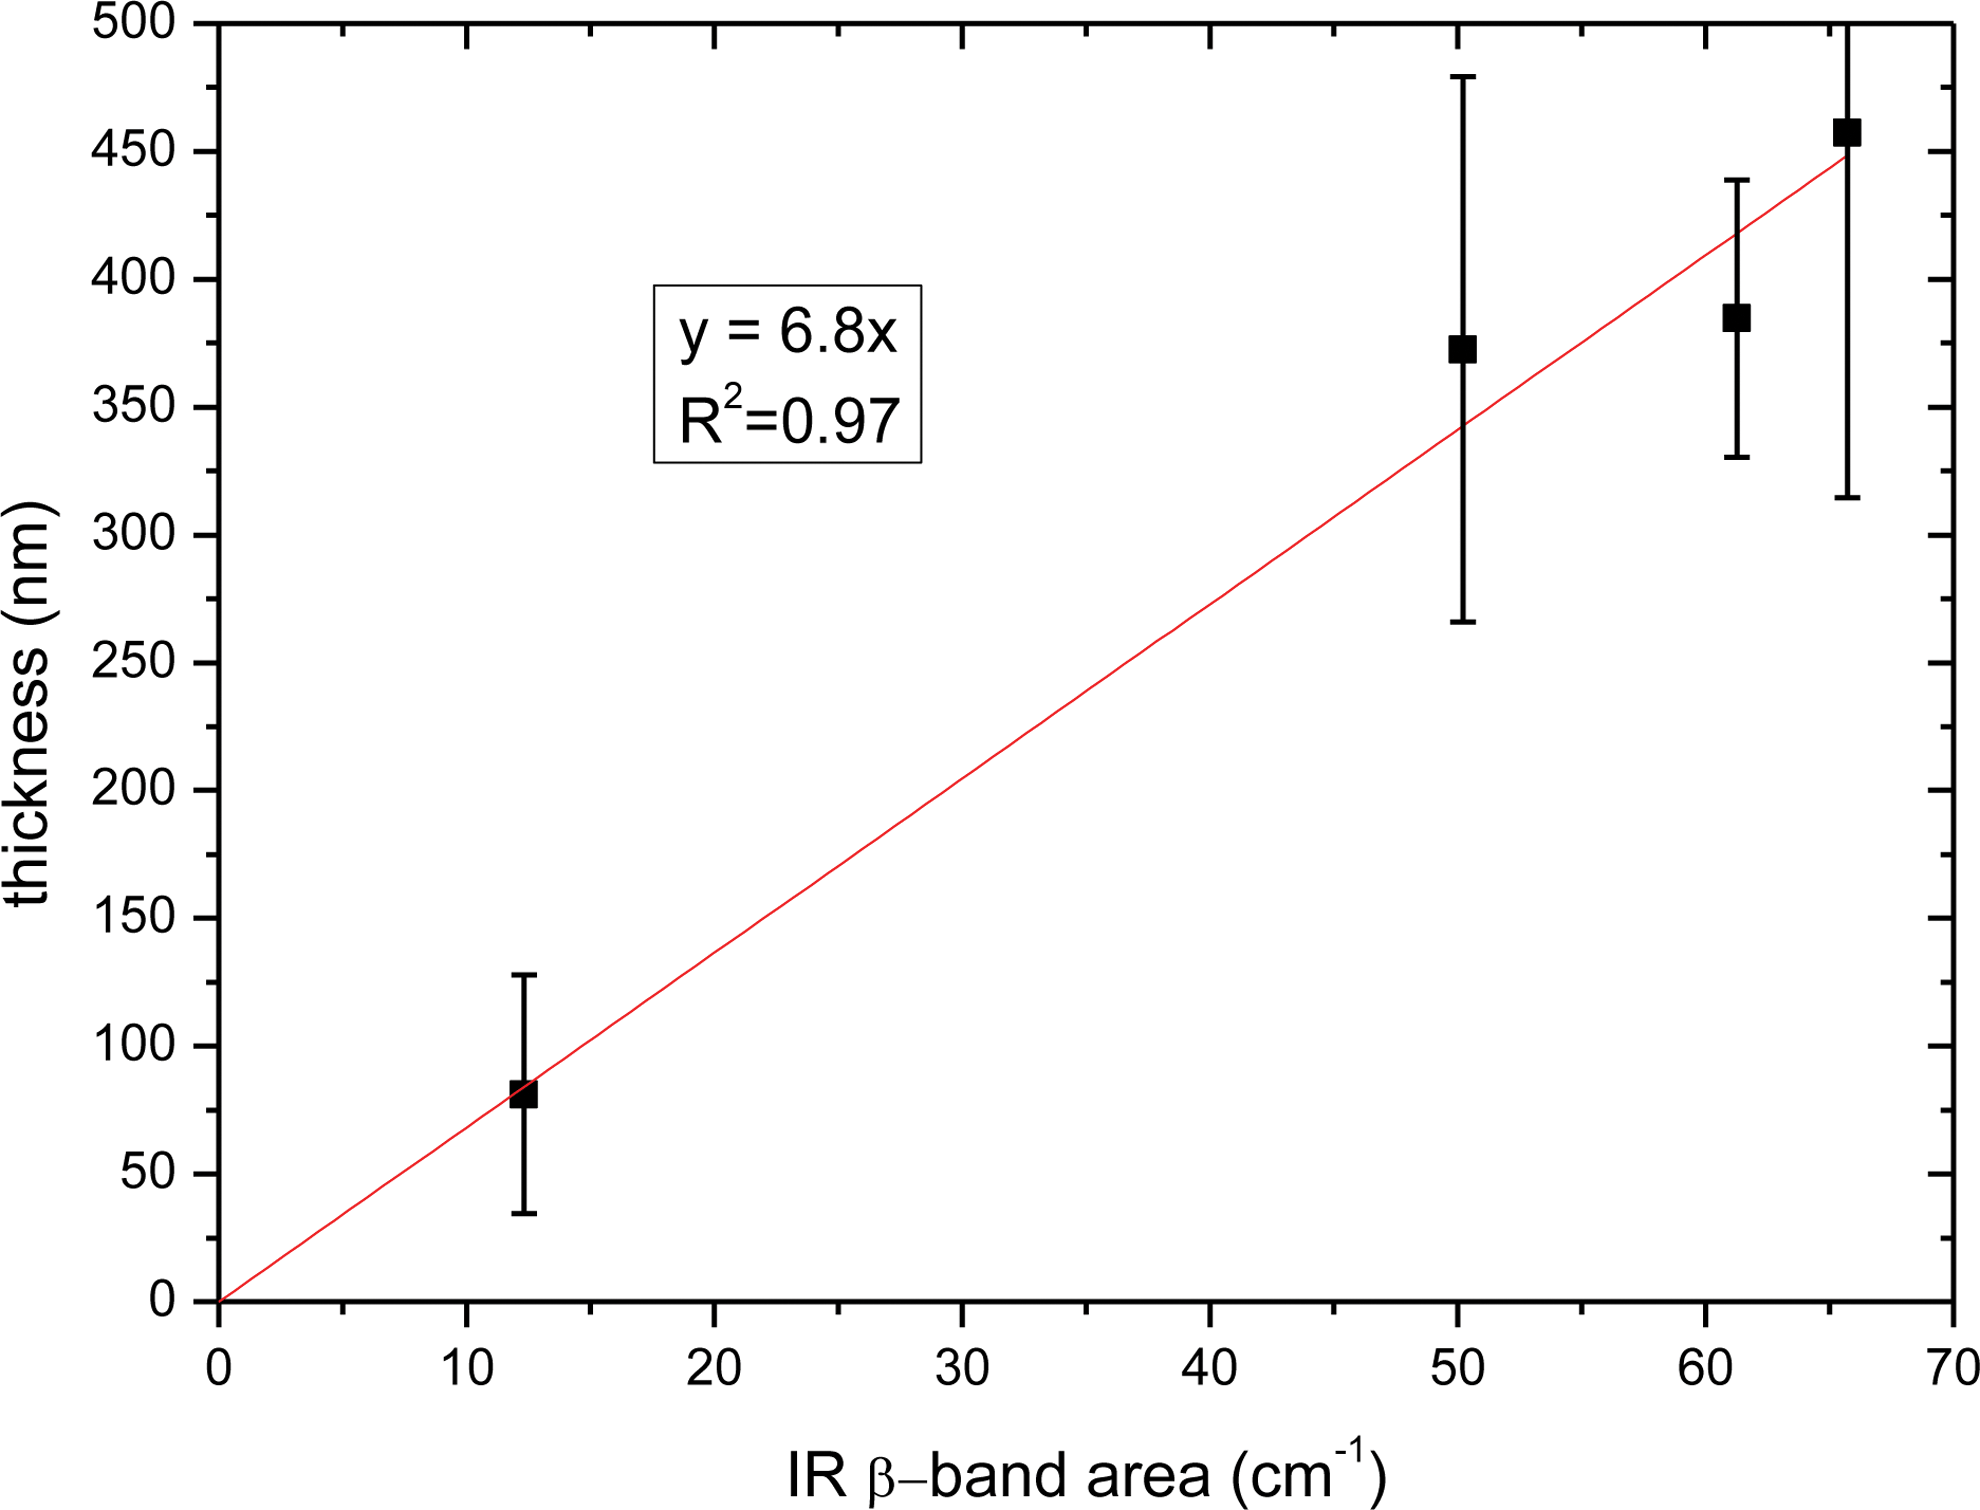
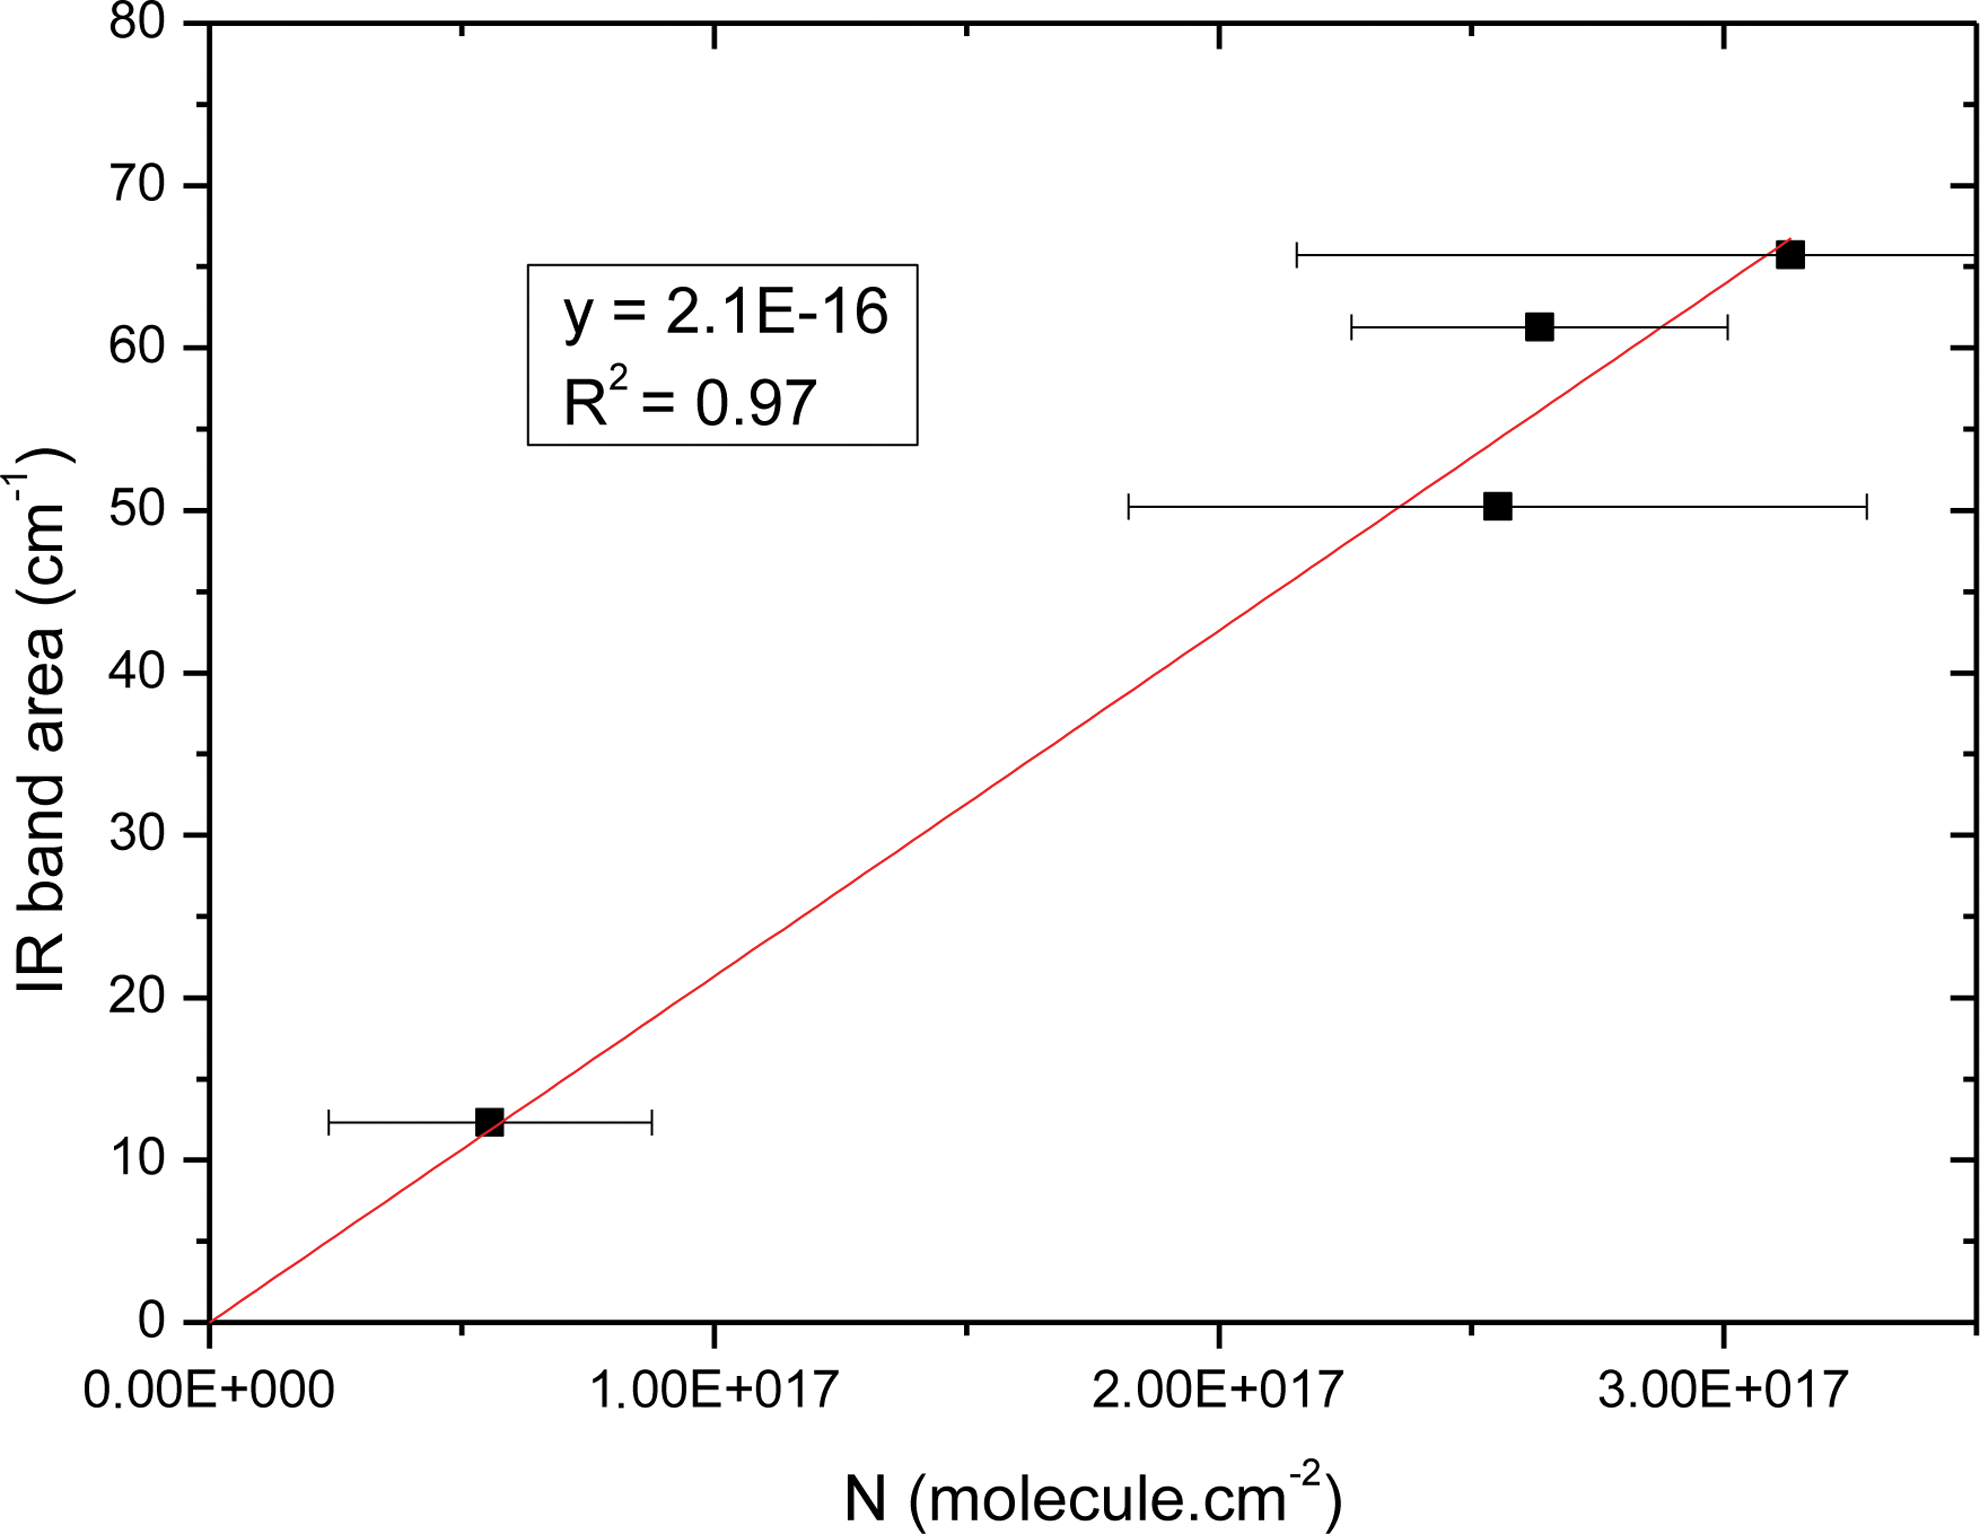
Uracil film thicknesses (in nm) measured by surface profiler as a function of IR β-band area (in cm−1). (Color graphics available at
3.3. Refractive index
Thickness measurements by the surface profiler lead to determination of the refraction index of the two molecules in solid state at 650 nm. In fact, each interference fringe observed during sample preparation (see Section 2.1) corresponds to a same thickness given by Eq. 3, where z is the film thickness for one fringe, λ is the laser wavelength (650 nm), n is the refractive index of solid uracil and guanine at 650 nm, and r is the angle of the laser reflected on the sample in the experimental setup, 15°±1%.
Knowing the thickness z by way of the surface profiler, it is possible to deduce the refractive index n (Table 3). The refractive index of solid uracil is deduced from the A crystallization form.
3.4. Infrared band strength
Having obtained the sample thicknesses, integrated band strength A can be calculated from Eq. 4.
where A is the band strength in cm·molecule−1,
The integrated band strength of guanine in solid state, between 3700 and 2120 cm−1, is equal to 3.4×10⁻¹⁶ cm·molecule−1±13%. Concerning solid uracil, A is equal to 2.1×10⁻¹⁶ cm·molecule−1±21% between 3400 and 1890 cm−1 (Figs. 8 and 9).
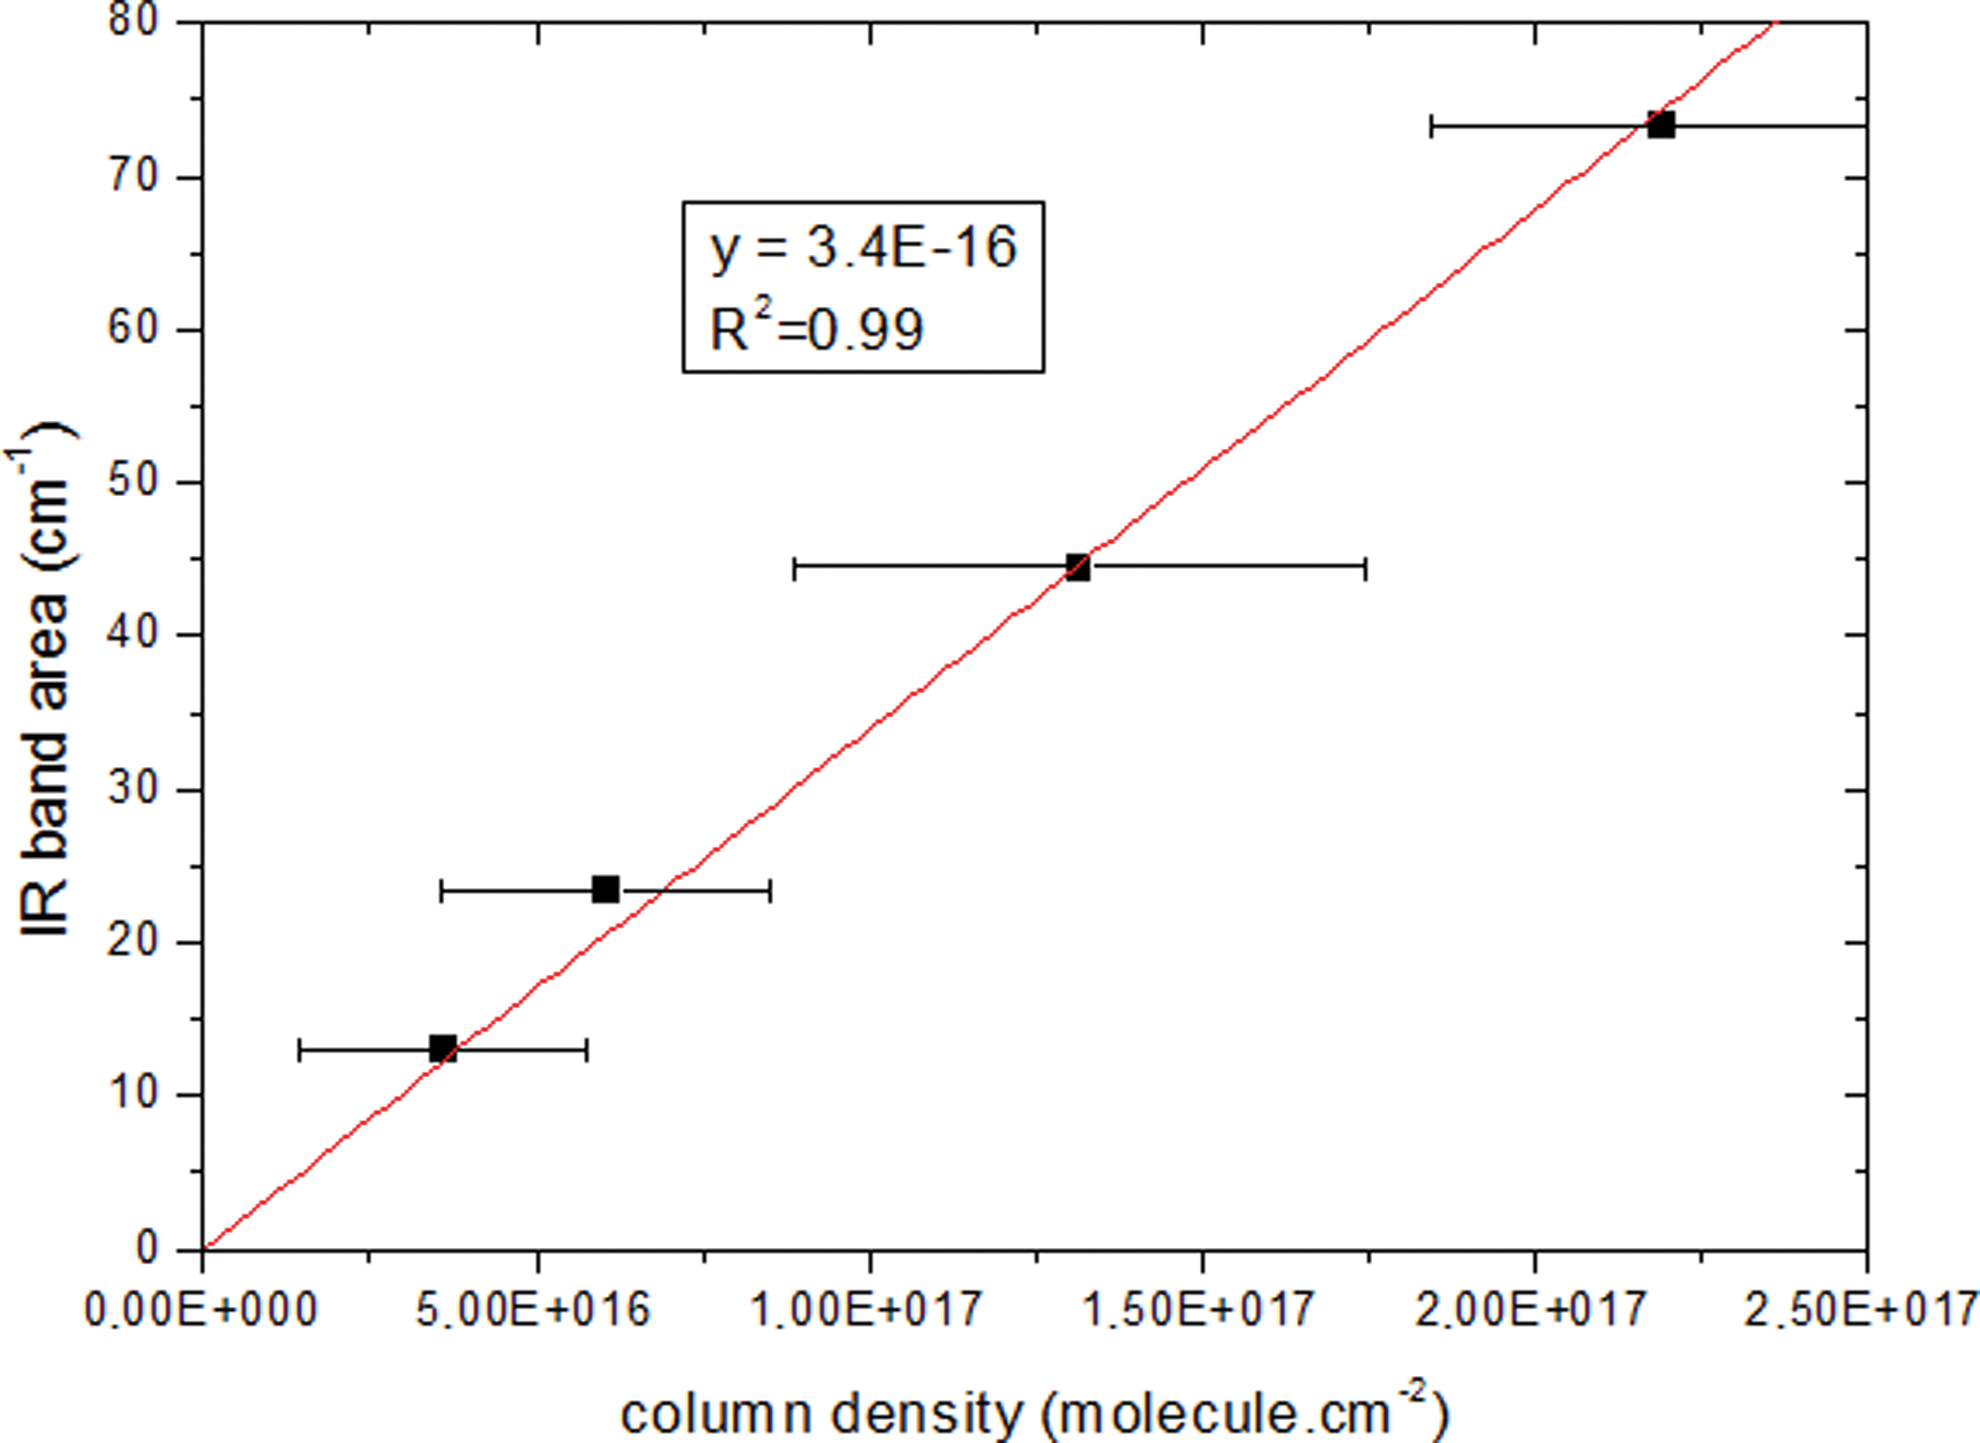
Calculation of guanine's band strength A (in cm
Calculation of uracil's band strength A (in cm
3.5. VUV analysis
3.5.1. Guanine
VUV spectra of eight guanine samples are reported in Fig. 10. From each VUV transmission spectrum, the cross-section spectra can be deduced. These cross-section spectra are calculated by using Eq. 1 and are averaged (Fig. 11).

(
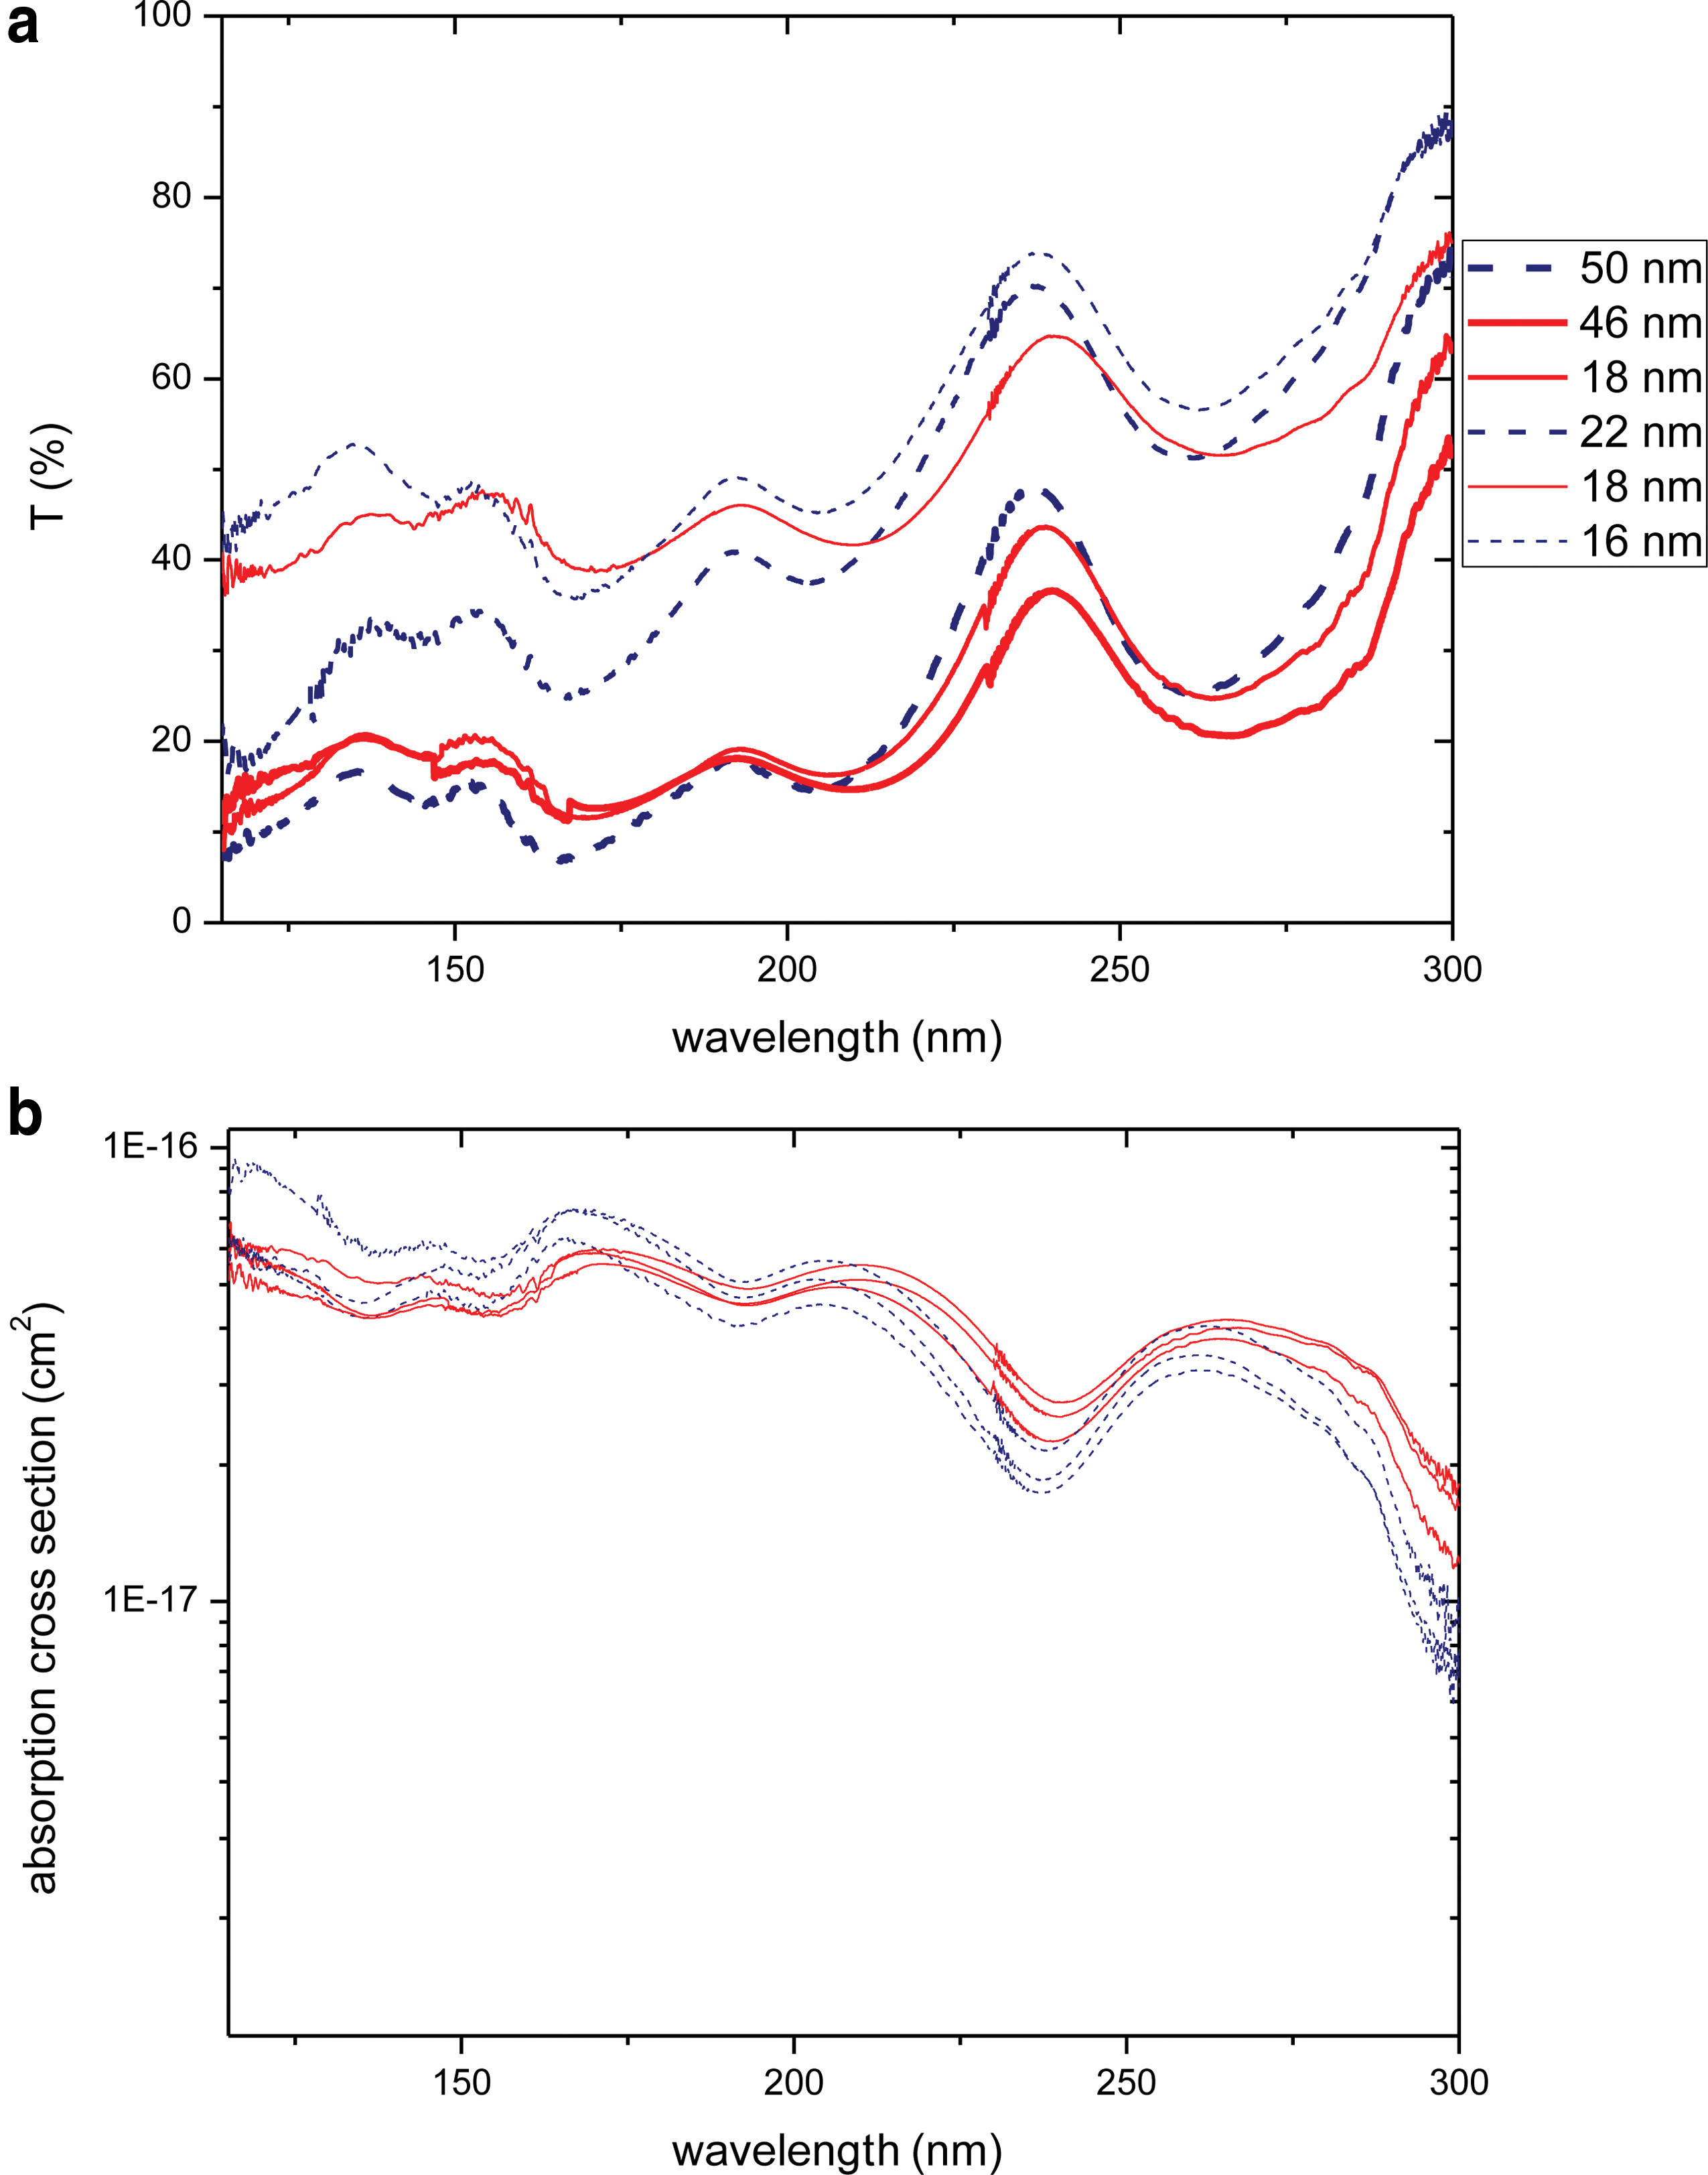
Absorption cross section (cm2) of guanine solid sample (from 115 to 300 nm). (Color graphics available at
The absorption large peaks centered at 283, 250, and 200 nm are associated to π→π* transitions (Emerson et al., 1975). A slight dispersion can be observed due to the heterogeneity of the film thickness on the MgF2 windows (see Section 3.2.).
3.5.2. Uracil
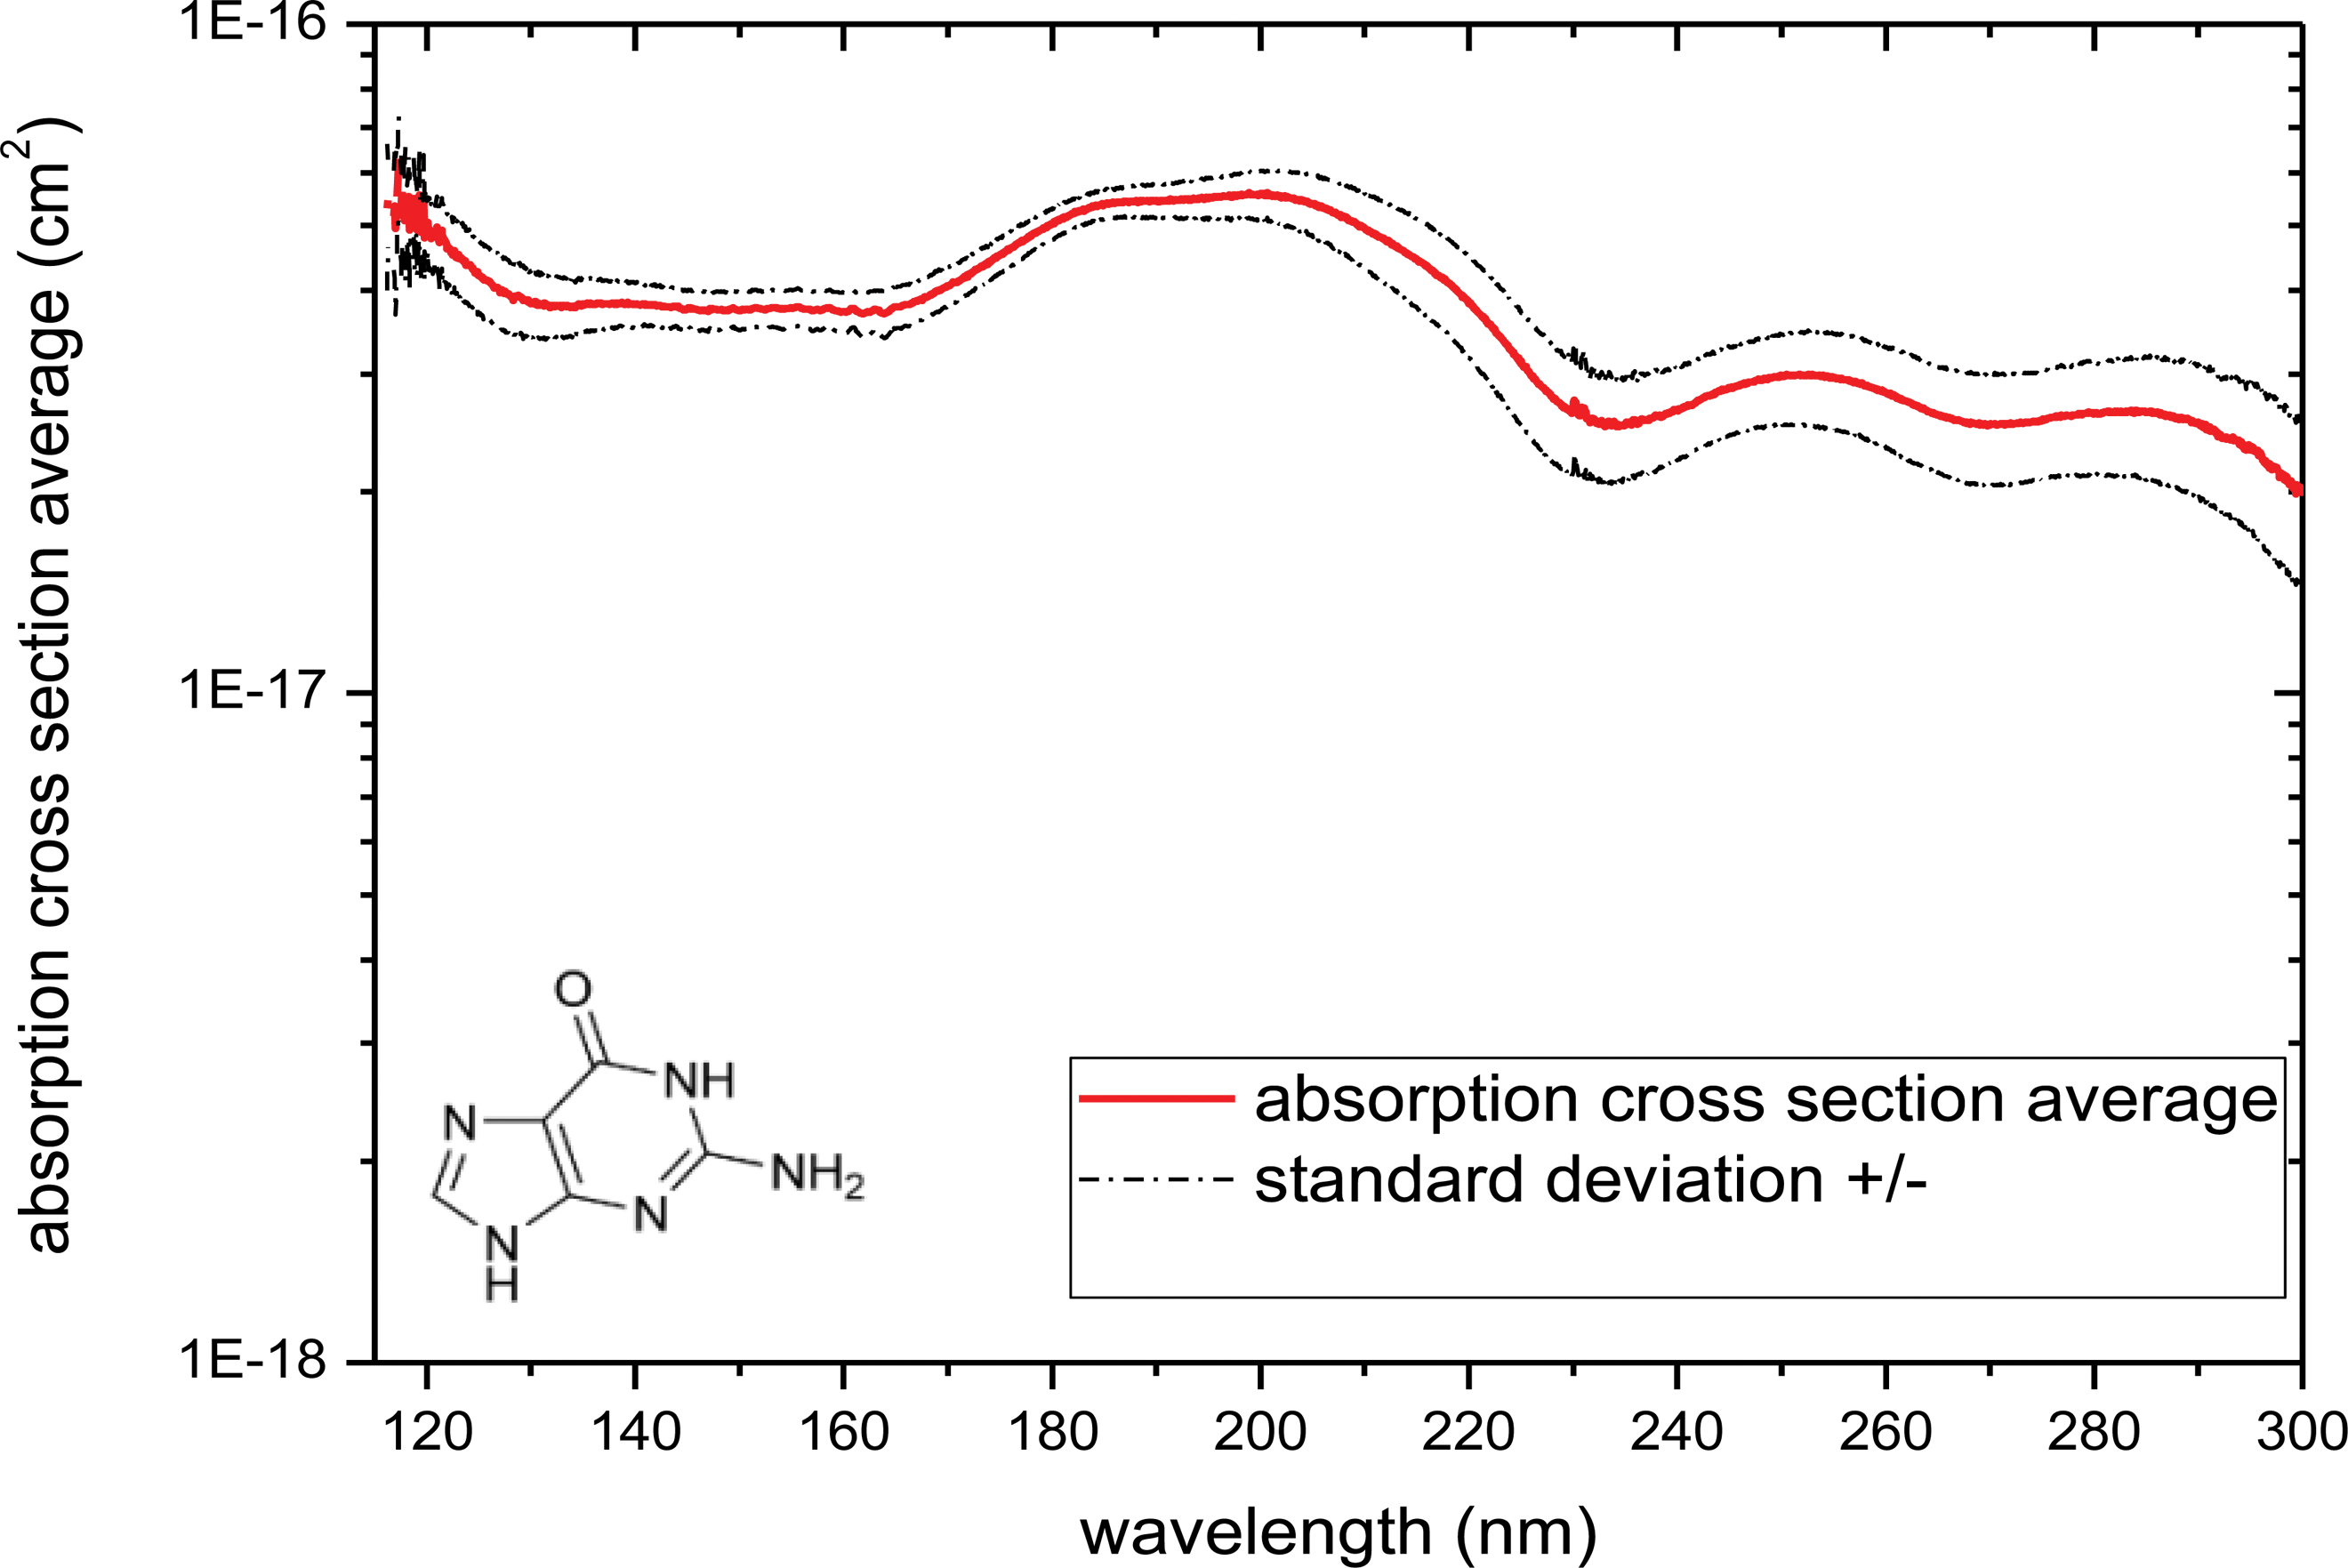
Six uracil samples of different thickness were analyzed by the VUV spectrometer. From thee transmissions, the absorption cross section of each sample was calculated (Fig. 12).
(
All spectra do not seem to have the same shape: two forms are identified with a blue dotted line and red solid line as shown in Fig. 12. This is in agreement with two different IR profiles (see Section 3.1). The different structure arrangements in the film do not have a great impact on quantitative measurements as shown in Fig. 12b. Furthermore, the objective is to measure photolysis rates for molecules for which the exact crystallization form is not known. Thus, we decided to average the two kinds of spectra; Figure 13 presents the uracil absorption cross section in VUV/UV domain.
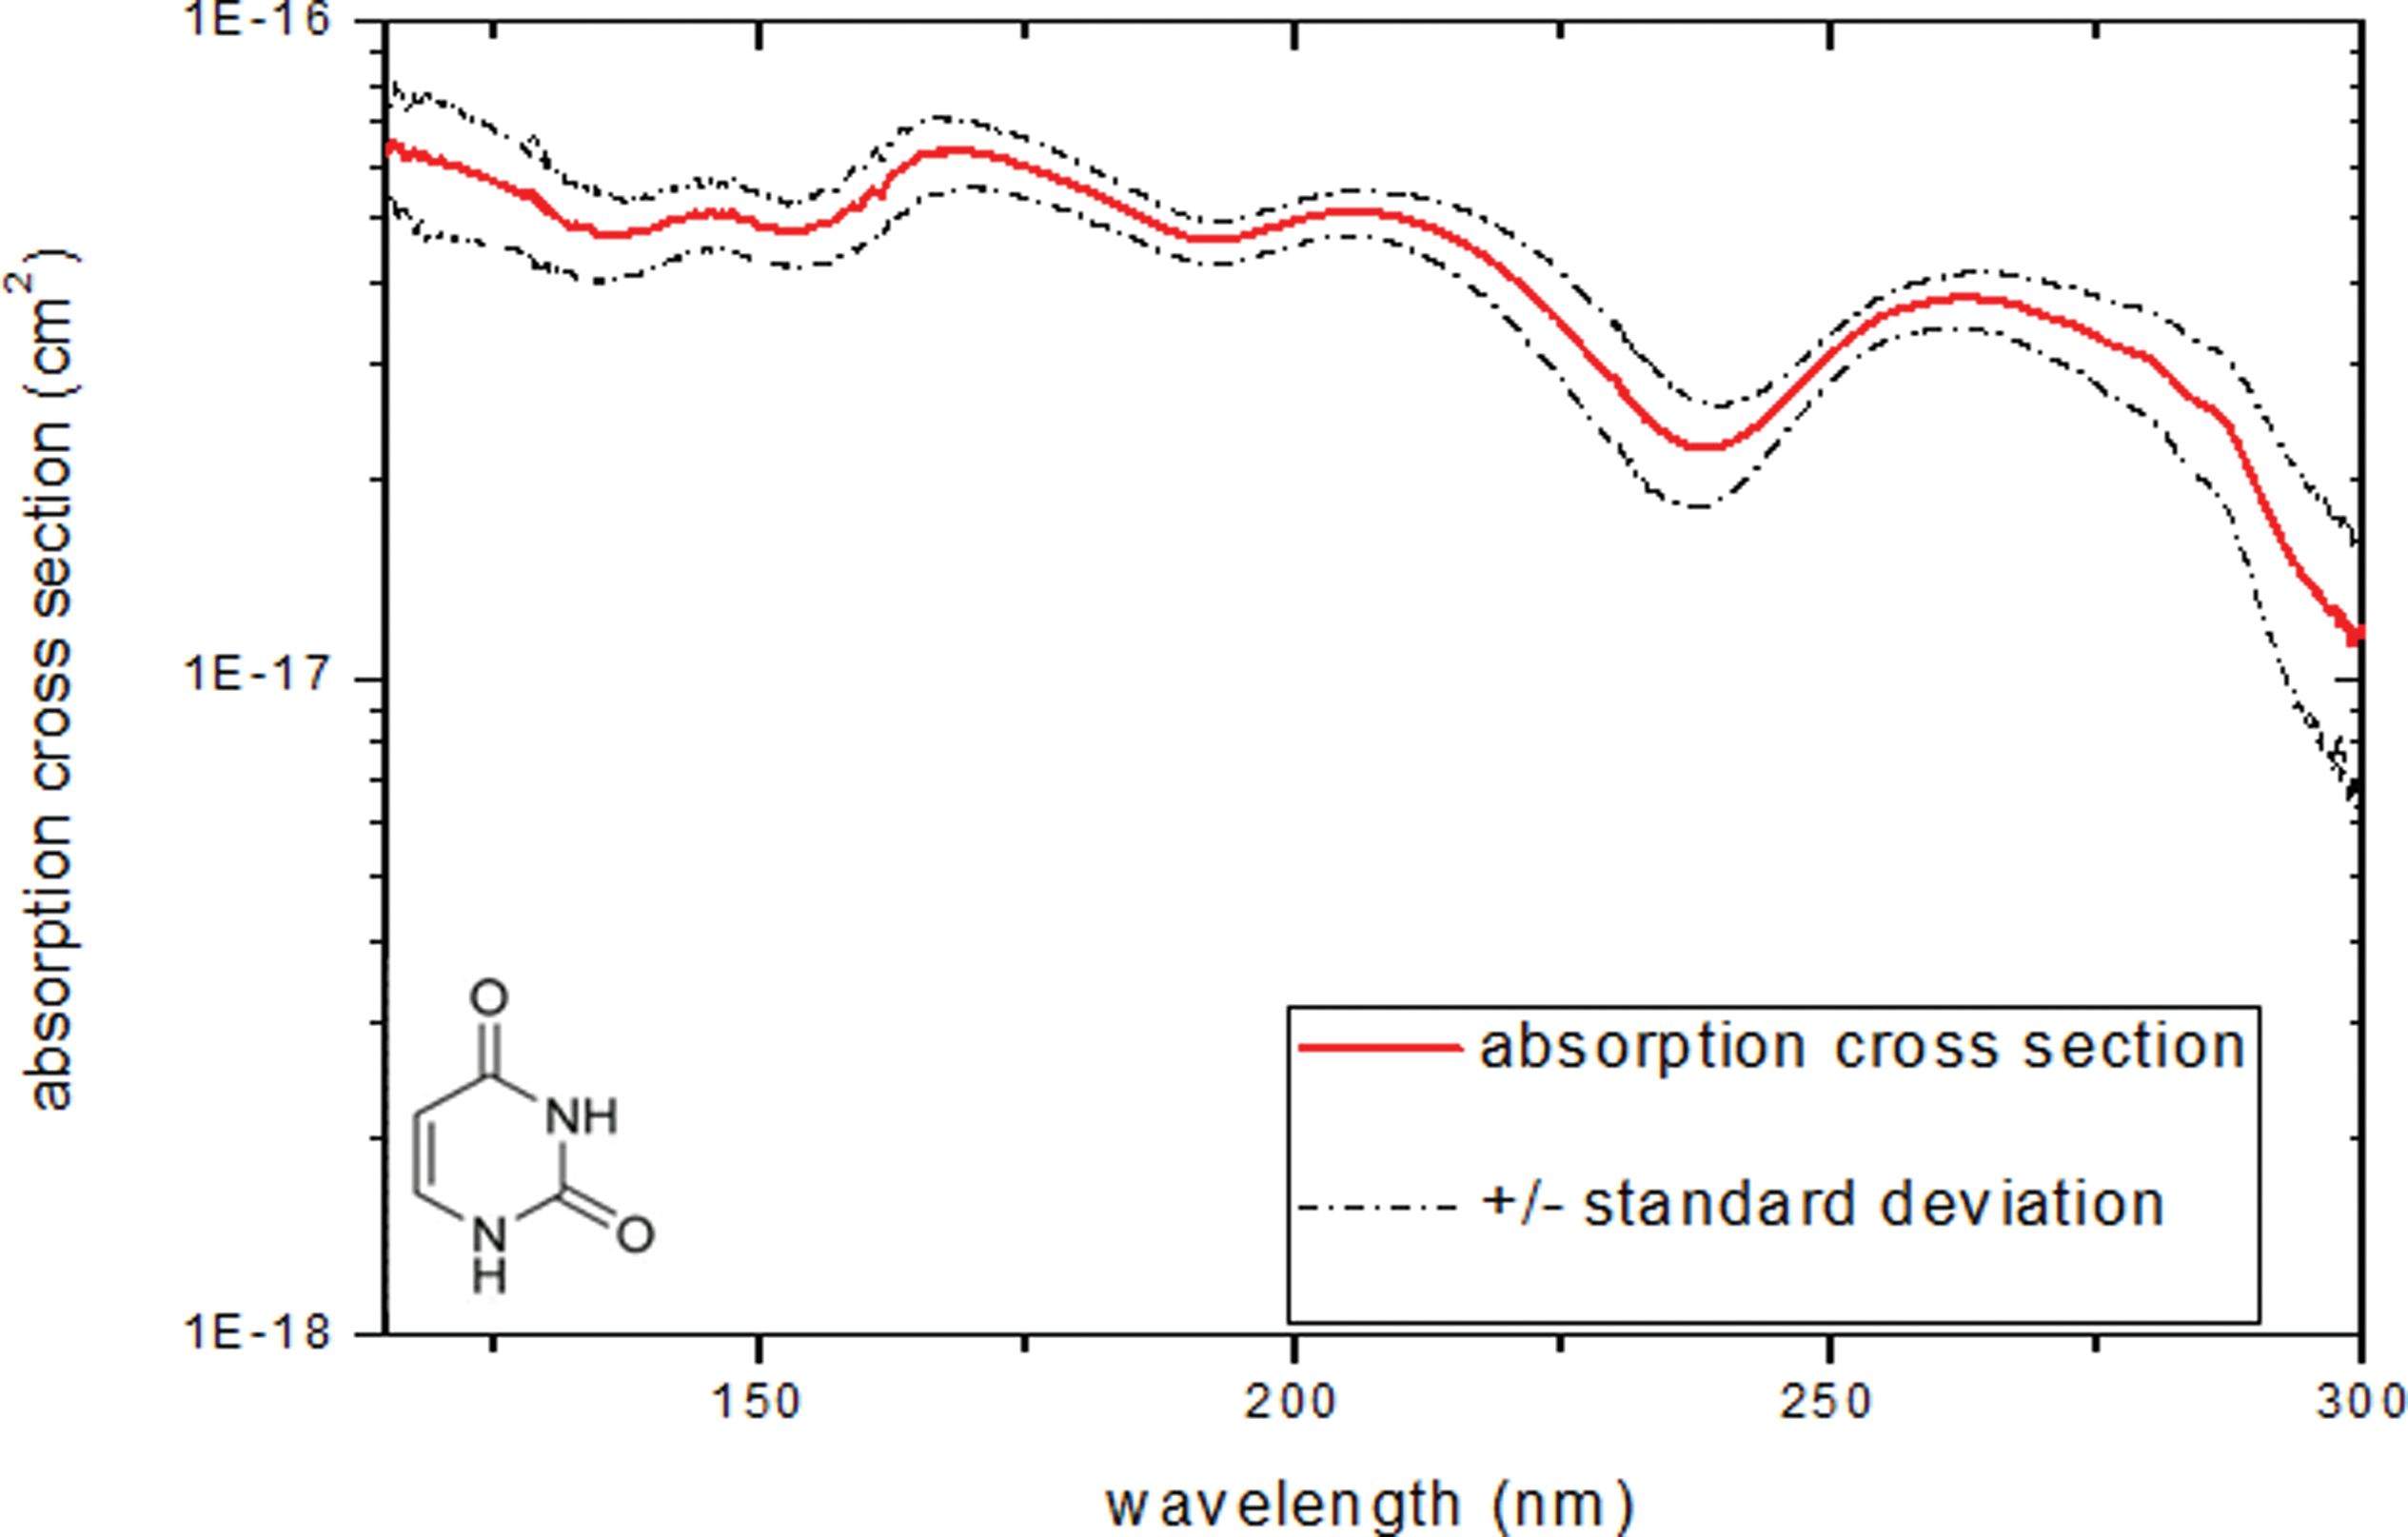
Absorption cross section (cm2) of uracil sample (from 115 to 300 nm). (Color graphics available at
The absorption bands centered at 145, 179, 210, and 265 nm are π→π* transitions (Yamada and Fukutome, 1968; Brady et al., 1988).
4. Application to Photochemistry in Extraterrestrial Environments
The photolysis of a molecule can be written as
with A being a molecule and “products” the resulting photoproducts.
The kinetics of a photolytic process can be derived either from a measurement of the absorption cross section of a molecule, such as the one depicted in the previous sections of this paper, or from a direct dedicated photolysis experiment. The two methods, both with advantages and limitations, are discussed in this section.
4.1. Photolysis kinetics calculation from an absorption cross-section spectrum
Photolysis constant J can be calculated by using Eq. 5.
with I(λ) the solar spectral irradiance (photons·cm−2·s−1·nm−1) as a function of λ. The solar spectrum used is ATLAS 1 (solar activity close to its minimum), given by Thuillier et al. (2004).
Respectively, σ(λ) and φ(λ) are an absorption cross section in square centimeters and the photodissociation quantum yield as a function of wavelength. These two data are intrinsic properties of the molecule and can be measured experimentally in the laboratory. However, photodissociation quantum yields are difficult to measure, and a very limited amount of data is available in the literature. With no published value for guanine and uracil, a rough approximation can be assumed: φ is equal to 1 in the range where photodissociation occurs and 0 above.
Figure 14 shows how photolysis constant J of solid state guanine can be calculated for a solar UV exposure and how it varies as a function of the assumed wavelength photodissociation limit.
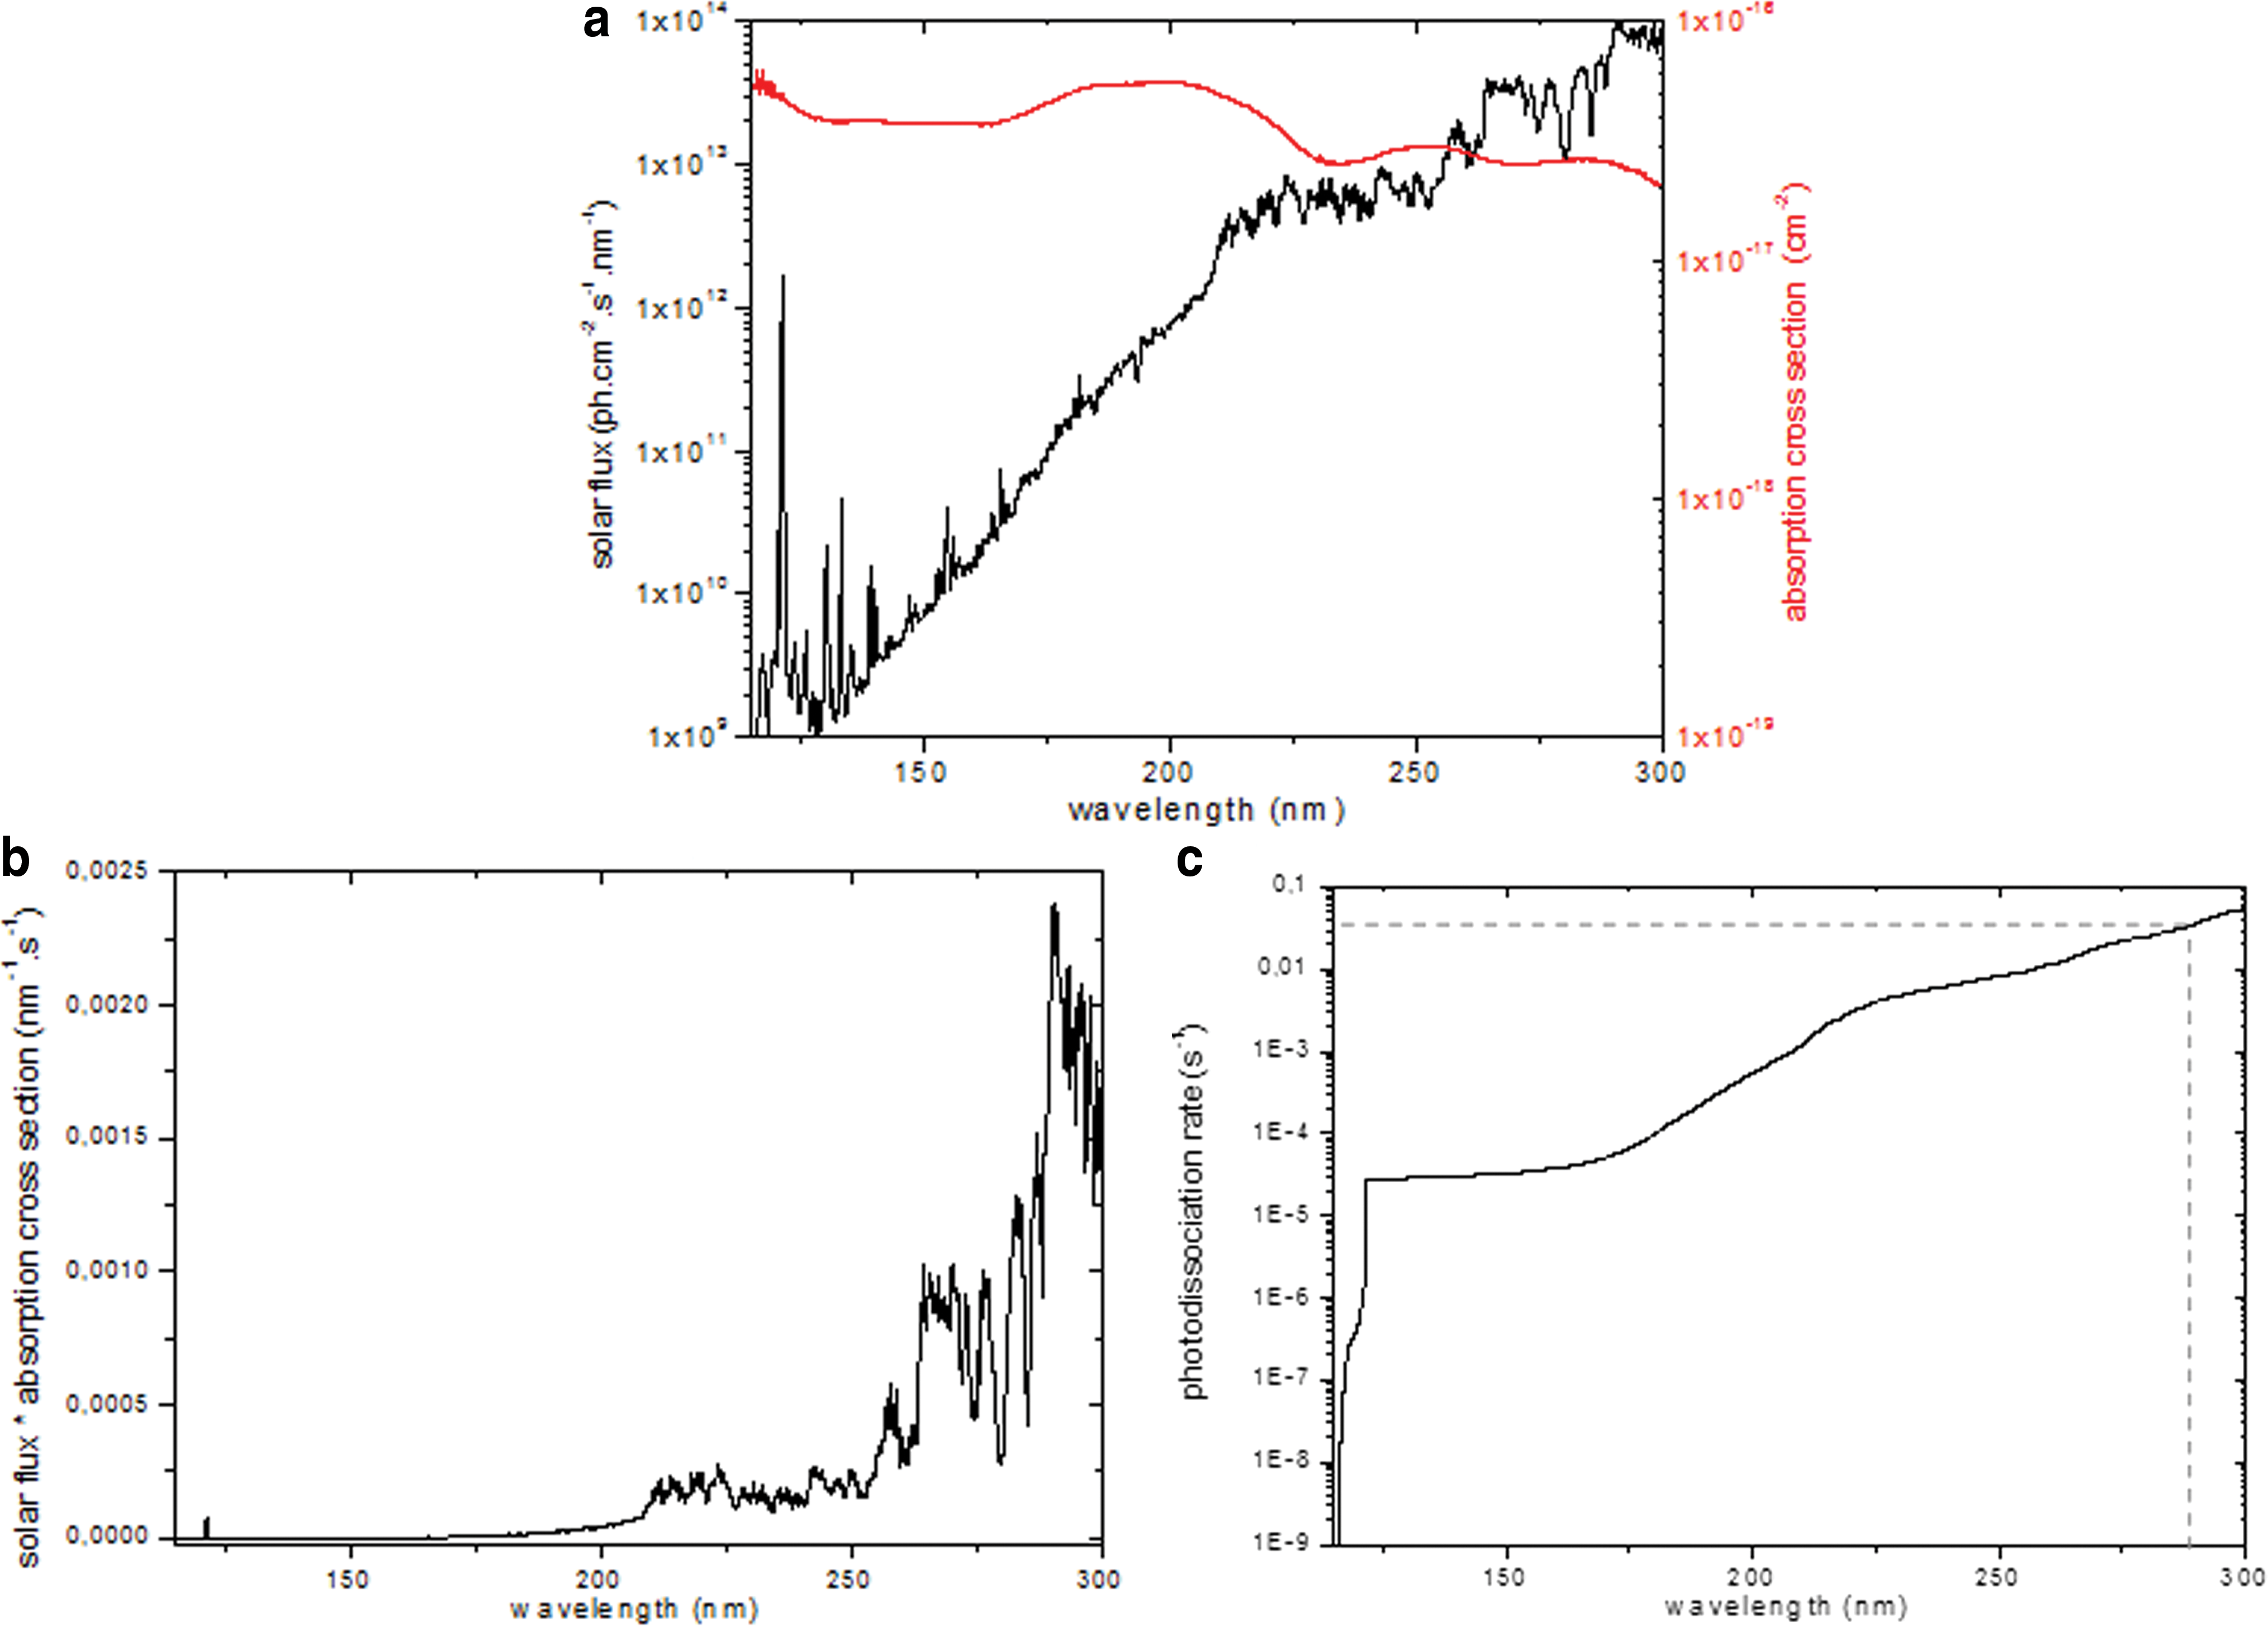
(
To calculate J, it is necessary to define a threshold photodissociation.
In adenine, a molecule with a structure close to guanine, it has been shown that out-of-plane deformation of NC double bonds of the six-membered ring occurs above 275 nm and dissipates photons' energy, which confers intrinsic photostability above this wavelength. Therefore, the abstraction of hydrogen atoms and the opening of the cycle are predicted to be in lower wavelengths (Perun et al., 2005). In the case of guanine, such a measurement is not available in the literature; however, considering the chemical proximity between the two structures, we assume that the photodissociation threshold is also not far from 275 nm. The guanine photolysis constant calculated is then equal to 2.2×10⁻² s−1±11% (Fig. 14b).
Uracil is made of only one heterocycle, while guanine is made of two. The energy dissipation that occurs in uracil is then less effective. The photodissociation threshold of uracil is therefore expected to be higher than for guanine, that is, >275 nm. Lapinski et al. (1990) conducted photolysis studies on cytosine, a pyrimidine with a structure similar to uracil, at wavelengths above 295 nm. These irradiations resulted in an intramolecular proton transfer, in other words the breaking of N-H bond. Such a process is called phototautomerization. Molecules are not destroyed as they would be if the cycle were broken (for wavelengths lower than 295 nm), but it is crucial to take this process into account, since all tautomeric forms are not biologically active (e.g., in nucleic acids) (Lapinski et al., 1990). No upper threshold has been reported for this process; thus wavelengths in the whole UV domain might have to be taken into account. Based on these data, additional measurements have been conducted for absorption cross-section spectra in the range of 300–400 nm following the same method as that used at lower wavelengths. These extended spectra were used for the calculation of the uracil photolysis constant (Fig. 15). Table 4 presents the J constant calculated considering these two threshold limits. J (115–295nm) is 50% lower than J (115–400nm). This shows the importance of better constraining the photodissociation threshold; irradiation experiments should be conducted by using cutoff optical filters or a monochromator.

(
4.2. Photolysis experiment
4.2.1. Photolysis kinetics calculation from a dedicated irradiation experiment
A common approach to study the photostability of organic molecules is to irradiate them in a vacuum reactor connected to a UV lamp, such as a microwave-powered H2 or H2/He-flow lamp, which delivers an emission spectrum dominated in the VUV by the Lyman α band and a wide molecular transition centered at 160 nm (Warneck, 1962; Cottin et al., 2003). Also, irradiation experiments can be conducted in LEO where samples are exposed to the Sun itself (Ehrenfreund et al., 2007; Guan et al., 2010; Bertrand et al., 2012; Cottin et al., 2012). It has been shown that extrapolation of photolysis measurements conducted in the laboratory to an actual astrophysical environment is quite complicated since laboratory lamps do not simulate faithfully the actual solar emission in the entire VUV/UV range, a point of crucial importance for molecules absorbing in the whole VUV/UV domain (Guan et al., 2010).
If the sample is optically thin, the decrease of the molecule's number [A]
t
follows a first-order kinetic (Eq. 6).
where J (s−1) is the photodestruction constant related to the kinetics of the reaction, [A] is the number density of A (cm−3), and t is the time of irradiation (s).
The integration of Eq. 6 leads to
The decrease of A can be followed by IR spectroscopy, and J is then experimentally determined by way of Eq. 7.
An upper limit for guanine's photolysis constant measured from a LEO experiment has been estimated to 1.9×10⁻⁷ s−1 (Guan et al., 2010).
4.2.2. Limits
To measure J experimentally, the photolysis reaction has to follow a first-kinetic reaction. This is the case when the sample is optically thin, in other words, when the intensity of the beam transmitted by the sample corresponds to 90% of the incident beam.
The thickness of such a sample can be deduced from the absorption cross section of a molecule by using Eq. 8 derived from the Beer-Lambert law:
with z the thickness of the sample (cm) and σ the absorption cross section of the molecule (cm2).
Figure 16 shows the absorption cross-section spectra of guanine between 115 and 300 nm, uracil between 115 and 400 nm, and the thickness under which the sample can be considered as optically thin.

(
According to Fig. 16, a guanine and a uracil film considered to be optically thin must be under 2 nm in the range between 115 and 300 nm. Above this thickness, the sample will be considered optically thick, which means that photon flux reaching molecules located on the upper layers of the deposit is significantly greater than that reaching molecules located in the lower layers. In this case, J cannot be measured experimentally as described in Section 4.2.1.
Table 5 presents J results for guanine (i) derived experimentally from sample irradiation in LEO (“LEO J”) and (ii) derived from the absorption spectra as shown in Section 4.1 (“Sigma J,” sigma meaning the absorption cross section σ).
“LEO” guanine is from samples exposed during a UVolution space experiment. “Sigma” guanine is guanine samples of the work presented in this article.
The two constants differ by 5 orders of magnitude. The same kind of result is reported in the case of adenine by Saïagh et al. (2014). This difference is explained by limitations in both “sigma” and “LEO” methods. First, “Sigma J” was calculated assuming the photodissociation quantum yield as equal to 1 in the whole wavelength range. But other processes are involved and are of prime importance, especially in the solid phase. Indeed, after absorbing a photon, the excited molecule can progress toward dissociation, but it can also be de-excited by releasing energy excess via fluorescence and, most crucial in a solid state, collision with adjacent molecules in the film. Thus, the dissipation of the energy received in a solid sample is very effective. Thus “Sigma J,” given in this work, overestimates the actual photodissociation rate. Furthermore, because of their proximity, photofragments can easily recombine, which has the effect of slowing down the destruction of the sample. The “Sigma J” estimation does not take into account the effect of this last process. Comprehensive modeling of such a system should include fluorescence, dissociation, and recombination of the molecule. On the other hand, all those mechanisms are integrated in the measurement of J during irradiation experiments on a sample, such as is the case of “LEO.” For guanine, “LEO J” was measured by irradiation of a sample of approximately 300 nm (Guan et al., 2010), which is consequently optically thick (Fig. 16). Guanine molecules in the film are therefore not irradiated uniformly; in fact, molecules located at the top of the deposit receive more energy than the deeper layers and thus form a kind of photochemical protective shield for deeper layers. The destruction rate was calculated, considering that the sample was optically thin, and thus was underestimated. The radiative transfer that occurs in this kind of deposit has to be taken into account and modeled to deduce the sample photochemical lifetime. Such understanding and modeling are beyond the scope of this paper and will be addressed in the near future. No photolysis data were found concerning uracil, but such data would undoubtedly lead to the same observations.
5. Conclusions
This work was performed in the context of a photostability study of solid nitrogen compounds under Solar System conditions, that is, submitted to energetic VUV/UV radiation (λ <300 nm). For such a photochemical study, it was necessary to know the absorption cross-section spectrum of the molecule and its photolysis constant J. Two molecules were considered: the pyrimidine uracil and the purine guanine, which are organic pillars of genetic material.
The absorption cross sections of solid guanine and uracil were measured: these two molecules were significantly absorbing UV and VUV photons (λ≤300 nm), which highlights the importance of taking into account this entire range during laboratory irradiation experiments. From their spectra, photolysis constants were measured for the two molecules: 2.2×10⁻² s−1±11% for guanine and 5.3×10⁻² s−1±14% for uracil, corresponding to a half-life time of about 10 s.
However, these data are not sufficient to simulate the actual photodestruction rate of a solid film. In fact, in solid state, recombination processes are of prime importance but are not reflected in J calculated from the absorption spectra. It is then necessary to take into account the evolution of the chemical microsystem, which is the case when a sample is irradiated in laboratories or LEO. We assume that the sample is optically thin, and therefore we use first-order kinetics. But this work has brought clarity to this issue. Indeed, the thickness of an optically thin guanine or uracil sample was calculated from the absorption cross-section spectra; both must be less than or equal to 2 nm on the UV/VUV range. This is much thinner than samples used for laboratory or LEO experiments. To evaluate the photodestruction lifetime of a wide range of organic film thicknesses (for instance, at the surface of a cometary grain), comprehensive modeling of radiative transfer in intermediate or thick samples has to be developed. This will integrate the absorption cross sections calculated in this paper. Moreover, in the future, the interaction between minerals and organic matter will be considered in that they can impact our understanding of the kinetics of photolysis (Fornaro et al., 2013).
Footnotes
Acknowledgments
This work has been supported by CNES (Centre National d'Etudes Spatiales, French space agency) in the frame of the EXPOSE International Space Station program, IPSL and LISA. K.S. was supported by a grant from the Region Ile de France. Cyril Gorny (ENSAM, Paris) provided a useful support for surface stylus profilometer.