
Abstract
Most of the phyllosilicates detected at the surface of Mars today are probably remnants of ancient environments that sustained long-term bodies of liquid water at the surface or subsurface and were possibly favorable for the emergence of life. Consequently, phyllosilicates have become the main mineral target in the search for organics on Mars. But are phyllosilicates efficient at preserving organic molecules under current environmental conditions at the surface of Mars?
We monitored the qualitative and quantitative evolutions of glycine, urea, and adenine in interaction with the Fe3+-smectite clay nontronite, one of the most abundant phyllosilicates present at the surface of Mars, under simulated martian surface ultraviolet light (190–400 nm), mean temperature (218±2 K), and pressure (6±1 mbar) in a laboratory simulation setup. We tested organic-rich samples that were representative of the evaporation of a small, warm pond of liquid water containing a high concentration of organics. For each molecule, we observed how the nontronite influences its quantum efficiency of photodecomposition and the nature of its solid evolution products.
The results reveal a pronounced photoprotective effect of nontronite on the evolution of glycine and adenine; their efficiencies of photodecomposition were reduced by a factor of 5 when mixed at a concentration of 2.6×10⁻² mol of molecules per gram of nontronite. Moreover, when the amount of nontronite in the sample of glycine was increased by a factor of 2, the gain of photoprotection was multiplied by a factor of 5. This indicates that the photoprotection provided by the nontronite is not a purely mechanical shielding effect but is also due to stabilizing interactions. No new evolution product was firmly identified, but the results obtained with urea suggest a particular reactivity in the presence of nontronite, leading to an increase of its dissociation rate. Key Words: Martian surface—Organic chemistry—Photochemistry—Astrochemistry—Nontronite—Phyllosilicates. Astrobiology 15, 221–237.
1. Introduction
T
The planet Mars, which is smaller than Earth, quickly dissipated its internal energy, and its tectonic activity declined after a few hundred million years (Albarede, 2009), which aided in preservation of very ancient geological formations (older than 3.8 Ga) to the present (Solomon et al., 2005). Orbital analyses of these ancient geological formations, which constitute about 50% of the surface (Tanaka et al., 2013), show that early Mars could have experienced all the conditions required for the emergence of life, especially liquid water. The latter is revealed by the presence of geomorphological (valley networks, sedimentary formations) and geochemical (hydrated minerals) records, in particular phyllosilicates (Bibring et al., 2006; Fassett and Head, 2008; Westall et al., 2013). Consequently, an ambitious exploration program aims to characterize the past habitability of Mars and search for evidence of extinct or extant life on its surface and subsurface (Vago et al., 2006; Hoehler and Westall, 2010; Mustard et al., 2013). The search for organic molecules is the key feature of this exploration program, because in situ detection of indigenous organics could provide clues of life (biomolecules) or habitable conditions (presence of building blocks of life, i.e., molecules related to prebiotic chemistry) on present or ancient Mars (Parnell et al., 2007). The NASA Curiosity rover has been in search of organic molecules in Gale Crater since August 2012. The ESA ExoMars 2018 rover, along with the Mars 2020 rover, will pursue this search for organics in other landing sites of interest in the near future. Thus, the detection of organic molecules is one of the most challenging goals of the exploration of Mars.
While space missions to Mars have investigated relatively young martian geological formations but have not succeeded in detecting organics, recent advances in landing technology will enable future missions to analyze ancient martian formations in which hydrated minerals that indicate a watery past have been detected from orbit. Among them, phyllosilicates are exciting targets because they are known to concentrate and preserve organics on Earth, even in oxidizing environments (Bonaccorsi, 2011). Because of their lamellar structure (see Fig. 2), phyllosilicates offer a high surface of contact for organic molecule adsorption, not only around the mineral grains but also inside the grains, in the interlayer space. Thus, on Earth, smectite-type phyllosilicates play a fundamental role in the burial and preservation of organic matter in sedimentary basins (Kennedy et al., 2002). Because these minerals could represent our best chance to find evidence for ancient habitability or life preserved on Mars, phyllosilicates narrow the options for landing site selection for missions devoted to the search for organics.
The environmental conditions at the surface of Mars, however, have dramatically changed since the early climatic conditions that favored the formation of the phyllosilicates and the embedding of organic molecules in their mineral matrix. At present, and over the course of the past 3 billion years, UV radiation from the Sun with wavelengths down to 190 nm (Kuhn and Atreya, 1979) and energetic particles (Dartnell et al., 2007; Pavlov et al., 2012) have penetrated to the surface of Mars, which may have brought about the evolution of organic molecules via direct photolysis and/or oxidation processes (Zent and McKay, 1994). It is therefore essential to understand the chemical evolution of organic molecules potentially produced or brought to the surface of Mars in this particular environmental context. Several studies have already focused on the evolution of pure organic molecules under simulated martian surface conditions (Oro and Holzer, 1979; Stoker and Bullock, 1997; ten Kate et al., 2005, 2006; Schuerger et al., 2008; Stalport et al., 2008, 2009, 2010; Hintze et al., 2010; Johnson and Pratt, 2010; Gerakines and Hudson, 2013; Poch et al., 2013, 2014), but fewer have assessed the influence of the mineral matrix (Garry et al., 2006; Shkrob and Chemerisov, 2009; Shkrob et al., 2010; Stalport et al., 2010). The radiation source we focused on for this study was the UV radiation that reaches the surface of Mars. As previously mentioned, photons of wavelengths shorter than 190 nm are efficiently absorbed by the 95% of carbon dioxide present in the martian atmosphere (Kuhn and Atreya, 1979; Patel et al., 2002). The absorption cross section of carbon dioxide (10−23 cm2 at 195 nm) is even higher at lower wavelengths (10−18 cm2 at 130–150 nm and 10−17 cm2 around 98–120 nm) (Kuhn and Atreya, 1979; Huestis et al., 2008). Also, some studies have shown that X-radiation does not penetrate efficiently through the martian atmosphere, even though it is thin (Smith et al., 2004; Smith and Scalo, 2007; Jain et al., 2012). So virtually no photon of wavelength shorter than 190 nm reaches the surface of Mars, except gamma-rays and other high-energy heavy particles from cosmic rays (Dartnell et al., 2007). Some studies have investigated the influence of energetic particles on the evolution of organics at the surface of Mars (Kminek and Bada, 2006; Gerakines and Hudson, 2013). The results show that these radiations can cause the degradation of simple organic molecules (glycine) on a timescale of hundreds of millions of years, while UV radiation acts on a much shorter timescale (several days to months) (see for example Poch et al., 2014). On the other hand, higher-energy radiation can penetrate deeper into the soil (up to around 2 m) than UV radiation (up to a few microns or millimeters).
Because phyllosilicates are presently the main mineral target for the search for organics on Mars, it seems essential to test the processes organic molecules might have undergone in these preferential mineral matrixes. Consequently, the present study is the first to consider the evolution of organic molecules in interaction with phyllosilicates under simulated martian surface conditions. Simulations were carried out with the Mars Organic Molecules Irradiation and Evolution (MOMIE) experimental setup (Poch et al., 2013), which reproduces the UV radiation environment at the surface of Mars (from 190 to 450 nm) along with the mean martian temperature and pressure (respectively 218±2 K and 6±1 mbar). We studied the evolution of glycine, adenine, and urea, three water-soluble molecules representative of endogenous and exogenous sources at Mars, in the presence of Fe3+-nontronite. Nontronite is an iron-rich smectite clay (Palchik et al., 2013) whose spectral signature is widespread at the surface of Mars (Mustard et al., 2008; Ehlmann et al., 2011, 2013), especially on the flanks of the central mount of Gale Crater in the form of a deposit tens of meters thick (Milliken et al., 2010; Thomson et al., 2011; Poulet et al., 2014). These sedimentary formations constitute the main science objective of the Curiosity rover in its search for organics.
In this context, the present article aims to provide some answers to the following questions: What is the effect of nontronite clay on the evolution of organic molecules under Mars' current environmental conditions? Are clay minerals effective at preserving organic molecules even under martian surface UV radiation during long geological scales? Or did they trigger processes resulting in the destruction of the molecular structures (namely, photocatalysis or stoichiometric oxidation reactions with Fe3+ or HO· from adsorbed H2O, for example)?
2. Materials and Methods
We exposed glycine, adenine, and urea to simulated martian surface conditions in presence of nontronite clay mineral. The simulations were performed with the MOMIE experimental setup. This setup is briefly described in the paragraph below. A more detailed description can be found in the work of Poch et al. (2013).
2.1. Martian surface conditions simulated inside the MOMIE setup
The MOMIE setup allows investigators to simulate the in situ Mars-like UV irradiation and proceed to Fourier transform infrared (FTIR) spectroscopy monitoring of the sample, at a temperature (218±2 K) and pressure (6±1 mbar) representative of the mean conditions at the martian surface.
The studied sample consisted of thin uniform layers (micrometric scale) made of a mixture of nontronite and organics, deposited on a ∼2 cm diameter magnesium fluoride (MgF2) optical window. The samples were prepared via evaporation/sedimentation of a nontronite-organic suspension. The sample preparation method is detailed below (Section 2.2). We also prepared pure organic samples without nontronite, whose preparation and evolution is detailed in the works of Poch et al. (2013, 2014). In the present study, these samples were procedural references used to deduce the influence of nontronite on the molecular evolution. The MgF2 window with the sample was then placed inside the reactor of the MOMIE setup (see Figs. 1 and 2 of Poch et al., 2013). The sample was irradiated with a xenon arc lamp and analyzed by FTIR spectroscopy.
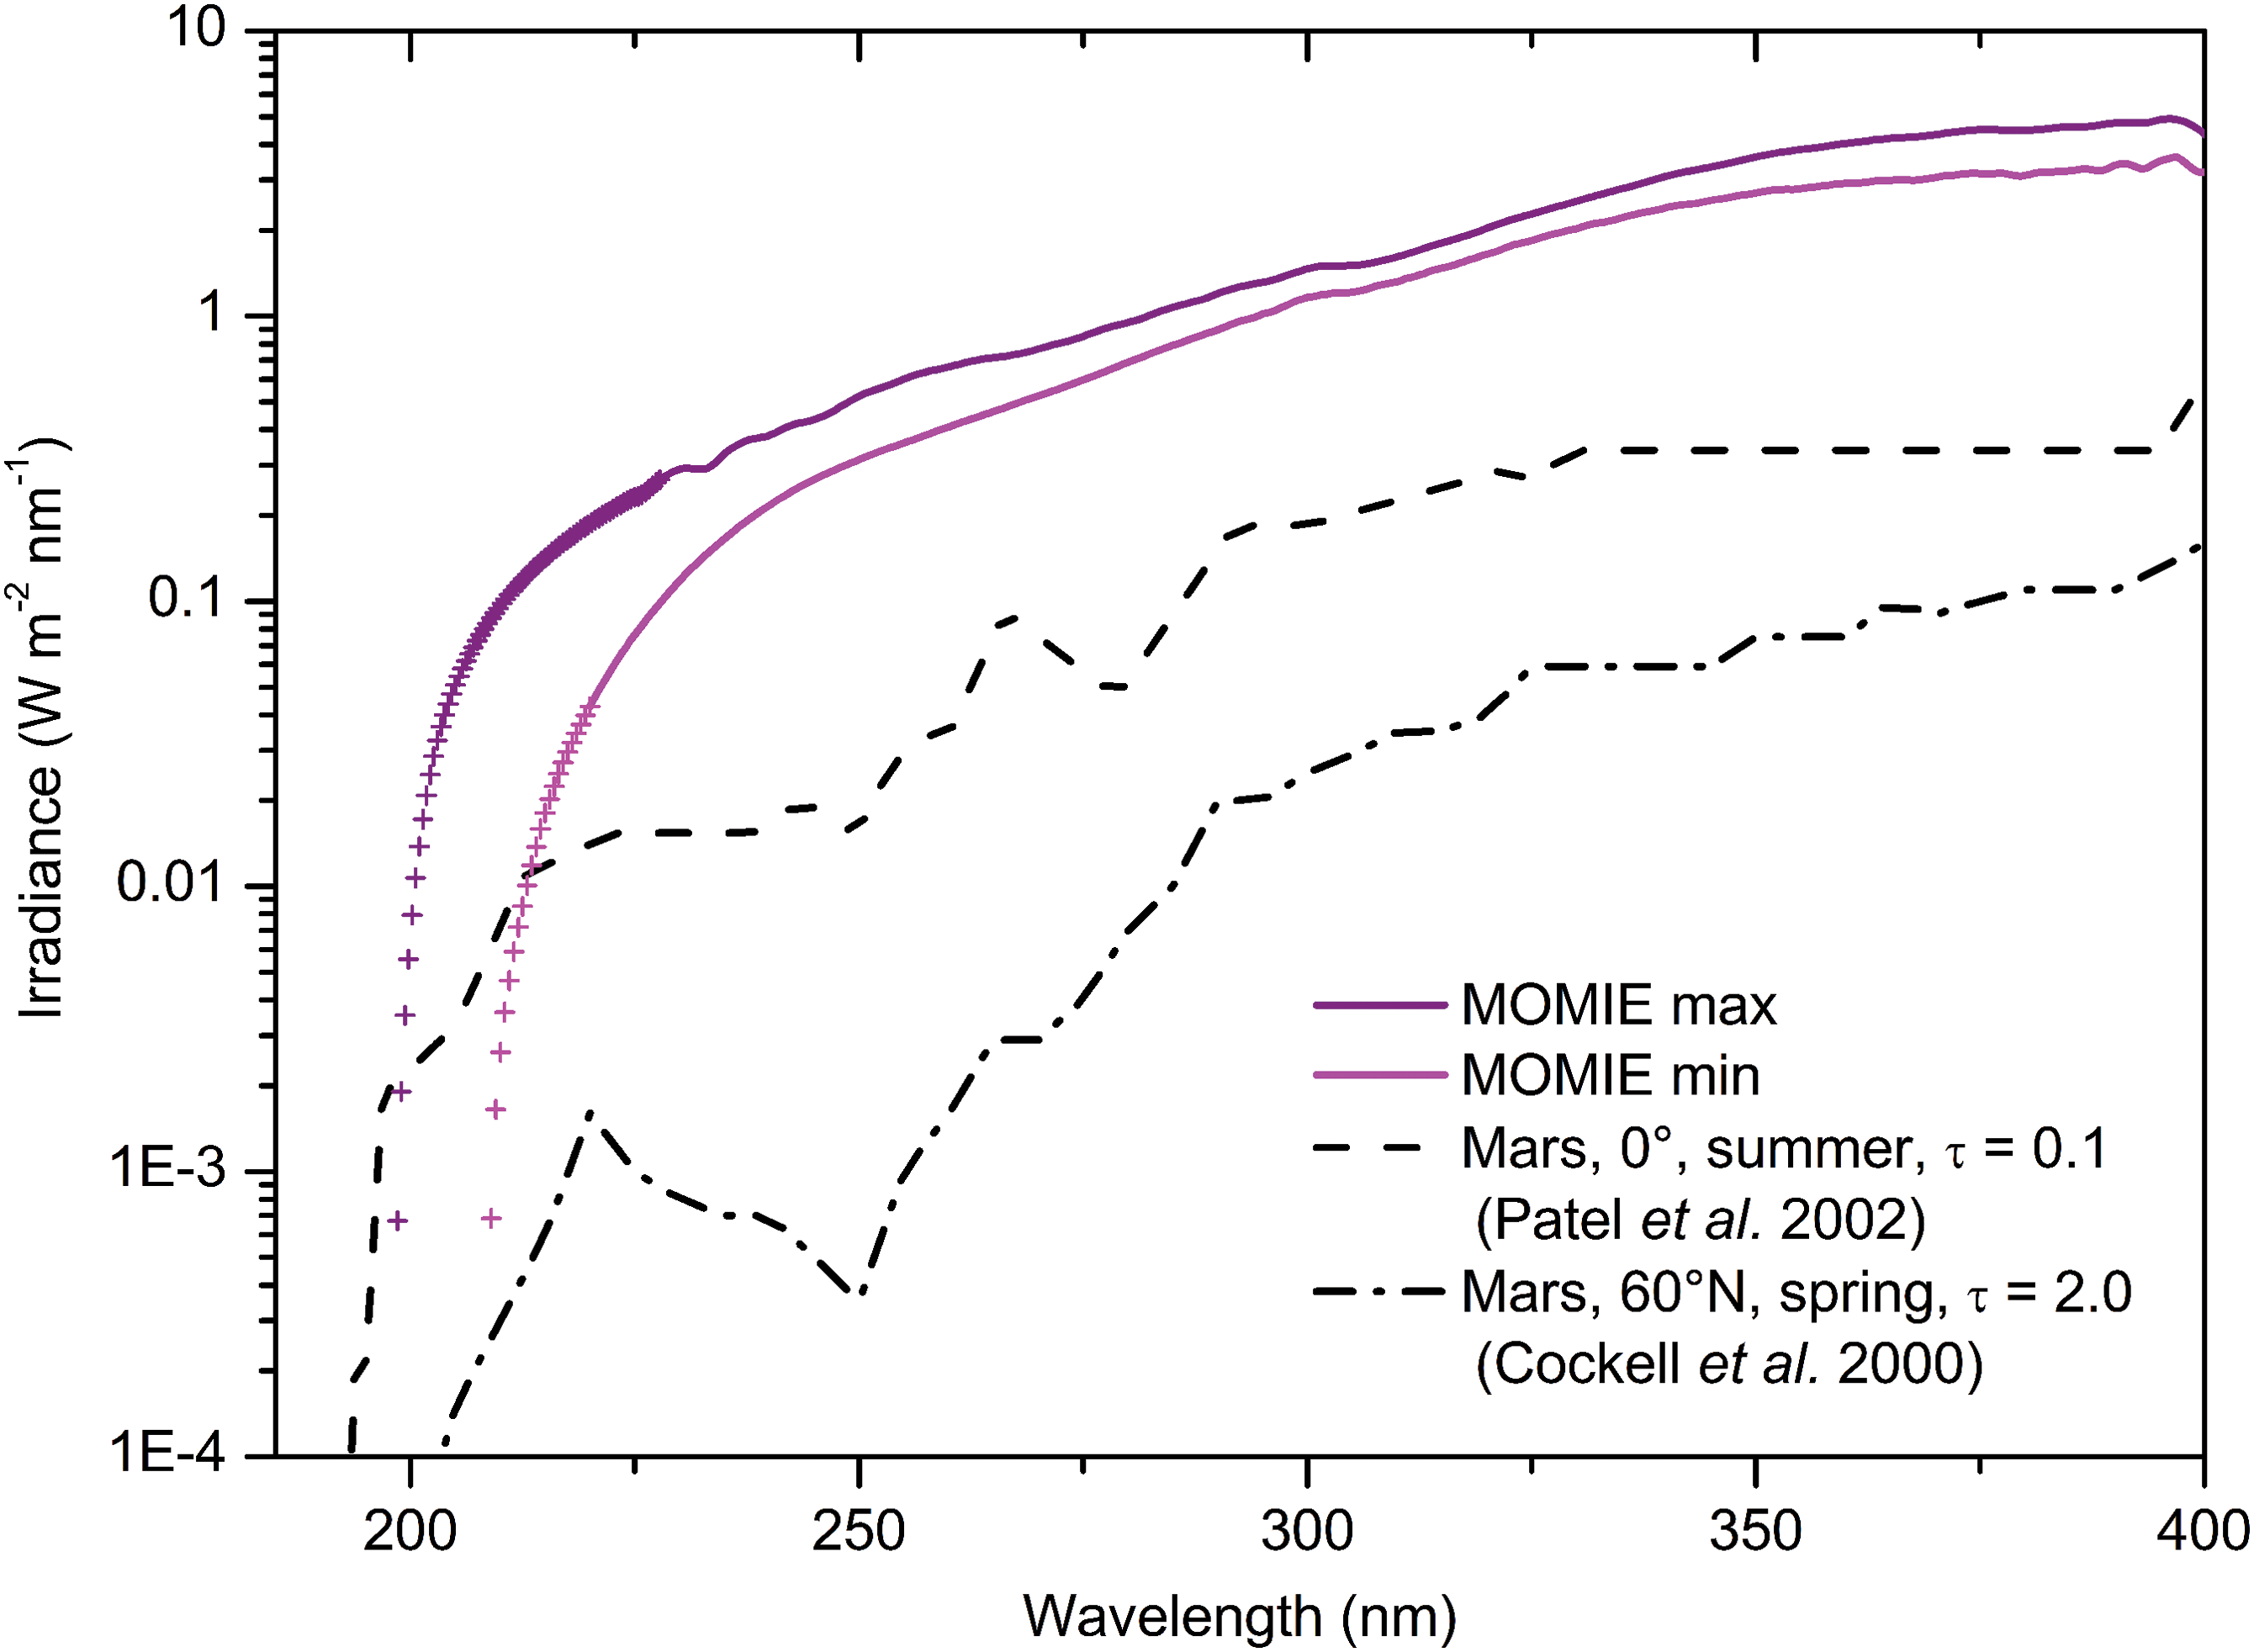
Absolute irradiance spectrum received at the top of the sample in the MOMIE simulation device (solid lines) compared to two theoretical irradiance spectra at the surface of Mars (dotted lines) for two extreme scenarios: (1) during northern summer for low dust loading (τ=0.1), at the equator (0°) and local noon (taken from Patel et al., 2002); (2) during spring (vernal equinox) for a dusty day (τ=2.0), at 60°N and local noon (taken from Cockell et al., 2000). Concerning the measured spectra, both the maximum irradiance (labeled “MOMIE max,” obtained just after the change of the bulb and the cleaning of the optics) and the minimum irradiance (labeled “MOMIE min,” measured on an aged bulb and optical system) are shown (see Poch et al., 2014, Sections 2.2 and 2.3, for a detailed discussion). (Color graphics available at
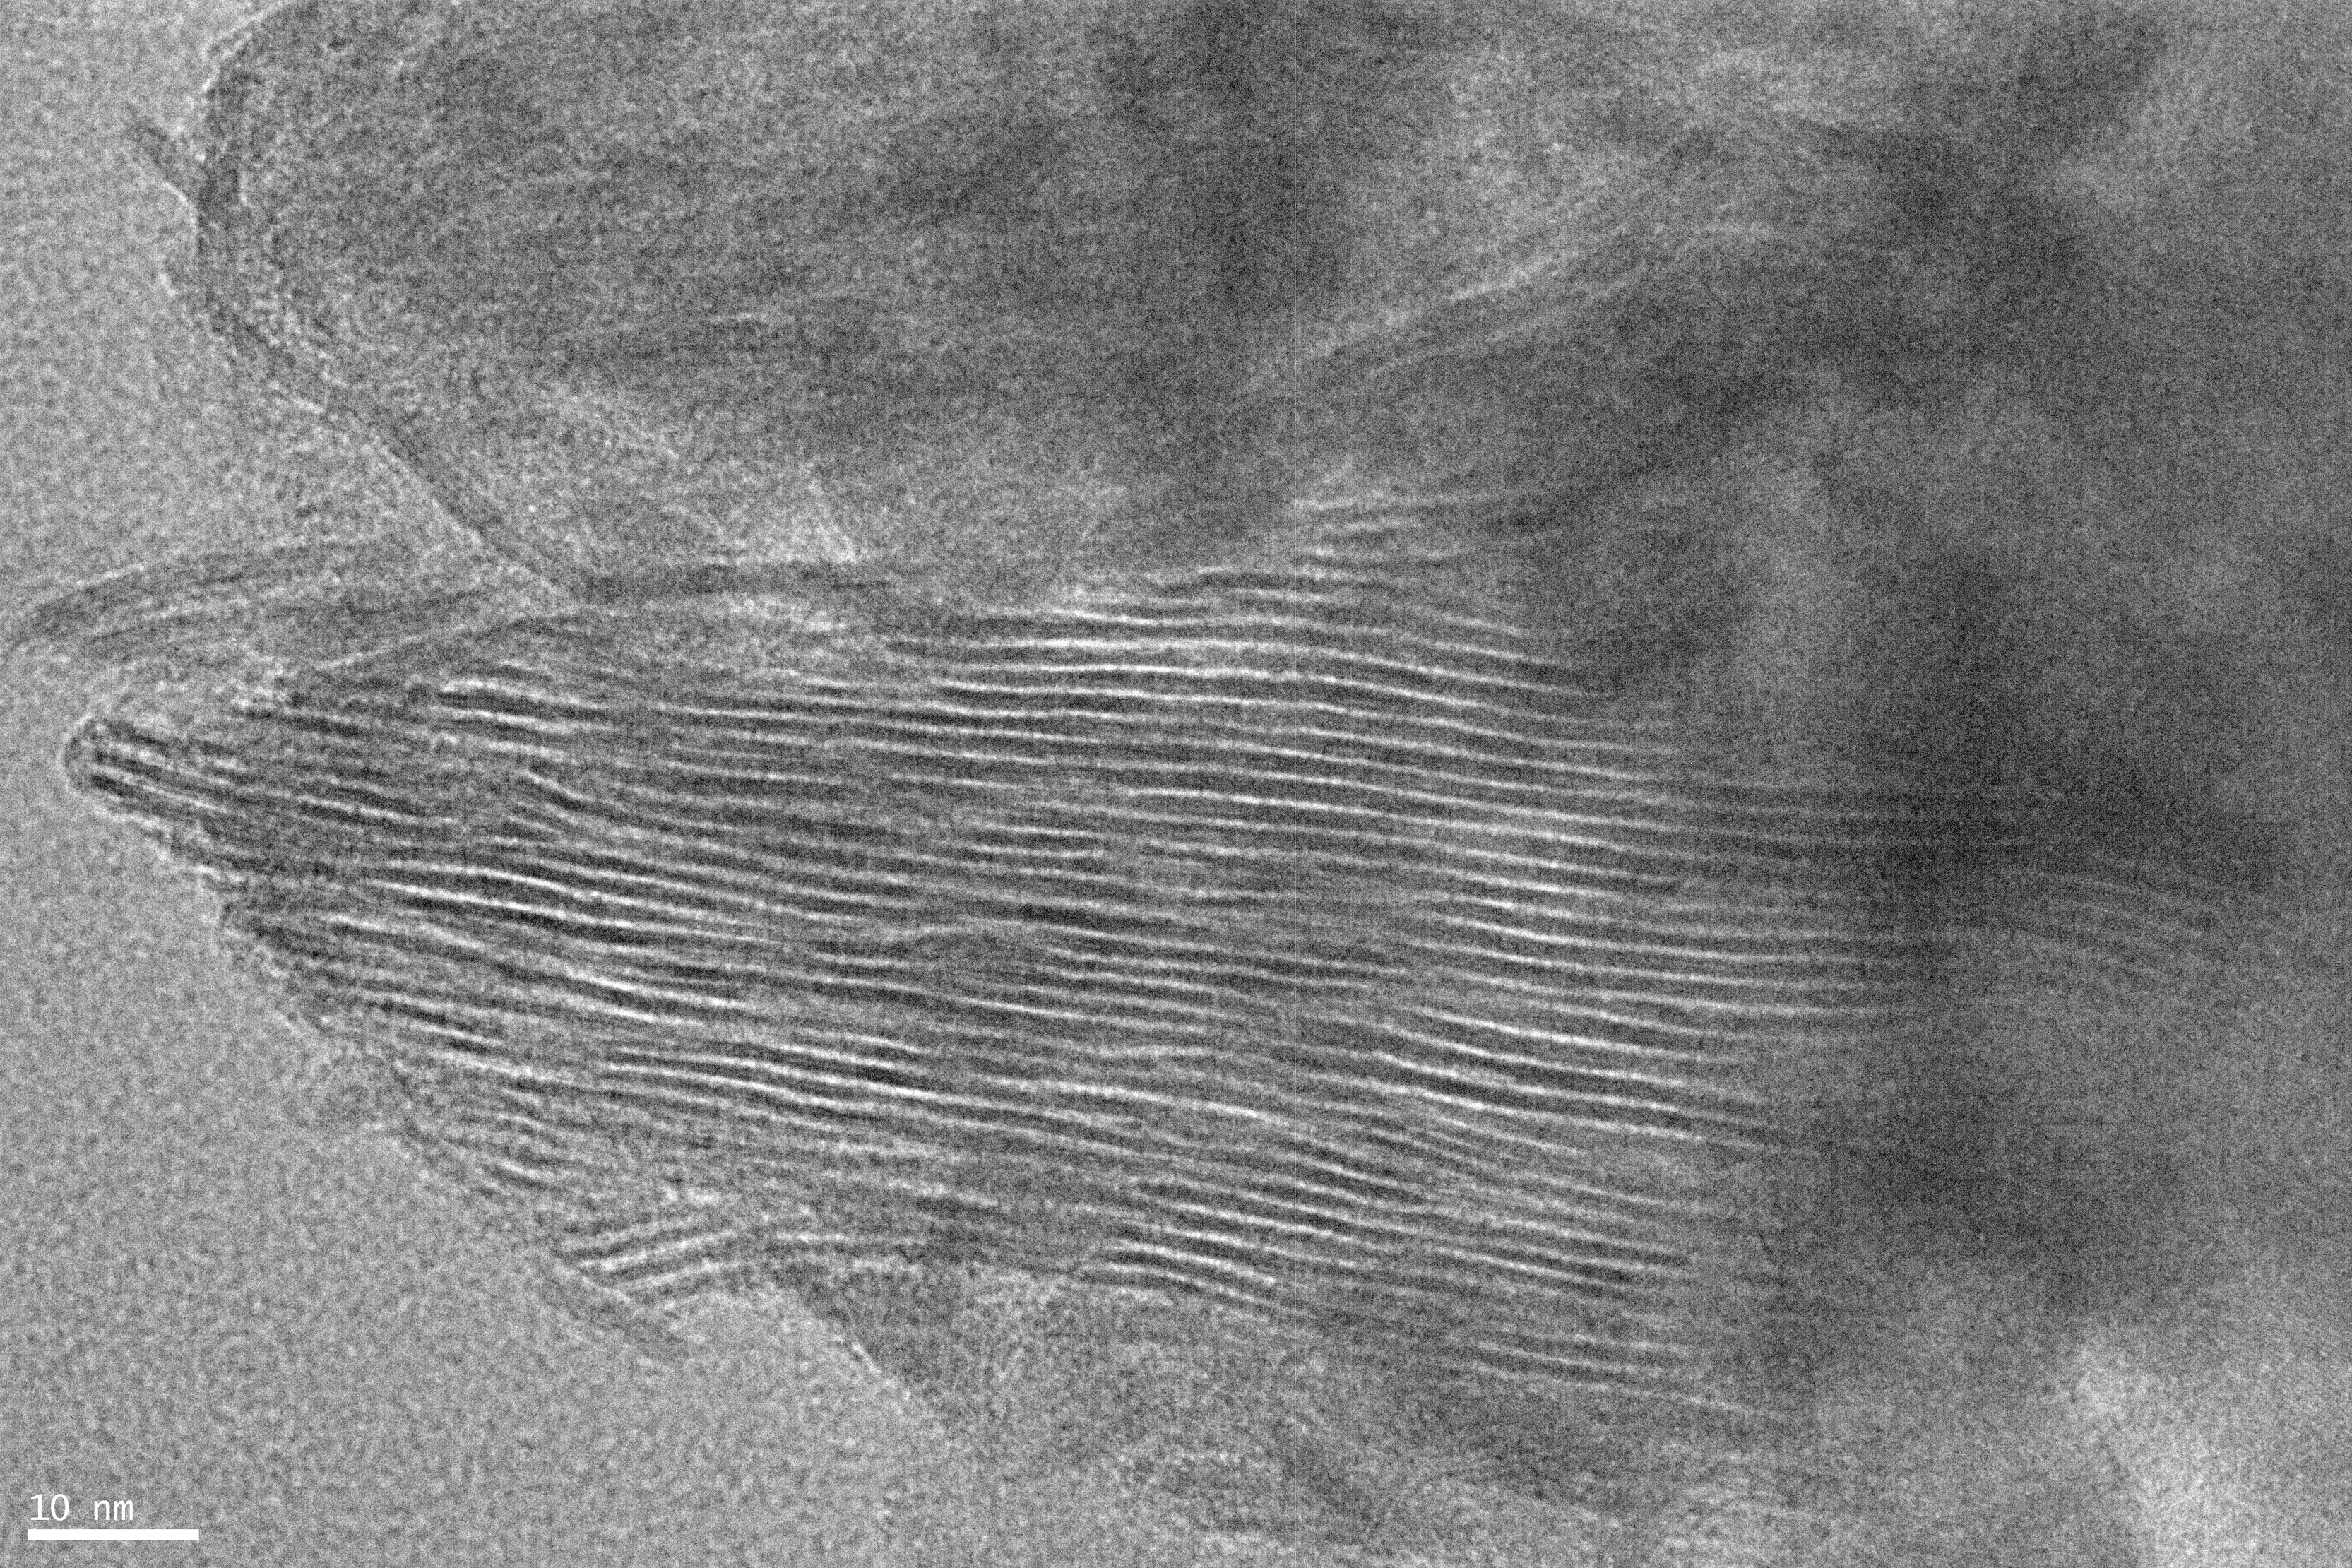
Transmission electron microscope (TEM) image of the synthesized nontronite, showing the layered structure of the clay mineral. The width of the interlayer space is comprised between 1.3 and 1.7 nm. Similar TEM images of samples of nontronite mixed with glycine, urea, and adenine do not show a significant variation of the interlayer spacing.
The whole MOMIE setup was placed in a glove compartment that was purged and overpressurized with N2 (≥99.995 vol % from Linde) to prevent the formation of ozone and water ice. For the duration of an experiment, the reactor was thermostated at 218±2 K with a cryothermostated fluid circulation. It was connected to a pumping system that maintained a pressure of 6±1 mbar of N2. Since a former study by ten Kate et al. (2006) did not show any impact of a representative martian atmosphere of carbon dioxide on the evolution of glycine samples exposed to UV radiation, comparatively to a pure N2 atmosphere, we chose to perform our simulation in a 6 mbar atmosphere of N2.
The lamp delivers UV light with a spectrum similar to that which reaches the martian surface as modeled by Patel et al. (2002) (see Fig. 1). The lamp flux is, however, much higher than that on Mars (see Fig. 1), which allows for simulation of long periods of irradiation on Mars in reasonable lapse time in the laboratory. The absolute irradiance spectrum shown in Fig. 1 was measured at the sample location inside our simulation setup in the 190–400 nm wavelength range with a radiocalibrated UV spectrometer (Black Comet C50, from StellarNet Inc., USA). An integrating sphere was substituted for the sample to proceed to the measurement of the UV flux under a N2 atmosphere. Data in the 200–220 nm range (shown with individual crosses) suffered from uncertainties due to stray light and temperature variations in the spectrometer. Nevertheless, the bulb and lens used were made of fused silica that cuts off the light between 180 and 190 nm, which prevents any photon of higher energy from interacting with our sample. The experimental uncertainties on the amount of photons reaching the samples are taken into account as described in detail in Section 2.3 of Poch et al. (2014). The xenon lamp also generates a large amount of IR photons. We verified that the IR photons received by our sample had a negligible impact on its chemical evolution (see Poch et al., 2013, for more details).
Furthermore, we performed reference experiments to test the stability/sublimation of the studied organic thin films under 6 mbar and 218 K, but without UV irradiation, in our simulation chamber. The results of these reference experiments, shown in Appendix C in the work of Poch et al. (2014), demonstrate that no sublimation of the organic deposits occurred under these conditions. Consequently, the chemical evolution we monitored was only due to the UV photons interacting with our samples.
2.2. Sample description and preparation
Glycine was purchased from VWR BDH Prolabo (98%, ref. n°24403.298), urea from Alfa Aesar (99.3+%, ref. n°036429), adenine from Sigma-Aldrich (adenine≥99%, ref. n°A8626-25G), and each of these three molecules was mixed with nontronite smectite clay. To use a clay mineral free of any organic contamination contained in terrestrial natural samples, nontronite was synthesized from organic-free bulk chemicals (including silica, iron, and aluminum sources) via hydrothermal synthesis according to Andrieux and Petit (2010). Iron chloride (97%) and sodium metasilicate (≥99%) were obtained from Sigma-Aldrich, and aluminum chloride (≥99%) was obtained from Fluka. Moreover, the nontronite was cation-exchanged with Fe3+ in order to increase the probability for organic molecules to be oxidized during the simulation. Indeed, phyllosilicates present at the surface of Mars could contain oxidants as Fe3+ or perchlorates, so it is important to assess whether such “oxidant-enriched clays” can still protect embedded organic molecules under martian surface conditions. This cation exchange results in the presence of Fe ions in two very different environments, as substitutional ions in the clay layers and as compensating ions in the interlayer space—the latter being much more accessible. The cation exchange was conducted by suspending the nontronite (20 g L−1) in a 0.5 mol L−1 organic-free solution of iron (III) chloride. Three contacts of 2 h each, followed by filtration, were performed. Nontronite was then washed three times with 100 mL distilled water, separated by centrifugation, and dried at 60°C. The synthesized nontronite was finally characterized by X-ray diffraction (see Supplementary Fig. S1; Supplementary Data are available online at
Samples were prepared so as to maximize the interaction between the organic molecules and the nontronite, with the aim of adsorbing the molecules around but also inside the nontronite grains, in the interlayer space. A 0.3 g L−1 nontronite suspension was prepared in an aqueous high-purity water 8.10−3 mol L−1 solution of the targeted organic molecule (glycine, urea, or adenine) and stirred for more than 2 h. This procedure enables the clay particles to expand their interlayer space, leaving water and organic molecules enough time to diffuse inside the mineral. Finally, the deposition on the MgF2 window was done by evaporation/sedimentation of 1 mL of the aqueous suspension by heating the MgF2 window at 50°C for 35 min. The resulting sample is a homogeneous solid layer of nontronite and organic molecules, ready to be placed inside the MOMIE simulation setup (see Fig. 3a). The samples of glycine, urea, and adenine contained the same number of organic molecules and had a concentration of 2.6×10⁻² mol of organic molecules per gram of nontronite (Table 1).

(
Samples annotated “+nontronite” contain the same mass of nontronite and the same number of each molecule. The sample annotated “+2Xnontronite” contains twice the amount of nontronite.
The concentrations of nontronite and organics were chosen to suit the constraints of the MOMIE setup (the samples have to be sufficiently optically transparent for UV irradiation and IR spectroscopy analyses). This resulted in high organic molecule to mineral mass ratios, from 1:1 to 3:1, depending on the molecule (see Table 1). These amounts of organic molecules definitely exceed those that could be interacting with the mineral phase, even assuming that a dense monolayer is formed on the whole clay surface. Therefore, some organic molecules in our samples were not interacting with the clay phase. This fact has been taken into account for the analyses of the results by comparing the qualitative and quantitative observations from experiments performed in the presence of nontronite to those performed on samples of pure organic molecules, as explained in Section 4.
2.3. Analyses of the samples before, during, and after simulations
Before being placed inside the MOMIE simulation chamber, the deposits of nontronite and organics on the MgF2 windows were imaged with a visible microscope (Fig. 3a) and an interference microscope (WYKO NT1100 Optical Profiling System by Veeco). The interference microscope enabled us to obtain a local topographic map of the sample (Fig. 3b).
X-ray diffraction, X-ray fluorescence, and transmission electron microscopy measurements were performed on the dry solid fraction obtained after the complete evaporation of the suspensions in order to verify the intercalation of the organic molecules inside the interlayer space of the clay (see Section 2.2). The technical details of these measurements can be found in the Supplementary Material document.
Inside the MOMIE simulation chamber, IR transmission spectra of the samples (from 7000 to 1000 cm−1) were acquired in situ throughout the simulations. The IR data allowed us to quantify the photolysis decay of the irradiated molecules by monitoring the decay of absorption bands specific of the studied compound. Alternatively, the emergence of new IR absorption bands indicates the formation of new solid photoproducts during the simulation. Spectra (noted I) were acquired by using a FTIR spectrometer (Spectrum 100 from Perkin Elmer) with 50 scans at a resolution of 2 cm−1. I/I ref ratios were calculated with reference spectra (I ref) obtained under the same experimental conditions with a clean MgF2 sample window.
Ultraviolet transmission spectra were performed ex situ before and after simulation with a “Cary 60” UV-vis spectrometer (Agilent Technologies). They provide information on the evolution of the UV absorption of the samples in the 190–300 nm range.
2.4. Determination of kinetic parameters for organics mixed with Fe3+-nontronite under martian surface UV
Quantitatively, our main objective in this study was to determine whether the interaction of the organic molecules with the Fe3+-nontronite clay would accelerate the degradation of the molecules or if the clay would attenuate the effect of Mars' surface UV irradiation. So we had to compare kinetic parameters obtained after simulations on each targeted organic molecule with and without nontronite. Kinetic parameters of pure glycine, urea, and adenine were determined by Poch et al. (2014), who used the MOMIE setup. These samples consisted of nanometers-thin (10–200 nm) organic deposits obtained by sublimation (heating of the organic powder at reduced pressure) and recondensation on a MgF2 window. By comparison, the samples of nontronite and organics used in the present study were obtained by evaporation/sedimentation (see Section 2.2) and contained approximately 10 times more molecules than the samples studied by Poch et al. (2014). The results presented by Poch et al. (2014) show that the photolysis rates J and half-life times t 1/2 determined from the simulations strongly depend on the initial number of molecules in the sample. Therefore, we did not determine these parameters to compare the evolution of molecules with and without nontronite. Alternatively, we determined the experimental quantum yields of photodissociation in the presence of nontronite, because Poch et al. (2014) showed that for a given molecule these experimental values are independent of the initial number of molecules in the samples. For example, we found similar values of the adenine quantum efficiency of photodecomposition determined after an experiment performed on a sample of adenine about 70 nm thick (1.1±1.0×10⁻⁴ molecule photon−1) and 1300 nm thick (1.0±0.9×10⁻⁴ molecule photon−1), the latter sample containing the same amount of adenine as the one we prepared with nontronite. Therefore, any difference seen in the value of the adenine quantum efficiency of photodecomposition in the presence of nontronite indicates the influence of the mineral on the chemical evolution of adenine. To conclude, quantum yields of photodissociation are molecular data and allow us to assess the influence of the nontronite on the molecular evolution; a lower yield in the presence of nontronite will indicate a photoprotection of the molecule, while a higher yield will indicate a catalytic effect of the nontronite on the photodecomposition of the molecule.
After each simulation, the experimental quantum efficiency of photodecomposition from 200 to 250 nm, Φ exp, was determined. Φ exp is the ratio of the number of molecules photodissociated to the number of photons from 200 to 250 nm reaching the molecular deposit during its irradiation. The details of the calculation of Φ exp in both cases (pure organics or organics mixed with nontronite) are described in the Supplementary Material document.
3. Results
3.1. Characterization of the synthesized nontronite
The X-ray diffractogram of the synthesized mineral (Supplementary Fig. S1a) shows low-intensity diffraction peaks, indicating a low crystallinity of the mineral. Comparison with diffractograms of natural nontronite samples (color bars, Supplementary Fig. S1a) indicates that most of the diffraction peaks of the synthesized mineral match those of natural nontronites; some of them, however, could not be assigned to nontronite. The (001) peak at around 2θ=7° appears poorly resolved, suggesting a heterogeneous stacking of the clay layers. However, transmission electron microscope (TEM) images of the synthesized mineral locally show the layering characteristic of clay minerals (see Fig. 2), with an interlayer width comprised between 1.3 and 1.7 nm. These values are consistent with the fact that the (001) peak is centered at 2θ=7°, corresponding to a mean interlayer space of 1.5 nm. The result of the elementary analysis performed by X-ray fluorescence on the synthesized nontronite allowed us to calculate the following chemical formulae: H+ 0.3Fe0.3 (Fe3+ 2.0)(Si2.8Al1.2)O10(OH)2. To conclude, the synthesized nontronite used in this study was a low crystalline Fe3+-rich nontronite.
3.2. Characterization of the samples of nontronite with organics
An example of a sample obtained from evaporation/sedimentation of a suspension of nontronite and an organic molecule on a MgF2 window is presented in Fig. 3a. The topographic map obtained by interference microscopy (Fig. 3b) shows that the thin layer deposited on the MgF2 window contains grains (aggregates of clay and organics) of all sizes up to 25 μm. The organic molecule is present around, and probably inside, the grains, but also between the grains, in the form of a crystalline layer less than 1 μm thick.
Although the sample preparation protocol should permit the adsorption of the molecules outside (on the layer edges), but also inside the interlayer space of the nontronite clay, the diffractograms (Supplementary Fig. S1b) and TEM images (Fig. 2) of the samples do not show an obvious increase of the interlayer space of the nontronite in the presence of organic molecules. Thus, either the organic molecules were not intercalated or, because of their small size (in the case of glycine and urea) or flat structure (in the case of adenine), they may have been positioned parallel to the clay layers so that they did not produce an obvious difference of interlayer width. To provide more indications on the ways the studied molecules might interact with the nontronite in our samples, we reviewed the published literature in the Supplementary Material.
The nontronite present in the deposit is responsible for a high absorption of UV radiation. The average transmittance of the deposits in the 190–300 nm wavelength range is 38±5 %. The UV transmittance of the samples was not significantly changed after UV irradiation.
The IR transmission spectra of the samples of nontronite mixed with organic molecules (glycine, urea, or adenine) are shown as black lines in Figs. 4a, 6a, and 8a. These spectra show the main IR absorption bands of glycine (Fig. 4a), urea (Fig. 6a), or adenine (Fig. 8a), superimposed on the spectral features due to the nontronite: two absorptions at 3694 and 3617 cm−1 corresponding to stretching vibrations of O-H bonds in the clay structure, and a “blue slope” on the whole spectrum, from 4000 to 1000 cm−1, due to the scattering of the IR beam through the micrometer-thick deposit (see Supplementary Fig. S2). The labels (a, b, c, etc.) shown on each of the absorption bands refer to the assignments of these bands to molecular bond vibrations detailed in Supplementary Table S1 for glycine, Supplementary Table S2 for urea, and Supplementary Table S4 for adenine. Some absorption bands in the 3500–2500 cm−1 wavelength range appear broader or slightly shifted in the presence of nontronite, but no significant shift of the absorption band wavelengths has been spotted for the samples of molecules mixed with nontronite, compared to pure organic samples. However, the IR spectrum of the non-irradiated sample of urea mixed with nontronite shows a very weak absorption band at 1350 cm−1, which is absent in the spectrum of pure urea (see Supplementary Table S2 and Fig. 6a and 6b). According to Mortland (1966), this absorption band could be due to an interaction between the free electrons of the −NH2 groups of urea and the metal cation from the clay mineral (Fe3+ in our case), modifying the CN stretching and the HNH deformation of the amide group.
(
3.3. Evolution of the samples during and after UV irradiation at simulated martian surface conditions
3.3.1. Pure nontronite
We performed a reference experiment that involved UV irradiation of a sample of pure nontronite to discern the evolution of its IR spectrum. This experiment, detailed in the Supplementary Material document, showed that only the IR bands in the 2700–1400 cm−1 range can be used for the processing of the IR spectra and the determination of kinetic parameters of the molecules.
3.3.2. Glycine
3.3.2.1. Qualitative evolution
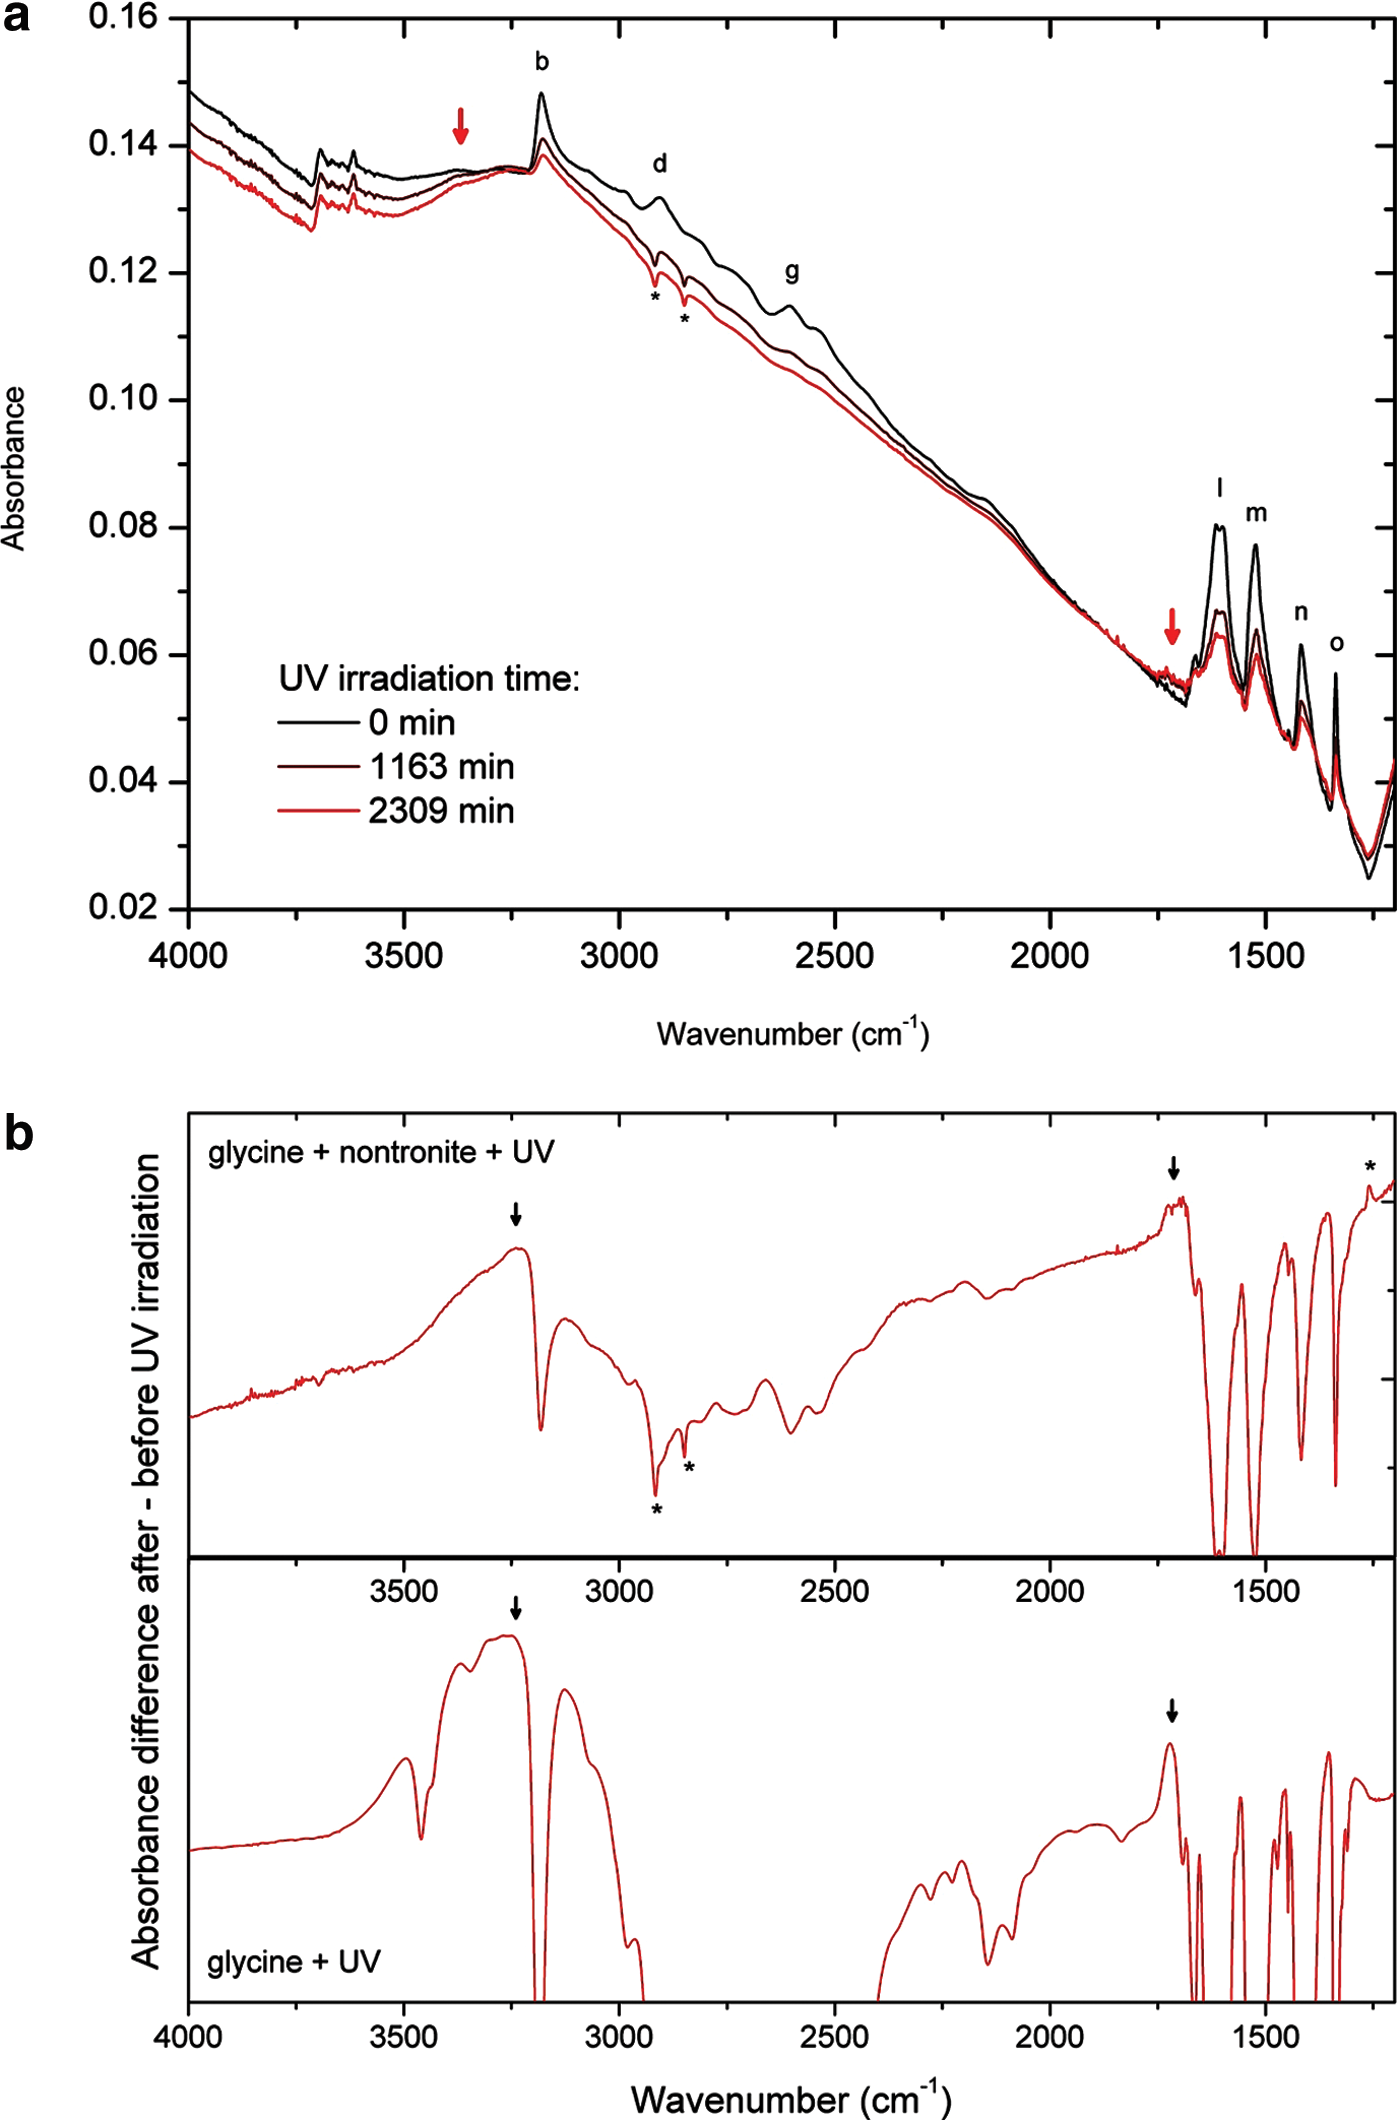
The evolution of the IR spectrum of a sample of nontronite with glycine under UV irradiation in simulated martian conditions is presented in Fig. 4a. The decreasing intensity of the IR bands of glycine (labels) is due to the photodecomposition of the molecule. These spectra also show the emergence of new absorption features (red arrows in Fig. 4a): one at 3240 cm−1 and extending up to 3500 cm−1 and the other at 1720–1680 cm−1. These new absorptions exactly match those obtained during the irradiation of pure glycine (see Fig. 4b and Poch et al., 2013). According the analysis of Poch et al. (2013), the band at 1720–1680 cm−1 would be due to the stretching vibration of amide products due to the formation of peptide bonds during irradiation, and the band at 3240 cm−1 is due to the water produced during this reaction.
3.3.2.2. Quantitative evolution
The relative abundance of glycine was determined after each irradiation period by averaging the absorption maxima of the bands at 2603 cm−1 (g label, δasNH3
++νCN), 1524 cm−1 (m label, δsNH3
+), and 1418 cm−1 (n label, νsCOO−) (see Fig. 4 and Supplementary Table S1). The average relative abundance derived from this treatment is shown as a function of irradiation time in Fig. 5. The decrease of the relative quantity of glycine slows down dramatically when increasing the irradiation time. This evolution matches (correlation coefficient R
2>0.995) a kinetic model where the quantity of glycine reaches a plateau after a certain irradiation time:
with Nt the quantity of molecules after t minutes of irradiation, N 0 the quantity of molecules before any irradiation, and N ∞ the constant quantity of molecules after a very long irradiation time (t→∞ ).
This kinetic could be explained as follows: (1) the photoprotection of glycine molecules by the nontronite present on the sample: we first observed the photodecomposition of the unprotected molecules, and then the quantity of glycine tends toward N ∞, which is the quantity of glycine photoprotected by the nontronite; and/or (2) the establishment of an equilibrium between the photodissociation of glycine and its reverse reaction, both being activated by UV radiation, “Glycine↔Products.” This latter process could be explained by the presence of the nontronite, or it could be due to the large amount of glycine in the deposit. Indeed, the same kinetic was observed for a thick sample of pure adenine, without the presence of nontronite (see Section 3.3.4.2 and Fig. 4).
To validate this point, a simulation experiment was carried out on another sample of glycine containing the same quantity of molecules but with a doubled concentration of nontronite (0.6 g L−1, “glycine+2Xnontronite+UV” in Fig. 5). Figure 5 shows that a doubling of the amount of nontronite in the sample leads to a slower photodecomposition of glycine. The decrease of the relative quantity of glycine is fitted by the kinetic model described above (Eq. 1), with a plateau (N ∞) at a higher value. We interpret this observation in terms of a better photoprotection provided by the higher amount of clay mineral.
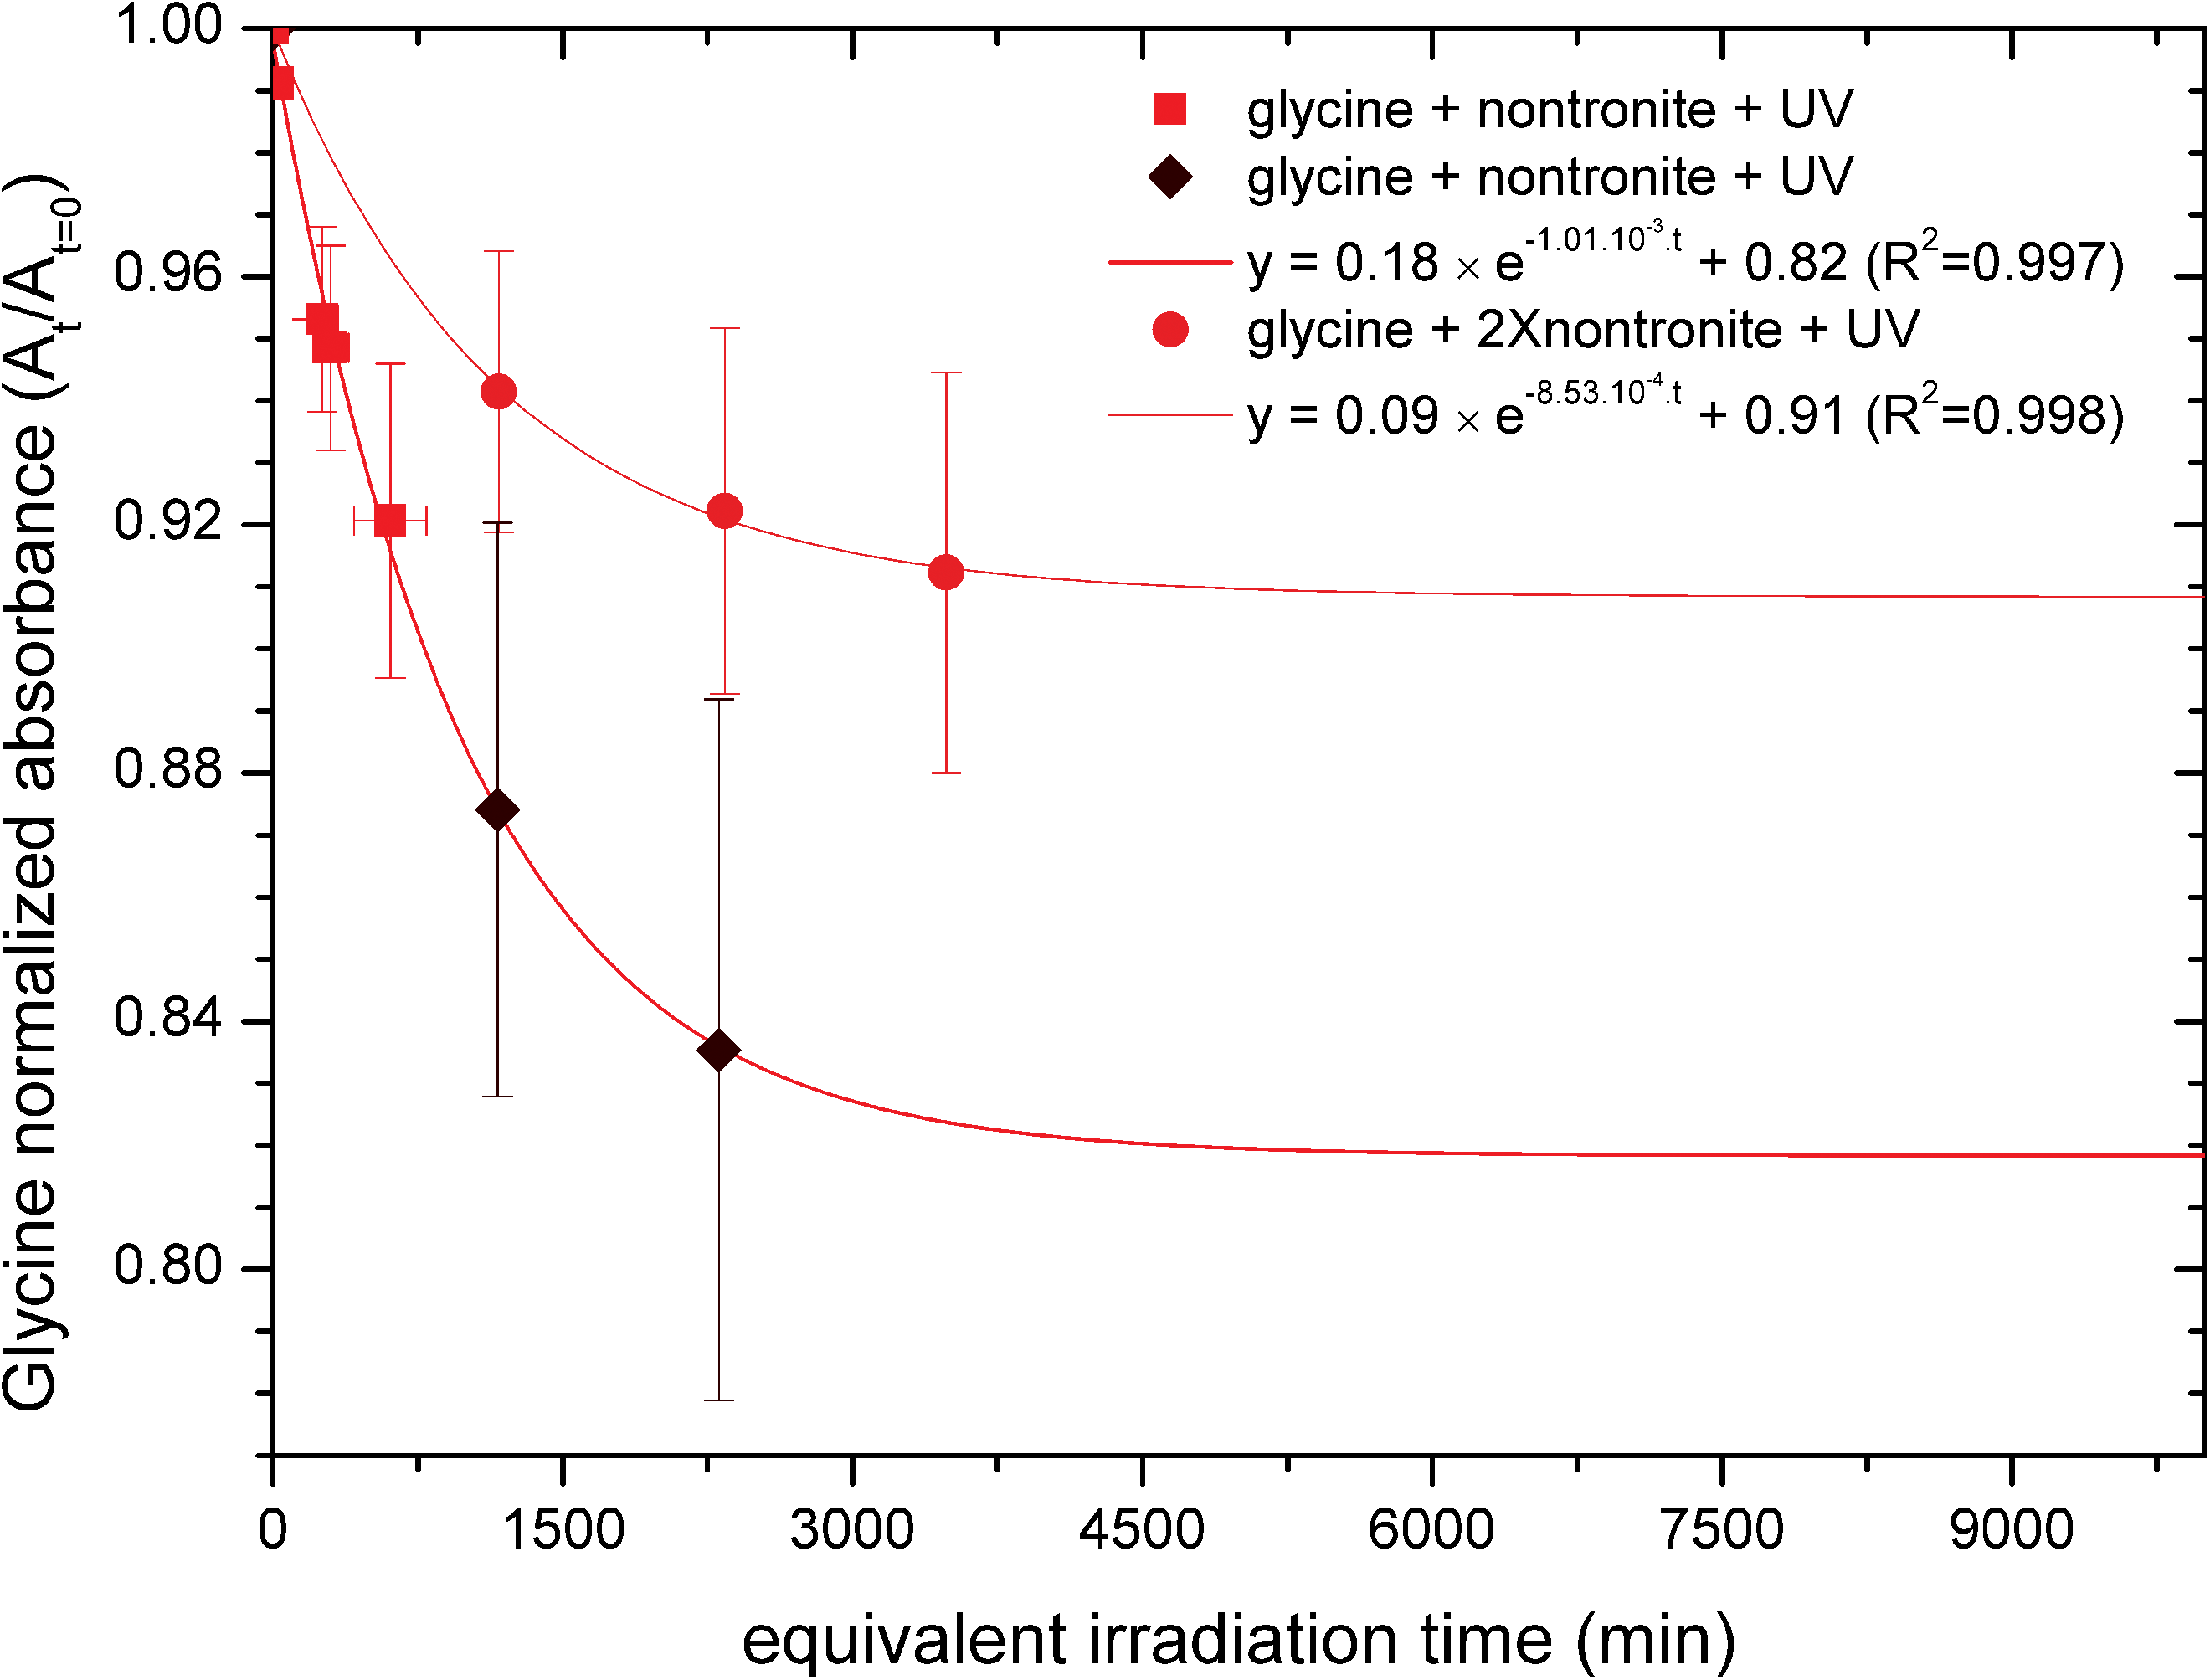
Normalized absorbance of the IR absorption bands of glycine during its evolution in the MOMIE simulation chamber in the presence of nontronite. The evolution of three samples is presented on this graph: red and dark-red data point samples (■, ♦) were obtained from a sample of glycine mixed at a concentration of 2.6×10⁻² mol of molecules per gram of nontronite, while orange data point samples (●) were obtained from a sample of glycine mixed at a concentration of 1.3×10⁻² mol of molecules per gram of nontronite. See Section 3.3.2.2 for details. The equivalent irradiation time on this figure corresponds to a flux of photons from 200 to 250 nm of 1.2±0.8×10²⁰ photon m−2 s−1. (Color graphics available at
The quantum efficiency of photodecomposition of glycine (6.3±5.2×10⁻³ molecule photon−1) is reduced by a factor of 5 in the presence of nontronite (1.2±1.1×10⁻³ molecule photon−1) and is even reduced again by another factor of 5 when the sample contains twice the concentration of nontronite (2.4±2.1×10⁻⁴ molecule photon−1) (see Table 1). These observations clearly indicate a strong photoprotection provided by the nontronite.
3.3.3. Urea
3.3.3.1. Qualitative evolution
The evolution of a sample of nontronite with urea under UV irradiation in simulated martian conditions is presented in Fig. 6a. These IR spectra show the decreasing intensity of the IR bands of urea (labels, cf. Supplementary Table S2), due to its photodecomposition, and the emergence of three new absorption features in the 2100–2300 cm−1 range. The bands centered at 2170 and 2200 cm−1 are also observed in the simulations performed in the absence of nontronite (see Fig. 6b), and they correspond to the stretching vibrations of the cyanate ion OCN− (see Supplementary Table S3). The third band, around 2250–2220 cm−1, is absent in simulations performed on pure urea (see Fig. 6b). It may be due to a new vibration mode related to the interaction of cyanate ion or O=C=N–H isocyanic acid (Lowenthal et al., 2002) with compensating Fe3+ ions or with the nontronite surface. Additionally, the spectra observed in the presence of nontronite (Fig. 6b) do not show any evidence of the ammonium ion NH4 +, which is characterized by IR bands located at 1440 cm−1 and between 3169 and 2872 cm−1 in spectra of pure UV-irradiated urea [see Supplementary Table 3 and Supplementary Fig. 2 of Poch et al. (2014)]. Moreover, in the presence of nontronite, the band corresponding to the stretching vibration of CO to 1596 cm−1 (label f) has the fastest decrease rate, while for pure urea the CN band at 1470 cm−1 (label g) has the fastest decay. All these data put together indicate that the chemical evolution of urea under UV irradiation conditions is different in the presence of nontronite from that of bulk urea. This change in reactivity is certainly related to the fact that urea shows an interaction with the mineral, as evidenced by the 1350 cm−1 absorption band discussed above (see the last paragraph of Section 3.2).
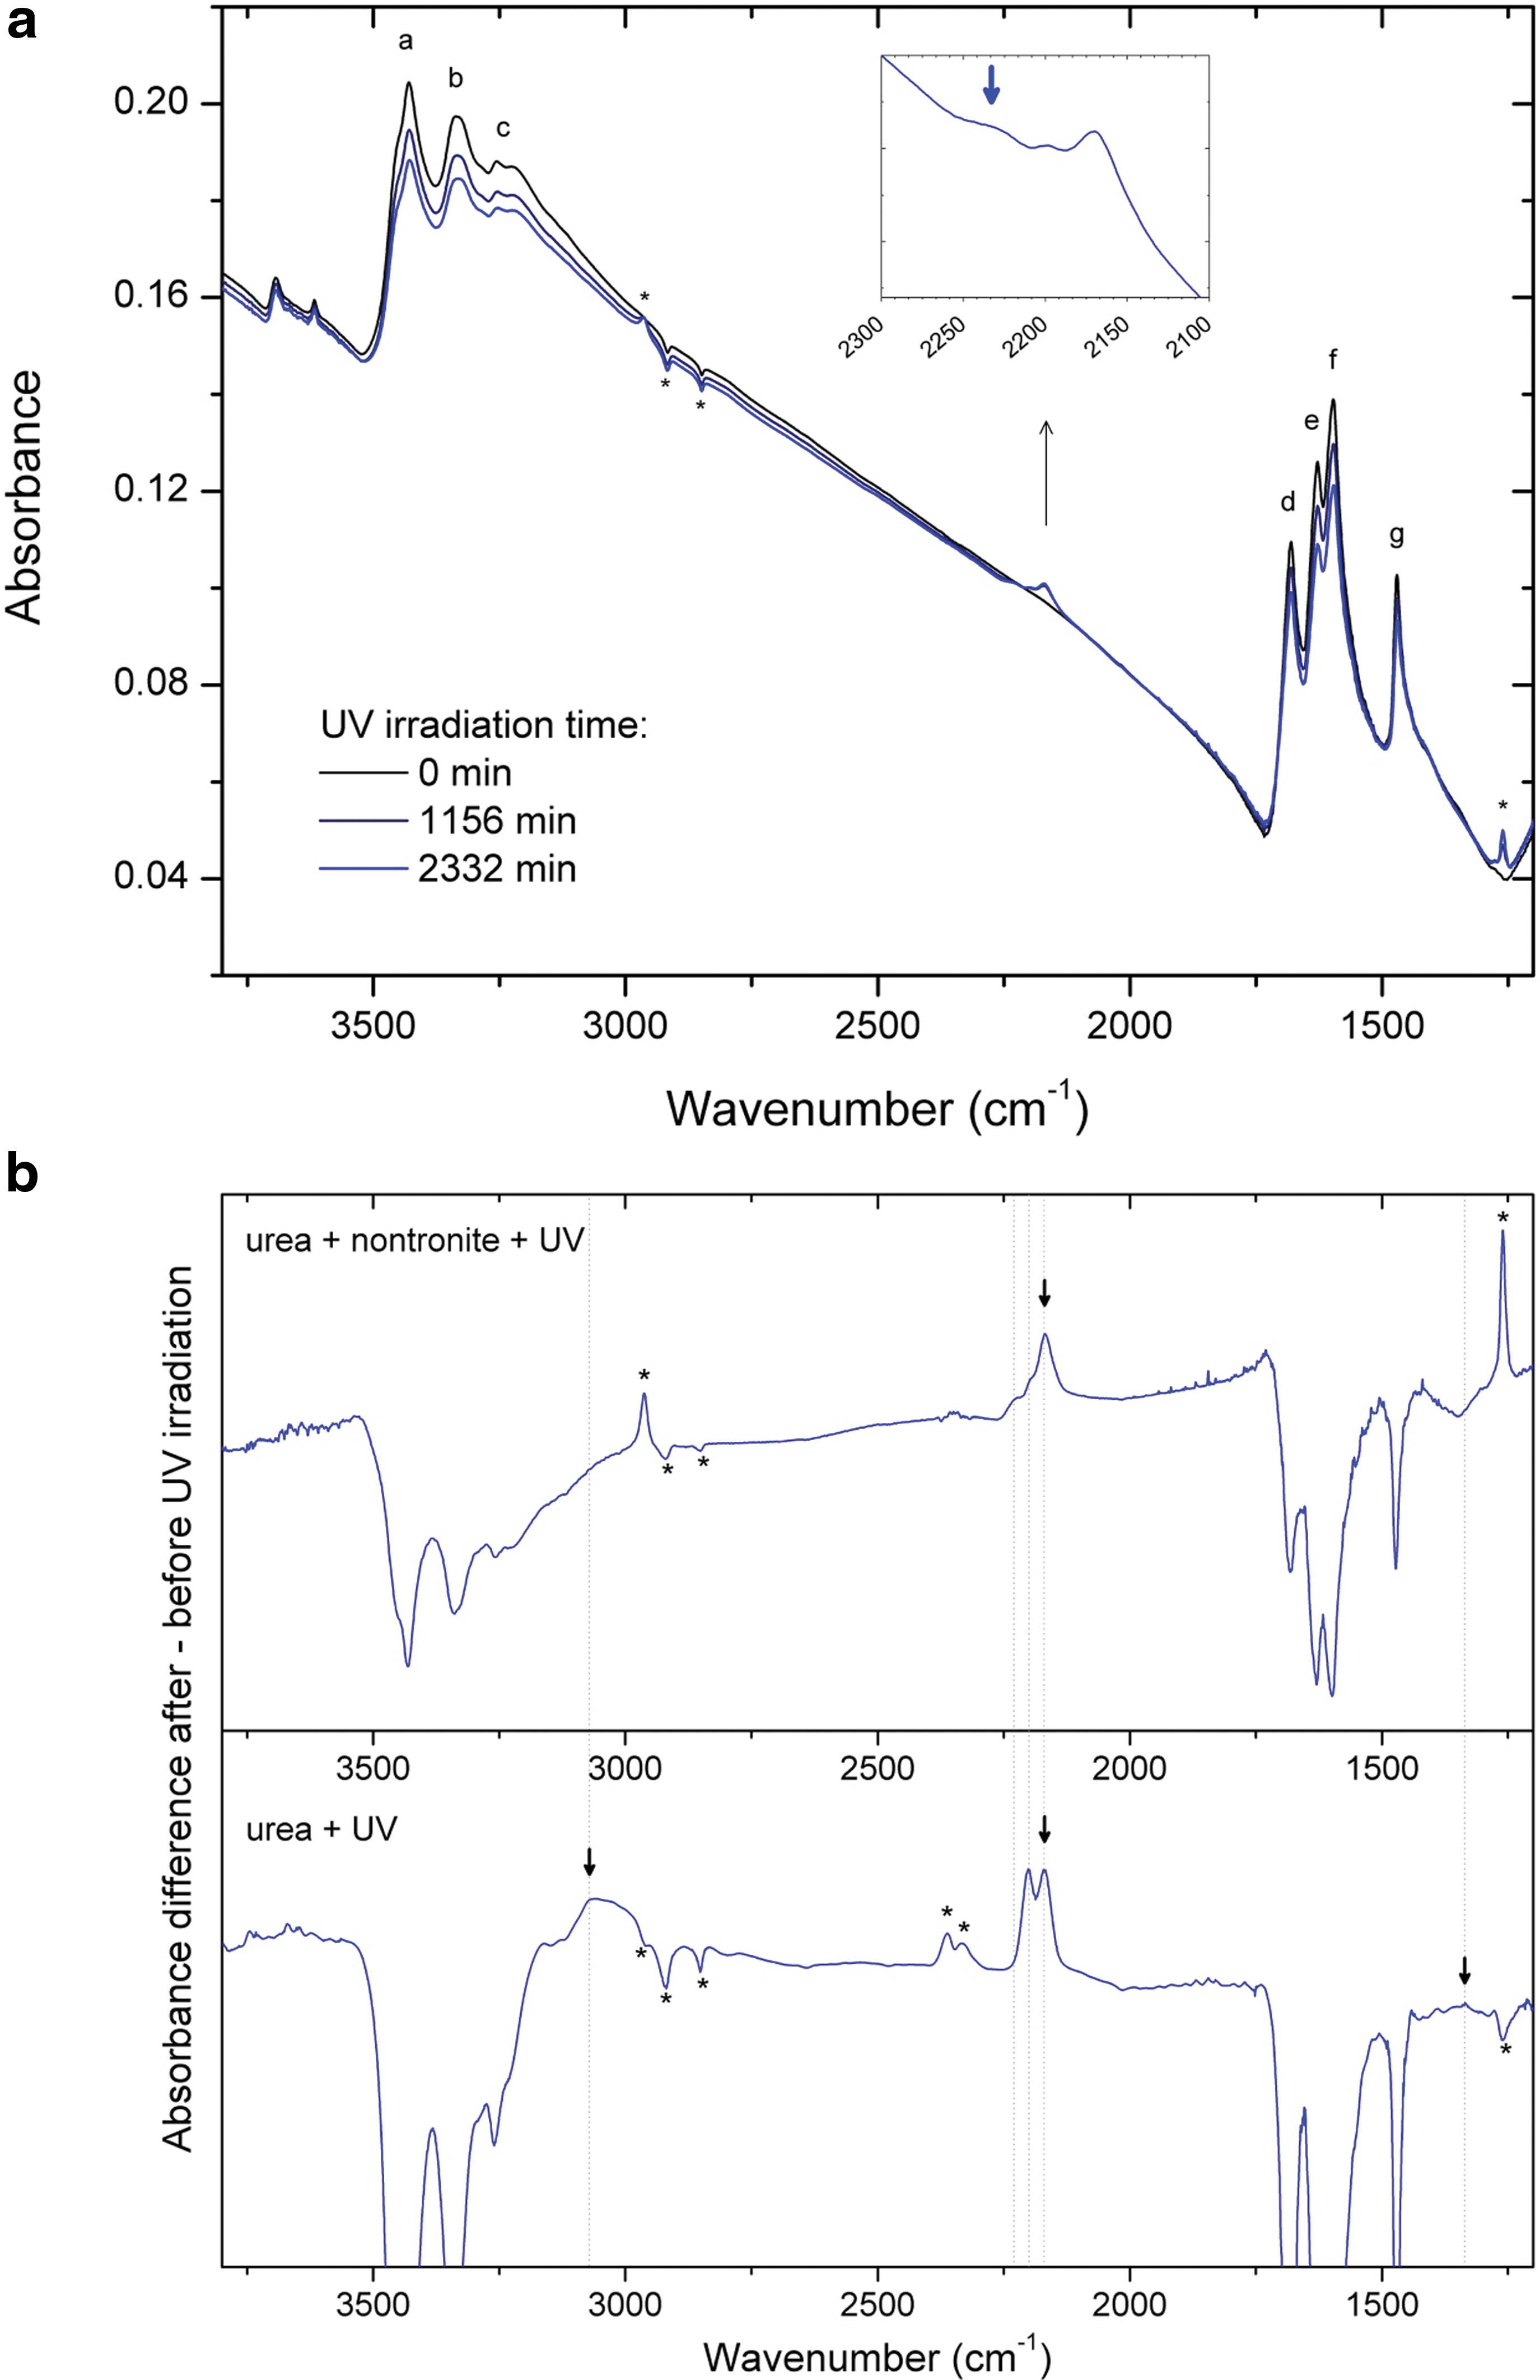
(
3.3.3.2. Quantitative evolution
The relative abundance of urea (Fig. 7) was determined after each irradiation period by averaging the absorption maxima of the bands at 1681 cm−1 (label d, δsNH2), 1627 cm−1 (label e, δasNH2), 1596 cm−1 (label f, νCO), and 1471 cm−1 (label g, νasCN) (see Fig. 6a and Supplementary Table S2). The three experimental points obtained after irradiation match a first-order decay. Though the total amount of photons received during the simulation is small, the observed trend of the quantity of urea does not seem to tend toward an equilibrium value, contrary to what is observed for glycine (Fig. 5).
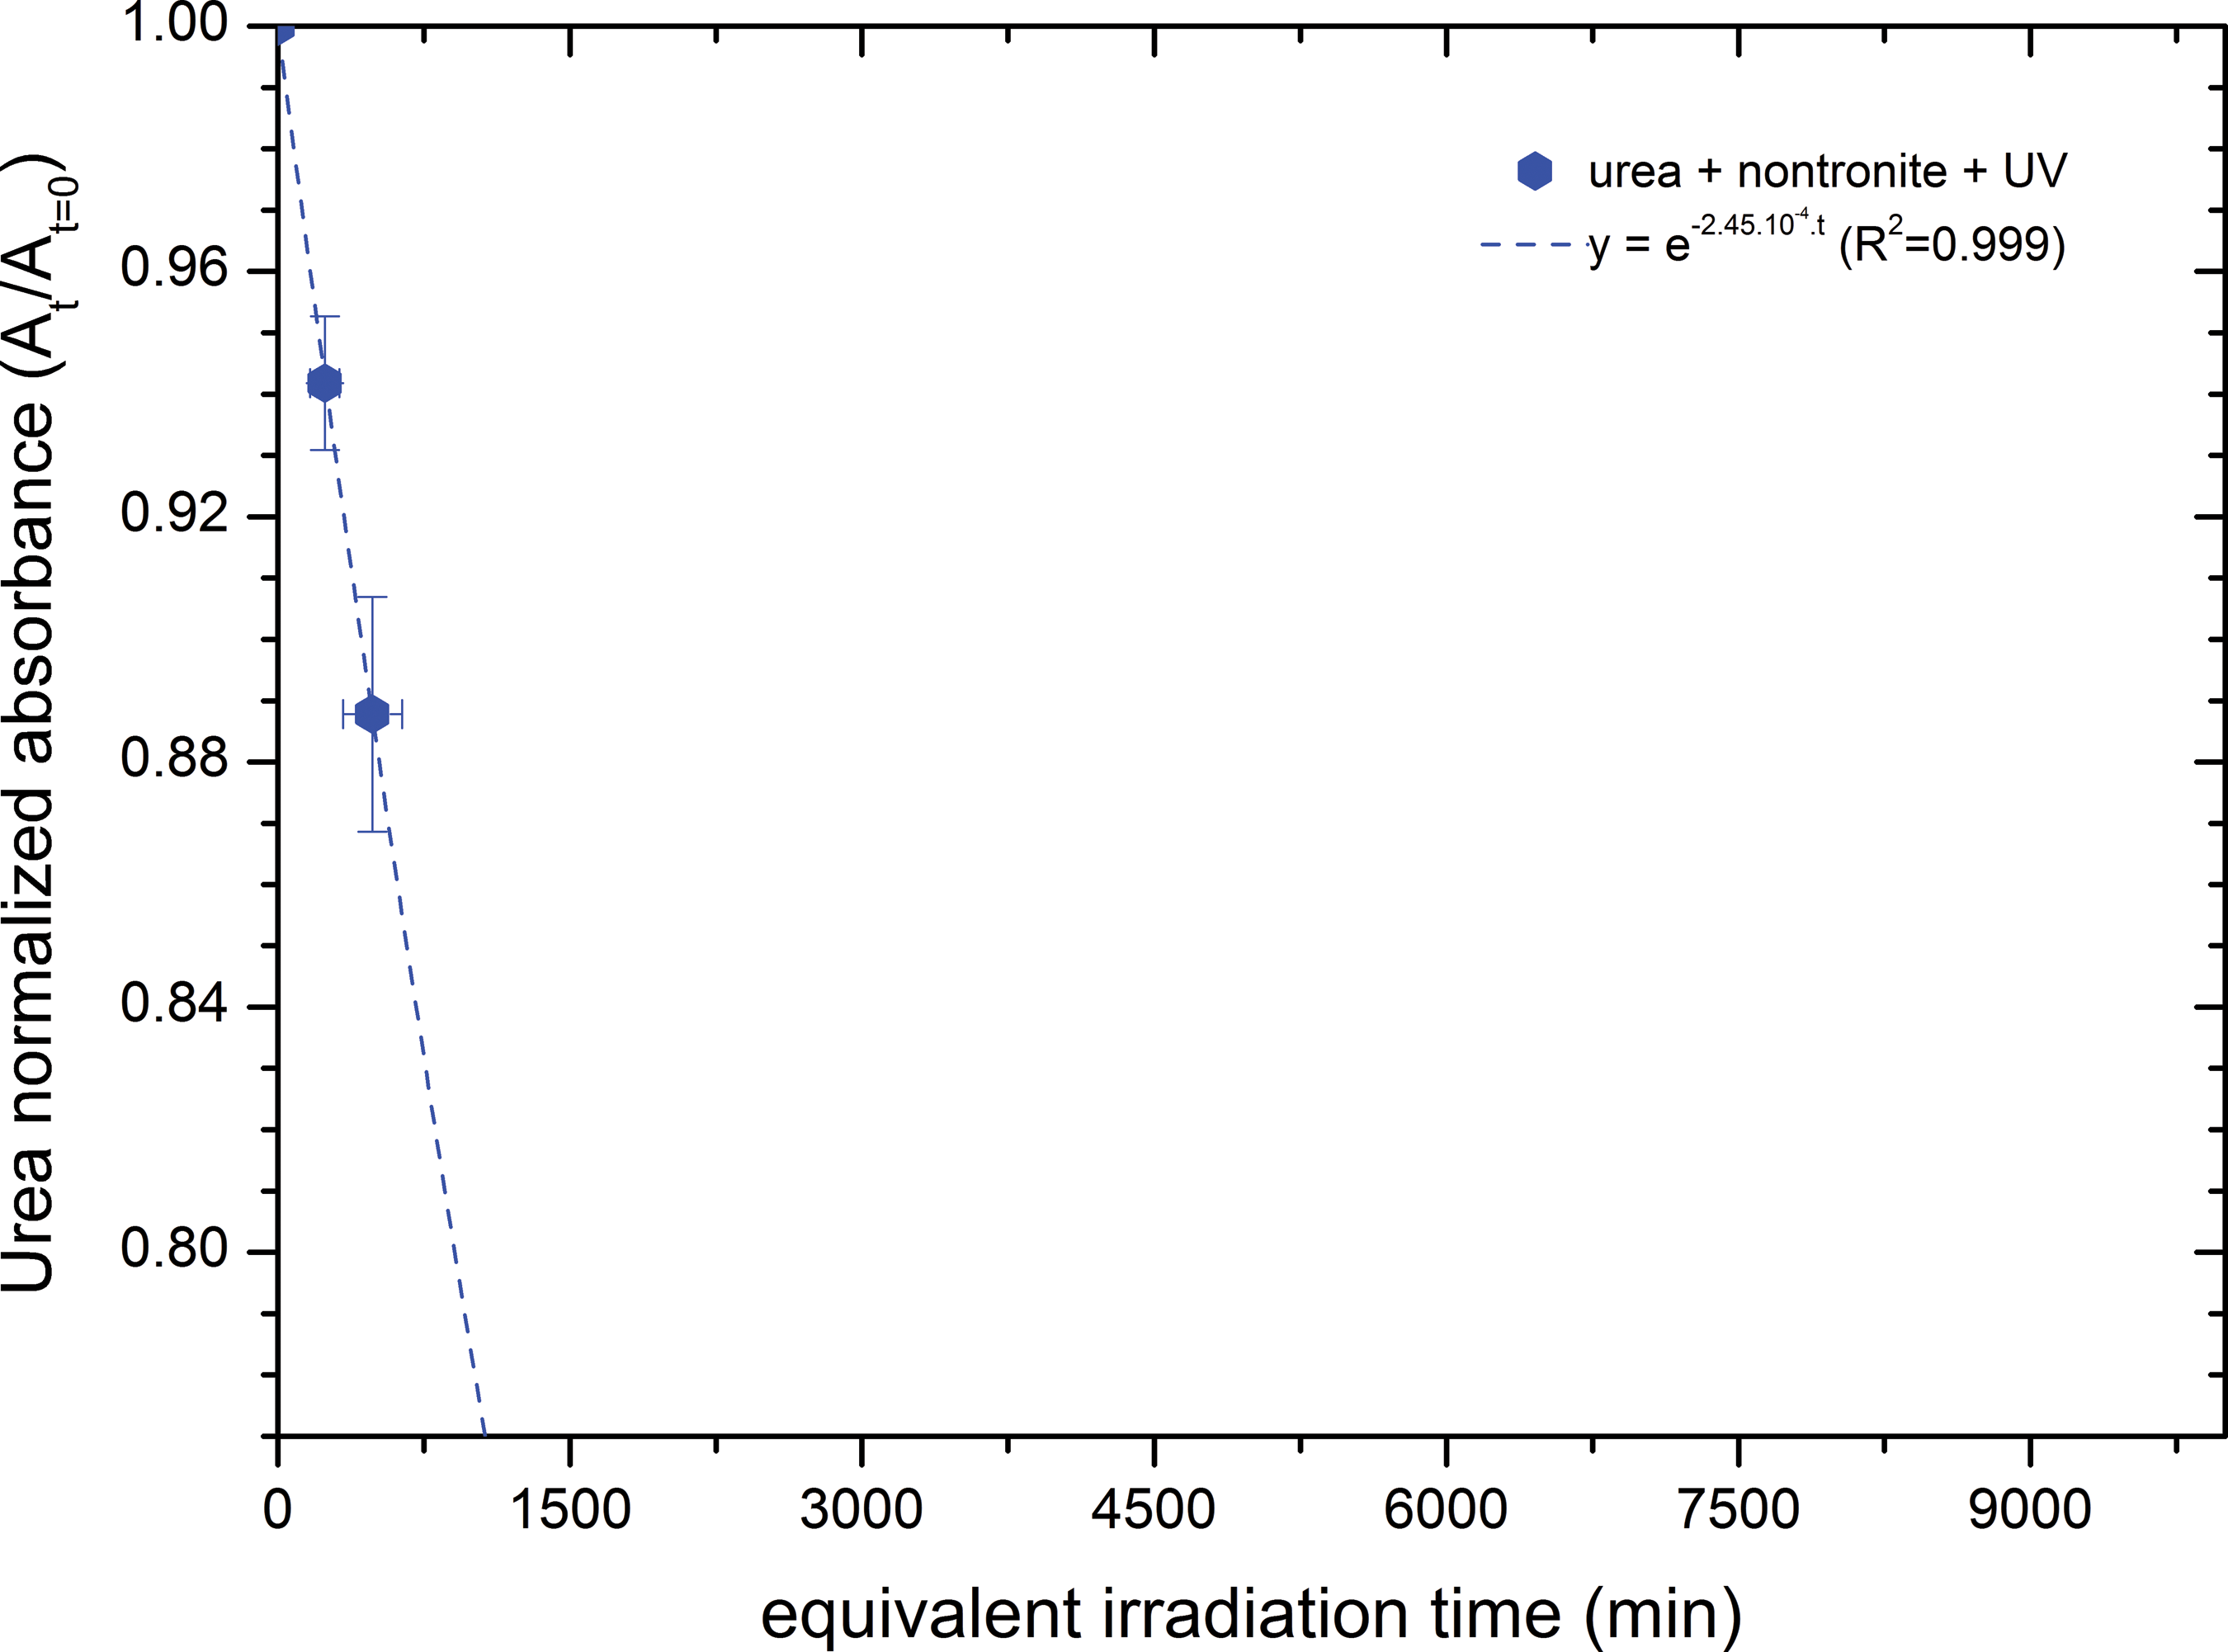
Normalized absorbance of the IR absorption bands of urea during its evolution in the MOMIE simulation chamber in the presence of nontronite. The equivalent irradiation time on this figure corresponds to a flux of photons from 200 to 250 nm of 1.2±0.8×10²⁰ photon m−2 s−1. (Color graphics available at
The quantum efficiency of photodecomposition calculated for urea in the presence of nontronite (2.9±2.3×10⁻³ molecule photon−1, Table 1) is potentially twice as high as in the absence of nontronite (1.3±6.0×10⁻³ molecule photon−1), but the large error bars on these values prevent any definitive conclusion. This increase of photodecomposition efficiency could be due to the occurrence of additional pathways leading to the degradation of urea because of the presence of nontronite, such as photocatalysis or stoichiometric oxidation reactions with Fe3+, H2O, or HO·.
3.3.4. Adenine
3.3.4.1. Qualitative evolution
The spectra that show the evolution of a sample of adenine in the presence of nontronite under UV irradiation in simulated martian conditions are presented in Fig. 8a. The intensity of the IR bands of adenine (labels, Supplementary Table S4) decreases due to the photodecomposition of the molecule, and new absorption features emerge: a broad absorption from 3600 to 3000 cm−1, a narrower absorption band between 2170 and 2160 cm−1, and a broader absorption from 1780 to 1500 cm−1. The same new absorptions are observed after the UV irradiation of pure adenine (see Fig. 8b). Poch et al. (2014) assigned these absorptions to a (or several) product (or products) possibly consisting of primary amine functional groups (–NH2), isocyanides (R–N≡C), and/or nitriles (R–C≡N) involved in an extended conjugated system (as −C=C–C=N–). As in the case of glycine, no new IR band is observed for adenine in the presence of nontronite that has not been observed as well for the evolution of the pure organic samples under UV irradiation.
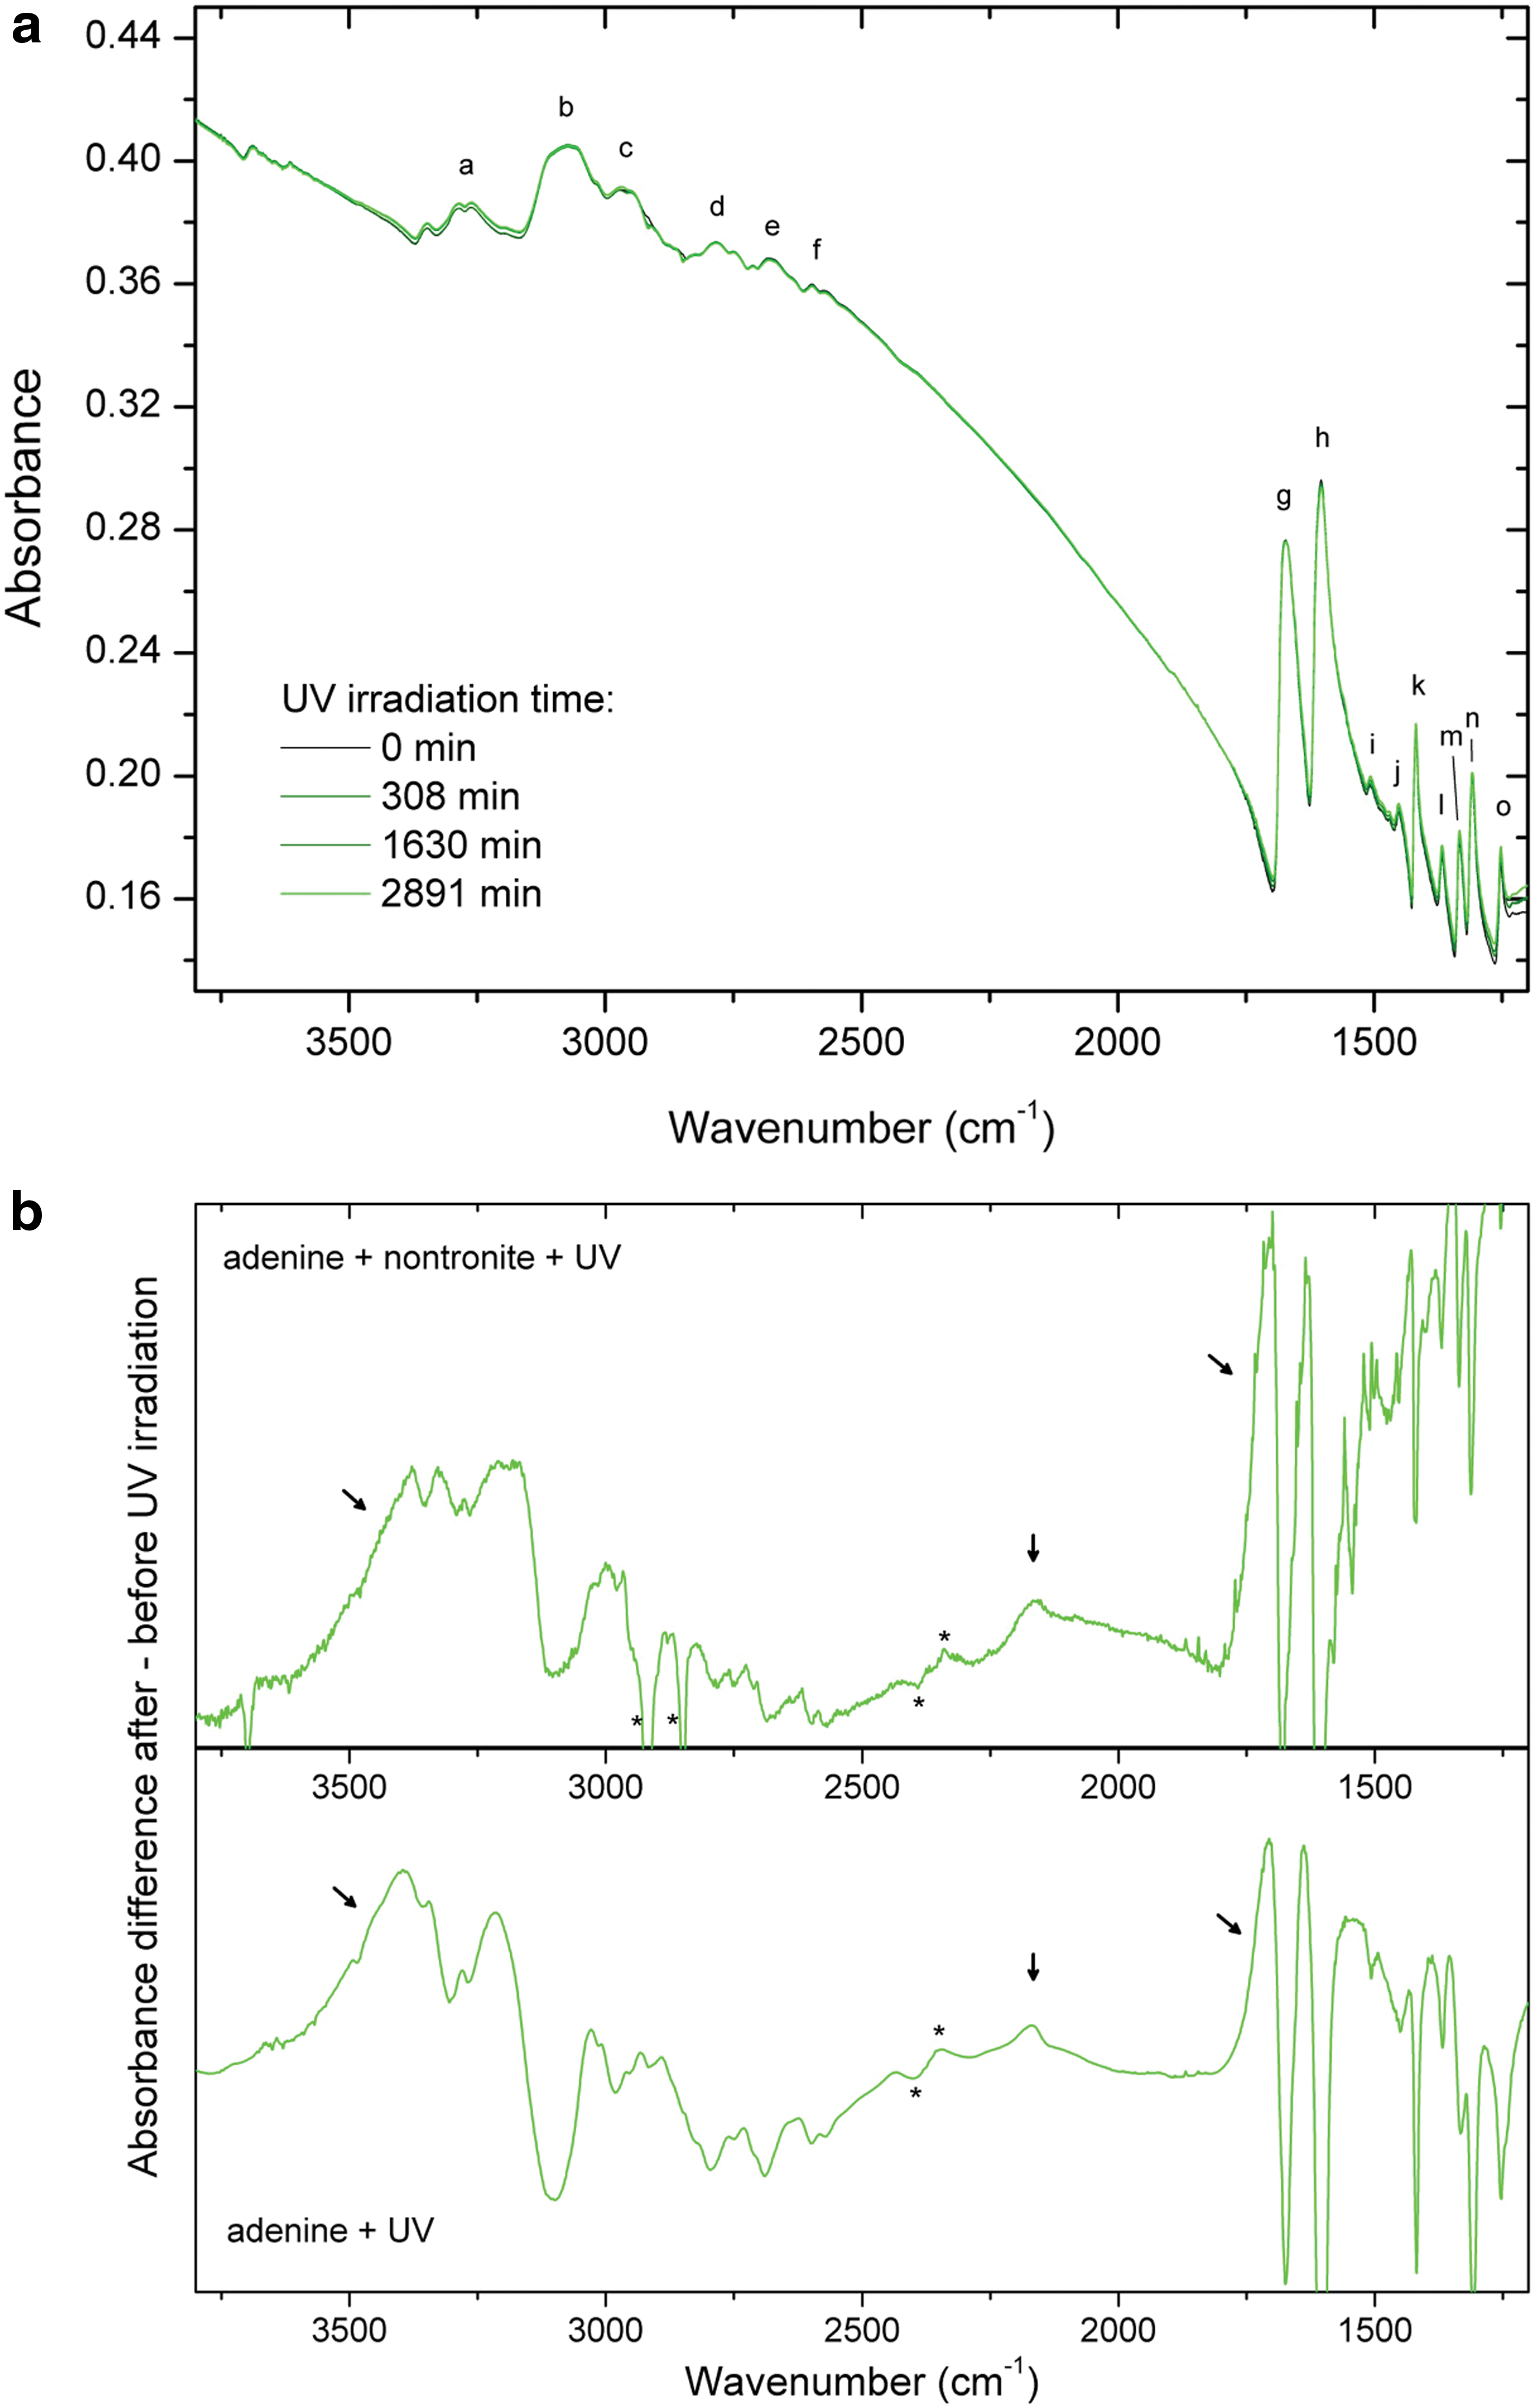
(
3.3.4.2. Quantitative evolution
The relative abundance of adenine in the presence of nontronite during the simulation is shown in Fig. 9 (●). On the same figure is also shown the relative abundance of a sample containing the same amount of adenine, but without nontronite (○). These data were obtained by integrating the adenine IR band at 1603 cm−1 (label h). It can be seen that nontronite provides a photoprotective effect that significantly slows down the photodecomposition rate of adenine. This is also confirmed by the determination of the photodissociation yields presented in Table 1; the value obtained in the presence of nontronite (2.0±1.4×10⁻⁵ molecule photon−1) is reduced by a factor of 5 compared to the value obtained for pure adenine (1.0±0.9×10⁻⁴ molecule photon−1).
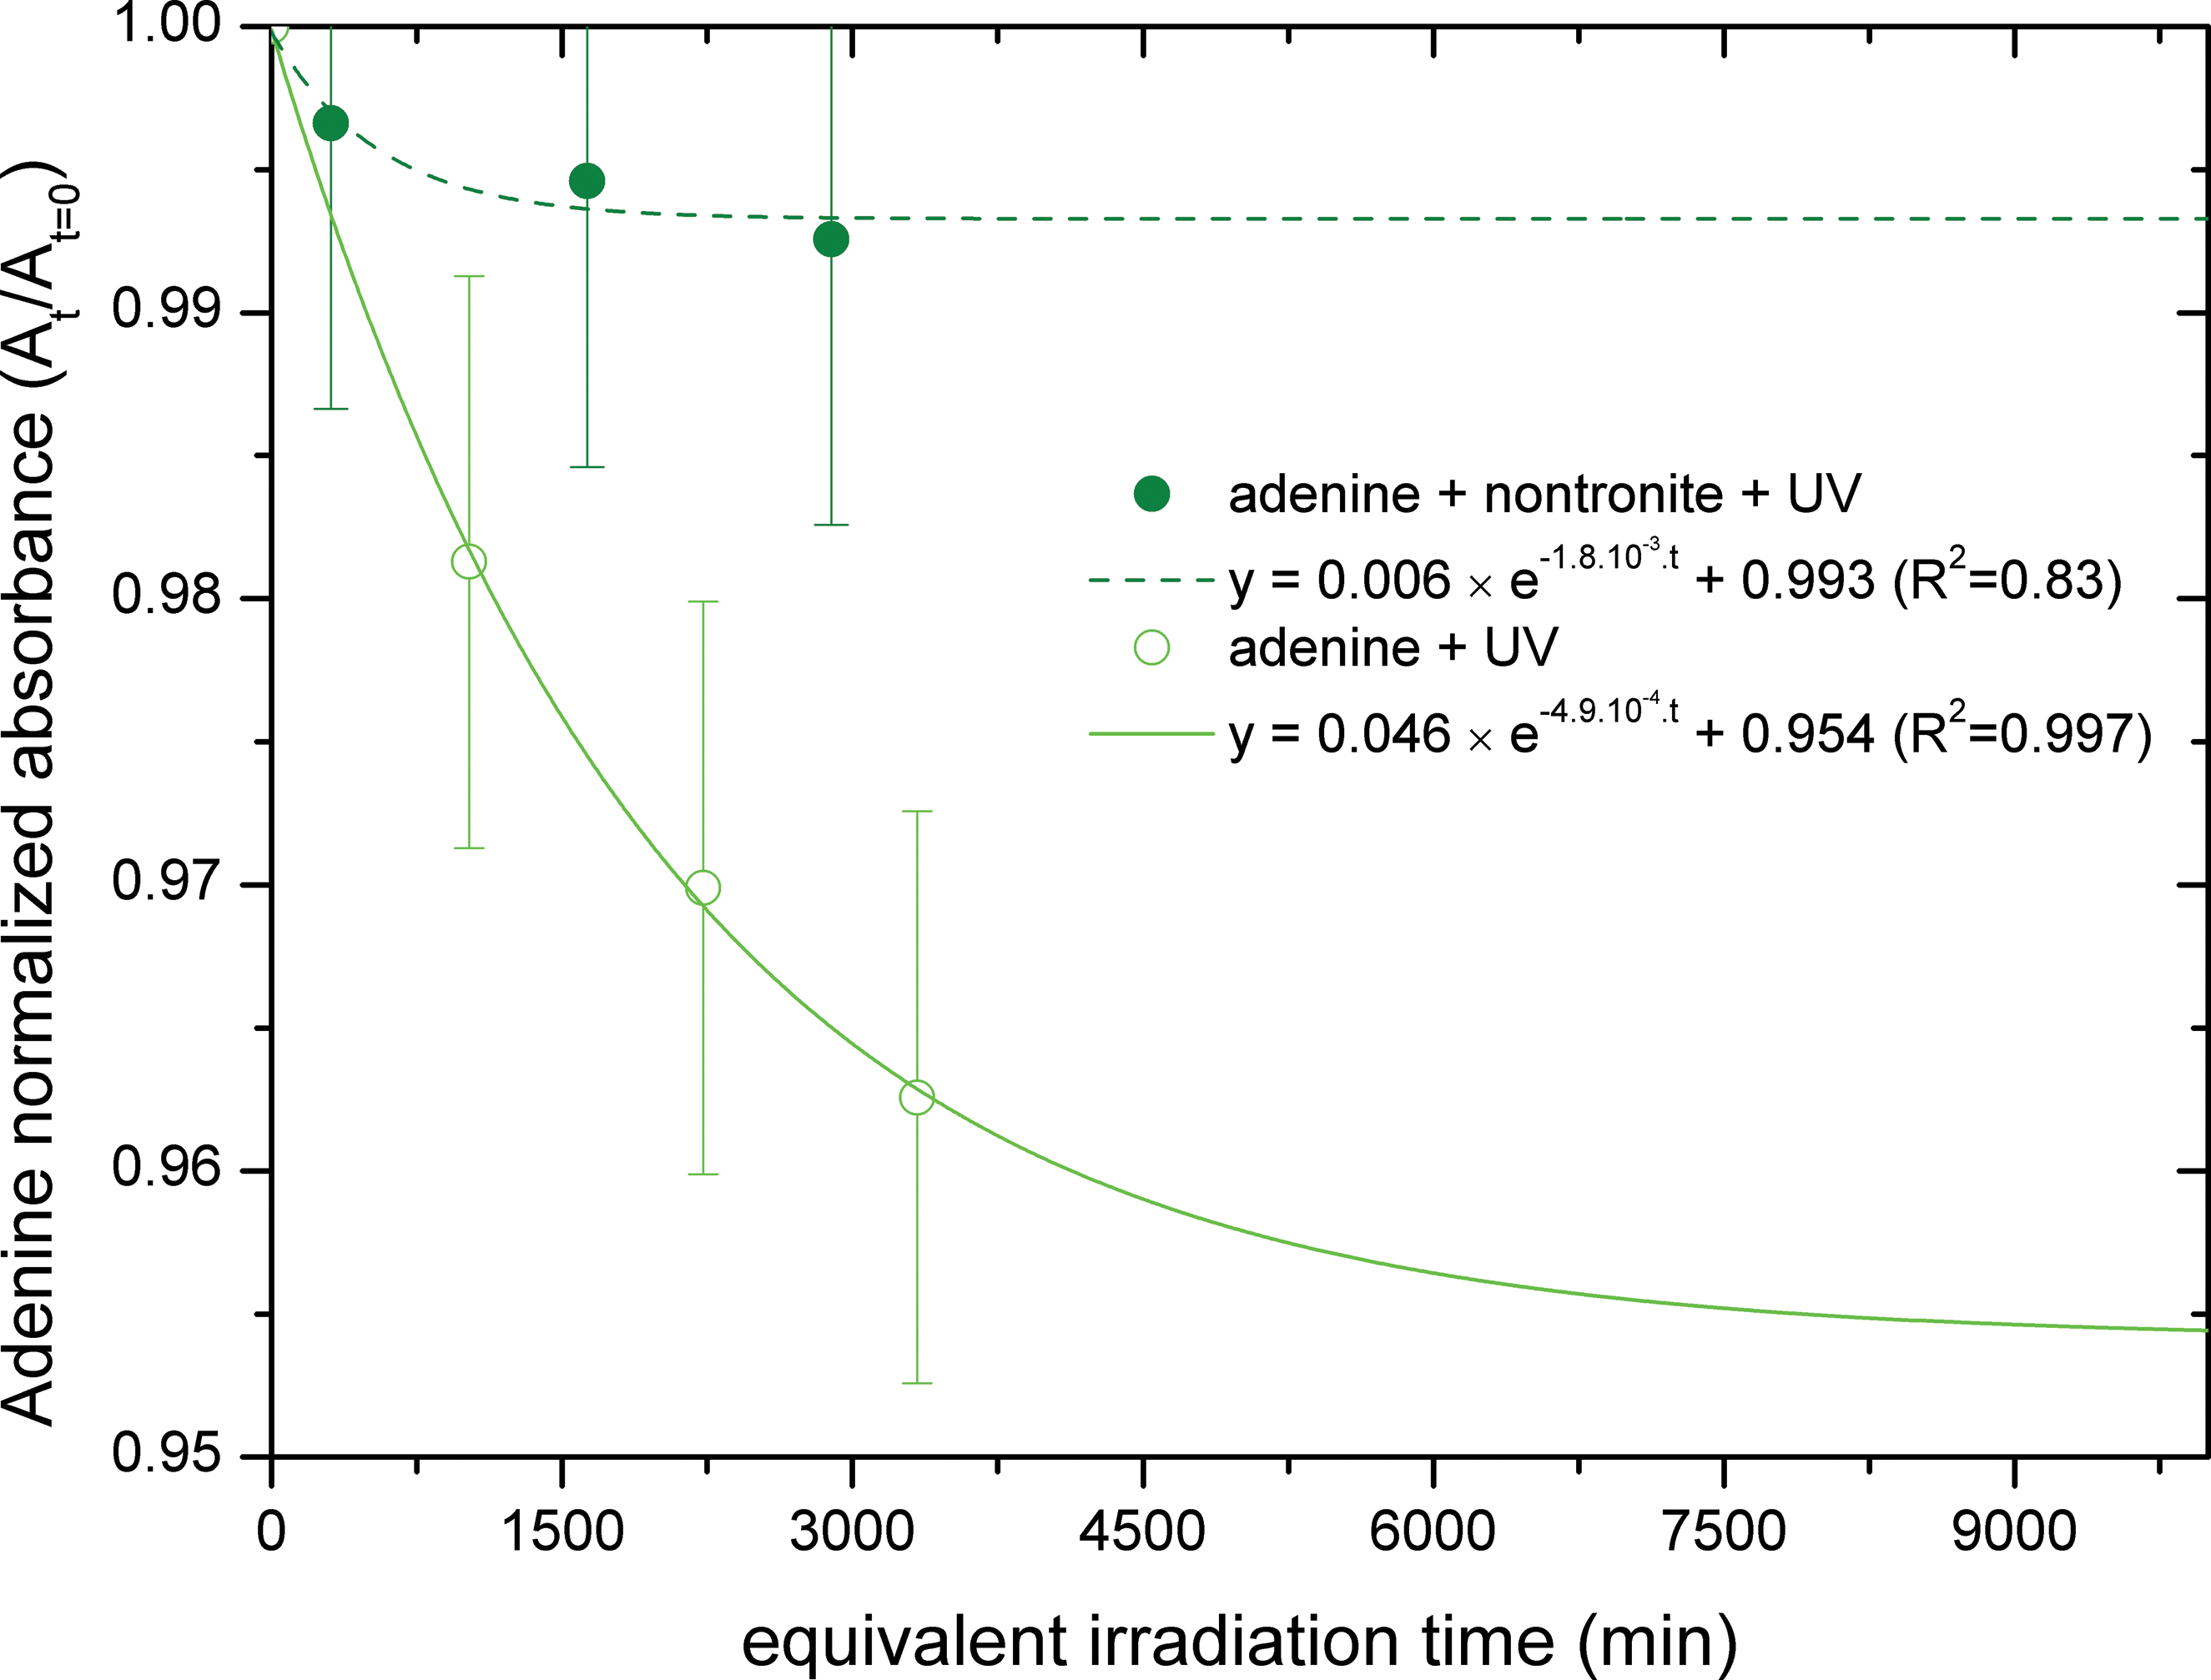
Normalized absorbance of the IR absorption bands of adenine during its evolution in the MOMIE simulation chamber in the presence of nontronite (●) or as a pure organic deposit (○) containing the same amount of adenine. The equivalent irradiation time on this figure corresponds to a flux of photons from 200 to 250 nm of 1.2±0.8×10²⁰ photon m−2 s−1. (Color graphics available at
We note that the relative quantity of adenine contained in the pure organic sample tends toward an asymptotic constant value for a very long irradiation time (following Eq. 1) (see Fig. 9). This trend can be explained by the formation of the photoproduct (or photoproducts) having a shielding effect on the adenine molecules located deeper in the deposit, as was already observed with thinner deposits by Poch et al. (2014). This leveling off of photodegradation in the long term for thick deposits is particularly interesting regarding the photostability of potential solid organic layers on Mars [more details can be found in the work of Poch et al. (2014)].
When adenine is in the presence of nontronite, the kinetic is more ambiguous; the aforementioned model (Eq. 1) is not well verified (correlation coefficient R 2=0.83), nor is the first-order decay model (see Fig. 9). This might be indicative of the occurrence of a peculiar process that affects adenine in the presence of nontronite, but because of the high uncertainty on these data, we cannot definitively conclude on this point.
4. Discussion
We exposed samples of glycine, urea, and adenine, all containing the same number of molecules and the same mass of nontronite, to simulated martian surface conditions: UV radiation (190–400 nm), mean temperature (218±2 K), and N2 atmospheric pressure (6±1 mbar). These organic molecules were co-deposited with nontronite from aqueous solution. To suit the constraints of our experimental device, the samples had a high mass ratio of organic molecules compared to nontronite (from 1.0 to 3.6). This high mass ratio is certainly not representative of most martian environments, and in such a case it is difficult to discuss the photoprotection by the mineral. Because of this high mass ratio, a fraction of the organic molecules were probably not in direct chemical interaction with the clay mineral, and various processes could occur in our samples: (1) photolysis of the molecule directly exposed to the UV radiation, (2) photoprotection from UV photons provided by the nontronite, (3) conversely, transformation of the molecule as a result of its interaction with the nontronite; the latter could act either as a photocatalyst or as a stoichiometric reagent (e.g., oxidation by Fe3+, reactions with H2O, etc.).
To discern the influence of the nontronite on the chemical evolution of the studied molecules (processes 2 or 3), we had to eliminate the consequences of direct photolysis (process 1). Poch et al. (2014) documented the consequences of direct photolysis on glycine, urea, and adenine by determination of the nature of the photoproducts and the molecular quantum efficiencies of photodecomposition. Comparing these results with those obtained in the presence of nontronite enabled us to deduce what the influence of the nontronite was on the chemical evolution of the studied molecules (processes 2 or 3). It should be noted that even when we had to compare very different types of samples (pure organic samples versus organics mixed with nontronite), we found a way to make a quantitative comparison by determining in each case the quantum efficiencies of photodecomposition of the molecules (presented in Table 1), as we explain in Section 2.4.
4.1. Photoprotection or photodecomposition of the organic molecules provided by the Fe3+-nontronite
The molecular photodissociation yields calculated for glycine, urea, and adenine in the presence of nontronite are compared with those obtained in the absence of nontronite in Fig. 10 and Table 1. When mixed at a concentration of 2.6×10⁻² mol of molecules per gram of nontronite, glycine and adenine have their quantum efficiencies of photodecomposition reduced by a factor of 5. Conversely, the quantum efficiency of photodecomposition of urea mixed with nontronite at the same molar concentration is potentially twice as high as in the absence of nontronite. These results suggest a strong photoprotective effect of nontronite on the evolution of glycine and adenine and conversely a possible acceleration of the dissociation of urea.
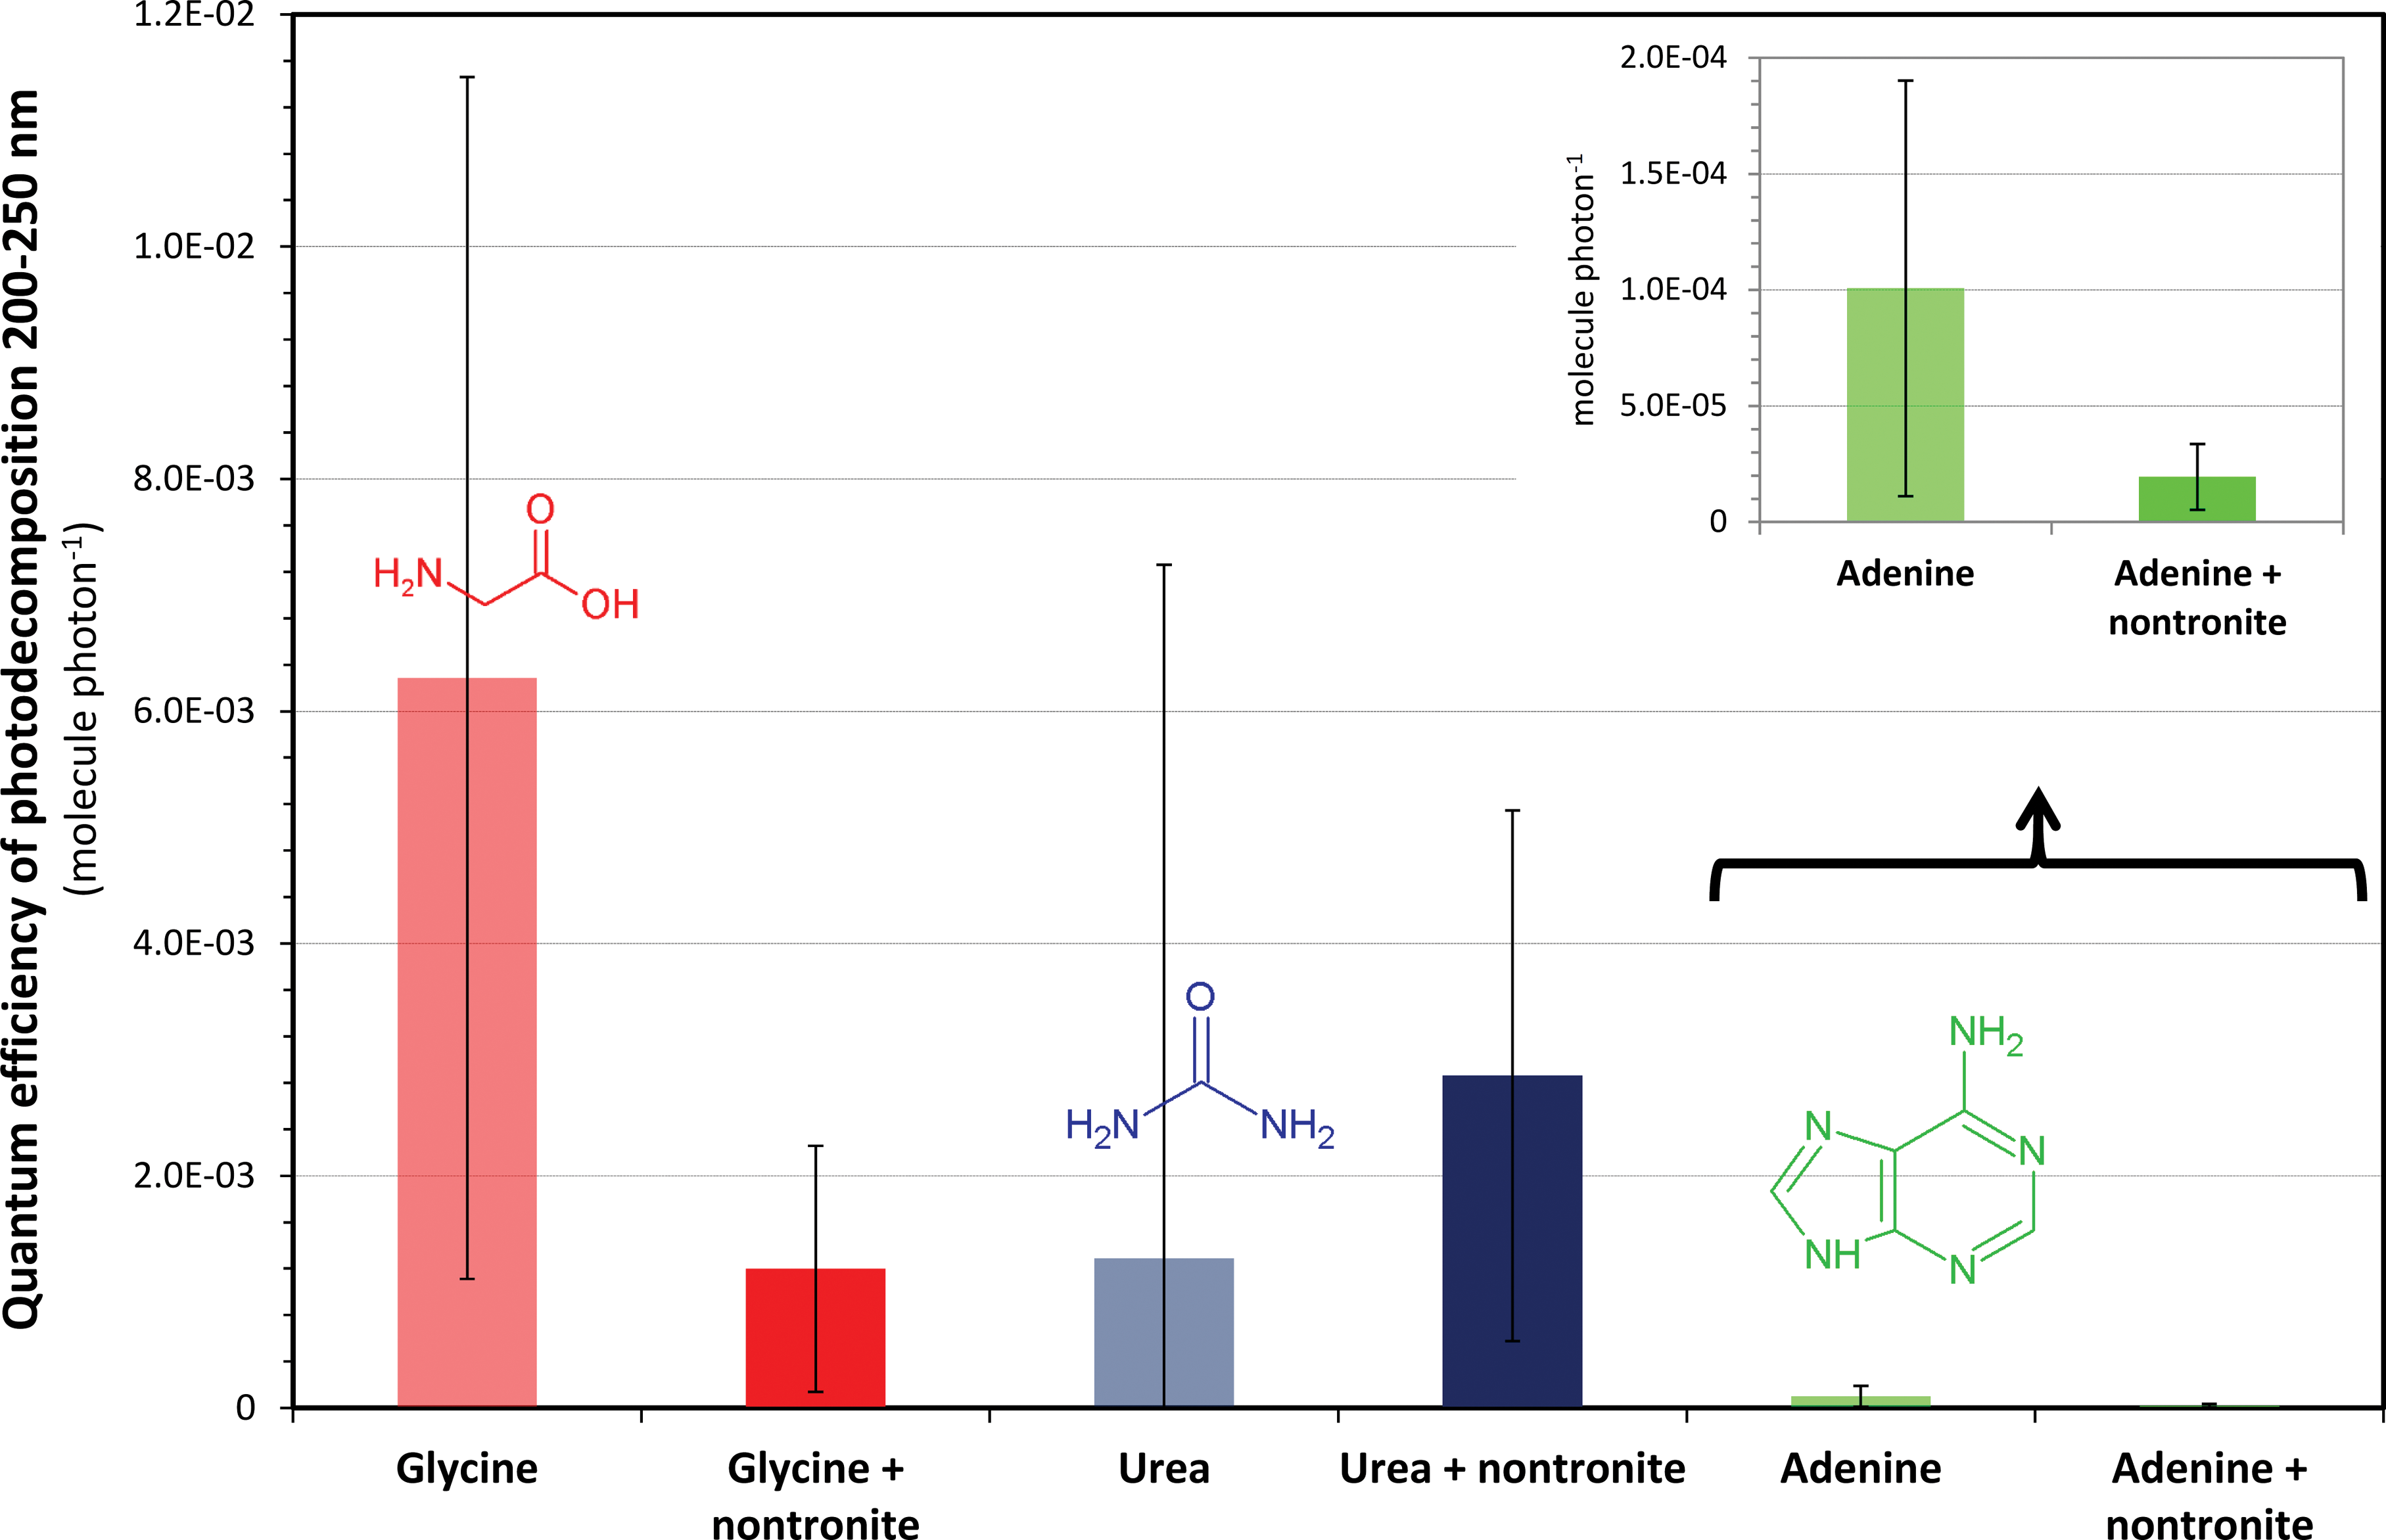
Quantum efficiency of photodecomposition from 200 to 250 nm for glycine, urea, and adenine with or without nontronite, exposed to Mars-like UV radiation (from mean values presented in Table 1). For discussion regarding the error bars, see Section 4.1 and Poch et al. (2014) Section 3.1. (Color graphics available at
The fact that we did not observe such photoprotection for urea in the presence of nontronite could be due to peculiar interactions between the urea molecules and the mineral. As mentioned in Section 3.2, the IR spectra of urea in the presence of nontronite show evidence for an interaction between urea and Fe3+. One explanation could be that, because of its structure, the molecule of urea is more inclined to chelate Fe3+ ions than would glycine and adenine, and as a consequence it undergoes more efficient photooxidation and decomposition. A further experiment performed with urea and a nontronite free of Fe3+ in the interlayer space could be done to confirm this hypothesis.
For glycine and adenine, a Fe3+-enriched nontronite seems to efficiently preserve these molecules when under martian surface UV irradiation conditions. Is this photoprotection due to a purely mechanical shielding effect (provided by the mineral grains) or to stabilizing interactions as well between the molecules and the nontronite? We found that, when the amount of nontronite in the sample of glycine was increased by a factor of 2 (concentration of 1.3×10⁻² mol of molecules per gram of nontronite), the gain of photoprotection was multiplied by a factor of 5 (see Table 1). If the nontronite only provided a pure mechanical shielding by its grains, this gain would have been at best a factor of 2. Thus, this observation indicates that the photoprotection provided by the nontronite is not a purely mechanical shielding effect but could also be due to stabilizing interactions of the molecules with the mineral surface.
Moreover, it is remarkable to note that the quantum efficiencies of photodecomposition are not linearly correlated to the UV absorbance of the samples with and without nontronite. Samples of organic molecules mixed with nontronite have a transmittance in the 200–250 nm range that is about twice lower than that of samples of pure organic molecules (UV spectra not shown). If nontronite had only a purely mechanical shielding effect on the evolution of the organic molecules, the quantum efficiencies of photodecomposition in presence of nontronite would have been at best twice lower, while they actually were 5 times lower for glycine and adenine (cf. Table 1). This implies again that the nontronite reduces the photodecomposition of these molecules by some other mechanism than mere shielding. Electrostatic interactions of the molecules in the interlayer of the nontronite and/or on the clay edges are possible explanations. Such interaction of the molecules with nontronite may offer more possibilities to dissipate their excess energy due to the absorption of a photon and/or more possibilities for the fragments of the photodissociated molecules to recombine.
From the few observations described above, we can deduce the following empirical relation, linking the concentration of the molecule in the nontronite (C, in “mol per gram of nontronite”) to the efficiency of its photodecomposition (Φ
molecule in nontronite, in “photodecomposed molecule per photon in the 200–250 nm range”):
Reasoning in term of orders of magnitude, we can also write the following relation, where x is the order of magnitude of the mass ratio of organic molecules (glycine or adenine) in the nontronite:
In our experiments, x is equal to 1. But for natural terrestrial samples of phyllosilicates, x is comprised between 10−3 and 10−2 (Bonaccorsi, 2011). The relation above indicates that, for such low concentrations of molecules in nontronite, the efficiency of photodecomposition would be virtually 0 (lower than 10−73 molecule photon−1); thus the clay would provide a complete photoprotection against UV radiation at the surface of Mars. However, more data points would be needed to confirm the range of x values for which Eq. 3 is valid.
4.2. Photoproducts and evolution of molecular structures
The goal of these experiments performed in the presence of nontronite was also to search for new compounds produced from physicochemical processes initiated by the clay mineral. But taken as a whole, the results we obtained included no unambiguous detection of a new compound that formed specifically due to the presence of nontronite.
Infrared analysis of the solid phases of glycine samples with nontronite revealed the same products as those observed after UV irradiation of pure glycine samples: tentative peptide bond formation and water formation.
For adenine, the IR spectra show the appearance of absorption bands similar to those obtained after UV irradiation of pure adenine samples (see Fig. 8b). The adenine photoproduct (or photoproducts) indicated here suggests a kind of heteropolymeric structure, possibly of high molecular weight (Poch et al., 2014). Regarding urea, the simulation experiment performed in the presence of nontronite showed detection of the production of cyanate ion OCN− with IR spectroscopy, as was the case for pure urea samples submitted to UV radiation (see Fig. 6b). However, no trace of ammonium ions NH4 + was detected, and a new vibration mode associated to the cyanate ion was observed, which may have been due to interaction of cyanate with Fe3+ ions and/or nontronite layers.
4.3. Implications for the search for organic molecules on Mars
The surface of Mars has been exposed to the current flux of UV radiation for at least 3 billion years. Of course, it was not the intent of this study to reproduce the equivalent of several billion years of chemical evolution in the laboratory. However, our experiments were designed to indicate the relative resistance of several molecules when exposed to UV radiation at the surface of Mars and show the influence of nontronite clay mineral (does it provide protection or catalysis?). Such data are essential input for guiding and interpreting in situ analyses performed when searching for organics in martian soil. The irradiation experiments performed on pure organics (Poch et al., 2014) resulted in molecular half-lives of 10–1000 h at the surface of Mars, indicating that UV irradiation is the principal driver of chemical evolution of organics in the active (i.e., eolian-mobile) layer and in the fresh subsurface materials exposed by impacts. Eolian weathering and dust deposition that exposes and hides soil particles from direct UV light are likely to control the timescale and the extent of this UV-driven evolution of organics. The photodissociation quantum yields in the presence of nontronite (presented in Table 1), and their empirical extrapolation provided by Eq. 3, could be used in a numerical model that takes into account such exposing and hiding effects as well as input rates of organics from micrometeoritic sources at the surface (Moores et al., 2007; Moores and Schuerger, 2012). The balance between the input rates and the photodissociation rates can then give an estimate on the amount of organics that could be expected in martian soil. Qualitatively, our work also shows that the absorption of radiation by solid organic layers can lead to the formation of new molecules in the solid phase that are more resistant to subsequent irradiation (see the case of adenine in Section 3.3.4.2. and mellitic acid by Poch et al., 2014). Some solid organic layers exposed to UV radiation could thus exhibit long-term stability.
To conclude, these experiments performed in the presence of Fe3+-nontronite revealed a pronounced photoprotective effect of this iron-enriched clay mineral on the evolution of glycine and adenine due to both physical shielding and protective physicochemical interactions (see Fig. 10 and Table 1). Conversely, we did not observe any catalytic or stoichiometric degradation caused by surface groups of the mineral matrix (such as Fe3+, OH, or H2O); if they occur at all, it would be on a longer timescale than the photodecomposition due to UV photons.
However, our experiments also showed that some molecules embedded in nontronite might undergo more effective dissociation, as observed for urea. This may indicate a selective protection of some specific organic molecules by nontronite under martian surface conditions. Furthermore, is this reactivity observed for urea in the presence of nontronite due to photocatalytic processes and therefore limited to the surfacic UV-penetrating layer of nontronite? Or is it due to oxidation processes that could possibly occur deeper in the subsurface? Other simulation experiments, as those proposed in Section 5, could provide complementary information relative to these questions.
5. Conclusion
This work focused on the study of the effect of nontronite, an abundant clay mineral in many locations at Mars, and on the evolution of organic molecules in simulated martian surface conditions. Our results reveal a pronounced photoprotective effect of nontronite on the evolution of glycine and adenine. No new product of evolution was firmly identified, but qualitative and quantitative results obtained with urea suggest a particular reactivity in the presence of nontronite, leading to a possible increase of its dissociation rate. Thus, nontronite efficiently preserves at least some organic molecules under martian surface UV irradiation and is consequently a good target to consider in the search for these molecules at the surface of Mars.
In this study, the prepared samples contained a comparable mass of organic molecules and nontronite, or even an excess of organics (see Table 1). They could be representative of a deposit obtained after the evaporation of a warm small pond of liquid water, that has concentrated organic molecules and contains phyllosilicates at the surface of Mars. These samples could also be representative of meteorites or micrometeorites that contain solid organic layers in close interaction with clay minerals (Pearson et al., 2002). To prepare samples representative of a fluviolacustrine environment on ancient Mars, a lower mass ratio of organic molecules compared to the phyllosilicate must be obtained. To do so, future experiments would have to perform several washing steps to remove the molecules that do not interact with the surface, and reduce the molecule/mineral ratio, as discussed by Lambert (2008). Additionally, because our samples consist of a mixture of nontronite grains and organics, we cannot precisely evaluate the clay layer thickness needed to provide the photoprotection of the organics. To overcome this limitation, samples could be prepared by vapor deposition of the organic molecules onto a mineral layer of known thickness prepared beforehand. However, such a sample preparation method, via adsorption from the gas phase, is unrealistic in the context of early Mars. Moreover, the chemical interaction of the molecules with the mineral surface would most probably be different from the case of adsorption from aqueous solutions: no adsorption in the interlayer space and absence of water co-adsorbed with the molecule. To sum up, there is probably no ideal preparation method for environmental analogues of clay-containing organics. But the comparison of the results obtained by several experiments performed with these different kinds of samples could help us better understand the complex influence of the mineral on the evolution of the organic molecules.
Finally, beyond nontronite, future experiments could expand this work to other minerals that may have concentrated organic molecules, such as other types of clay minerals (montmorillonite, saponite, etc.) and sulfates, halite, carbonates, or silica (Farmer and Des Marais, 1999). How do these minerals, which are known on Earth to concentrate and preserve organics, affect the evolution of organic molecules under Mars-like environmental conditions? In the future, it would also be interesting to study the effect of oxidants such as hydrogen peroxide (H2O2) (Encrenaz et al., 2012), perchlorates (
Footnotes
Acknowledgments
The authors wish to thank the French National Program of Planetology (PNP), the Pierre Simon Laplace Institute (IPSL), and the Institut Universitaire de France (IUF). This manuscript benefited from useful comments and suggestions of two anonymous reviewers.
Author Disclosure Statement
No competing financial interests exist.
Abbreviations Used
References
Supplementary Material
Please find the following supplemental material available below.
For Open Access articles published under a Creative Commons License, all supplemental material carries the same license as the article it is associated with.
For non-Open Access articles published, all supplemental material carries a non-exclusive license, and permission requests for re-use of supplemental material or any part of supplemental material shall be sent directly to the copyright owner as specified in the copyright notice associated with the article.