
Abstract
Desert varnishes are thin, dark mineral coatings found on some rocks in arid or semi-arid environments on Earth. Microorganisms may play an active role in their formation, which takes many hundreds of years. Their mineral matrix may facilitate the preservation of organic matter and is therefore of great relevance to martian exploration. Miniaturized Raman spectrometers (which allow nondestructive analysis of the molecular composition of a specimen) will equip rovers in forthcoming planetary exploration missions. In that context, and for the first time, portable Raman spectrometers operating in the green visible (532 nm as currently baselined for flight) and in the near-infrared (785 nm) were used in this study to investigate the composition (and substrate) of several samples of desert varnish. Rock samples that were suspected (and later confirmed) to be coated with desert varnish were recovered from two sites in the Mojave Desert, USA. The portable spectrometers were operated in flight-representative acquisition modes to identify the key molecular components of the varnish. The results demonstrate that the coatings typically comprise silicate minerals such as quartz, plagioclase feldspars, clays, ferric oxides, and hydroxides and that successful characterization of the samples can be achieved by using flightlike portable spectrometers for both the 532 and 785 nm excitation sources. In the context of searching for spectral signatures and identifying molecules that indicate the presence of extant and/or extinct life, we also report the detection of β-carotene in some of the samples. Analysis complications caused by the presence of rare earth element photoluminescence (which overlaps with and overwhelms the organic Raman signal when a 785 nm laser is employed) are also discussed. Key Words: Desert varnish—Raman spectroscopy—ExoMars—Portable spectrometers—Planetary science. Astrobiology 15, 442–452.
1. Introduction
D
Desert varnishes make ideal Mars analogues because they contain both mineralogical and biological signatures. In fact, desert varnishes have been visually observed on Mars (McSween and Murchie, 1999), also suggesting some similarities between martian and arid terrestrial environments. Indeed, martian rocks exhibiting manganese-rich coatings have been recently identified by using data returned by the ChemCam instrument on the Curiosity rover (Lanza et al., 2014). Desert varnishes have been of particular interest to astrobiologists because on Earth they are host to extant organisms that survive in extreme habitats (Mancinelli and White, 1996; DiGregorio, 2002).
Analysis of the extremophilic colonization of geological substrates (in environmentally stressed habitats) with Raman spectroscopy has recently increased in importance with the adoption of miniaturized Raman spectrometers on two forthcoming Mars missions [ESA/Roscosmos ExoMars Raman Laser Spectrometer and two Raman spectrometers on board NASA's 2020 rover mission (NASA Mars 2020, 2014)]. In the ExoMars mission, which is scheduled for launch in 2018, a Raman spectrometer will provide analytical interrogation of crushed rock specimens acquired from the surface and subsurface of the planet in a dedicated search for extinct or extant life signatures (Rull et al., 2011).
One of the key aspects of the experiment reported here is the recognition of spectral bands that are characteristic of protective biochemicals that are produced by microbial colonies as a response to extremes of high-energy (short-wavelength) ultraviolet radiation, desiccation, nutrient limitation, and toxic chemicals (Cockell and Knowland, 1999; Wynn-Williams and Edwards, 2000; Edwards, 2010). These biomarkers are strictly identified as being produced only by biological means and not through abiotic synthesis (they may be biochemical or biogeological in origin). In terrestrial scenarios, they are found in geologically protective niche environments, often as residual entities after the extinction of biological life (Edwards et al., 2013). The potential for the survival of these biomarkers (i.e., carotenoids, scytonemin, chlorophyll, and phycobiliproteins) in stressed environments (e.g., where they are subjected to continuing extremes of radiation and chemical toxicity) is of particular interest. Such situations will most certainly apply on the surface of Mars, where the absence of a significant atmosphere results in an intense insolation of damaging ultraviolet radiation at the surface—some ten-fold that experienced on Earth (Poch et al., 2014). This ionizing radiation has also stimulated the production of reactive chemical molecular species in the surface regolith (such as hydroxyl ions, hydrogen peroxide, metal peroxo species, and perchlorates), all of which can degrade organic molecules like those exemplified above as biomarkers.
In terrestrial scenarios (particularly in hot and cold desert environments), biological colonies have devised several protective strategies. These range from epilithic growth in temperate climates to chasmolithic and finally endolithic colonization in more hostile environments (at strictly “limits of life” situations) such as Mars Oasis, Antarctica (Edwards and Wynn-Williams, 2002). The key factor is the adaptation of the geological matrices to assist their survival. This can involve the harnessing of metal ions to sequester waste-metabolic products and the mobilization of iron(III) oxide (hematite) from the interior regions of colonized sandstones toward the surface to act as an additional defense against ultraviolet radiation penetration (Clark, 1998; Jorge Villar et al., 2005). Key molecules that are biologically synthesized for this purpose are carotenoids, which have a dual role in both preventing penetration of the radiation and acting as repair agents for cellular radiative damage (Cockell and Knowland, 1999).
In extreme terrestrial desert environments, rock surfaces are found with a glassy finish termed desert varnish. The origin of this phenomenon has been attributed to surface extremophilic biological colonization, and the chemicals and biomineralization (of both the rock substrata and the eolian dusts) associated with it have contributed to the creation of a hard skin that still preserves evidence of the previous bacterial activity. It should be noted that there is some doubt as to the active involvement of microorganisms in the production of desert varnish. Indeed, it is hypothesized that microorganisms are passively included in the varnish during an abiotic condensation of silicic species (Perry et al., 2006). However, this hypothesis fails to explain the observed manganese and iron enhancement and significant levels of clay typically found to be present in varnishes (as opposed to the biotic process) (Dorn, 2008). In any case, desert varnishes are associated with bacterial or microcolonial fungal activity, and organic matter has been identified that is preserved within varnish material (Perry et al., 2003; Schelble et al., 2005; Dorn, 2008). Despite possible biological extinction within surface layers, the preservation of the biochemical markers and their recognition indicates the presence of past life. In particular, varnishes may preserve organic matter in hostile environments for considerable time periods. It is therefore a very relevant study for Raman spectrometry, both for understanding the production mechanisms involved in these systems and for their identification in extraterrestrial scenarios.
The miniaturization of analytical Raman spectroscopic instrumentation for the in situ forensic interrogation of remote terrestrial sampling sites, whether crime scenes or geological outcrops, provides much relevant information for the construction of databases for space missions (Vítek et al., 2003; Vandenabeele et al., 2014). Raman spectroscopy affords several important attributes, including the ability to interrogate both the mineralogical and biological components of specimens (in this case, desert varnish and the associated rock substrate) nondestructively and without mechanical or chemical separation procedures (Jorge Villar and Edwards, 2006; Miralles et al., 2012; Jehlička and Oren, 2013). Portable Raman spectrometers have been used to analyze geological and biological molecules in mining sites, meteorite craters, glaciers, and mountainous terrain (Jehlička et al., 2010, 2011). From such studies, it is possible to assess the influence of spaceflight-compromised instrument parameters, such as limited wavenumber range, broader spectral resolution, laser excitation wavelength, and ambient light intensity, on the ability to detect characteristic Raman bands indicative of biomarker presence in a range of mineral matrices. Some important conclusions have thus been reached on a variety of potential organic biomarker and inorganic mineral specimens in the field and in the laboratory with portable Raman instrumentation (Edwards et al., 2012).
Here, for the first time, we present preliminary studies of desert varnish specimens and the identification of their biogeological components, using portable Raman spectroscopic instrumentation. The measurements provide novel data for assimilation into the developing spectral databases for application in remote analytical studies that use rover-based instruments and laboratory flight-representative prototypes. We also comment on the challenges involved in obtaining such spectra, particularly the photoluminescence induced in the near-infrared for geological specimens that contain rare earth elements.
2. Materials and Methodology
2.1. Specimens
Several specimens of rock (appearing to exhibit a varnished surface) were obtained from two separate locations in the Mojave Desert, USA (see Fig. 1). The first set (a collection of three samples; labeled DV1, DV2, and DV3) was retrieved from Death Valley at an altitude of 939 m at location 36°44′52.52"N, 116°57′12.04"W. The rocks were lying on a stabilized alluvial fan surface above, and adjacent to, the large modern active channel descending from the northwestern edge of the Funeral Mountains. Rocks within the catchment are mostly orthoquartzites or micaceous quartzites from the Paleozoic Era (Carr et al., 1996). The sampled clasts themselves appear to be somewhat water-worn but are clearly covered with a black varnish on their upper surface (i.e., the surface directly exposed to the atmosphere), implying that the location has been geomorphically stable for some time. The surface in contact with the desert soil has an orange to reddish appearance.
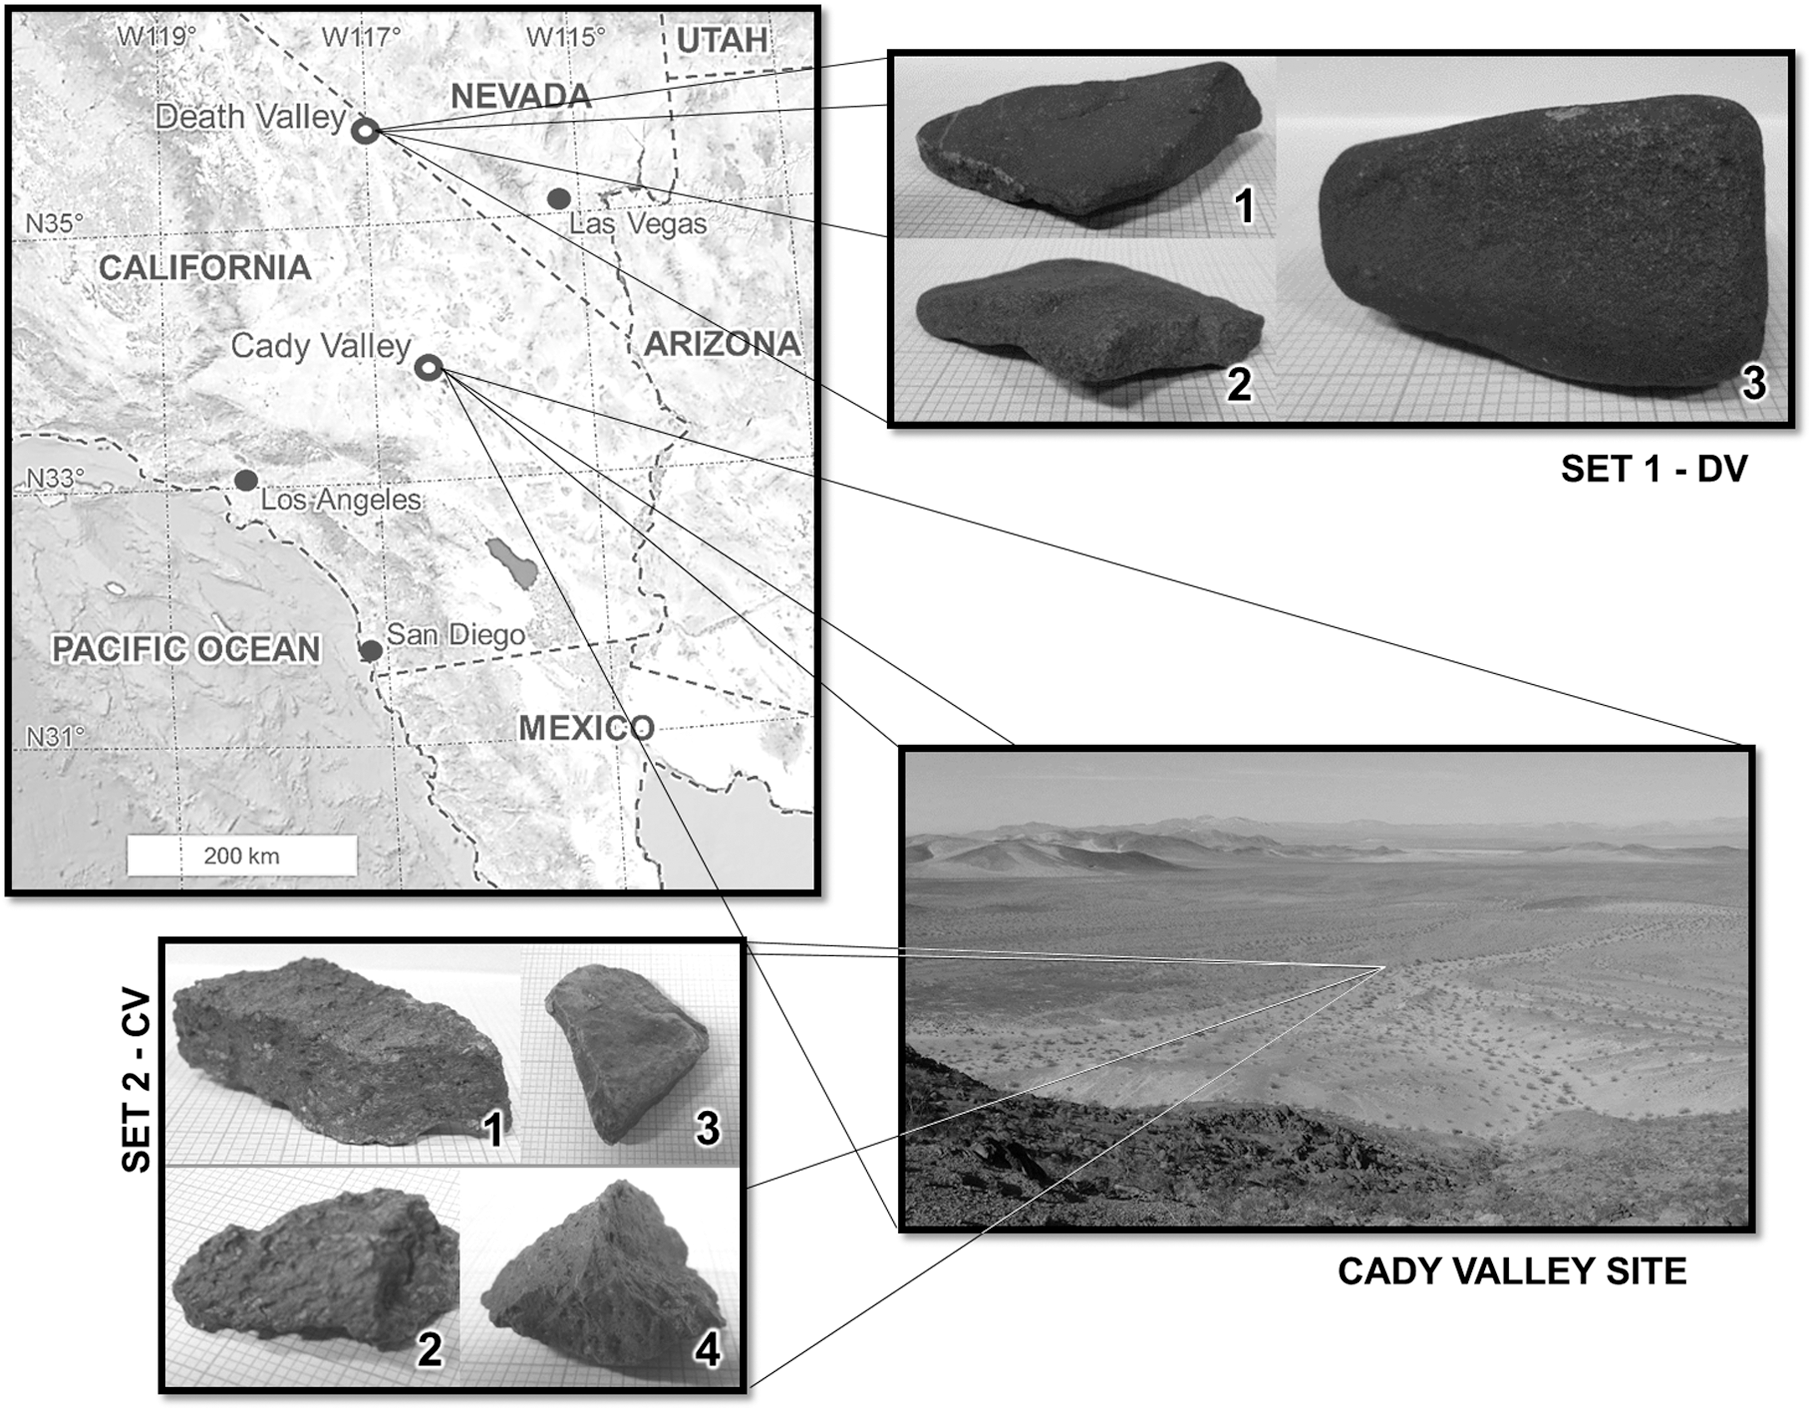
Locations and photographs of the seven specimens.
The second set (four samples; labeled CV1, CV2, CV3, and CV4) was retrieved at an altitude of 685 m at location 34°54′55.71"N, 116°28′54.56"W in the Cady Valley, east of the town of Barstow, California. These samples were from a desert pavement surface that overlies a stabilized eolian deposit banked against a mountain front (a “sand ramp”) (Lancaster and Tchakerian, 1996). The rocks themselves, which were transported onto the sand ramp from the adjacent mountain slopes via alluvial/colluvial processes, are metavolcanic dating to the Mesozoic Era. Preliminary optically stimulated luminescence dating of the underlying eolian sands implies that the overlying stone surface has been in place for up to 50,000 years. The samples appear to be less water-worn than those from the Death Valley site and still exhibit sharp ridges and pores, presumably reflecting the short transport distance from the immediately adjacent mountain front. They are coated with a brownish varnish that is lighter in color than the varnish on DV1, DV2, and DV3. As with the Death Valley samples, the surface in contact with the desert soil is lighter in color than the surface directly exposed to the atmosphere.
2.2. Microscale images
Microscale images of the sample surfaces (using a ×10 objective, 0.25 NA) were recorded with a Brunel SP60P microscope equipped with a Canon EOS 1100D camera.
2.3. Raman spectroscopy analysis
Raman spectra of the varnish (and the underlying rock) were acquired with two portable spectrometers. The instrument operating parameters were similar to the flight operating modes of instruments under development for Mars exploration missions (Hutchinson et al., 2014). The first was a Raman Advantage 532 spectrometer with a laser excitation wavelength of 532 nm (able to irradiate the sample with a maximum power of 100 mW and a spot size of 50 μm as measured on silicon) and a thermoelectrically cooled CCD detector. Data were obtained with a spectral resolution of 10 cm−1 across the 200–3400 cm−1 wavenumber offset range.
The second spectrometer comprised a handheld portable Raman Inspector, with an excitation wavelength of 785 nm (able to irradiate the sample with a maximum power of 120 mW and a spot size of 75 μm as measured on silicon) and a thermoelectrically cooled CCD detector. Data were obtained with a spectral resolution of 8 cm−1 across the 200–2000 cm−1 wavenumber offset range.
Two strategies were adopted to obtain Raman spectra from the specimens. Firstly, spectra were acquired from random positions on both the sample surface (i.e., with no sample preparation) and the rock substrata (the samples were cut in two pieces with a chisel). Secondly, spectra were obtained from extracts of the varnish material that were removed from the surface of the samples with a heat-sterilized stainless steel tool (drill bits were not used to remove the varnish layer to avoid local heating and the destruction or heat-induced phase transition of the bio- or geo-markers).
Exposure times (for individual measurements) were typically in the range 3–30 s, depending on the particular level of spectral background exhibited by a given sample and surface location. Several spectra were averaged to improve the signal-to-noise ratio (provided that significant intensity variations between each of the individual spectra were not observed). Geo- and biomarkers were identified according to their Raman signature (attribution of ∼ 3–5 distinct bands and assessment of their relative intensities was required for molecular identification). For geo-markers, spectral identification was subsequently verified with reference to spectra obtained from a mineral sample collection (obtained in identical conditions, using the same instrumentation) or from databases (Laetsch and Downs, 2006), when appropriate reference samples were not available.
3. Results
3.1. Microanalysis of the samples
Six microimages are presented in Fig. 2 (selected as being representative of all the images acquired from the surfaces of the samples). Notable observations include
(a) The three DV samples appear similar. The base surfaces (see Fig. 2A) reveal a conglomerate of transparent crystals and an orange-colored cement binding the crystals together. Small, white crystals are also present within asperities on the surface. The top layer of the samples (see Fig. 2B) presents dark botryoidal nodules that result in a surface roughness (of scale size up to 100 μm), and in this case no distinct minerals are evident.
(b) The surface of one of the samples (CV1) is very uneven (see Fig. 2C, base surface, and Fig. 2D, top surface) and appears to be covered by a light varnish that reduces the sharp ridges associated with the mineral grains beneath.
(c) A different morphology is observed with the remaining samples in the second set (CV2, CV3, and CV4). The surfaces (Fig. 2E, base surface, and Fig. 2F, top surface) appear to be smooth and entirely covered with varnish. The only sign of heterogeneity is the coloration, which appears to be mottled.

Representative microphotographs of the varnishes from both sets of samples. Each image is 1700 μm large and 1100 μm high (the white scale bar in the bottom right-hand corner represents 250×50 μm).
3.2. Raman spectroscopy analysis using 532 nm excitation
The samples in both sets were analyzed with an Advantage 532 spectrometer without specific preparation. Using excitation at 532 nm, we identified only two geo-markers.
• The Raman signature of quartz (SiO2, main band at 465 cm−1) was found in samples DV1, DV2, DV3, and CV3 for both the rock substrata and varnish coatings (Fig. 3A).
• The other three samples were found to contain a plagioclase feldspar (a feldspar of general composition Na x Ca1-x Al2-x Si2+x O8, main Raman signature at 508 cm−1), which was again observed in both the rock substrata and varnish coatings (Fig. 3B).
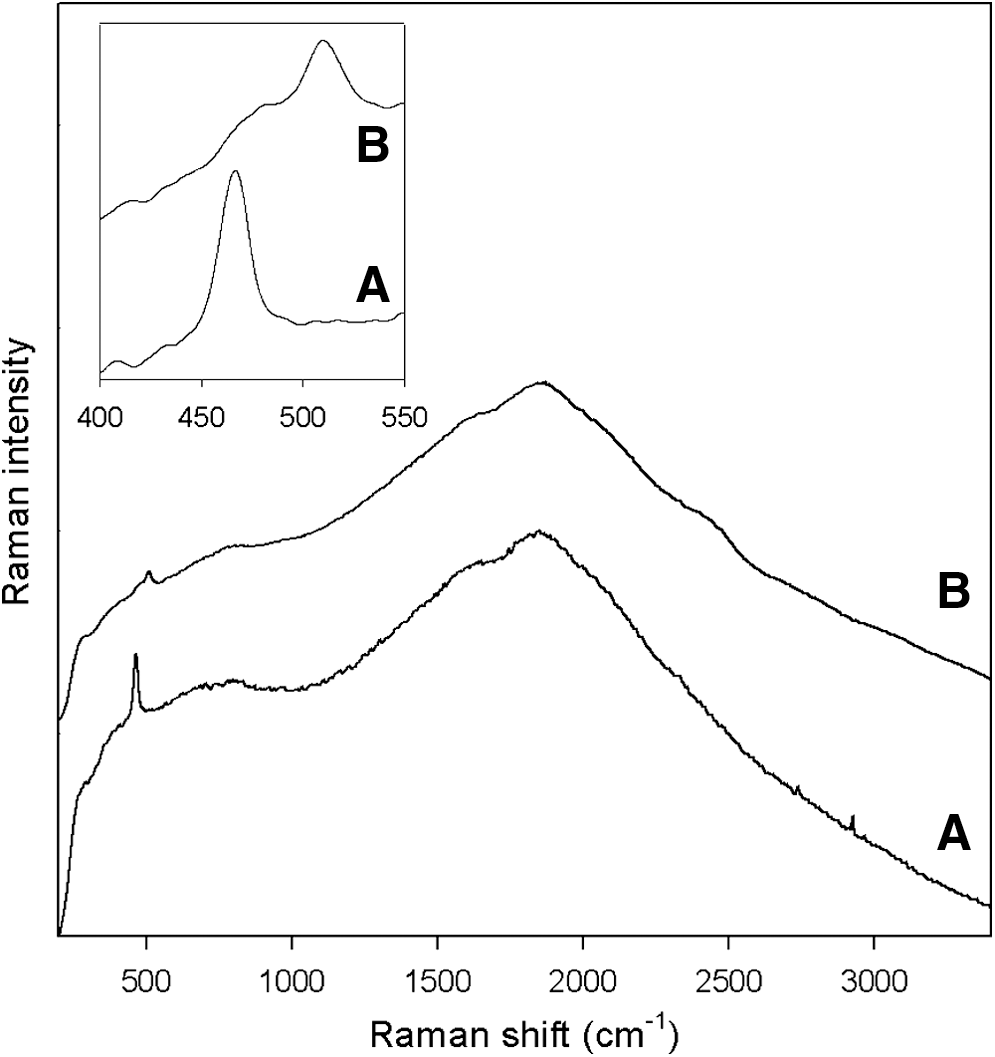
Selected Raman spectra obtained from desert varnishes with the portable Raman spectrometer equipped with the 532 nm laser. Inset: zoomed section of the spectra. The spectra belong to (
Figure 4 presents a selection of Raman spectra obtained from several separate grains of varnish (removed from the surface of the specimens with a stainless steel tool). The grains were deposited onto a reflective steel plate (which improved signal acquisition). In addition to quartz and plagioclase feldspar, several geo- and biomarkers were identified in the varnish coatings that are not seen in the rock substrata.
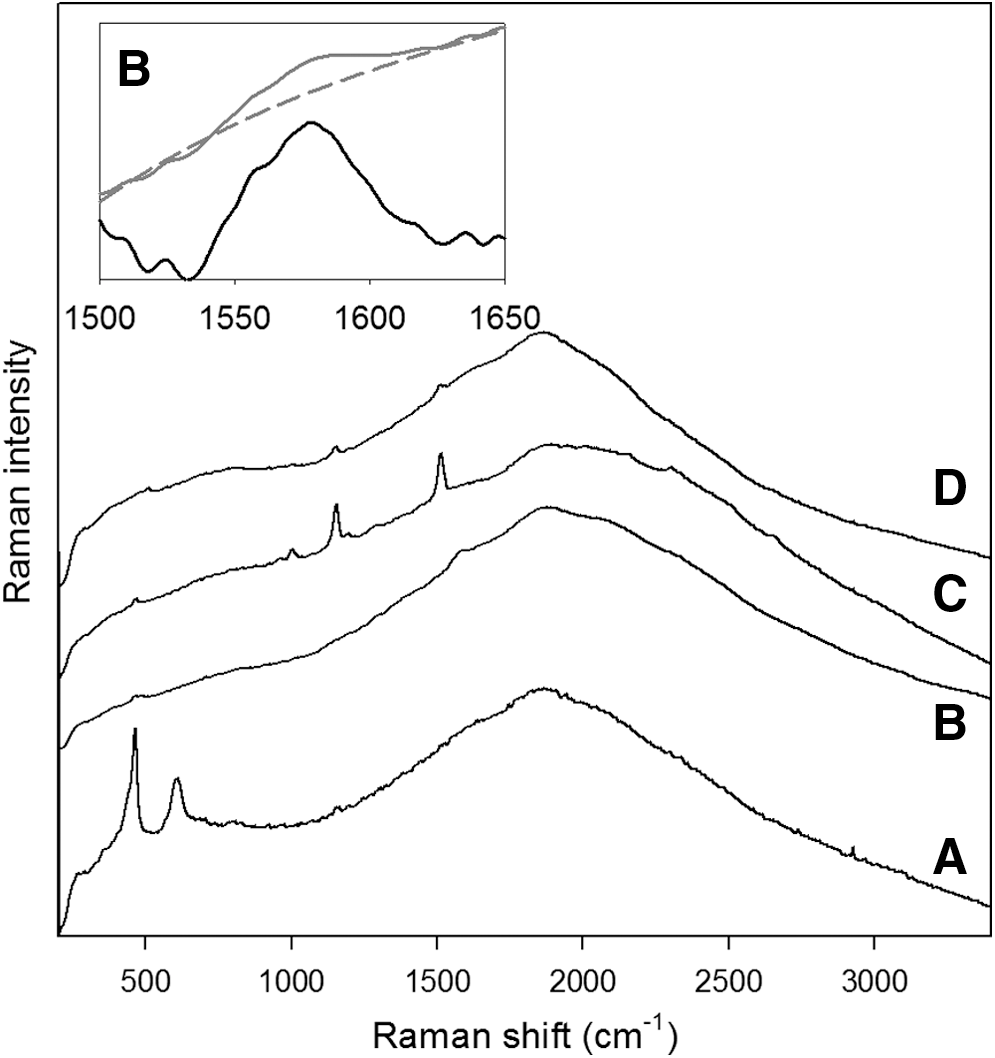
Selected Raman spectra obtained from extracts of desert varnish (that were removed from the surface of the specimens with a stainless steel tool) using a 532 nm excitation source. (
• The Raman signature of rutile (TiO2, signal at 232, 451, and 609 cm−1) was found for samples DV2 and DV3. In spectrum A in Fig. 4, the rutile signature appeared simultaneously with the signature of quartz (and the bands at 451 cm−1 of rutile and at 465 cm−1 of quartz were not entirely resolved).
• Carbon (C, signal at 1577 cm−1) was found to be present in sample DV3 (Fig. 4B, where the 465 cm−1 band of quartz was also present).
• Finally, carotenoids such as β-carotene (C40H56, signal at 1006, 1155, and 1515 cm−1) were observed for samples DV2, CV1, and CV4. For sample DV2, the signal of carotenoids was detected along with quartz (Fig. 4C). For samples CV1 and CV4, carotenoids were detected together with plagioclase feldspar (Fig. 4D).
It should be noted that Raman signatures of carotenoids and carbon were only detected when the varnish was analyzed alone (as grains deposited onto a reflective plate). Most probably, when the analysis is undertaken on the unprepared rock, the signal from the rock substrata occludes the Raman signature of the varnish layer. This is simply because the varnish constitutes only a small fraction of the excited material.
3.3. Raman spectroscopy analysis using a 785 nm excitation source
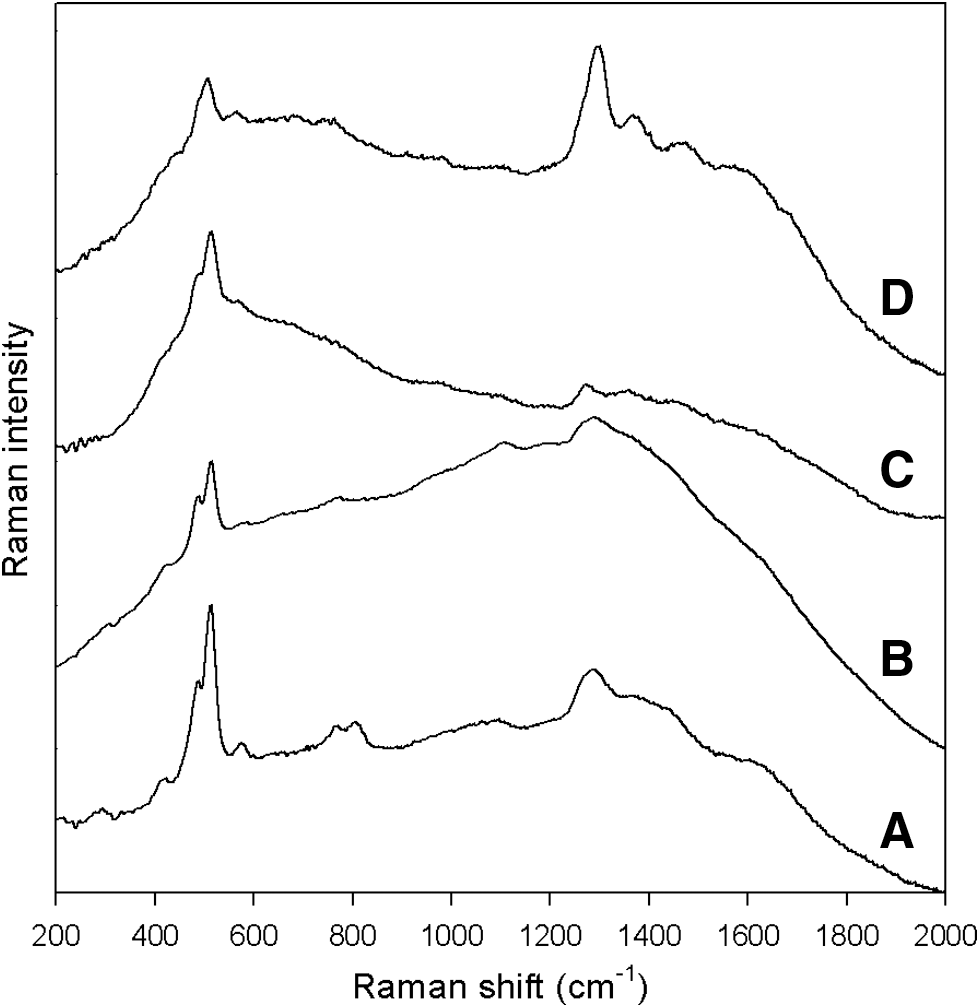
Raman spectra were acquired from both sets of specimens (without any specific sample preparation) with the 785 nm portable Raman spectrometer (see Figs. 5 and 6 for spectra obtained from the rock substrata and varnish coatings, respectively). The intensity of the background in these spectra is relatively high and was observed to be dependent on both the nature of the sample and the position on the sample. The Raman bands can be divided into two groups: the first group spans the 200–1100 cm−1 spectral range (where most geological Raman signatures are found), and the second corresponds to the 1100–2000 cm−1 spectral range (where organic compounds typically exhibit Raman signatures).

Normalized Raman spectra recorded for the rock substrata using a 785 nm excitation source. (

Selection of Raman spectra recorded on desert varnishes with the portable Raman spectrometer equipped with the 785 nm laser. The spectra belong to (
By using the 785 nm excitation line, the two silicates were identified again on the rock substrata and the varnish coatings.
• Quartz (SiO2, 465 cm−1) was detected in all rock substrata and varnish layers for all dark varnishes (DV1, DV2, and DV3). In addition, it was identified in the rock substrata and the varnish coating of sample CV3. Quartz was also found to be present in the varnish coatings of samples CV1 and CV4 (but with less intensity compared to the other samples in which quartz was detected).
• Plagioclase feldspar was identified in all the CV samples (in both the rock substrata and varnish layers) by using the primary band at 508 cm−1 with the exception of CV3, where no signal from plagioclase feldspar was discerned. Evidence of plagioclase feldspar was also detected in the rock substrate of sample DV2 and in the varnish layer of sample DV1.
Besides the silicates, minerals containing iron and titanium oxides were also detected: • Hematite (Fe2O3, 293, 411, 500, and 610 cm−1) was found in all rock substrata, except CV3 and DV3, and it was also identified in most of the varnishes (DV1, DV2, DV3, CV1, CV2, and CV4). • The presence of goethite [FeO(OH), 299, 393, and 555 cm−1] was detected in most of the varnish layers, with the exception of CV3 (noting that when the intensity related to goethite was small, only the band at 393 cm−1 was detected). It was found only in the rock substrata of DV3. • There was some evidence for the presence of magnetite (Fe3O4, 670 cm−1) in the rock substrata of CV2 and CV4 and in the varnish coating of CV1, CV2, and CV4. • Anatase (TiO2, 395, 514, and 635 cm−1) was detected in the rock substrata of sample CV4 and in the varnish for samples DV1 and DV2. • Rutile (TiO2, 232, 445, and 609 cm−1) was found in the rock substrate for sample DV3 and in the varnish layers for the samples DV1 and DV3.
Weaker bands (that require the correction of the baseline by fitting a polynomial of the fifth order to the background) could also indicate the presence of clay (288 and 705 cm−1). Clay was identified in the rock substrates of DV3 and CV3 and the varnish coating for sample DV3. However, the 288 cm−1 band of clay overlaps with the 299 cm−1 band of goethite (and falls in an area of the spectral shifts affected by the laser filter), so the presence of goethite or clay is only confirmed when another, corroborating band is found (i.e., at 393 or 705 cm−1, respectively). A summary of the minerals/organics detected in the samples studied is presented in Table 1.
4. Discussion
For the first time, portable Raman spectrometers were used to characterize desert rocks with a mineral varnish. Two separate excitation wavelengths were used, and it was found that the Raman signal intensities fluctuated with position on the sample surfaces. This confirmed the heterogeneity of the varnish composition and thickness (i.e., the relative amount of varnish in the sample volume being interrogated). It is also consistent with sample parameters such as the surface roughness and varnish coloration. Indeed, absorption of visible light is expected for dark samples such as the desert varnishes. Consequently, the Raman intensity can be reduced significantly through the absorption of either the incident laser light or scattered Raman light. For example, the Raman spectra acquired from the red hematite inclusions (present in the rock substrata of CV1, CV2, and CV4) were only observed when using the near-infrared laser; excitation at 532 nm resulted in no significant Raman bands. Due to this heterogeneity, the acquisition of several (between 10 and 20) spectra (recorded at random spatial position) was necessary to study one sample comprehensively.
Fluorescent centers are more readily activated by excitation at shorter wavelengths; therefore, near-infrared Raman spectrometers are often favored for characterizing biogeological samples (i.e., because they yield lower fluorescence backgrounds; Ferraro et al., 2003). Red and near-infrared lasers are also valuable for searching carbon residues (including fossilized carbon) in rocks (Olcott Marshall and Marshall, 2013). However, for these varnish samples the Raman spectrum between 1100 and 2000 cm−1 is dominated by fluorescence, particularly at 785 nm excitation wavelength. The kind of sharp photoluminescence signal observed here can be induced by rare earth elements present in trace amounts (less than 1%) in crystal defects or amorphous materials (like glasses) (Gaft et al., 2005). Among the rare earth cations, only Nd3+ is known to lead to photoluminescence between 830 and 940 nm (MacRae and Wilson, 2008). Such photoluminescence (although commonly found in several geological reference samples—see Fig. 8) is difficult to interpret because of inconsistencies in band positions, widths, and intensities arising from crystal field effects (small lattice changes around Nd3+ sites) (Lenz et al., 2013). To prove the photoluminescent nature of that signal, the spectrum of a given sample of reference (a macrocrystal of apatite from Canada) was interrogated with the two different laser lines (532 and 785 nm). As shown in Fig. 7, a very intense fluorescence signal is detected when using the 785 nm laser but not the 532 nm laser. A practical implication of the detection of high fluorescence signal simultaneously with Raman signal is that the recording time is limited (to avoid the saturation of the CCD detector), meaning that the detection of weak Raman features will be limited. However, the fluorescence signal detected here gives additional information regarding the sample composition. Indeed, these data demonstrate that (with a carefully selected excitation wavelength) it is possible for a Raman spectrometer to simultaneously acquire Raman and fluorescence data associated with geological and biogeological composition.
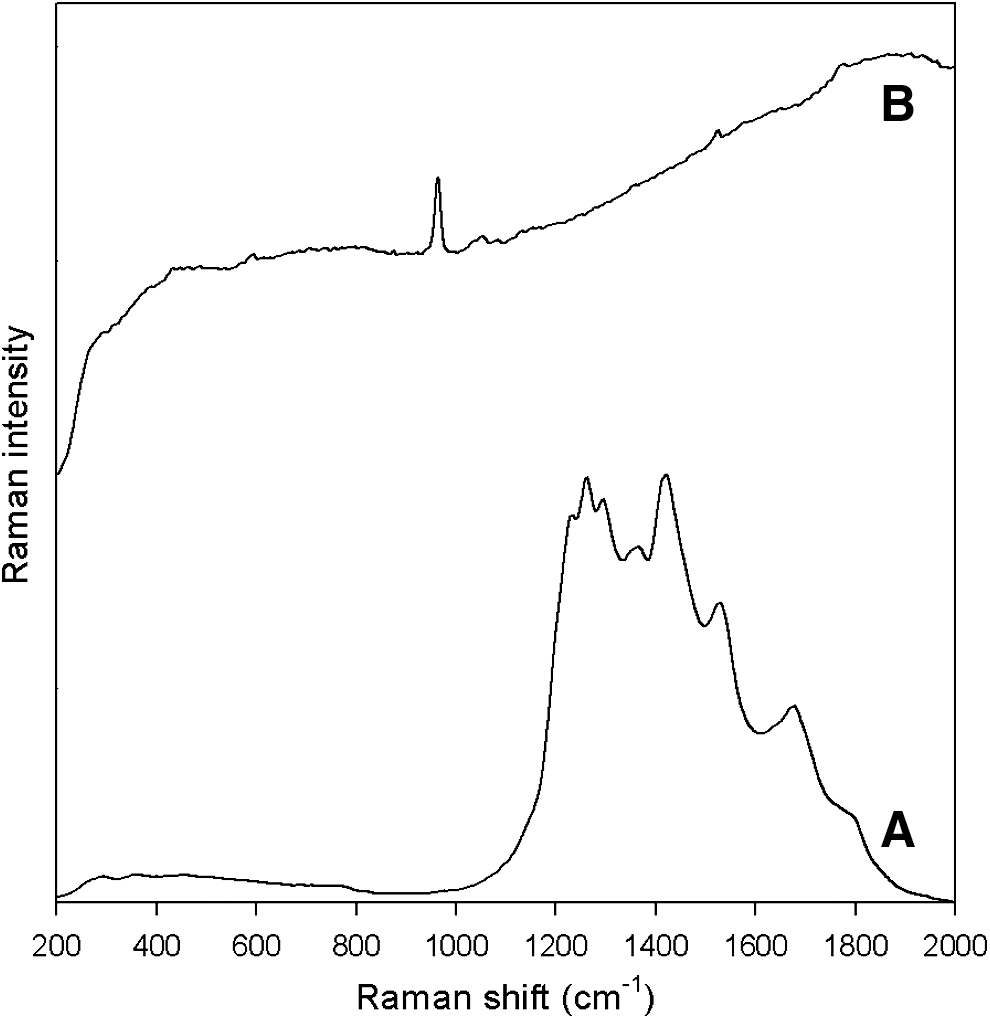
Raman spectra of a sample of fluoroapatite from Canada. (
Raman spectra obtained from reference samples of the plagioclase feldspars, recorded with the 785 nm portable spectrometer (recording time 20 s, 8 accumulations). (
In the context of this study, the use of 532 and 785 nm excitations is complementary. Excitation at 785 nm is more suitable for obtaining geological information from the varnishes compared to Raman data acquired at 532 nm. This is especially true for iron-based minerals such as hematite, goethite, and magnetite, which were not observed at 532 nm excitation. Hematite inclusions were only observed when using the 785 nm portable spectrometer. However, at this excitation wavelength the signal observed between 1100 and 2000 cm−1 (where we may expect to observe biomarkers) is dominated by sharp Nd3+ fluorescence (which was ∼105 more intense than the Raman emission). At 532 nm excitation, the detection of carbon in sample DV3 was achieved. At this excitation wavelength, carotenoids exhibit resonant Raman emission (at 1006, 1155, and 1515 cm−1) and are also readily detected.
From the Raman signatures of their constituting silicates, the two series of samples with different rock substrata are clearly discriminated (using both excitation lines at 532 and 785 nm). The rock substrata of samples DV1, DV2, and DV3 are mainly composed of quartz, while those for samples CV1, CV2, and CV4 mainly contain plagioclase feldspar. However, from the data collected, it is difficult to assess which particular plagioclase feldspar is present in each case. Indeed, albite (NaAlSi3O8, 508, 760, and 800 cm−1) and anorthite (CaAl2Si2O8, 508 cm−1) are the end members of the plagioclase group, a continuous solid solution. Raman spectra obtained from reference samples of plagioclase feldspars are presented in Fig. 8. These were acquired with the same instrument and operating conditions used for analyzing the varnish samples. Hematite (often observed to be associated with magnetite for samples recovered from Cady Valley) is also present in most of the rock substrata. In addition, for both sample sets, the varnish layers can be differentiated from the rock substrata by the additional presence of goethite and titanium oxides (anatase and rutile). Interestingly, clay, rutile and goethite (minerals typically found in the varnish coatings) are found in the rock substrate of DV3. This sample is seen to contain small dark veins, and it is possible that they are filled with desert varnish material. The presence of goethite in the desert varnishes suggests that they are younger than the rock substrata (Edwards et al., 2001). This is consistent with the hypothesis that desert varnishes are formed on a stable preexisting rock substrate.
Sample CV3 is distinct from the rest of the Cady Valley samples. Quartz appears to be the main mineral constituent of the rock substrata, there is no hematite, and clay is weakly detected. More importantly, none of the varnish markers are detected in the outer layer of that sample. Interestingly, this difference in composition reflects the change in macroscopic aspect of the four rock samples. Indeed, the rock of CV3 appears gray and homogeneous, while the rocks of CV1, CV2, and CV4 seem to be a conglomerate of hematite and plagioclase inclusions in a pink plagioclase matrix. This probably reflects a different origin for this rock sample, which is unsurprising given the considerable local-scale complexity and variability of the geology in the Cady Mountains.
Carbon is observed in the spectrum obtained from sample DV3, which includes a single band at 1577 cm−1, indicating that the carbon is highly reduced and close to graphite (sp 2 hybridized carbon) (Ferrari, 2007). Raman spectroscopy cannot be used to distinguish between biogenic and abiotic sources of carbon (Pasteris and Wopenka, 2002, 2003; Marshall et al., 2010). While the presence of graphitic carbon is not direct evidence of extinct life, it is possible that it could have resulted from highly thermally processed carbonaceous residues from living organisms. In the context of planetary exploration, detection of carbon, even if highly graphitic, is very significant since it presents a possible source of carbon for utilization by living organisms (Petsch et al., 2001).
Another interesting aspect of this work is the identification of the resonance Raman signature of carotenoids, reported for the first time for desert varnish layers characterized by using flight-representative portable spectrometers (see samples DV2, CV1, and CV4). Carotenoid molecules such as β-carotene are easily oxidized under high insolation. Their detection in geological samples subjected to harsh conditions (insolation, dryness, high temperature) such as desert varnish is only achievable if they are freshly excreted by the organisms. This strongly suggests that those samples exhibiting carotenoid signatures have the ability to host living organisms, confirming the biofriendly habitat potentially provided by desert varnish.
The recognition of goethite, rutile, anatase, carbon, and carotenoid does not confirm the mechanism responsible for the formation of desert varnish. Both biotic and abiotic models imply transformation of iron ores and input of eolian materials. Goethite could result from a transformation of hematite, and titanium oxides (absent in the rock substrata) could result from dust deposition. Also, clay materials, although reported to constitute 70% of the varnish layer, were only detected at a very low level in a few of the spectra. Portable spectrometers are less sensitive to clay minerals, probably due to their small grain size, which results in a lower level of scattering light (even using a microspectrometer) (Israel et al., 1997). In addition, manganese oxide, another important constituent of desert varnishes, was not detected in this study.
Desert varnishes have been identified during previous missions to Mars (McSween and Murchie, 1999; Lanza et al., 2014), and they are therefore recognized as appropriate terrestrial analogues in terms of geological formations. The martian surface is covered with iron oxide dust, so the iron-based mineralogy of desert varnish is highly relevant for the characterization of instruments designed for the geological exploration of Mars. The results reported and discussed are in line with previous studies aiming to assess the capability of miniaturized Raman spectrometers to interrogate samples relevant to planetary missions (Jehlička et al., 2011; Miralles et al., 2012; Edwards et al., 2013; Hutchinson et al., 2014). Even though the desert varnish samples were challenging to interrogate with Raman spectroscopy (because of the low amount of material available on the rock substrata and the dark coloration), their general geology was successfully identified by using portable Raman spectrometers. Sample excitation at 532 nm yielded detection of quartz, plagioclase feldspar, rutile, and carbon. With the exception of carbon, excitation at 785 nm allowed detection of the same compounds as well as hematite, anatase, clay, magnetite, and goethite. The varnish layer and rock substrata were clearly discerned according to their geology, and the analysis presented in this study constitutes a successful characterization of the varnish samples.
Furthermore, in the event that any extant organisms are present on Mars, it is possible that they will share survival mechanisms with terrestrial extremophiles. Given the adaptations of terrestrial organisms that are able to survive high insolation, desiccation, and poor nutriment, carotenoid molecules such as those found in desert varnishes constitute ideal science targets. Observation of these carotenoids in desert varnish with portable Raman spectroscopy at 532 nm excitation was demonstrated to be straightforward. This is the same excitation wavelength utilized by the ExoMars Raman Laser Spectrometer (RLS) instrument.
5. Conclusions
For the first time, desert varnishes were analyzed with flight-representative Raman spectrometers. Two excitation wavelengths were used (532 and 785 nm). Carotenoids were readily identified in some of the varnish samples due to their resonant Raman signal near 532 nm, strongly indicating the presence of extant life. We have also demonstrated the complementary nature of the geological data that can be obtained, using the two separate excitation wavelengths. The sample sets used were of two quite different substrate geologies (quartz and plagioclase feldspar), which were easily discerned by the spectrometers. Similarly, the difference in geology between the rock substrates and varnish coatings was clearly apparent in the spectra obtained. Given the results reported in this study, the authors recommend that Raman spectrometers designed for future flight opportunities should incorporate two excitation lasers, one green and one in the near infrared.
Footnotes
Acknowledgments
C.M. acknowledges support from the Department of Chemistry at the University of Liège: H.G.M.E., I.B.H., and R.I. acknowledge the support of the STFC Research Council and the UK Space Agency in the UK ExoMars programme; L.V.H. acknowledges studentship support from the STFC Research Council; and A.S.C. and A.B. acknowledge support from the Department of Geology at the University of Leicester.
Author Disclosure Statement
No competing financial interests exist.