
Abstract
A scale model of the proposed Titan Mare Explorer capsule was deployed at the Planetary Lake Lander field site at Laguna Negra, Chile. The tests served to calibrate models of wind-driven drift of the capsule and to understand its attitude motion in the wave field, as well as to identify dynamic and acoustic signatures of shoreline approach. This information enables formulation of onboard trigger criteria for near-shore science data acquisition. Key Words: Titan—Vehicle dynamics—Science autonomy—Lake. Astrobiology 18, 607–618.
1. Introduction
T
TiME was proposed in 2007 in response to a NASA call for mission ideas that would be enabled by an efficient radioisotope power source, the Advanced Stirling Radioisotope Generator (ASRG). The concept (along with 27 others) was developed to further the 2010 NASA Discovery solicitation and was one of three selected for a $3M Phase A study to generate detailed plans for possible flight implementation. This implementation, with a $425M cost cap, foresaw launch in 2016, with arrival at Titan in July 2023.
In many ways, TiME (Fig. 1) has served as the archetype of a mission that would benefit from the science autonomy approaches under development in the (independent) Planetary Lake Lander (PLL) project (Cabrol et al., 2012).
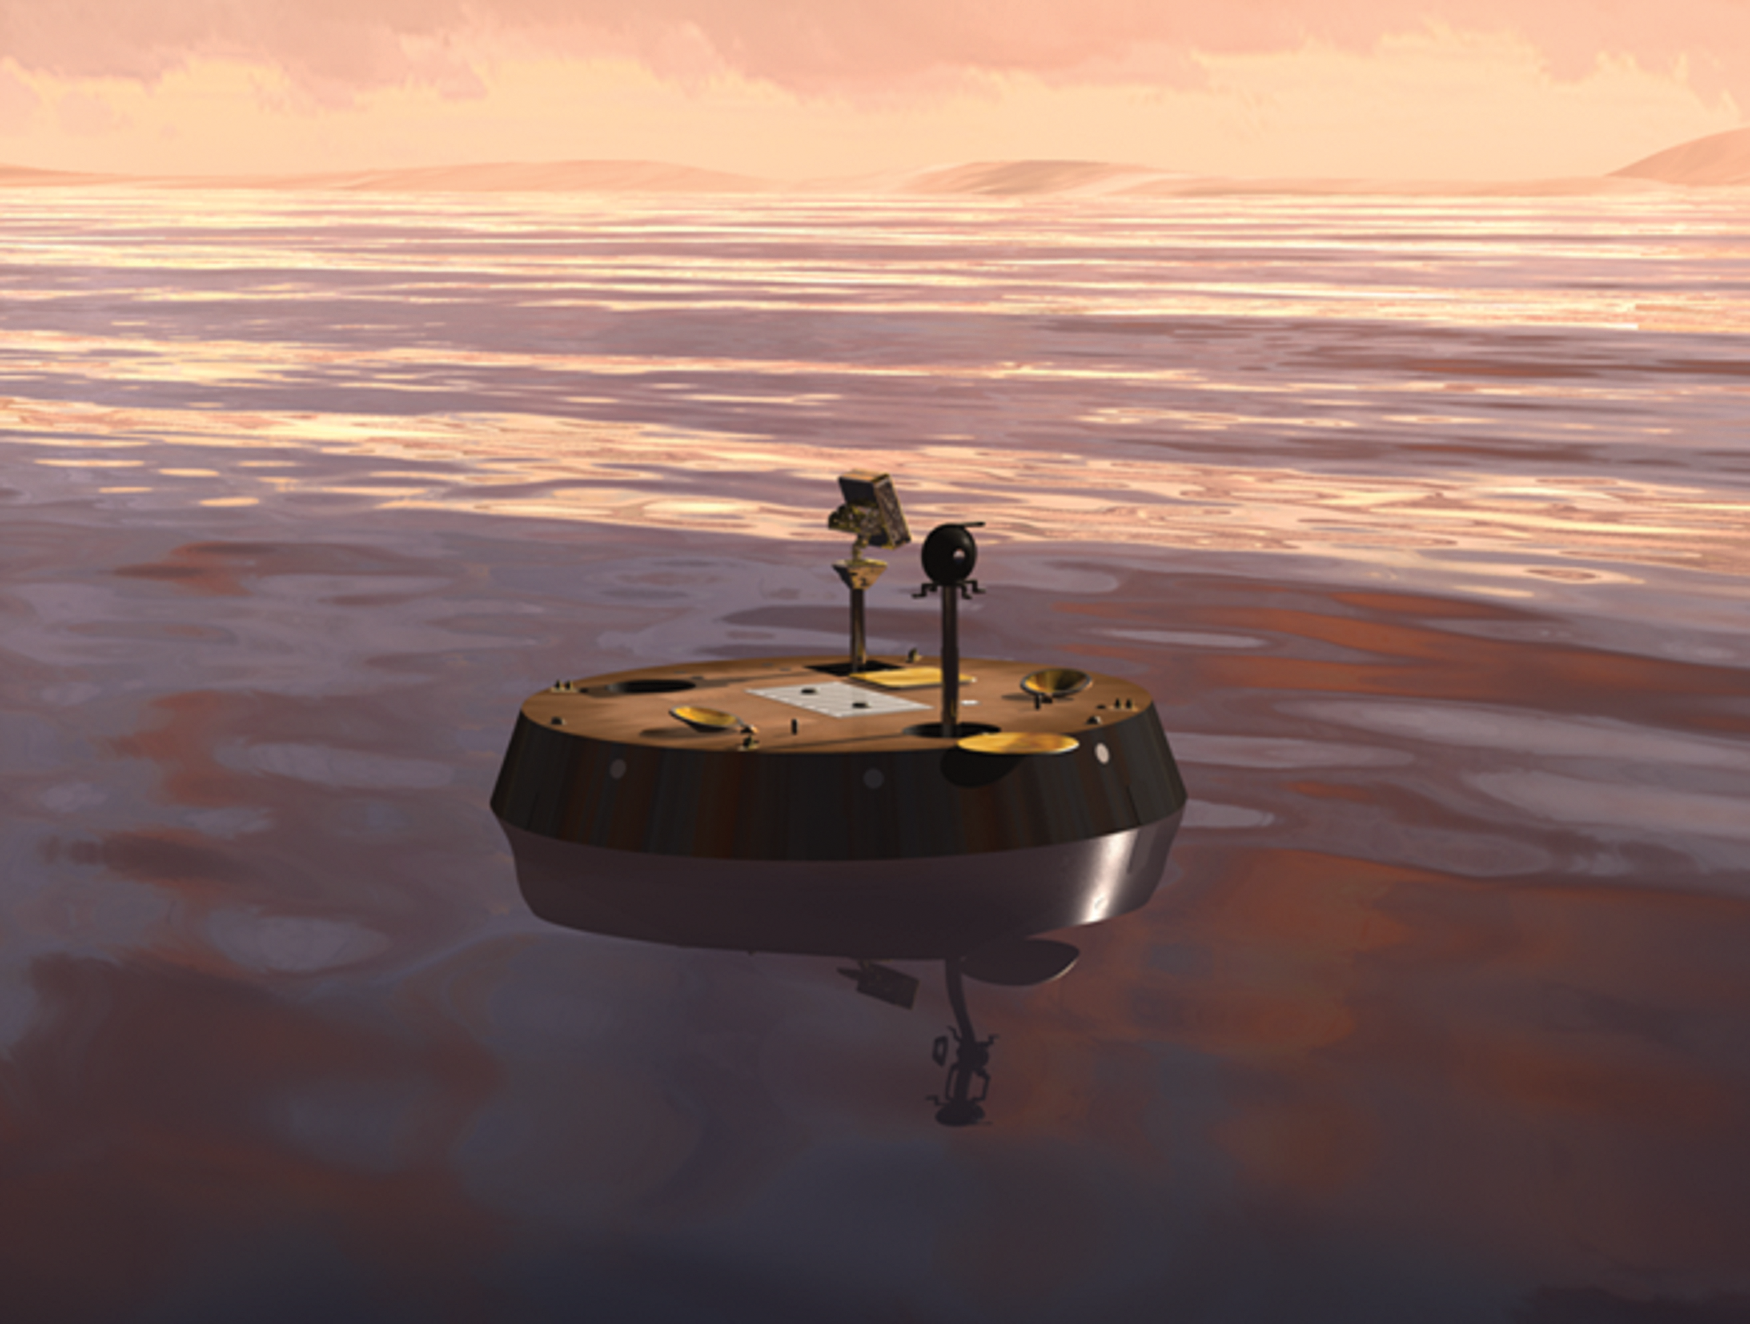
Artist's impression of the TiME capsule floating on a hydrocarbon sea on Titan.
TiME's science objectives as proposed, responsive to goals from the 2003 Solar System Decadal Survey, were as follows: (1) measure the sea chemistry to determine its role as a source and sink of methane and its chemical products, (2) measure the sea depth to help constrain organic inventory, (3) constrain marine processes, including sea circulation and the nature of the sea surface, (4) determine sea surface meteorology, and (5) constrain prebiotic chemistry in the sea. These goals would be met through measurements of the organic composition of Titan's sea Ligeia Mare (Fig. 2) using a mass spectrometer, and the characterization of the air-sea interactions with an imaging system, a meteorology package, and physical properties sensing of the liquid (including acoustic depth sounding).
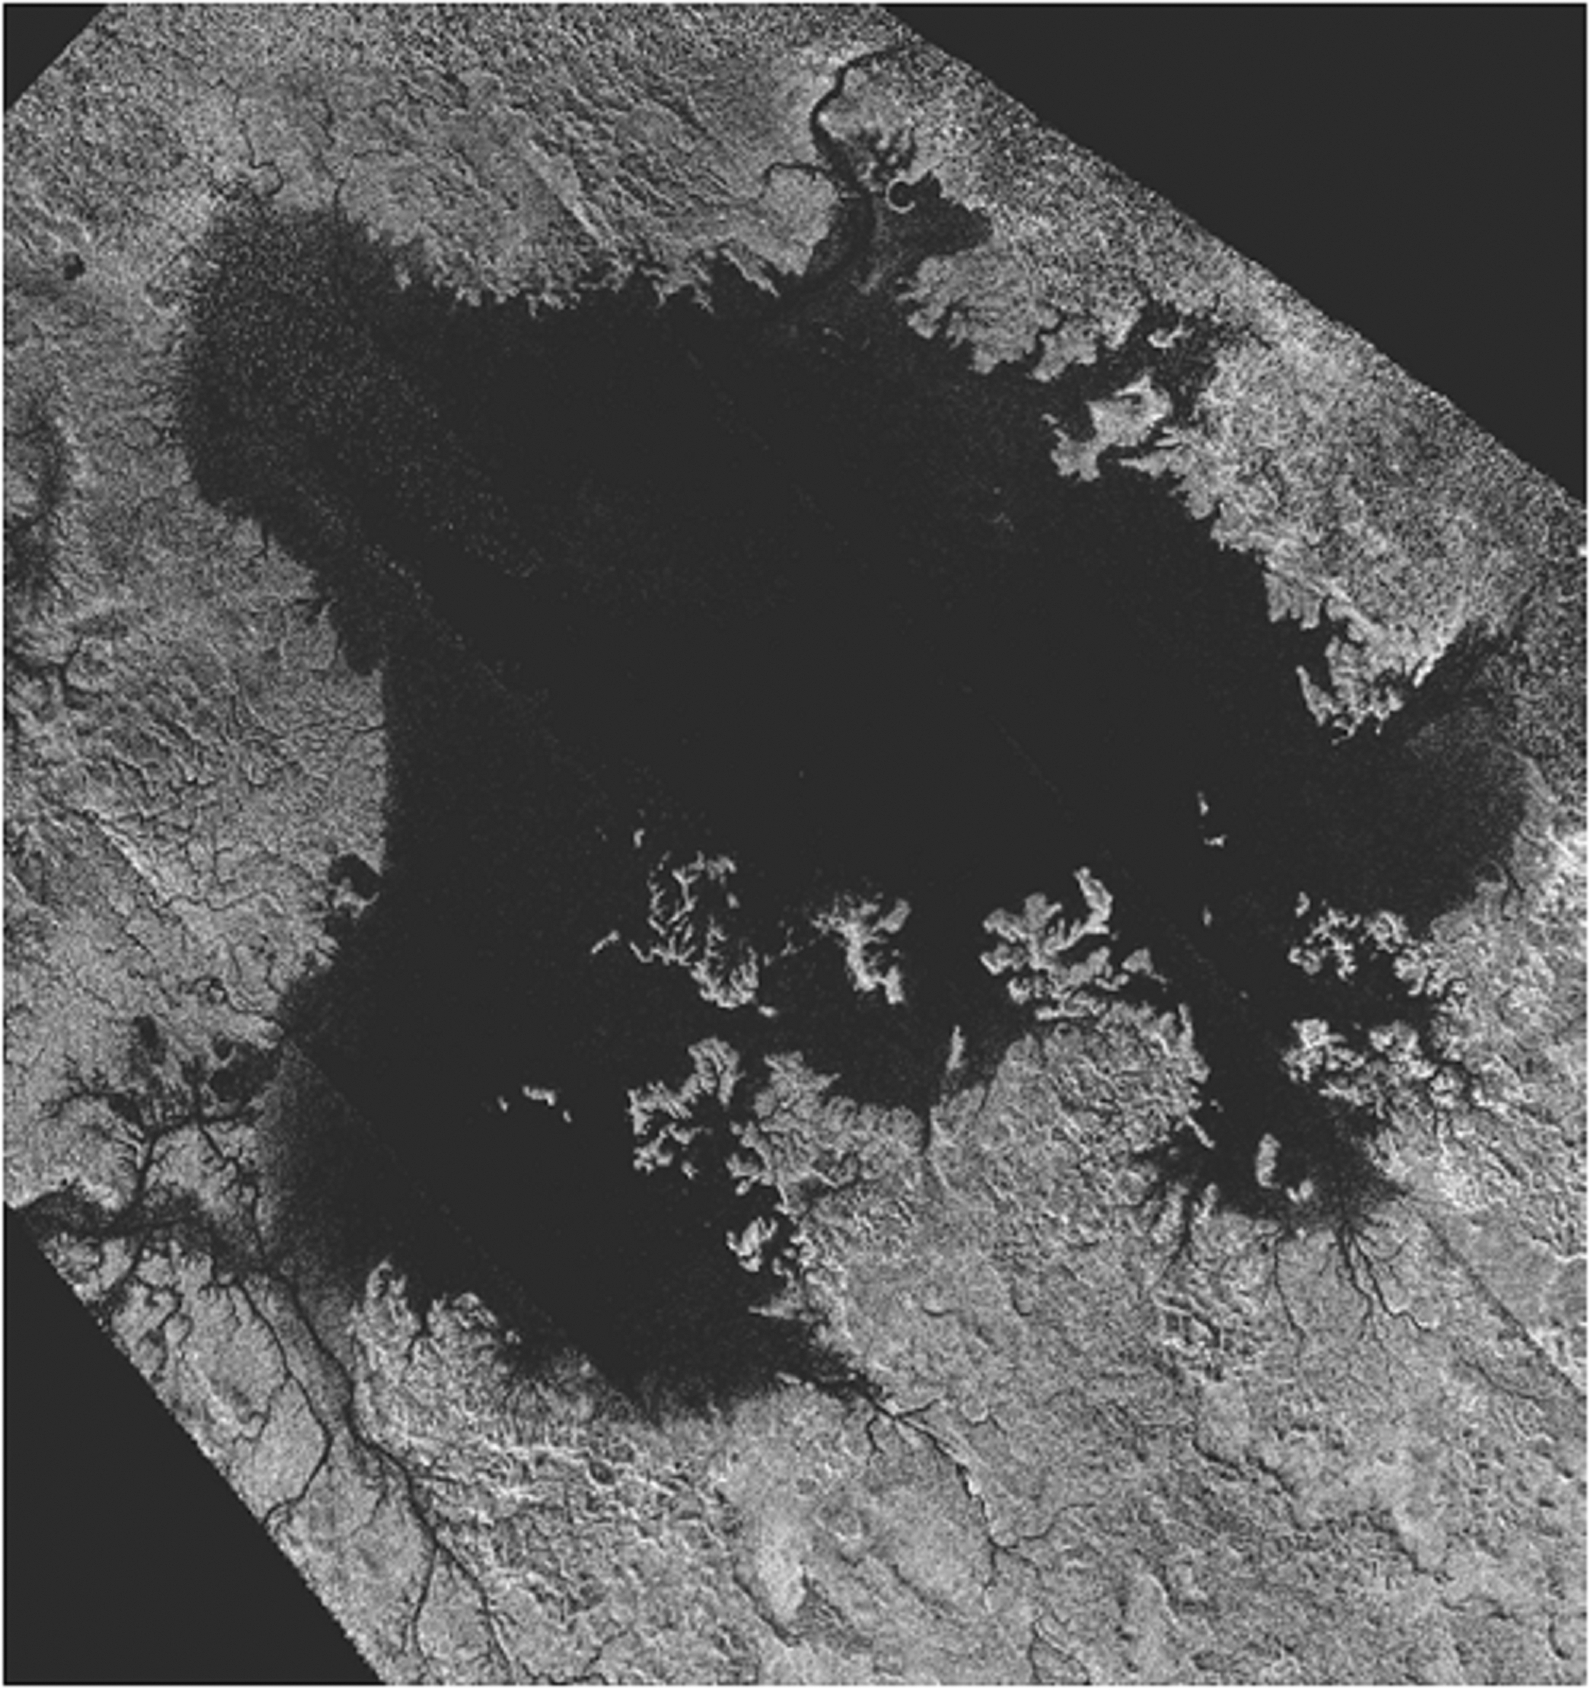
Ligeia Mare, at around 80° north on Titan. The sea is about 400 km across. Note the crenulated coastline and the extensive river networks draining into the sea.
The nominal target of the TiME mission is Ligeia Mare, the second-largest of Titan's seas. This was chosen because at the time (∼2008) it was the best-mapped of Titan's three seas. The preponderance of seas in the northern hemisphere is thought to be the result of the astronomical configuration of Titan's seasons in the current epoch, which has the result that the northern summer is less intense but longer in duration than that in the south (Aharonson et al., 2009). This results in a longer “rainy season” in the north, such that methane and ethane accumulate there. This seasonal configuration lasts several tens of thousands of years, much like the Croll-Milankovich cycles that play a part in Earth's ice ages and the martian polar layered terrain. This picture of a drying south and accumulating north is consistent with the ria coastlines of Ligeia (Fig. 2), which suggest valleys being flooded by rising sea levels (e.g., Sotin et al., 2012; Wasiak et al., 2013) and, with the kidney-shaped outline, shallow (and possibly declining) depth of Ontario Lacus in the south—see the work of Hayes et al. (2010, 2011).
While the flooded valleys on Ligeia's margins attest to recent rising sea levels, there are also indications that the seas were more extensive in the deeper past. Specifically, Barnes et al. (2011) interpreted near-infrared bright areas around many lakes and seas to be indicative of evaporite deposits. Thus, there may have been a rich history of drying and filling of the sea basins over a range of geological and astronomical timescales. Observation of shoreline morphologies, and perhaps seabed characterization by sonar, may give some clues about this history.
In situ exploration of Ligeia (and the other seas) will inform our understanding of the present-day hydrological cycle. In particular, climate models suggest that the highest latitudes may receive the most (methane) rainfall, and this may have the effect of flushing involatile solutes like ethane and other organics southward (Lorenz, 2014) to latitudes where evaporation can keep pace with the precipitation supply. This flushing model predicts that Ligeia should be methane-dominated, whereas Kraken will be less methane-rich and quite possibly ethane-dominated (the situation is rather analogous to salinity gradients on Earth that are hydrologically forced, e.g., the Baltic being less salty than the North Sea). Not only is the bulk composition of the seas not known at present, but model predictions (e.g., Raulin, 1987; Cordier et al., 2009) are divergent on the relative amounts of various minor species of astrobiological interest such as hydrogen cyanide.
In situ determination of the sea-state (i.e., wave height and period) with simultaneous measurement of the sea-surface winds forcing those waves would be very valuable, not only as a laboratory in which to understand the threshold speed for wave generation (Lorenz et al., 2010; Hayes et al., 2013) and the growth rate of waves (Lorenz and Hayes, 2012) under circumstances very different from those of Earth (where much of our understanding is rather empirical, specific to 1 bar air, 9.81 m/s2 gravity, and liquid water) but also to calibrate remote sensing as a meteorological technique. The sea state is used to sense winds remotely on Earth by satellite radar scatterometry, and indeed radar on Cassini has been used to place upper limits on wave heights (Zebker et al., 2014), although some transient brightenings (Hofgartner et al., 2014) may be due to the onset of waves as Titan moves toward the windier northern-hemisphere summer. Sun-glint observations in the near-infrared have also recently suggested possible wave-roughening (Barnes et al., 2014).
2. Test Objectives
The opportunity to conduct open-air trials of a scale model TiME capsule in conjunction with the PLL project emerged in summer 2013 and allowed only a few weeks for preparation and shipping of any required equipment. Accordingly, the specific test objectives were somewhat limited.
First, the perspective afforded by a free-drifting imaging system mounted a meter above the waterline is a novel one in planetary geology, and one that has not to date been much used in oceanographic studies. Thus, an imaging data set from a free-floating platform was desired in order to judge what air:sea interaction information (e.g., waves, foam) could be derived, as well as the condition of the sky and shoreline morphology.
In this context, it is interesting to recall that it was none other than Charles Darwin who wrote the chapter providing guidance on geology in the 19th-century volume edited by astronomer John Herschel, A Manual of Scientific Enquiry, Prepared for the Use of Her Majesty's Navy and Adapted for Travellers in General (Herschel, 1851). Darwin begins A person embarked on a naval expedition, who wishes to attend to Geology, is placed in a position in some respects highly advantageous, and in others as much to the contrary. He can hardly expect during his comparatively short visits at one place, to map out the area and sequence of widely extended formations: and the most important deductions in geology must ever depend on this having been carefully executed; he must generally confine himself to isolated sections and small areas, in which, however, there can be no doubt many interesting facts may be collected. On the other hand, he is admirably situated for studying the still active causes of those changes, which, accumulated during long-continued ages, it is the object of geology to record and explain. He is borne on the ocean, from which most sedimentary formations have been deposited. During the soundings which are so frequently carried on, he is excellently placed for studying the nature of the bottom, and the distribution of the living organisms and dead remains strewed over it. Again, on sea-shores, he can watch the breakers slowly eating into the coast-cliffs, and he can examine their action under various circumstances…
Whereas Darwin on his voyages was not unduly limited by the number of pages of notes that he could take (as far as we are aware), the exploration of Titan is almost certain to be—in all probability—severely constrained by the data volume available to send observations back to Earth. Thus, a significant consideration for TiME, and a principal goal of the PLL project, is to maximize the information value of the limited downlink available and identify the most interesting data and images to send back. Obtaining a data set from a floating, drifting platform was therefore an objective of the tests. Post hoc examination of this image sequence would allow the development and validation of data selection algorithms that could identify particularly valuable images in a sequence.
Second, the TiME study found that the principal factor in determining the trajectory of the capsule across Ligeia would be the wind drag on the hull (Lorenz et al., 2012). While this can be estimated crudely from geometry alone, and by computational fluid dynamics or wind tunnel tests, there are several difficult-to-model effects at work. Not only is there bluff body drag on the exposed cross-section (which is in the near-surface boundary layer where the wind speed varies strongly with height) as well as skin friction drag on the hull top and sides, but Stokes drift and wave diffraction apply forces to the capsule that enhance drift. It would be useful to obtain some “real-world” drift measurements, even at a reduced scale, to better understand these effects.
Finally, while splashdown tests and limited wave-tank dynamic tests were conducted in the TiME project, which were supplemented with numerical simulations, it would be useful to have open-air tests where the dynamic response of the vehicle to real wave (and combined wind and wave) effects could be measured. In particular, the dynamic signatures near shore associated with wave breaking and reflection, and interactions between the wave-tossed hull and the lake bottom, are difficult to simulate, and real-world data was sought.
While in principle many of these objectives could be met in any open body of water, the availability of existing infrastructure such as a motorized boat with backup, qualified personnel for launch/recovery, and automatic weather data in fact made it very cost-effective to execute these tests in conjunction with the PLL experiment. In addition, and perhaps even more important, the intellectual synergies between the TiME effort and the PLL developments were powerful.
3. Test Article and Methodology
The TiME capsule had a planned diameter D of ∼3 m and has a shape similar to that of the Genesis and Stardust Earth-return capsules, being principally two back-to-back frustums with a small cylindrical section in between. The shape, and in particular a shelf just above the nominal waterline, is determined largely by the geometry of the jettisoned heat shield required for hypersonic entry.
The test article was constructed primarily for splashdown dynamics tests; details were set forth by Lorenz et al. (2015). Titan's surface gravity g is 1.35 m/s2, or about 1/7 that of Earth. For dynamical similarity of liquid surface interaction, one would aim to match the Froude number, V/(gD)0.5; thus, for a given impact speed V, the model scale should be 1/7. In fact, fabrication by 3-D printing as a single part during the brief Phase A study allowed only about a 1/8 scale model, 35 cm in diameter. The plastic filaments deposited by the 3-D printer actually allowed enough porosity that it was necessary to seal the hull with several layers of urethane lacquer to make it waterproof. The capsule model (Fig. 3) had a large circular hole in the aft surface to allow installation of instrumentation. The hole was locked by a transparent acrylic cover held with wing nuts against a rubber sheet gasket.
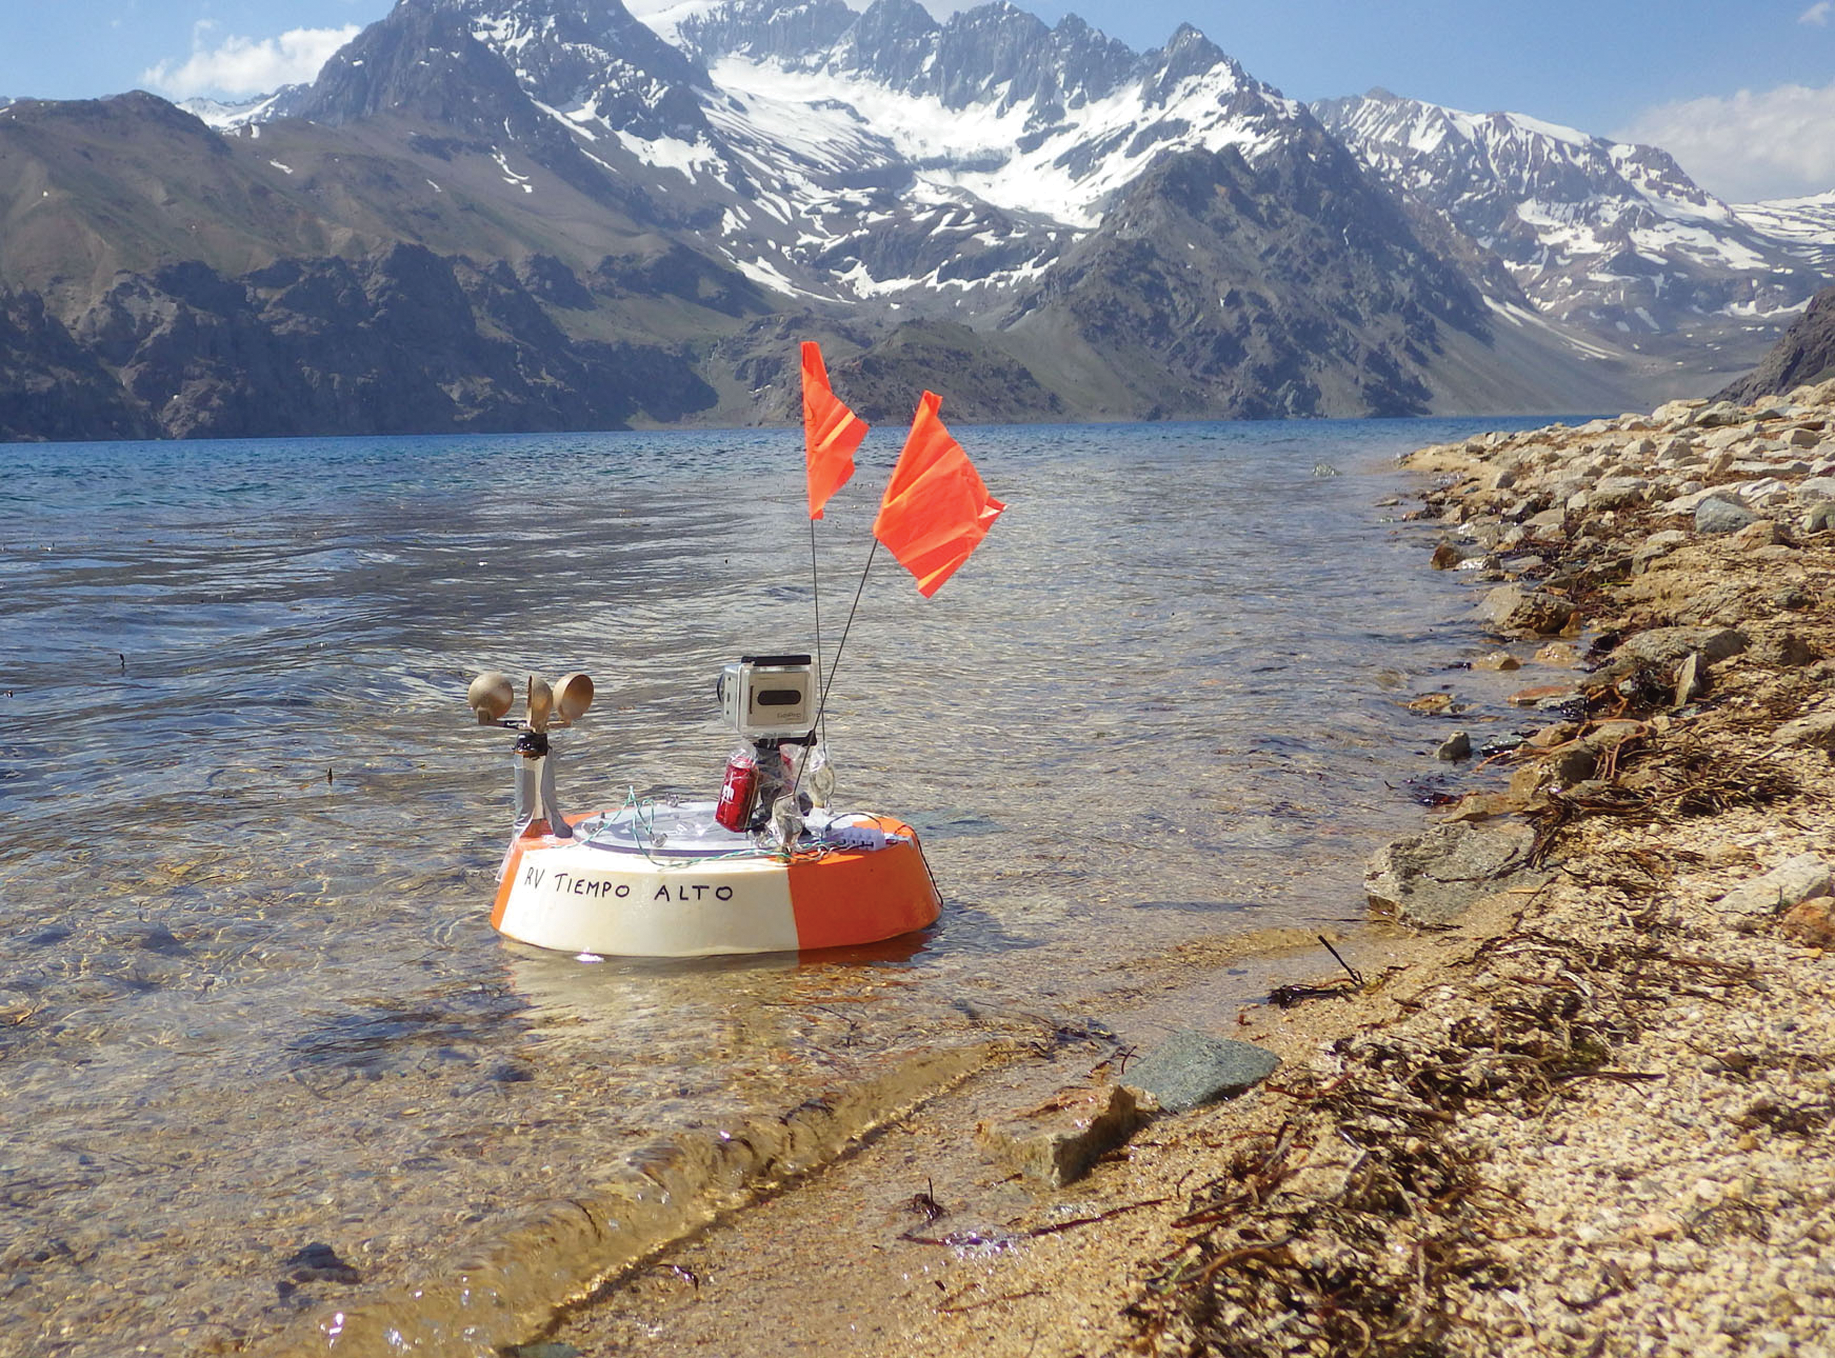
Capsule model (35 cm in diameter), beached on the gravel lake shore. The lip of the hull projects just above the waterline. Above the transparent lid, the GoPro camera mount is seen (the camera is 6 × 4 × 3 cm), with a red LED strobe strapped to the camera pillar; anemometer cups are at left.
The instrumentation to study the vehicle wave dynamics was the same as that installed for splashdown dynamics tests. A Logomatic Data logger was wired to two solid-state two-axis LP530AY angular rate sensors (and a third accelerometer, to facilitate synchronization with the two other units). This unit, mounted with epoxy and screws respectively on a 12 × 9 × 6 cm die-cast aluminum box, records up to eight analog voltages as ASCII files that could be transferred by USB cable. This unit was powered by a LiPo battery. For this application, additional channels were wired to a CMP05 fluxgate magnetometer compass and an LM35 semiconductor temperature gauge mounted just below the waterline, and to a small DC electric motor (functioning in reverse as a dynamo) mounted to a set of anemometer cups to provide a measure of vehicle-relative wind speed. It was, however, recognized that this system might not give a particularly linear response and rocking motion would influence the measurement.
Additionally, a Gulf Coast Data Concepts (GCDC) X6 accelerometer logger was mounted on the underside of the acrylic lid. This unit is a microcontroller interfaced to a three-axis accelerometer and magnetometer and flash memory card, packaged in a small unit (about 1.5 × 1 × 5 cm) that functions as a USB memory stick. To document the vehicle drift, a GPS logger was installed under the lid, which was RF transparent and thus allowed the GPS signals through while keeping the logger dry. This unit, similar to the accelerometer logger, had a form factor and functionality of a large USB memory card.
Finally, a small GoPro Hero-2 timelapse/video digital camera, equipped with a waterproof acrylic case, was mounted on the deck. This camera (which we have used in kite-borne geomorphological studies, Lorenz and Scheidt, 2014) was intended to document the shoreline visibility, the “sea state,” and the vehicle motion.
To prevent loss of the vehicle should the hull or lid be compromised, inflated plastic bags were stuffed inside the hull. As well as providing buoyancy, these also prevented the GPS logger from sliding around. To facilitate tracking and recovery, small bright orange flags were installed on the deck; these in fact contributed somewhat to the wind drag on the vehicle. Two red LED strobes were also attached with adhesive tape to the anemometer mount. In practice, however, it was found that these contributed only minimally to ease of recovery; in cases where the vehicle washed ashore near rocks, the flags were significantly more useful.
In all, four deployments were performed. In one instance, the vehicle was not immediately recovered, having blown among rocks that obscured it from view. A cruise of the perimeter of the lake the following morning succeeded in locating the capsule with binoculars.
4. Results
Tests were conducted on four days, determined in part by weather conditions and in part by the availability of personnel and/or facilities such as the boat demanded by other PLL field activities. The sustained field campaign allowed inspection of data at the camp in the evening, reformulation of the next day's objectives, and reconfiguration of the data acquisition hardware if necessary.
4.1. Drift rate and trajectory
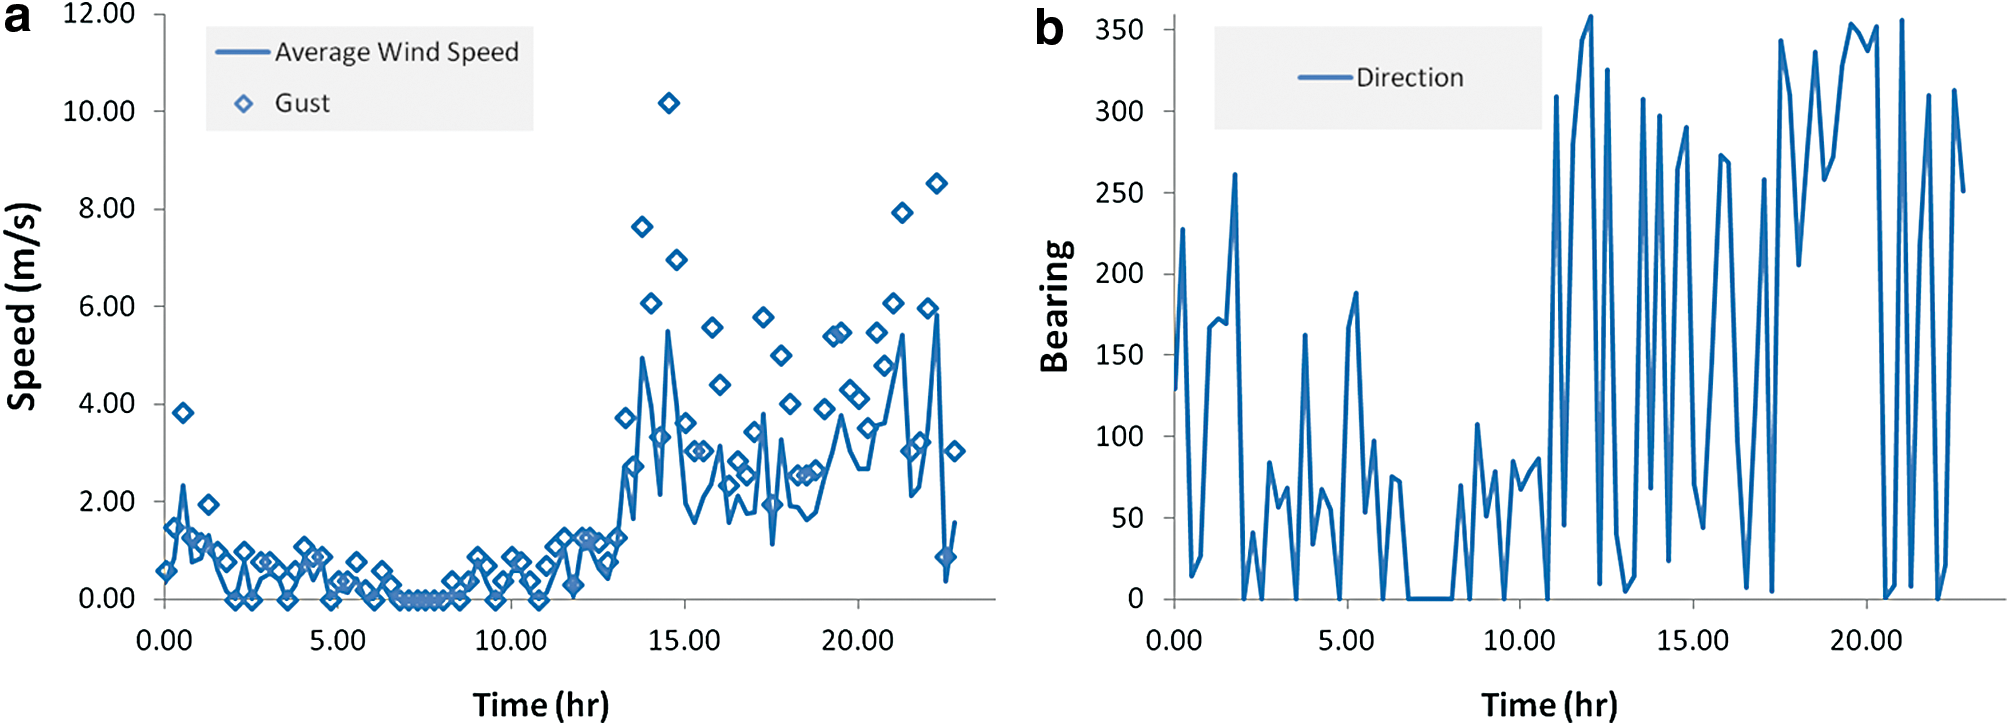
After some brief tests with manual launch from shore on December 4 to debug hardware, the first sail of the TiME capsule model (nicknamed, given the test location in the high Andes, the R.V. Tiempo Alto) was conducted on December 5. The capsule was released from an inflatable Zodiac boat equipped with an electric outboard motor, which conveyed it about halfway across the lake, on the upwind side. From there, it drifted south and then southeast (Fig. 4), becoming beached about 3 h after launch. The GPS record showed that the capsule drifted 2.06 km in 2 h 20 min, that is, an average of 0.25 m/s. This may be compared with the wind speed (Fig. 5) of 2–3 m/s. From simple force balance, a vehicle with equal drag areas and coefficients above and below the waterline will have a drift rate that is less than the wind speed by the square root of the water/air density ratio, or about a factor of 30 for air and water. Thus, the drift speed/wind speed of ∼0.1 rather than 0.03 attests to the larger hull area above the waterline and the considerable drag enhancement due to the anemometer, camera, and flags. A possible additional effect is that Stokes drift and momentum imparted to the vehicle by waves are particularly important (Lorenz, 2015) at shallow depths, which are more significant for small-scale models than at full scale.

Example traverse on December 5, 2013. (A) Base camp. (B) Launch on Zodiac boat. (C) Deploy capsule into water near western shore of lake 14:13 hours. (D) After slow drift south, wind picks up and changes direction. (E) Capsule makes landfall circa 16:23 hours. (F) PLL platform and shore meteorology station. Background image courtesy of Google Earth.
(
Although the drift speed recovered from the GPS record is coarse at these low speeds, it was seen that the speed jumped appreciably at 15:30 hours, corresponding to point D in Fig. 4, such that the 1.3 km traverse took place at some ∼1 m/s.
It is rather notable that, in the absence of a strong onshore breeze, the vehicle trajectory is somewhat parallel to the shoreline when close to the lake edge. This is a simple consequence of mass conservation—water cannot go onto or away from the land, and thus unless actually stagnant, water currents are near-parallel to shore. This in fact is ideal for surveying the shore.
Two traverses on December 6 yielded 0.8 km drift in 50 min at 0.5–1 m/s and 0.25 km drift in 20 min, with speeds of 0.5–1.5 m/s. A traverse on December 7 was rather short, the capsule quickly running aground on the west shore (and in fact not being recovered until the following day).
4.2. Wave response
A floating vehicle, even in a perfectly flat liquid, has a number of characteristic modes (familiarly known as rocking and bobbing; in naval architecture, rocking motions are pitch and roll depending on the direction with respect to the long axis of the vehicle; translation motion in the vertical direction is termed heave). It was recognized even for the Huygens probe (Lorenz, 1992) that such motions would exist on seas on Titan, and in fact the period of such motions is diagnostic of the liquid density and thus composition.
These damped harmonic motions can be excited by transients (such as splashdown) but more usually are forced by surface waves. Where the wave period is very short compared with the modes, the corrugated sea surface is in effect averaged over the vehicle body, and little or no response results. For very long period waves, the vehicle rather faithfully tracks the water surface, and it is in this manner that wave buoys measure swell in terrestrial seas. In such situations, the output of a vertical accelerometer (with attitude changes usually corrected by gyro readings) can be double-integrated to measure the wave height. For intermediate cases, however, where the natural periods of the vehicle and the wave forcing period are similar, the vehicle response can be significant and must be taken into account to measure the wave properties. Resonant conditions can occur, where the vehicle movement subject to periodic forcing can lead to large-amplitude excursions. The TiME capsule in fact would operate in such a regime on Titan and thus was subject to extensive numerical analysis (full-scale testing was impracticable, not least in liquid methane and titanian gravity!). Numerical models of wave response typically need tuning to estimate damping coefficients, and scale model data are useful in this regard (some tests had been made in a wave tank to determine these coefficients). The field tests were more useful in assessing the data quality and features (e.g., compressibility of the time series) of a real-world wave field recorded by the vehicle motion, where the waves are not pure monochromatic unidirectional sinusoids but a complex superposition of chop and swell, including waves reflected from shore. Figure 6 gives example data recorded by the accelerometers and magnetometer on board.
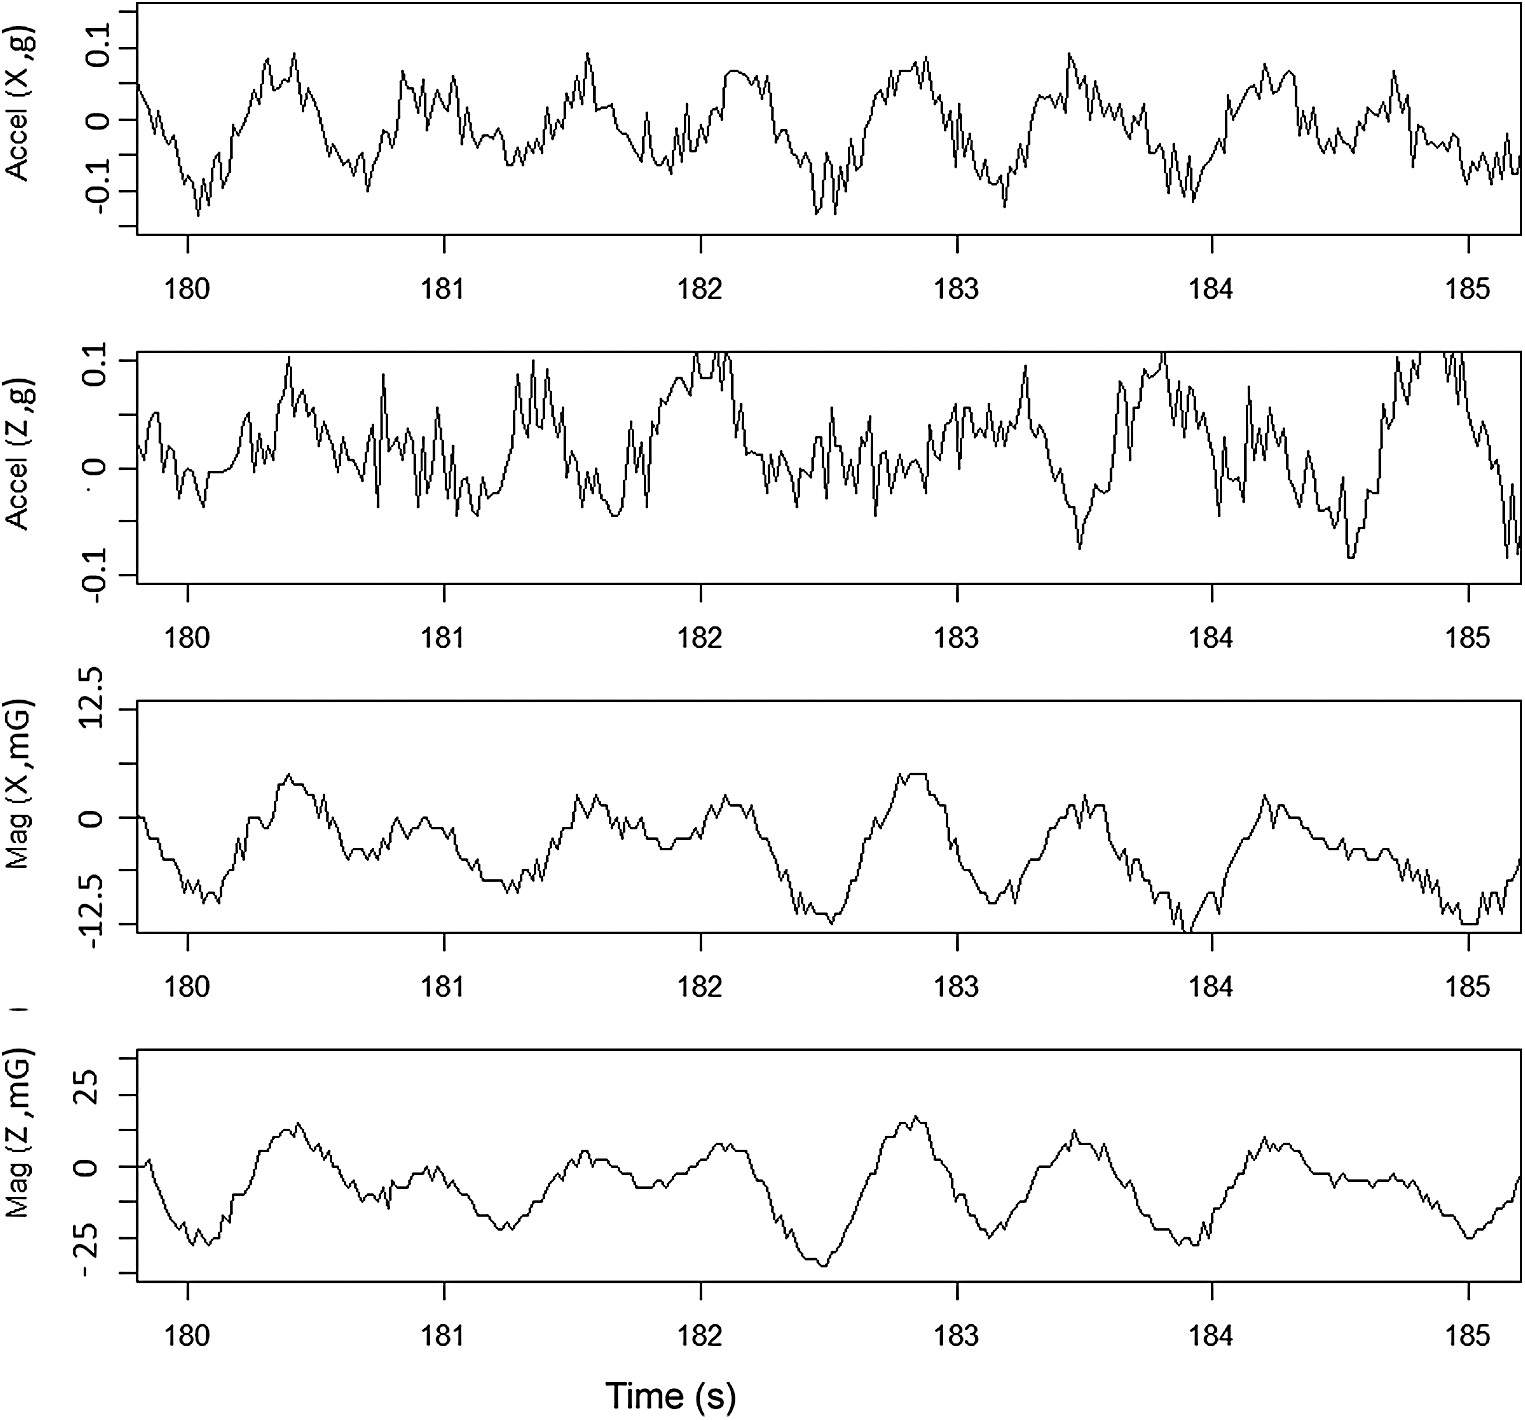
Rocking signature in waves. In this instance, the accelerometer signature is cleaner in a horizontal (X) axis than in the vertical (Z) axis. Note that because the accelerometer was not mounted at the center of mass, a rotational acceleration contribution complicates the signal. The magnetometer signal, indicating vehicle attitude, is cleaner still, but would be inapplicable at Titan, which lacks a strong intrinsic magnetic field. The field is reported approximately in milligauss (mG) relative to an arbitrary value: for reference, Earth's field at this latitude is about 400 mG; thus, the attitude changes of ∼50 mG correspond to 10% or ∼sin(5°).
The fact that the TiME capsule would acquire imaging data makes the azimuth dynamics of the vehicle of more interest than is normally the case for drifting buoys (which usually record point meteorological and oceanographic measurements without directionality). Clearly, one may make a system arbitrarily elaborate, with cameras pointing in multiple directions, or with multi-axis gimbals to point it. But even in this case, the azimuth motion is of interest, in that this may specify the capability required of the gimbal. Further, the azimuth behavior would become of critical interest if the gimbal were to fail or be descoped for cost or other reasons.
One could, especially if one considered meteorological measurements of top priority, engineer the superstructure of the vehicle to have a vane on one side, such that the vehicle would “weathercock,” rotating to place that vane on the downwind side. This might allow placement of meteorological instrumentation on the upwind side, to minimize any vehicle perturbations, and one might choose (perhaps) to install the camera looking downwind, that is, forward in the case of wind-dominated drift.
On the other hand, one could instead make the superstructure azimuthally symmetric to avoid wind torques and instead install some kind of keel below the waterline, to cause the vehicle to have a preferred orientation with respect to its drift relative to the water. This is generally the situation on ships.
Without a major vane/sail or keel, however, the vehicle experiences small torques from both water and wind interactions. This led to quite surprising azimuth excursions (e.g., Fig. 7) wherein the vehicle could slew around 180° in just a few seconds, without obvious wind forcing. It is believed that this may be the result of the coupling of wave motion into a “conical pendulum” mode of attitude motion that then caused a rotation of the vehicle itself. Although most oceanographic buoys are moored, and/or their azimuth motion is neither recorded nor of interest, informal discussion with buoy manufacturers since the tests indicates that such motions have been observed elsewhere.
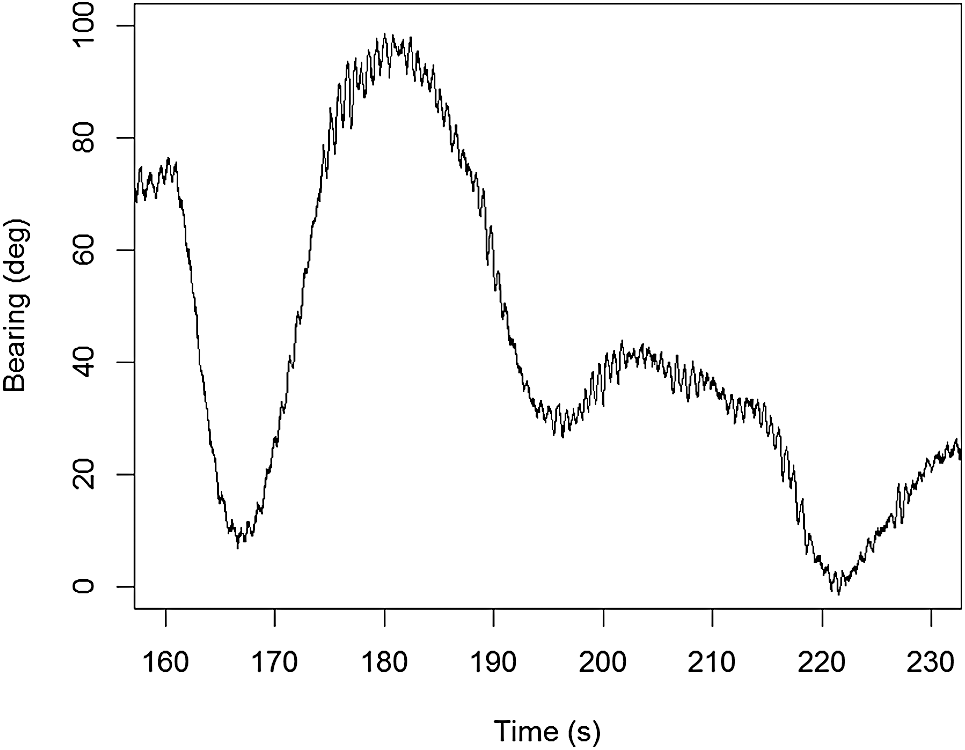
An example of the vehicle slewing in response to waves and wind, reconstructed from magnetometer readings. An almost 90° excursion occurs in 10 s. The large-scale rotation is not solely due to windmilling—some slews occur when wind was slack and are due to the wave response.
The azimuth rotation is also visible in the onboard imaging (Fig. 8). Although gyro and accelerometer data both succinctly capture the vehicle response, essentially allowing the vehicle to function as a wave buoy via angular rates and accelerations (from which the wave amplitude can be computed), an independent measure of the angular movement of the capsule can be obtained by the horizon position in the images—indeed such a measurement approach was used to measure the pitch and roll of the Huygens probe during its parachute descent to the surface of Titan in 2005 (Karkoschka et al., 2007).
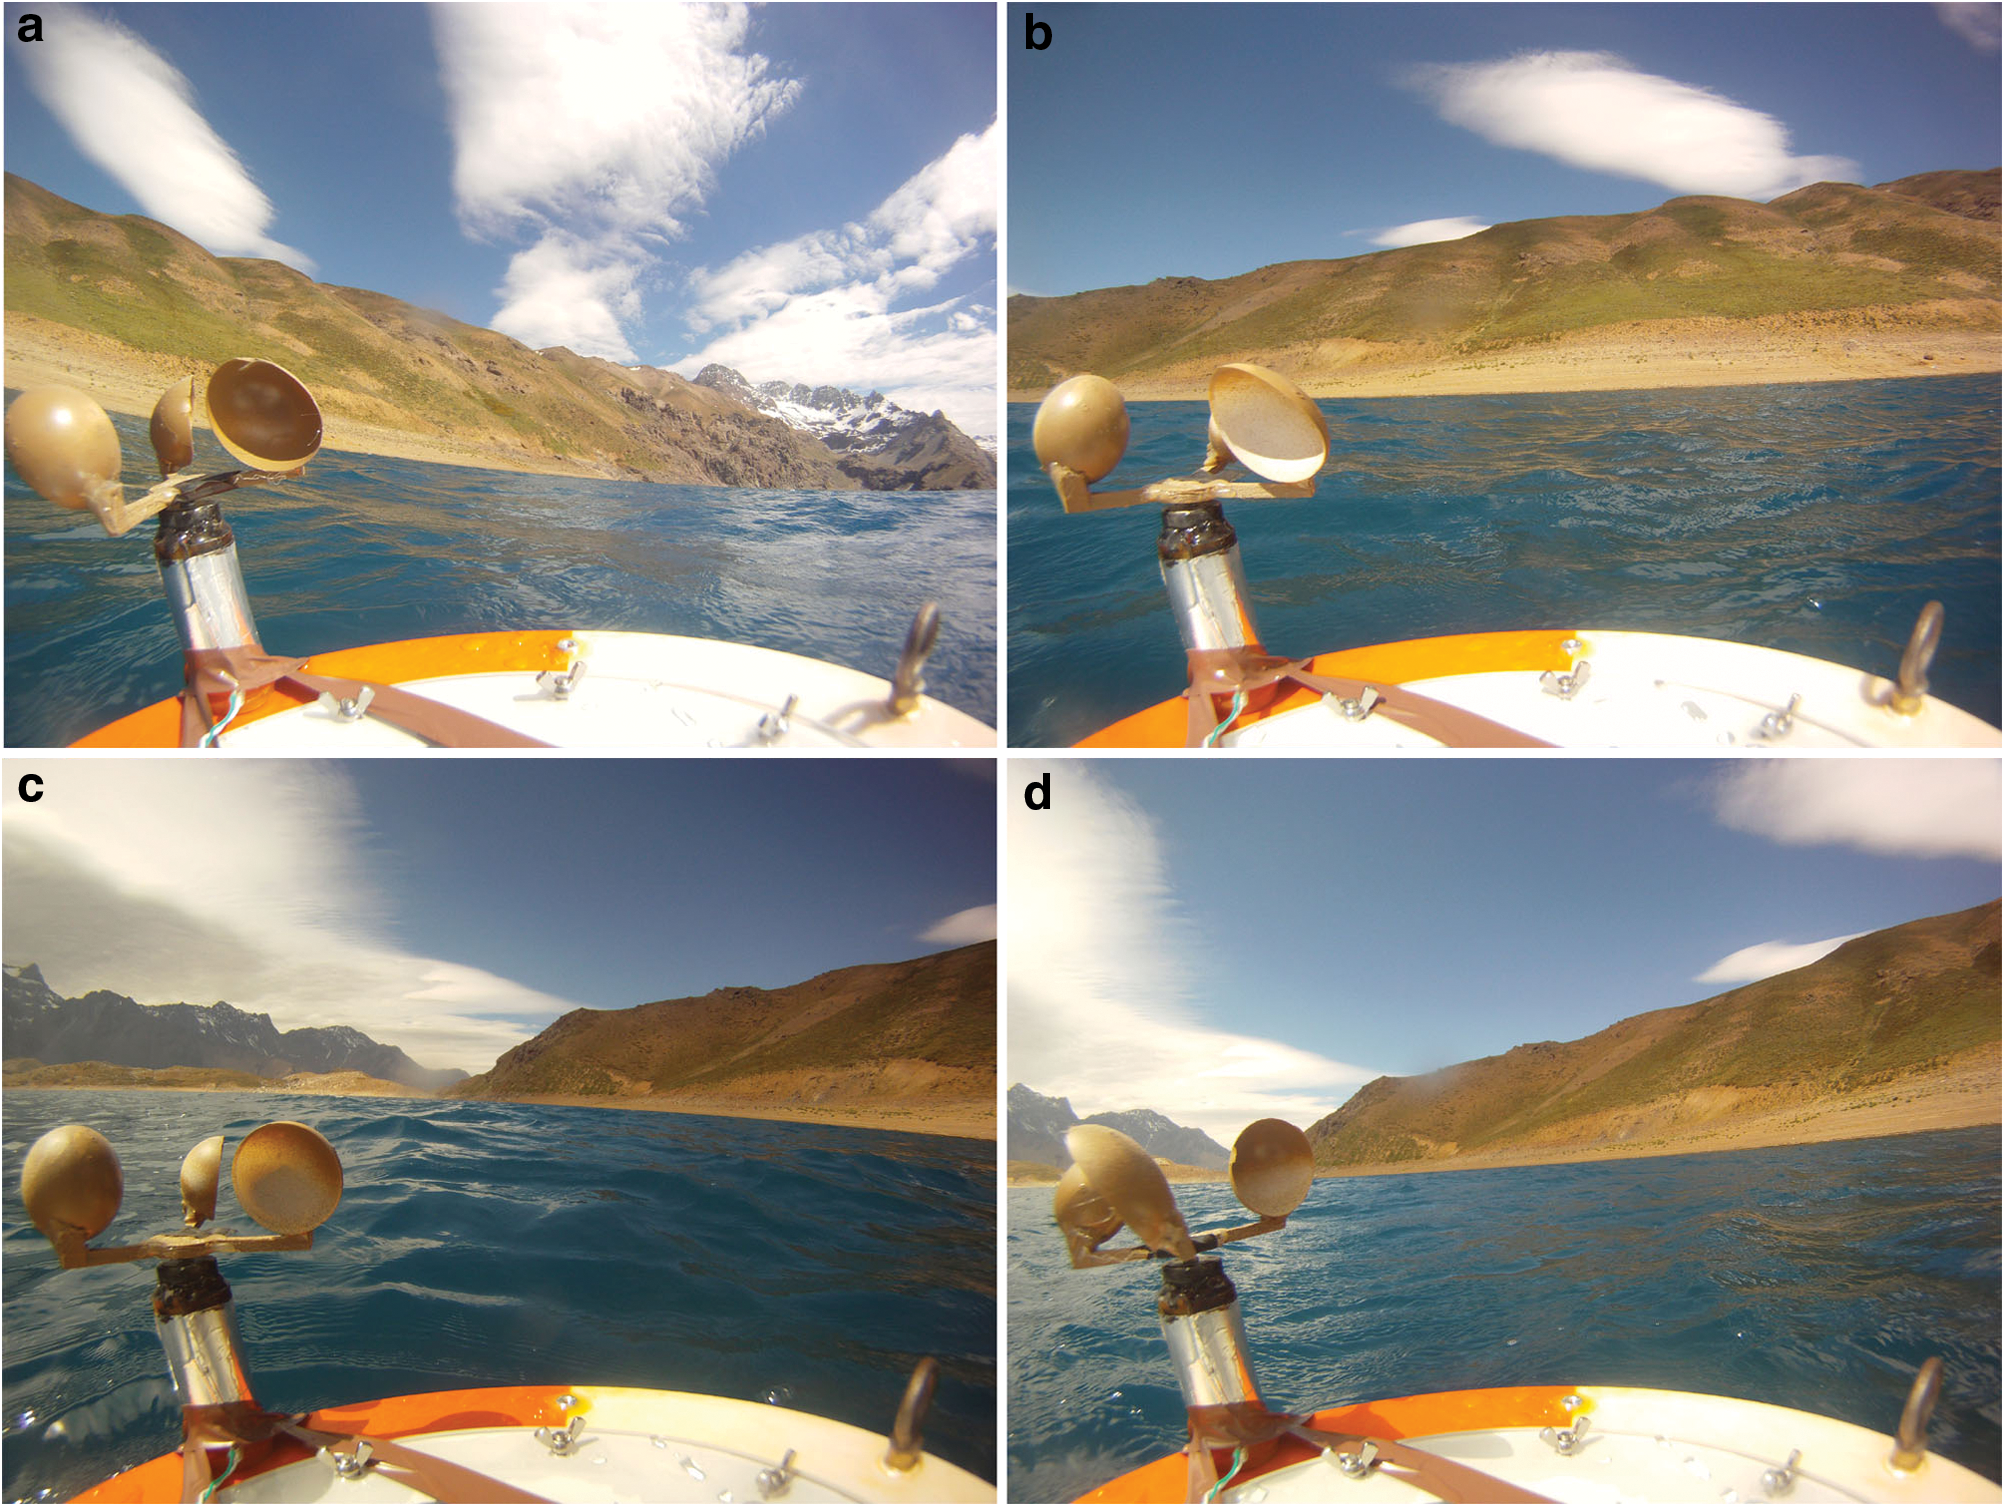
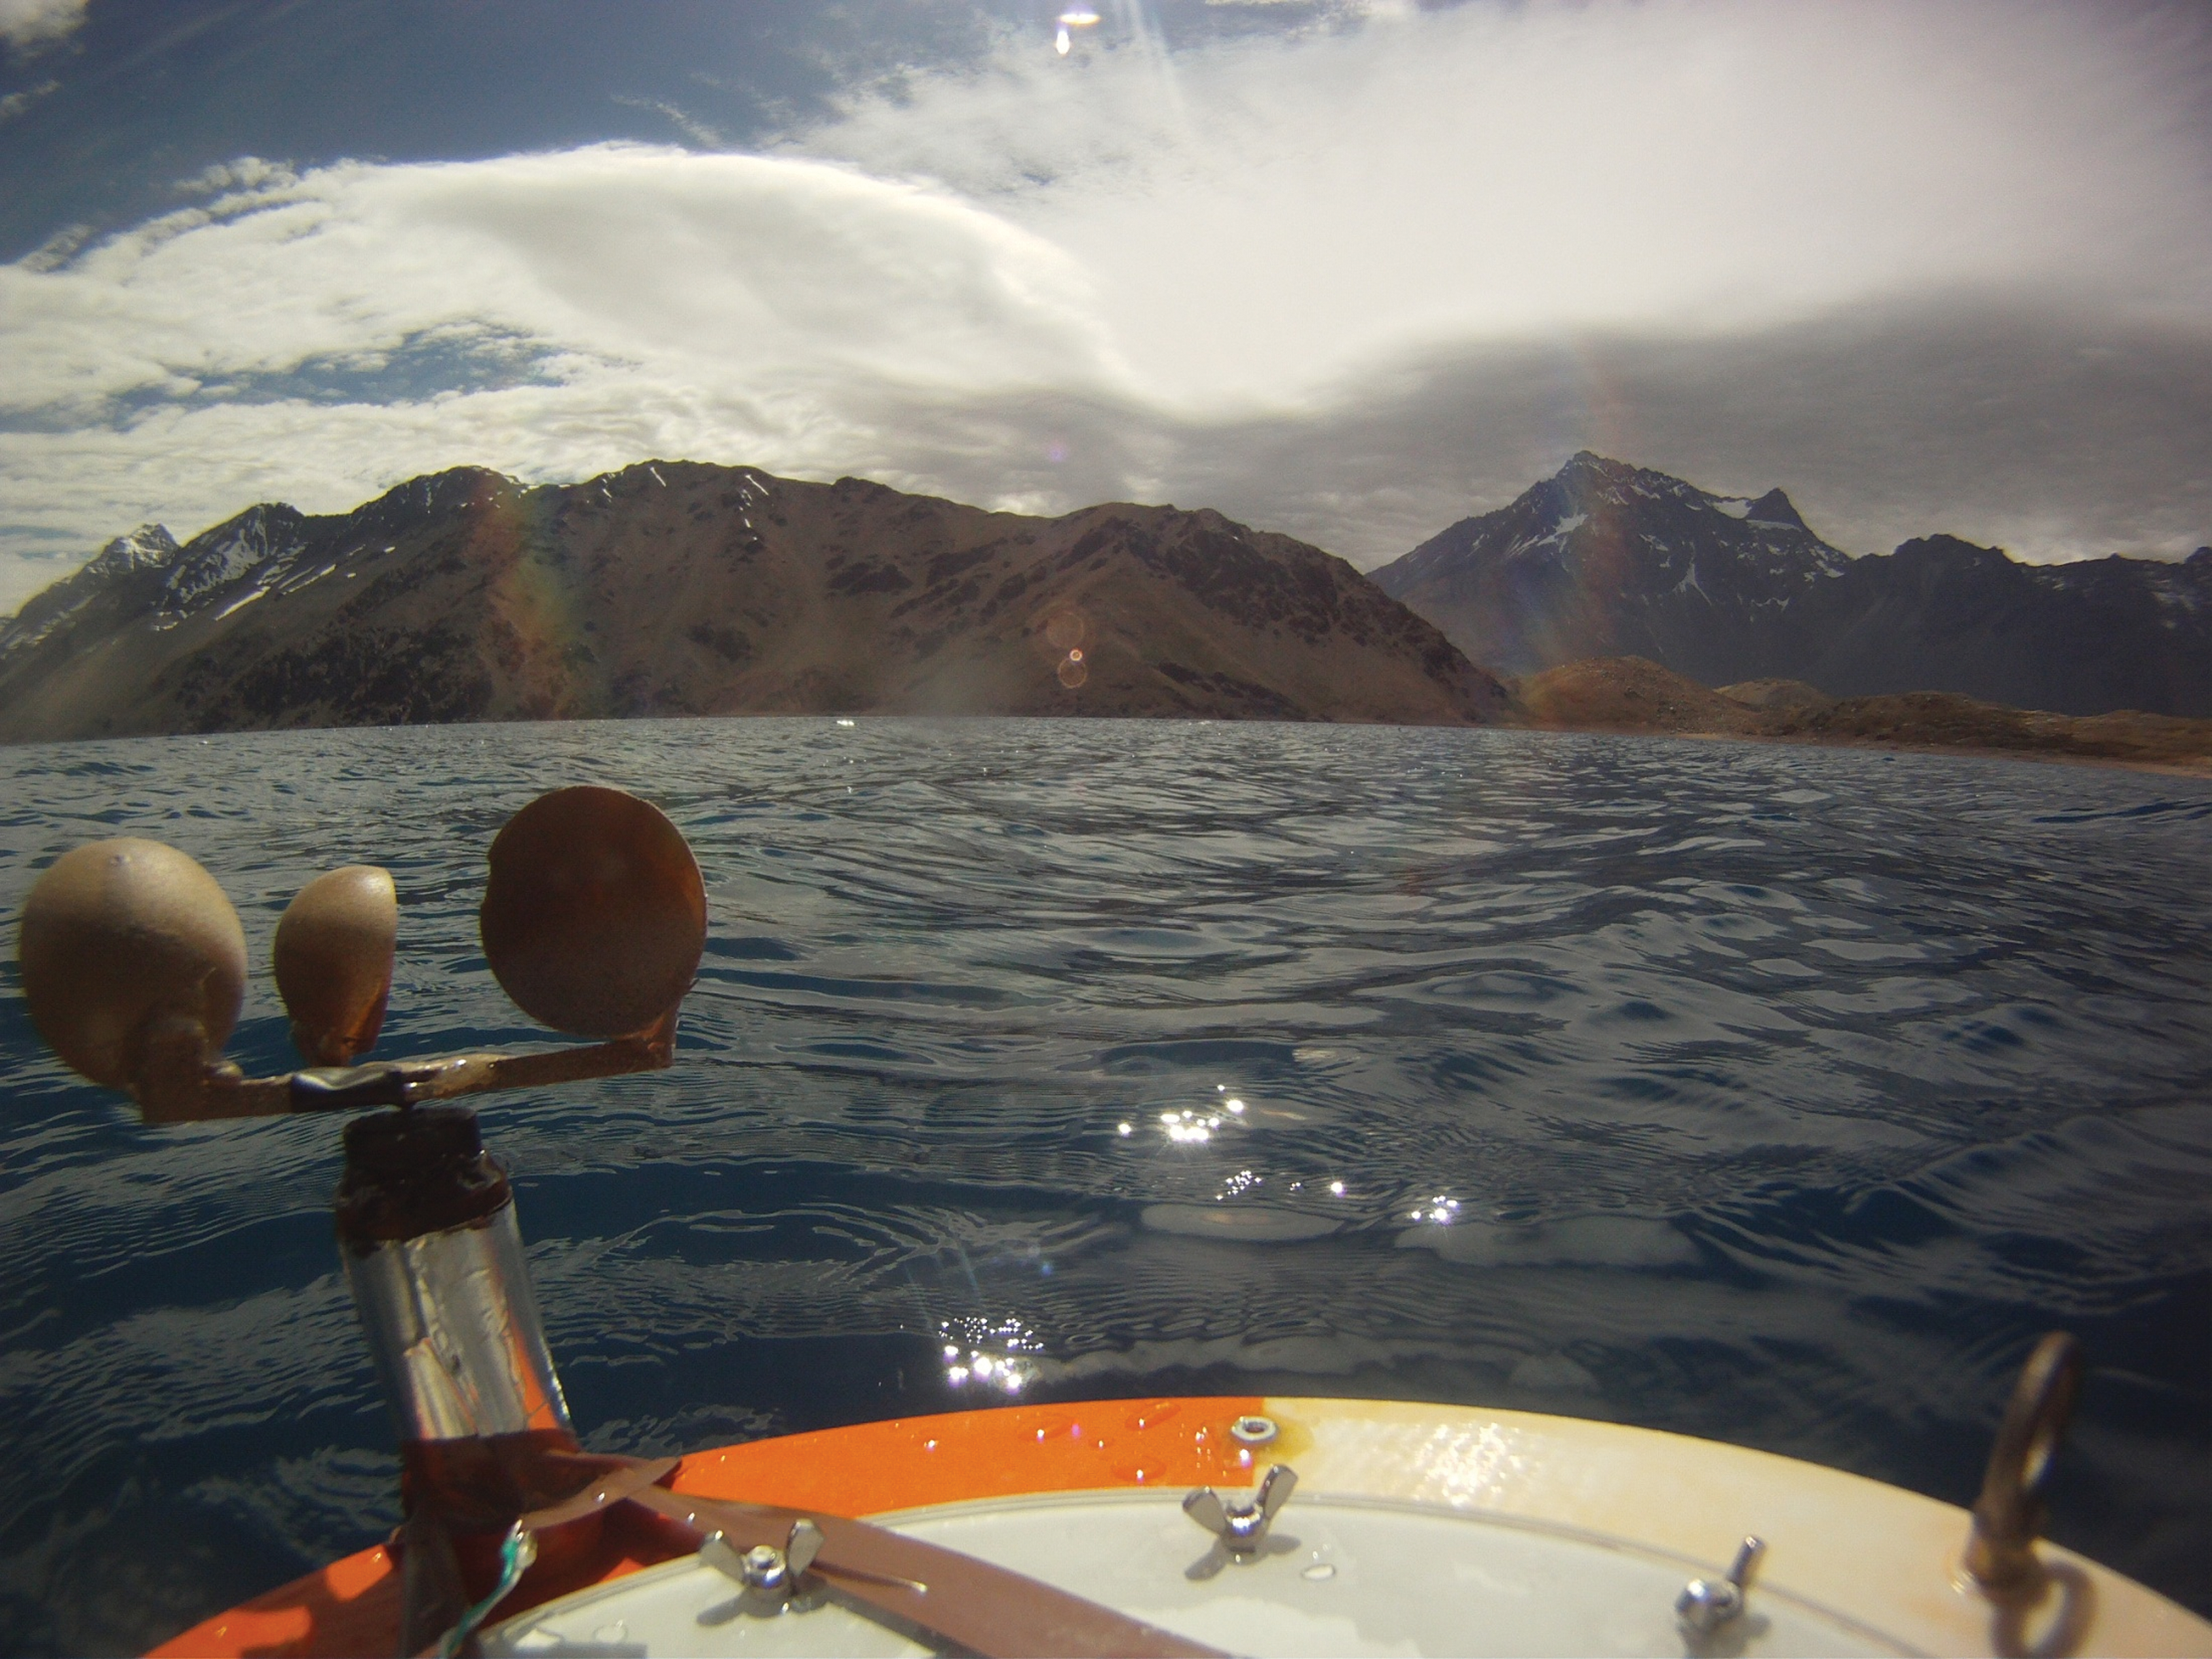
Four successive time lapse frames (10 s apart) from the traverse on December 5. Shoreline morphology, lake surface texture, and cloud patterns are all visible. Here, we draw attention to the easily extracted horizon line, which varies in both pitch and roll in these frames—while they are obviously too far apart in time to reconstruct the attitude motion, a statistical evaluation of the wave response would be possible. Note also that there is an appreciable (nearly 180°) slew in azimuth between frames (a), (b), and (c). Note the somewhat parallel streaks of cloud in (a), perhaps indicative of waves in the mountain airflow.
While acquiring and telemetering an image sequence would be an inefficient means to measure the vehicle motion, it is a relatively straightforward image processing task (during the daytime, at least) to extract the horizon position automatically on board and transmit only that information. Even then, though, direct measurement by gyro or accelerometer data would be more energy-efficient, but an independent measure provides some science robustness to the mission. It should be noted that regular sampling of a sinusoidal motion leads to proportionately more frequent measures away from center than at it; thus, regular or random attitude measures by camera will, in a periodic wave motion, have a saddle-shaped histogram, with more samples at the extremes of the swing cycle.
4.3. Shoreline encounter
Of particular interest in this investigation is the possibility that approach of the vehicle to shore, and indeed physical contact with the shore and near-shore lake bottom, may be recognizable in onboard data. While a human mariner may recognize such circumstances more or less intuitively, the development of specific physical criteria, and the detection efficiency and false alarm rate of a given criterion, needs real measurements.
The test article in this field experiment was not equipped with a sonar; thus, shoreline approach and encounters with shallows were not easy to identify before they happened. However, a dynamic signature of beaching was evident, where the vehicle actually touched bottom. In this condition, the accelerometer waveform becomes appreciably skewed (Fig. 9) with positive impulsive signals generated by bottom impacts with the bed. While the large relative amplitude of these signals is obvious here, it may be difficult to assign an absolute threshold since large regular waves could cause large accelerations. However, the distinction would be straightforward to implement by simply calculating the skewness and/or kurtosis of the waveform—indeed, kurtosis is used in aircraft engine health monitoring to detect impulsive signals indicative of incipient failure.
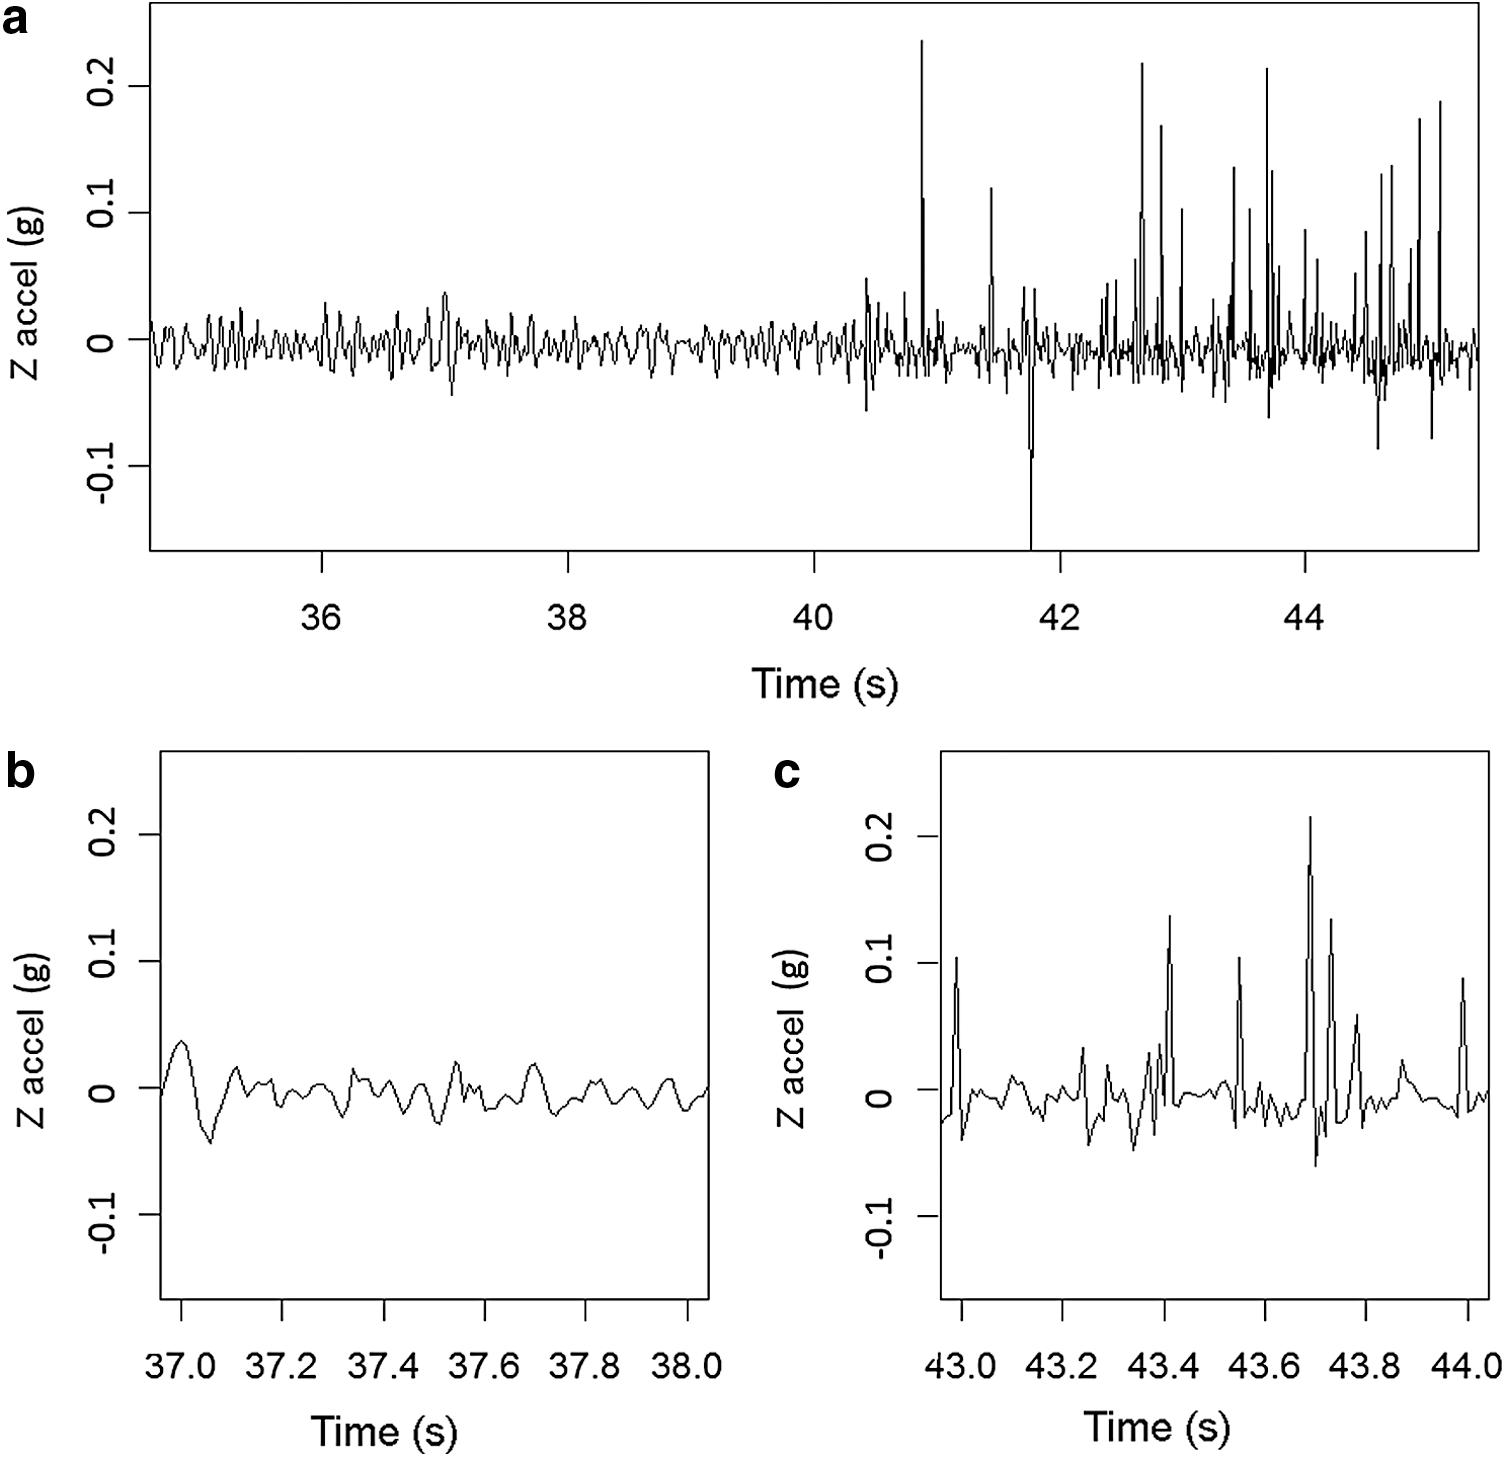
Accelerometer record (
In one run, the GoPro camera was configured to take video rather than simply a series of stills. In this mode, the system depleted its battery (and filled its memory) within a couple of hours, so it was not generally used. In video mode, the camera also records sound, and the scraping of the hull on the gravel beach was a very distinct signature of grounding. This signature would be quite detectable with a simple acoustic power criterion, although high-pass filtering of the sound would likely reduce sensitivity to wind noise or other sounds. (The only other sounds noted during the sail were the whirring of the anemometer cups and a more musical tinkling during wave action, caused by submersion of bubbles by the hull edge slapping the surface of the water.)
While not a specific indicator of shoreline approach, it is notable that the lake surface temperature measured by the sensor on the capsule hull saw an appreciable increase in the shallows just prior to beaching. This effect may have been enhanced by the algae near the beach which had a lower albedo than the granite gravel (thus increasing the absorption of sunlight) and inhibited mixing of warmed surface waters with the cooler deep.
4.4. Imaging of shoreline, sky, and sea surface
Imaging even from only 20 cm above the water surface is effective at characterizing the shoreline and sky morphologies (e.g., Fig. 10). Note that it is useful to have the lander deck in the field of view of the camera, simply to provide a geometrical reference such that the angle between the shoreline and the edge of the deck can be used to determine the distance to shore and thereby allow the length of shoreline features (e.g., boulder sizes) to be inferred.
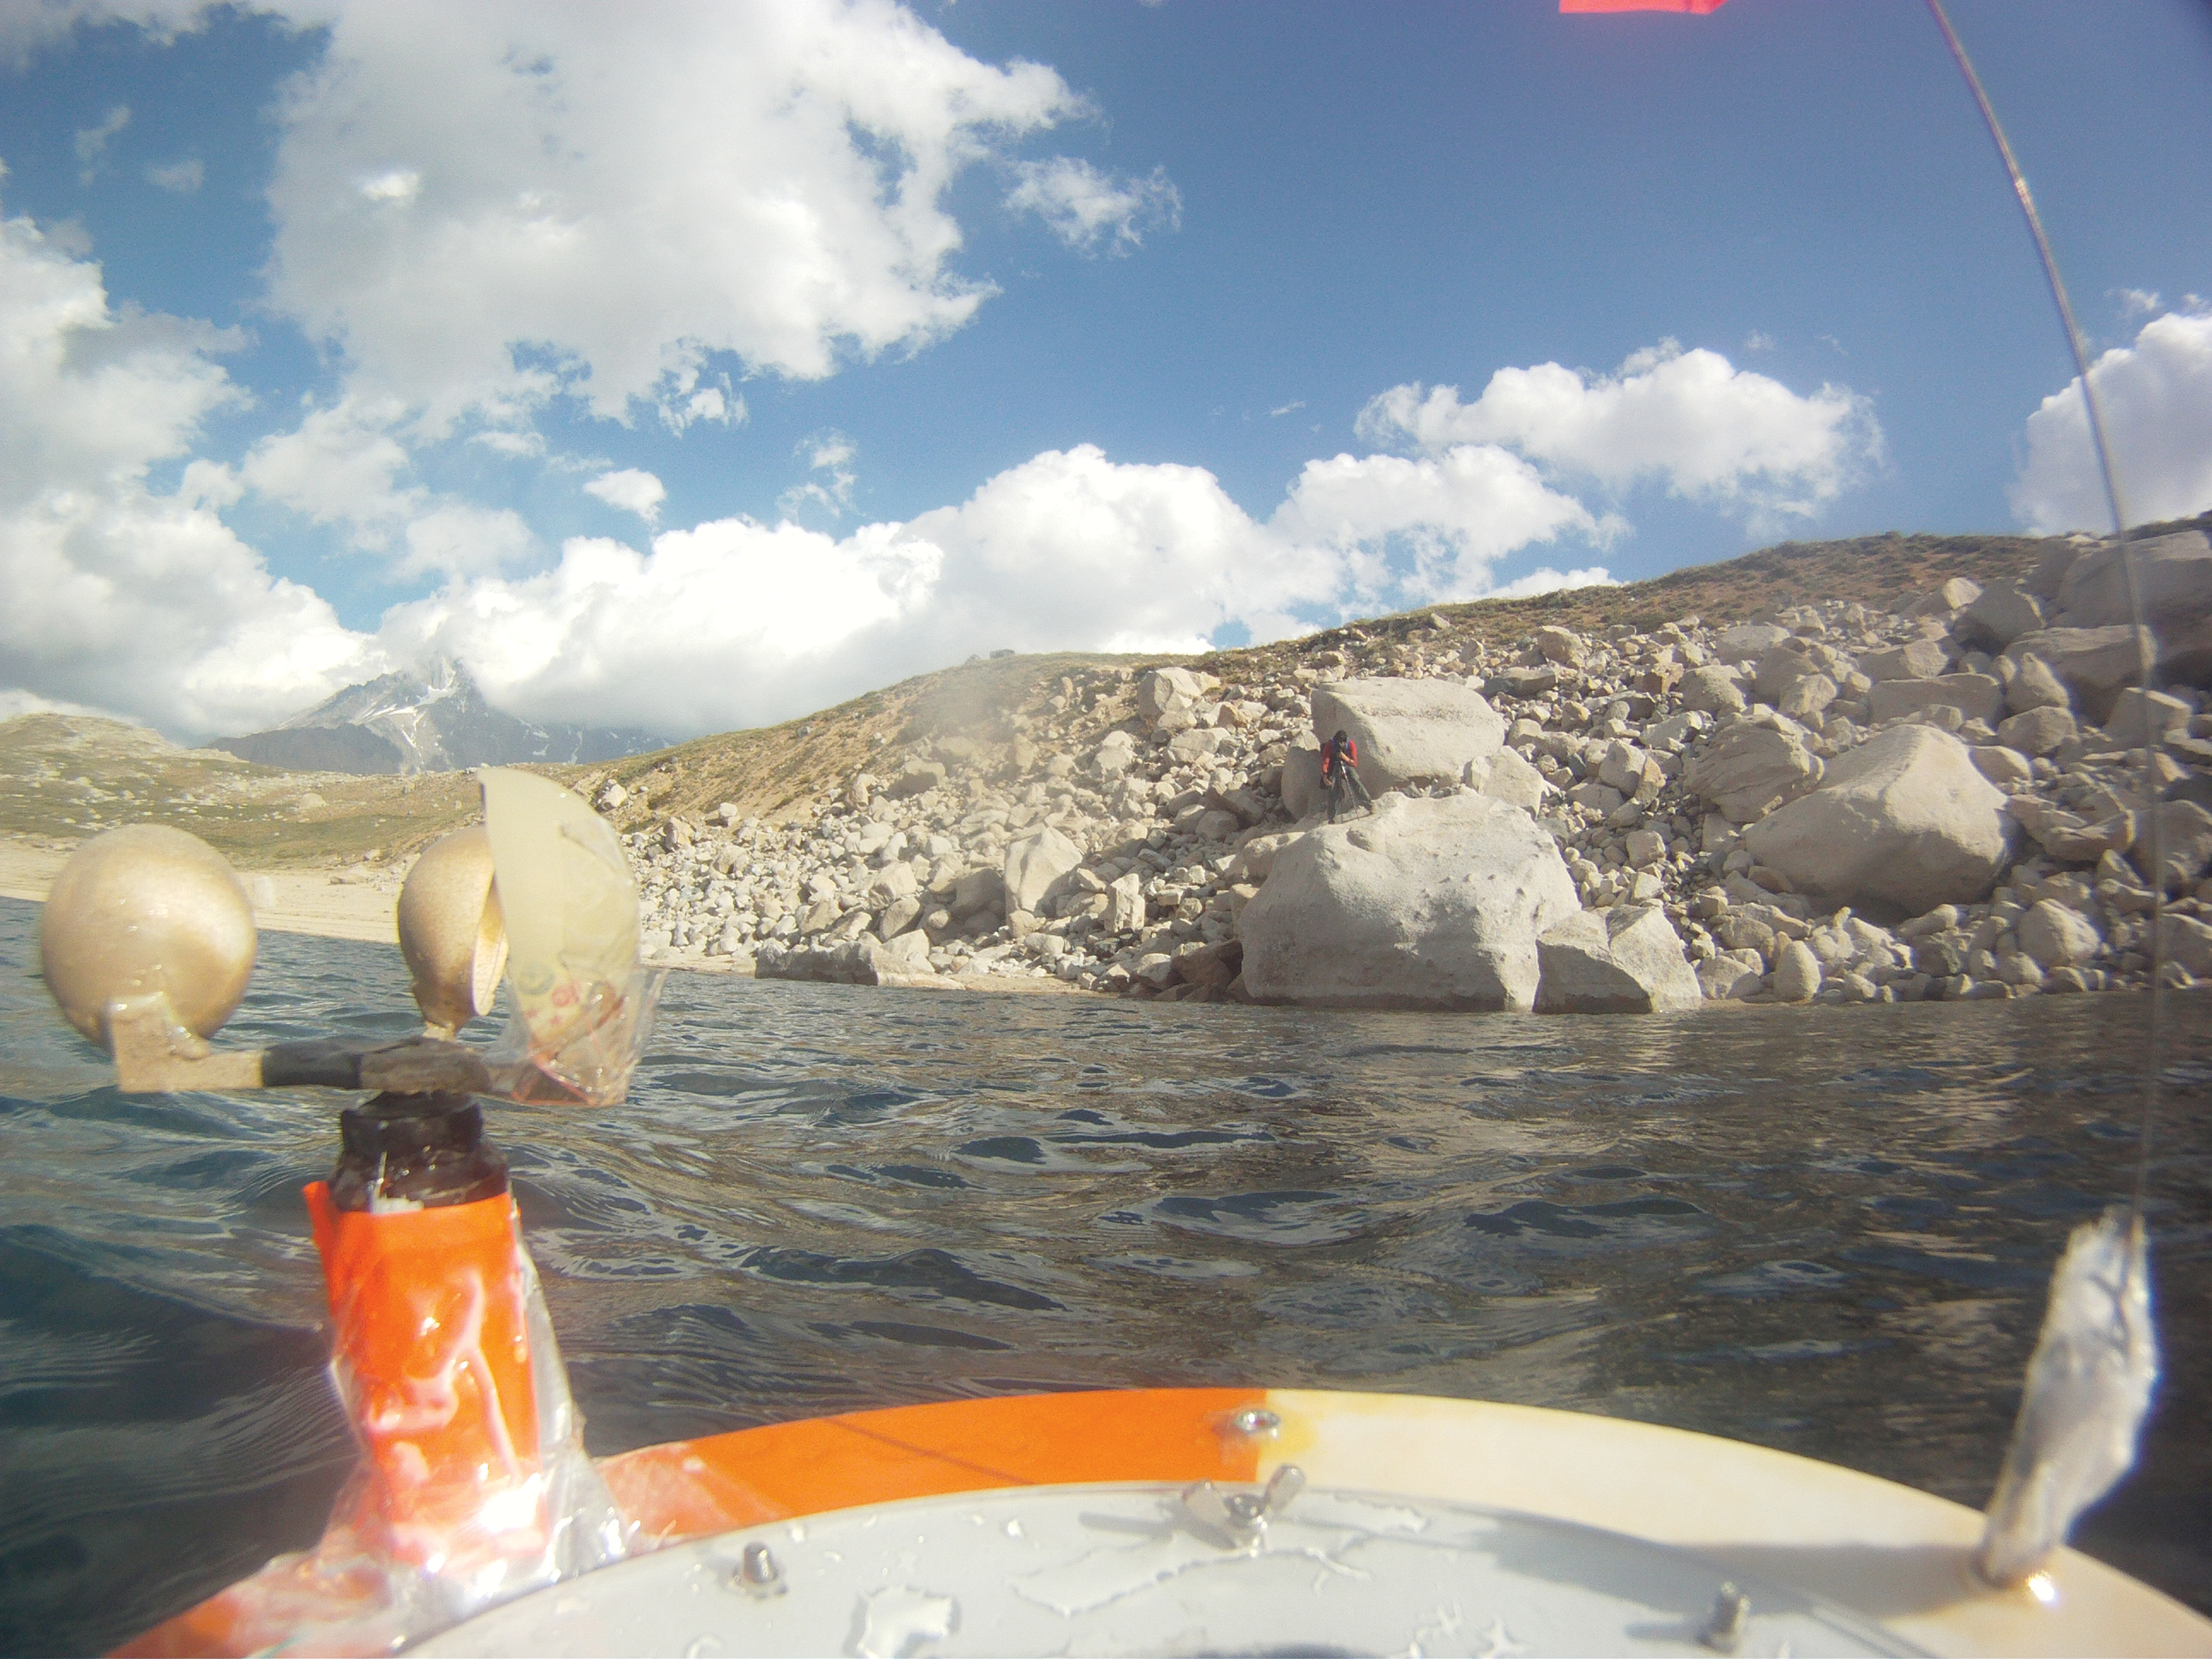
The dominance of boulders on the shoreline here is evident (this is the terminal moraine at the lake). The lander deck in the foreground serves as a useful fiducial marker, allowing the image scale to be determined even in the presence of pitch motions. Note the person on the large rock. Close inspection of the image reveals a few patches where contrast and edge sharpness are reduced due to water drops on the window.
The hundreds of images acquired by the onboard camera provide a data set on which image classification and selection schemes could be tested, since on a planetary mission like TiME, the telemetry bandwidth limitations would severely limit the number of images that could be sent. A variety of shoreline, skyline, and cloud morphologies are seen in the images (Figs. 3, 8, 10, 11). For example, while in Fig. 8 there is a steep beach of fine-grained material (below the image resolution), in Fig. 10 there is an abundance of large (up to ∼4 m), somewhat rounded boulders. The lack of sharp edges and corners suggests the material may have been transported some distance, but the existence of rocks of all sizes suggests the material has not been sorted as might be expected for typical fluvial sediments, and the large size would require exceptional flow rates for fluvial transport. From the image data alone, it is impossible to exclude, for example, a landslide deposit, but the presence of snow on the mountains in the image background might suggest glacial processes.
The images provide some meteorological insights beyond the snow deposits. In Fig. 10, patchy cumulus are evident, suggesting weakly convective conditions, whereas mountain wave clouds are seen in the images in Fig. 8, pointing to a strong upper-level flow. It is finally worth noting that biota are in fact visible in all the images shown, although whether the interpretation as such would be uncontroversial without prior knowledge is far from obvious.
Understanding the exchange of heat, matter, and momentum across the air:sea boundary is a principal objective of the TiME mission, and imaging of the sea surface can substantially inform this understanding. For example, on Earth one of the principal factors in gas exchange at the sea surface is the formation of bubble clouds by breaking waves. These can be revealed acoustically and optically. Not only can imaging characterize the wave field overall, but it also allows the detection of small capillary waves (Fig. 11) that are too small to be resolved by the motion of the vehicle itself. The balance of surface tension and gravity forces in liquids on Titan (Hayes et al., 2013) is such that the capillary/gravity wavelength transition is at wavelengths roughly double on Titan than on Earth, although in both cases it is a couple of centimeters. Thus, millimeter imaging resolution would be required to resolve capillary waves on Titan. Similarly, high-resolution foreground imaging might reveal the shape of drops of liquid splashed onto the deck—such drops might show different wetting characteristics owing to the low surface tension of liquid methane (∼0.02 N/m, Lorenz et al., 2010) compared to water (∼0.073 N/m).
5. Conclusions
Even with the rather rudimentary instrumentation and test protocols described here, the “sailing” of the model TiME capsule was enormously instructive and provided real-world (and in some cases rather unexpected—q.v. the azimuth rotation) data on which intelligent autonomous science algorithms can be trained and tested.
Quantitative interpretation of the drift rate is complicated in part by the test-specific instrumentation (anemometer and camera), which yields higher wind drag than their full-scale counterparts. Simultaneous drift testing of two capsules, one with and one without such superstructure, would be useful to isolate wind-driven and wave-driven effects. Tests of models at different scales might help isolate wind-driven from wave-driven drift.
The exercise also provided substantial material for public outreach. While the TiME project has unfortunately not been selected for flight implementation by NASA in the 2016 Discovery-12 opportunity, the lead time for possible future opportunities (e.g., Mitri et al., 2014) allows autonomous science efforts like those associated with the PLL project to be infused to enhance future science return.
Footnotes
Acknowledgments
The PLL program, including logistics for the effort reported here, was supported by the NASA ASTEP program. The scale model was fabricated by Hunts Kretsch of Lockheed Martin during the Titan Mare Explorer Phase A study, during which Dr. Ellen Stofan was the Principal Investigator. We thank her and other members of the TiME team (most notably Randy Kirk and Mike Ravine) for discussions on imaging from a floating platform. We thank the PLL team for logistic and other assistance during the field season, especially Eric Wartenweiler-Smith and Cristian Tambley. Jason Barnes is thanked for an incisive review of an earlier version of this paper.
Author Disclosure Statement
No competing financial interests exist.