
Abstract
Detection of extraterrestrial life is an ongoing goal in space exploration, and there is a need for advanced instruments and methods for the detection of signatures of life based on chemical and isotopic composition. Here, we present the first investigation of chemical composition of putative microfossils in natural samples using a miniature laser ablation/ionization time-of-flight mass spectrometer (LMS). The studies were conducted with high lateral (∼15 μm) and vertical (∼20–200 nm) resolution. The primary aim of the study was to investigate the instrument performance on micrometer-sized samples both in terms of isotope abundance and element composition. The following objectives had to be achieved: (1) Consider the detection and calculation of single stable isotope ratios in natural rock samples with techniques compatible with their employment of space instrumentation for biomarker detection in future planetary missions. (2) Achieve a highly accurate chemical compositional map of rock samples with embedded structures at the micrometer scale in which the rock matrix is easily distinguished from the micrometer structures. Our results indicate that chemical mapping of strongly heterogeneous rock samples can be obtained with a high accuracy, whereas the requirements for isotope ratios need to be improved to reach sufficiently large signal-to-noise ratio (SNR). Key Words: Biogenicity—Biomarkers—Biosignatures—Filaments—Fossilization. Astrobiology 15, 669–682.
1. Introduction
I
Current space instrumentation includes sophisticated sampling instruments that have the capacity to deliver the physical and chemical composition of planetary surfaces and subsurfaces (Grotzinger et al., 2012). Further development of sensitive, more specific space instrumentation for context investigation is of considerable interest and is an ongoing process (Parnell et al., 2007; Chela-Flores, 2010, 2012). The instruments for the investigation of planetary context are particularly interesting. They would allow the search for, and in situ detection of, fossilized microorganisms on rocks or in minerals. On Mars, there could be various microniches where fossilized microorganisms could be searched for. Microorganisms are favored by the presence of liquid water, and such environments are usually characterized by high rates of mineralization, which in turn is favorable for microbial entrapment, preservation, and subsequent fossilization. Hydrothermal environments on Earth are known for their abundant microbial presence coupled with frequent and rapid mineralization of, for example, silica, carbonates, or sulfates, in which microorganisms are trapped (Reysenbach and Cady, 2001). Hydrothermal activity has been present throughout Mars' history up until recently (Farmer, 2001). Rovers and orbiters have detected mineral suites on the surface of Mars that are indicative of hydrothermal activity and represent perfect candidate environments where microbial life could have existed and been preserved (Bishop et al., 2008; Mustard et al., 2008; Squyres et al., 2008). Another type of mineralization that has been found on the surface of Mars is that of the evaporates. Such mineralization represents hypersaline lakes, in which microorganisms are known to thrive and are easily trapped by the formation of salt crystals. Polar ice is also a mineral that represents a habitable environment characterized by rapid mineralization. However, microbes can also exist on rock substrates in extremely dry areas such as deserts. Rock varnish is a Mn- and Fe-rich mineral crust that forms on rocks in dry areas such as Antarctica and is the result of microbial activity (Gorbushina, 2003). In these mineral crusts, the remains of the active microorganisms are preserved and easily detectable. Rock varnish could form on Mars and should be targeted on upcoming missions (Gorbushina et al., 2002).
The hostile surface conditions on Mars, including radiation and temperature fluctuations, imply that the subsurface is a more plausible environment where microbes could survive and, thus, be preserved over geological time. Fossilized microbial communities in mafic rocks have been found in both continental and marine environments on Earth and could be considered as analogues to potential extraterrestrial communities basically because mafic rocks are the dominating rock type on other terrestrial planets.
In the search for biosignatures, which could be efficiently applied for in situ investigations on the surfaces of other planets, the knowledge of key biorelevant elements and their isotopic composition, which are affected by biological fractionation, are of foremost interest (Chela-Flores and Kumar, 2008; Chela-Flores, 2010; Chela-Flores and SeckBach, 2011). Typically, only large and complex laboratory instruments are used to obtain quantitative elemental and isotopic composition of micrometer-sized objects (Zinner et al., 2011; Ireland, 2013). Detection of elements and their isotopes to differentiate between biotic an abiotic materials can be investigated by currently available miniature mass spectrometric instruments (Brinckerhoff et al., 2000; Rohner et al., 2003, 2004; Managadze et al., 2010). Performance studies of a miniature laser ablation/ionization time-of-flight mass spectrometer (LMS) system developed for space research in our group have been reported in several recent publications (Riedo et al., 2010, 2013a, 2013b; Tulej et al., 2011, 2014; Neuland et al., 2014; Grimaudo et al., 2015). Laser ablation/ionization mass spectrometry allows for highly sensitive detection of almost all elements and isotopes with their concentrations down to tens of parts per billion at significantly better than unit mass resolution. High spatial resolution of the surface analysis is achieved by focusing the laser to a spot of 10–20 μm, allowing for chemical surface mapping and depth profiling (Neuland et al., 2014; Grimaudo et al., 2015).
In the present study, we investigated for the first time micrometer-sized filamentous structures embedded in carbonate veins in harzburgite by microscopic imaging and laser ablation mass spectrometry. We present the chemical analysis of the microstructures and discuss the implications of the chemical analysis as well as a possible biological origin. Based on this work, we are confident that similar studies can be conducted in situ on planetary surfaces and will be essential in searches for past life.
2. Materials and Methods
2.1. Sample preparation
The sample (1271B 4R1 23–26 cm) used in the current study was acquired from the slow-spreading Mid-Atlantic Ridge during ODP Leg 209 and collected from a depth of 26.9 m below the seafloor (Bach et al., 2011). The sample contains aragonite veins hosted in serpentinized harzburgite. The age of the aragonite is >54,900 years since it is radiocarbon-dead, but not more than 1 million years since that is the approximate time when the basement exhumed (Bach et al., 2011).
The sample was prepared as a polished thin section (∼30 μm in thickness). Mineral phases and putative fossilized microorganisms were localized by an optical microscope and an environmental scanning electron microscope (ESEM) coupled with an energy-dispersive spectrometer (EDS) on an FEI QUANTA FEG 650 (Oxford Instruments, UK). For the analysis by EDS, an Oxford T-Max 80 detector was used. The sample was not coated during ESEM/EDS analyses. To minimize surficial charging effects, the sample was kept at low-vacuum conditions, and the acceleration voltage was kept at 20 or 15 kV depending on the nature of the sample. The instrument was calibrated with a cobalt standard. Peak and element analyses were performed with INCA Suite 4.11 software.
2.2. Laser mass spectrometry
2.2.1. Sample preparation for mass spectrometric analysis
For the mass spectrometric investigation, a polished thin section of the sample was mounted on the sample holder and imaged with a laboratory microscope to identify the regions with potential fossilized material (Fig. 1A). After selection of rectangular areas on the sample surface (Fig. 1B), the x-y coordinates were introduced and transformed to the coordinate system of an x-y-z translational stage on which the sample was mounted (Riedo, 2014). The sample was then placed into the measurement vacuum chamber at the measurement location (Riedo et al., 2013a, 2013c). Two different surface areas (M1 and M2) were investigated (Fig. 1A). Figure 1B displays a microscope image of the surface area selected for the mass spectrometric analysis in the first campaign (M1). A similar rectangular area was investigated a few months later from the second surface location (M2, Fig. 1A).
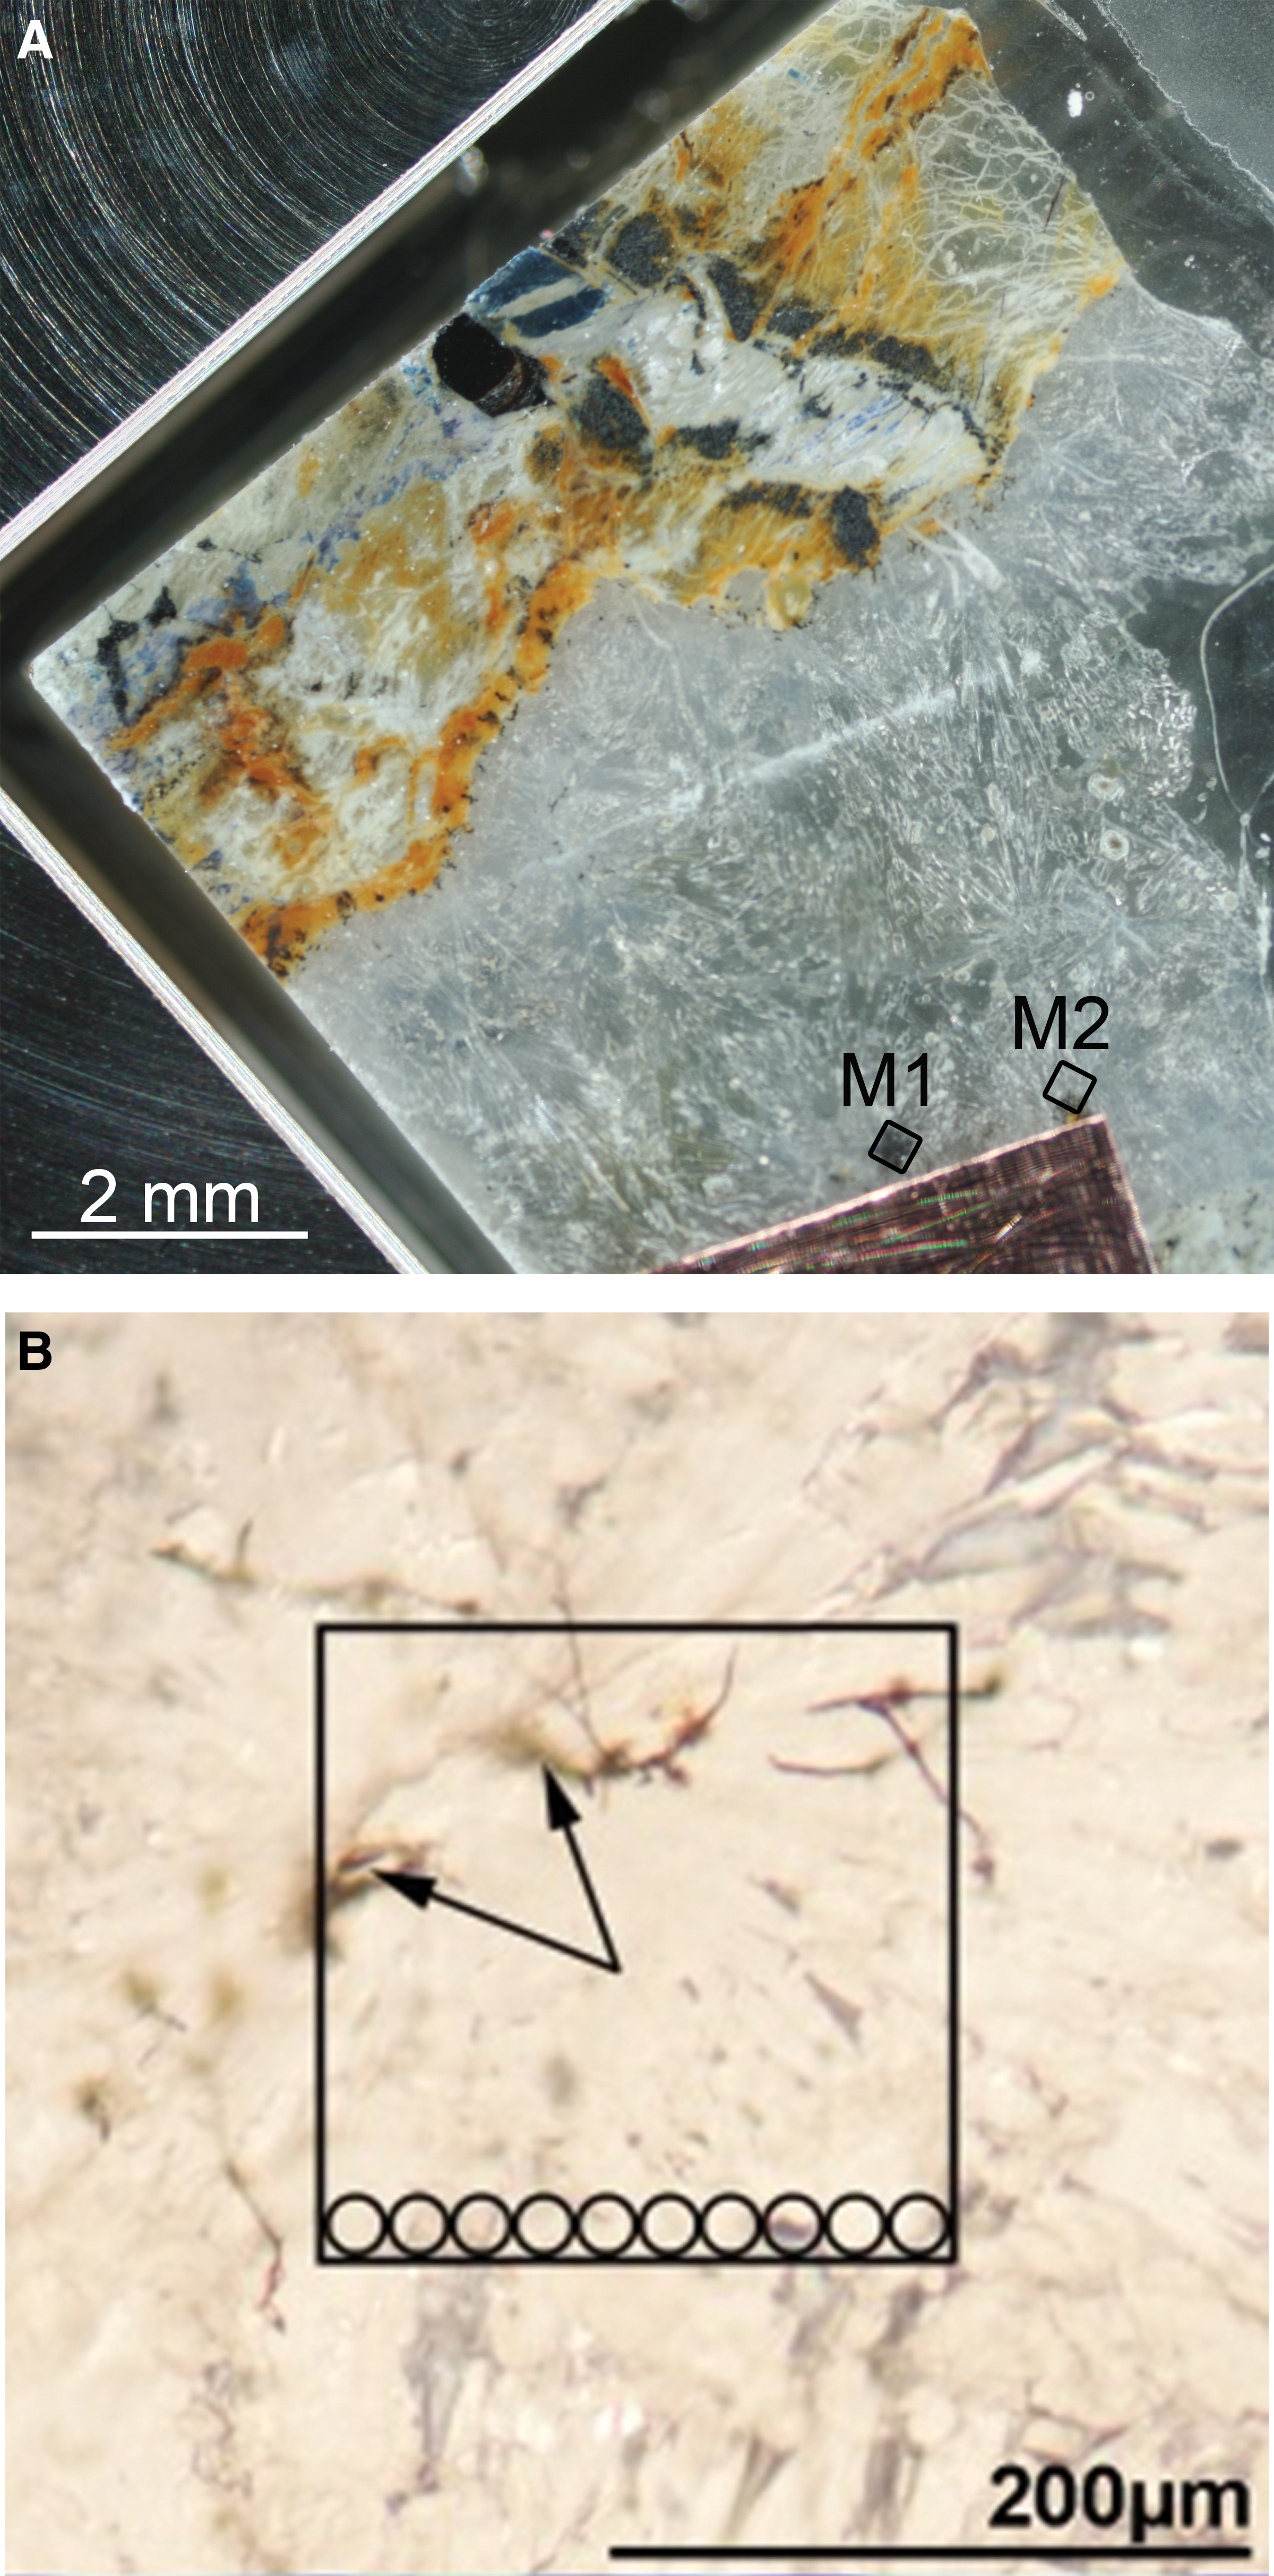
Images of the investigated sample. (
2.2.2. Laser ablation/ionization mass spectrometry
The mass spectrometric investigation was conducted by a miniature LMS designed for in situ space research (Rohner et al., 2003). The instrument combines laser ablation/ionization ion source with a reflectron time-of-flight mass analyzer. The details of the technical realization and principles of operation of LMS are described in previous publications (Riedo et al., 2013a, 2013b, 2013c). In the current investigations, a focused fs-laser radiation (τ ∼ 190 fs, λ=775 nm, laser pulse repetition rate of 1 kHz) was used to ablate, atomize, and ionize sample material. Laser pulse energy, laser pulse repetition rate, and the number of applied laser pulses were fully computer controlled by the LMS operating system (Riedo et al., 2013a, 2013c; Riedo, 2014). The laser focus (a spot of about 15 μm in diameter) was arranged on a sample surface placed on x-y-z micro translation stage, about 1 mm away from the entrance to the LMS ion-optical system.
2.2.3. Measurement procedure
Mass spectrometric measurements were conducted on rectangular areas (M1 and M2, each 200×200 μm2, with and without filamentous microstructures) (see Fig. 1). Because no microscope-camera system is currently installed in the instrumental setup to visualize sample surface on line the selected surface areas were investigated stepwise every 20 μm (raster of 10×10 surface locations) corresponding to 100 single investigated surface locations (Fig. 1). The measurement campaigns were realized in a sequential measurement procedure [by homemade software for the control of the acquisition system, micro translational stages, and laser system (Riedo, 2014; Tulej et al., 2014)], including, first, the positioning of the micro translational stage to the desired surface location and the subsequent analysis by laser mass spectrometry. The calibration of the x-y-z stages with the x-y coordinates of the sample could be set with an accuracy of about±10 μm. These studies yield chemical surface mapping with high lateral resolution.
The instrument also allows high-resolution chemical depth profiling (Grimaudo et al., 2015). In the latter studies, the sample can be analyzed layer by layer with a depth resolution down to subnanometer per single laser shot. Further details of the technical realization and the principle of operation of LMS can be found in recent publications (Riedo et al., 2013a, 2013b, 2013c).
A laser irradiance of ∼5.5 TW/cm2 (∼2 μJ/laser shot) was applied at the sample surface, which typically is sufficiently large to support stoichiometric ion production of metal-containing samples (Riedo et al., 2013c; Grimaudo et al., 2015). From each investigated surface location, 40,000 single laser shot mass spectra were recorded in 20 packets of 2000 summed individual waveforms each during the first campaign (M1). A similar campaign (M2) was conducted on another surface area of similar size a few months later, and 60,000 single laser shot mass spectra were recorded in 300 packets of 200 summed individual waveforms. Hence, for campaign M1 there are 20 and for campaign M2 there are 300 mass spectra per measurement location. The latter studies allow a 15 times increase of depth profiling resolution because the chemical information is obtained from thinner ablation layers and therefore also more accurate determination of the filament location in the aragonite host. Because, in the present study, the identification of the elements contained in the filaments was relevant, the quantitative ablation depth analysis was not conducted. Thus, the measurements yield only qualitative information on the ablation depth. Nevertheless, based on our current performance investigation on the chemical depth profiling, the vertical resolution of the ablation studies of filaments is expected to be in the range of 20–200 nm (Grimaudo et al., 2015). For the chemical analysis of the filaments, only the mass spectra with the specific elements contained in filaments are considered. Because the laser ablation ion source was operated under the same conditions in both campaigns (similar laser spot diameter and applied laser fluence), ion rates that were also produced during the ablation were expected to be similar. By plotting the mass peak intensities of the elements contained only in the filaments against the spectrum number (location, depth), the element contribution from the filaments can be well isolated from that of the aragonite host alone.
2.2.4. Data analysis
Two sets of mass spectra were recorded on two surface locations, each of 200×200 μm2 size, in two campaigns, M1 and M2, respectively. The mass spectrometric analyses yielded the atomic abundance of elements determined in the sample. The combined error of the mass peak integration, background and noise, and statistics is typically lower than a few percent, and scaling of the signals by RSC is not applied (Riedo et al., 2013c). Isotope abundance values for selected elements are calculated according to established procedures and can be presented with the usual delta notation:
where R denotes the isotope ratio of the heavy to light isotope (e.g., 34S/32S), and Rx and Rs are the ratios in the sample and in the standard, respectively.
3. Results
3.1. Carbonate veins and filamentous microstructures: microscope observations
The investigations were conducted on dark filamentous micrometer-structures at the interface between the aragonite and the harzburgite host rock. The filaments have a uniform diameter of about 2–5 μm and range in length from about 20 to more than 100 μm (see Fig. 1). The veins are 5–10 mm in diameter, and the filaments are anchored to the vein walls of the host rock or occur closely associated with the vein walls embedded in the aragonite. They are quasi linear, frequently branched, and in some cases show repeated partitioning by perpendicular cross-walls similar to septa. We refer to them as micrometer-structures (filaments) that bear resemblance to known fossilized microorganisms.
3.2. Identification of the aragonite matrix and filament regions by mass spectrometry
The locations of filaments were found by plotting the signals of selected isotopes of specific elements contained just in the filaments against the recorded file numbers. The file number defines, in addition to lateral location of the filament, the number of the ablated layer at the measurement location. Figure 2 shows the locations of filaments identified by this method for those recorded mass spectra that contain B and S mass peaks (see also Fig. 3). Concentrations of B and S are observed to be increasingly high in the filaments, and they are practically undetectable in the aragonite host matrix. The peaks displayed in Fig. 2 have different heights and widths. While the height of the peak is related to the concentration of the element within the analyzed surface ablation layer, the peak width (a number of ablation layers) is related to vertical extension of the filamentous structure at a particular location. Thus, the search method allows a sensitive identification of filaments in the aragonite matrix volume within the instrumental sensitivity with a high spatial (lateral and vertical) resolution.
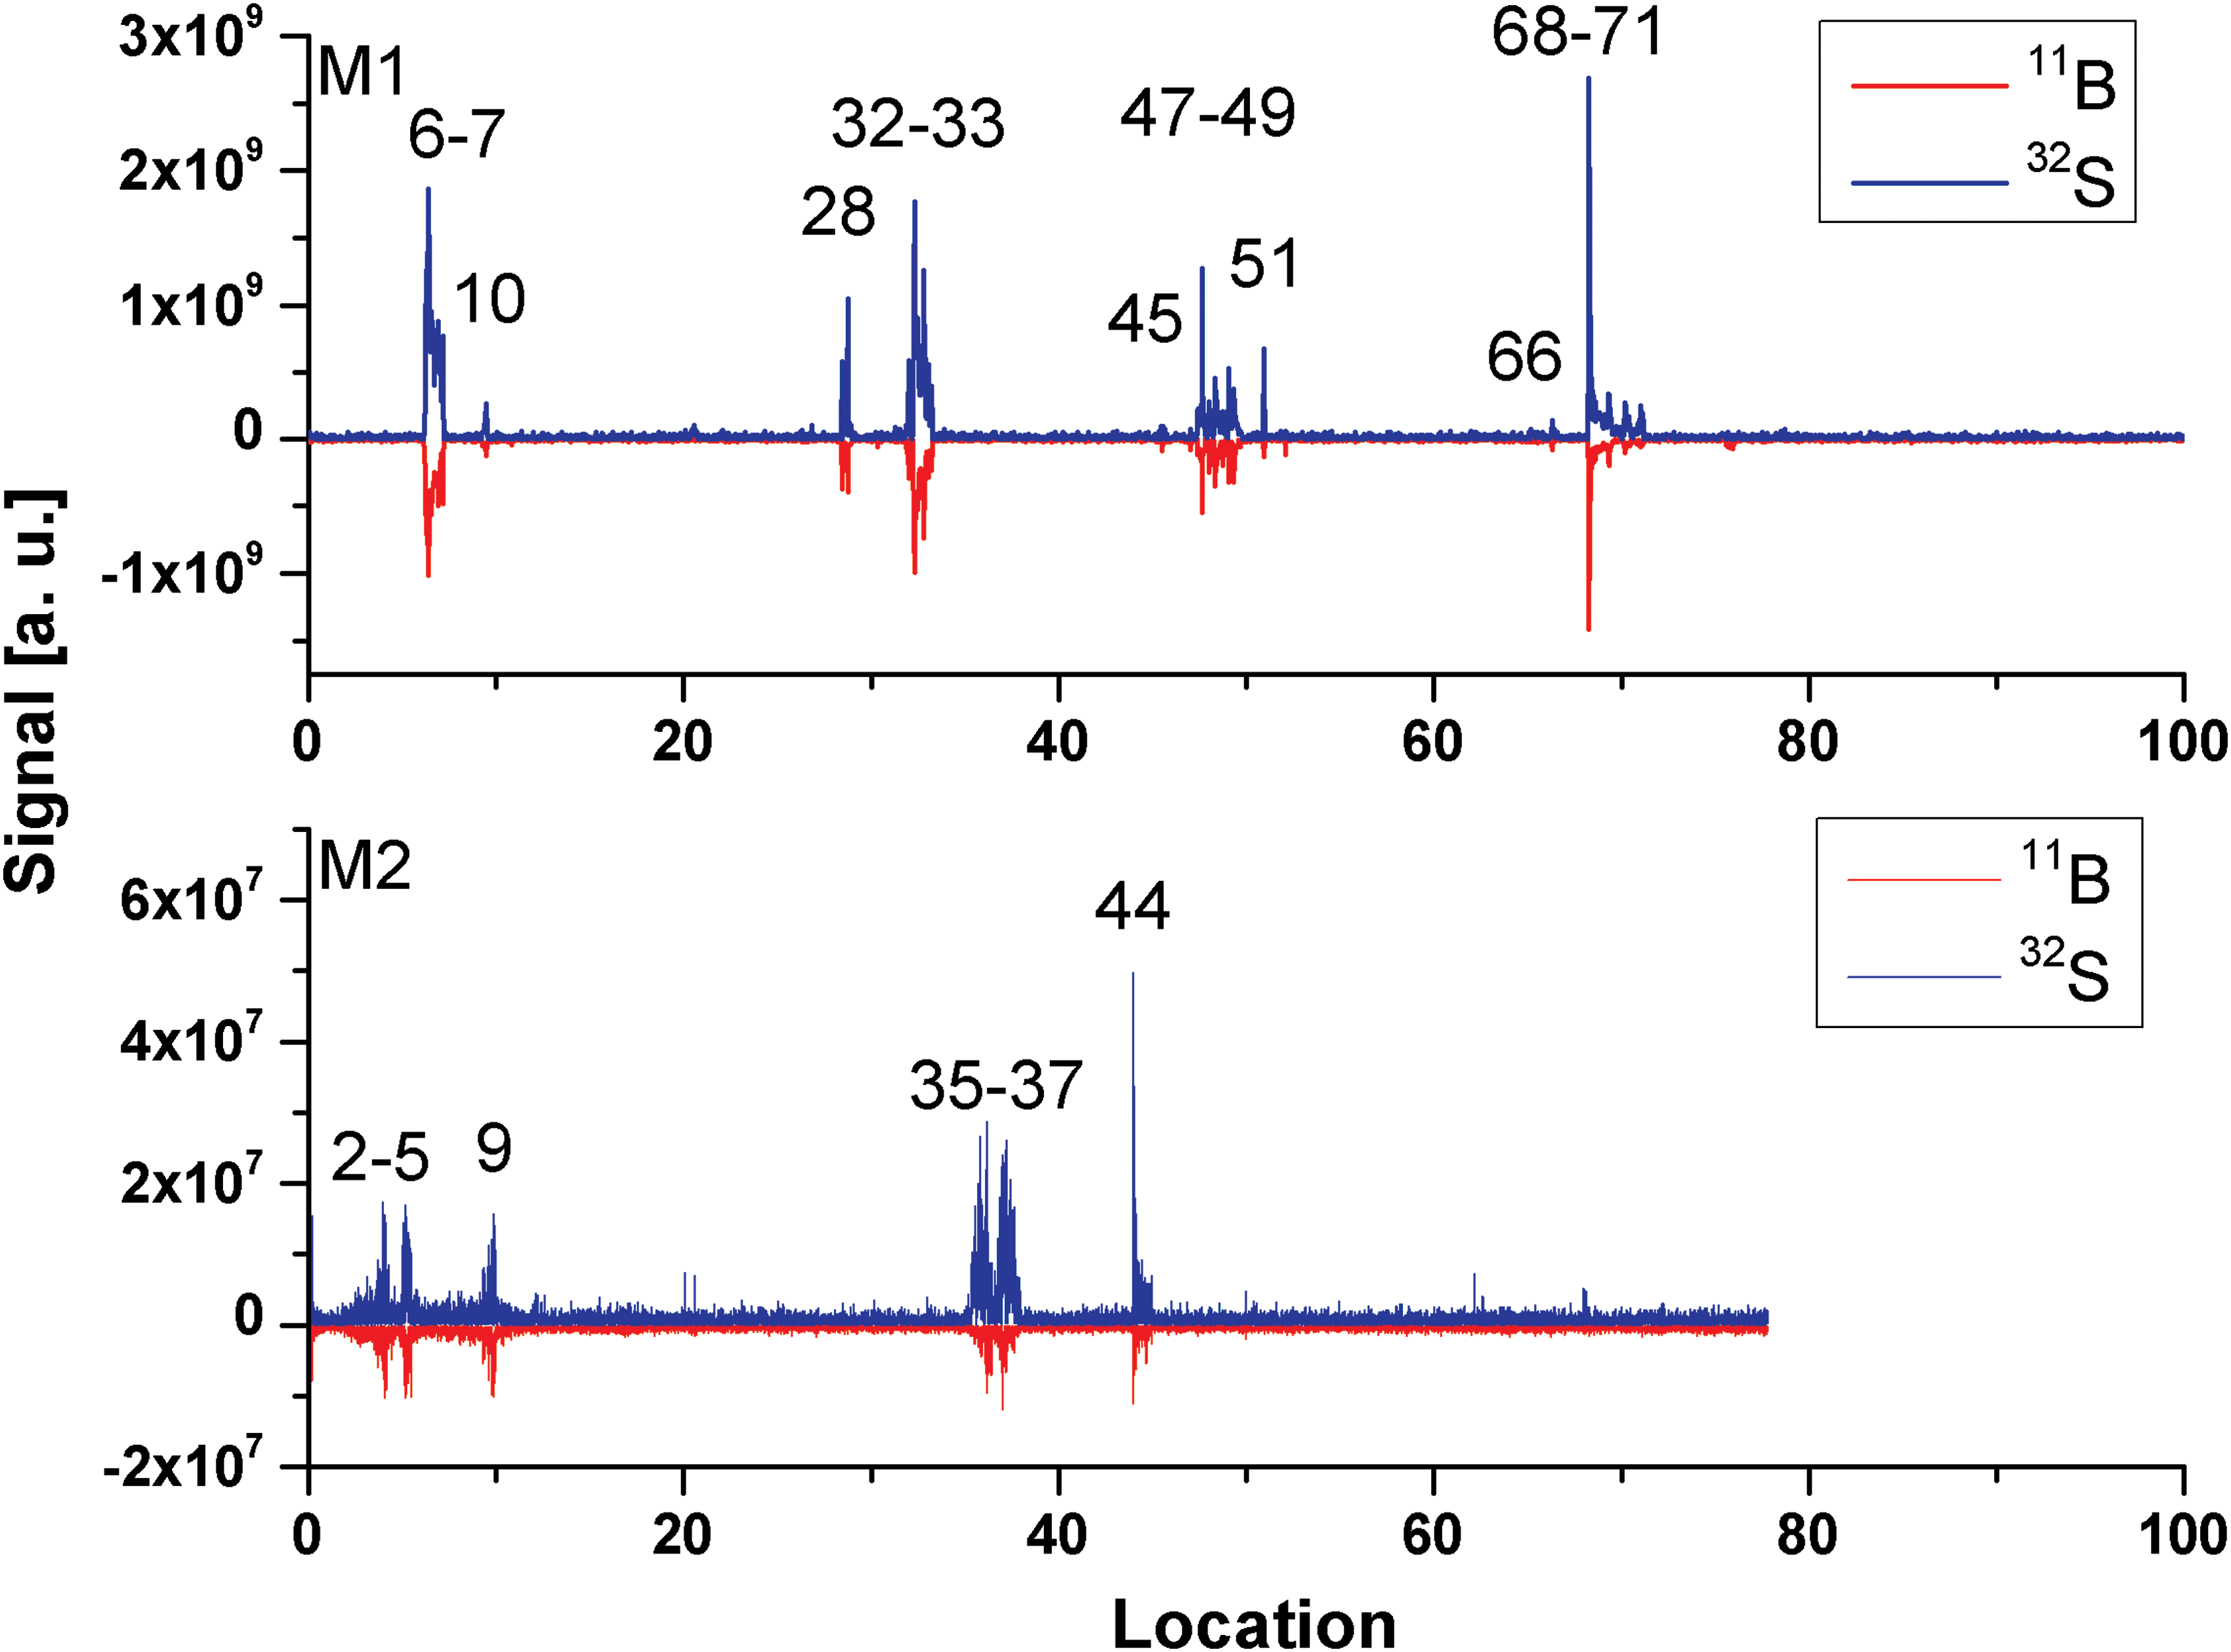
Signals of the isotopes 11B and 32S are identified at several locations on the sample surface and subsurface. Peak shape in the graph reflects the variation of the detected signal with the progress of the ablation of the surface at a particular location. Compare also the correlation between the measurement locations (M1, upper panel) with the locations on the image recorded by a microscope-camera (Fig. 3). The signal of 11B is reverted here. (Color graphics available at
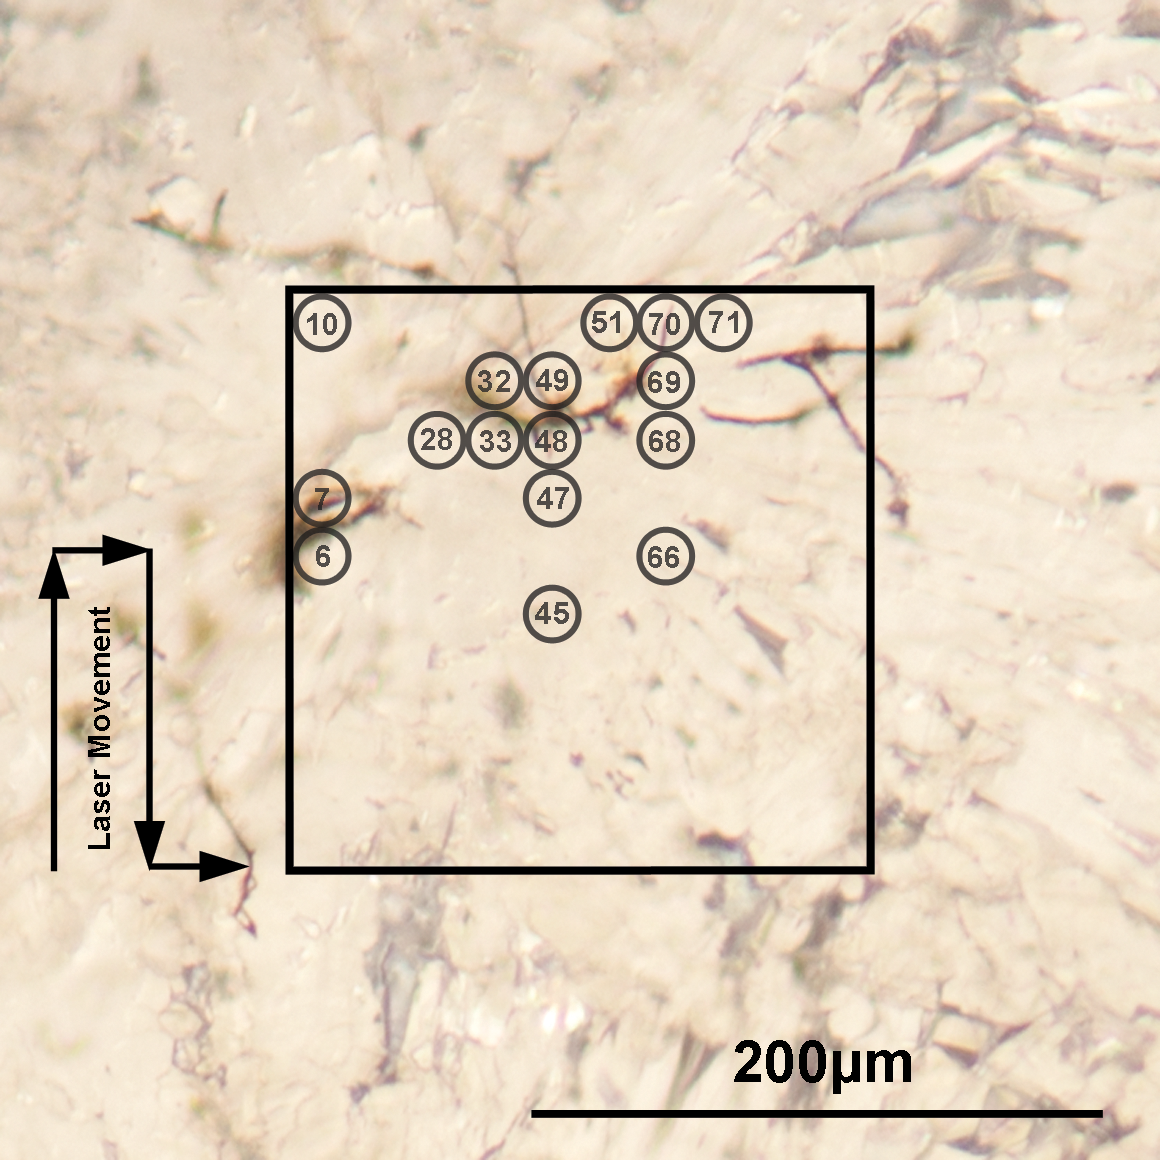
The filament locations identified on the surface area during the first measurement campaign (M1). The circles with centered numbers in the figure show the locations at which the mass spectra characteristic for filaments were recorded by mass spectrometry (see also Fig. 2). The location of the circles is given with the accuracy of about±10 μm. (Color graphics available at
Analyses of the mass spectra showed that some of the filaments were detected directly at the surface (M1: file numbers 6, 33, 47–49, 68–71; M2: 35–37, 44) and others at the subsurface, after ablating some layers of the aragonite matrix (e.g., M1: 10, 28, 32, 45, 51, 66; M2: 2, 3, 9, 35). The locations of the filaments identified by mass spectrometry are consistent with the filamentous microstructures observed in Fig. 3. At locations 10, 28, 45, 51, and 66, the microscope observation does not provide evidence on the filamentous structure, which indicates that detected features may be smaller or sufficiently diffuse to be observed readily. The lateral mapping and depth profile analysis helps to differentiate between the measurement of aragonite matrix and filaments. Note that the lateral resolution of the analysis is limited by the laser ablation spot size. For the filament sizes smaller than 15 μm, the elements contained in the aragonite matrix will contribute to the mass spectrum as well and render the quantitative chemical analysis less certain.
3.2.1. Chemical composition of aragonite host
The optical inspection of the sample surface by microscope showed that most of the measurements performed on the two selected surface areas yielded the mass spectra of the aragonite mineral (CaCO3), which hosts the filaments. Mass spectra recorded in the low gain (LG) and high gain (HG) channels of the aragonite matrix are shown in Fig. 4. The LG spectra deliver the measurement of elements with concentrations down to a few hundreds of parts per million, whereas the HG spectra yield detection of elements with concentrations down to a few tenths of parts per billion (Riedo et al., 2013a). In the measurements conducted here, the LG mass spectrum shows the measurement of the major elements: H, K, Na, Ca, C, O, and Mg. Most aragonite minerals are nearly pure calcium carbonate (CaCO3), though our measurements show, in addition to Ca, C, and O, the elements H, Na, K, and Mg. The atomic fractions of the (C, O, Ca) elements are observed to be not exactly stoichiometric (Table 1) with large deficiency of O element. Nevertheless, the mass spectrometric analysis delivers only the detection of S and Cl elements at the trace level (see Fig. 4). The identification of these elements in the aragonite matrix has to be considered as tentative because the presence of sufficiently diluted filamentous structures cannot be excluded in the investigated area. Isobaric interferences due to observation of clusters and molecules limit the detection sensitivity for other possible trace elements.
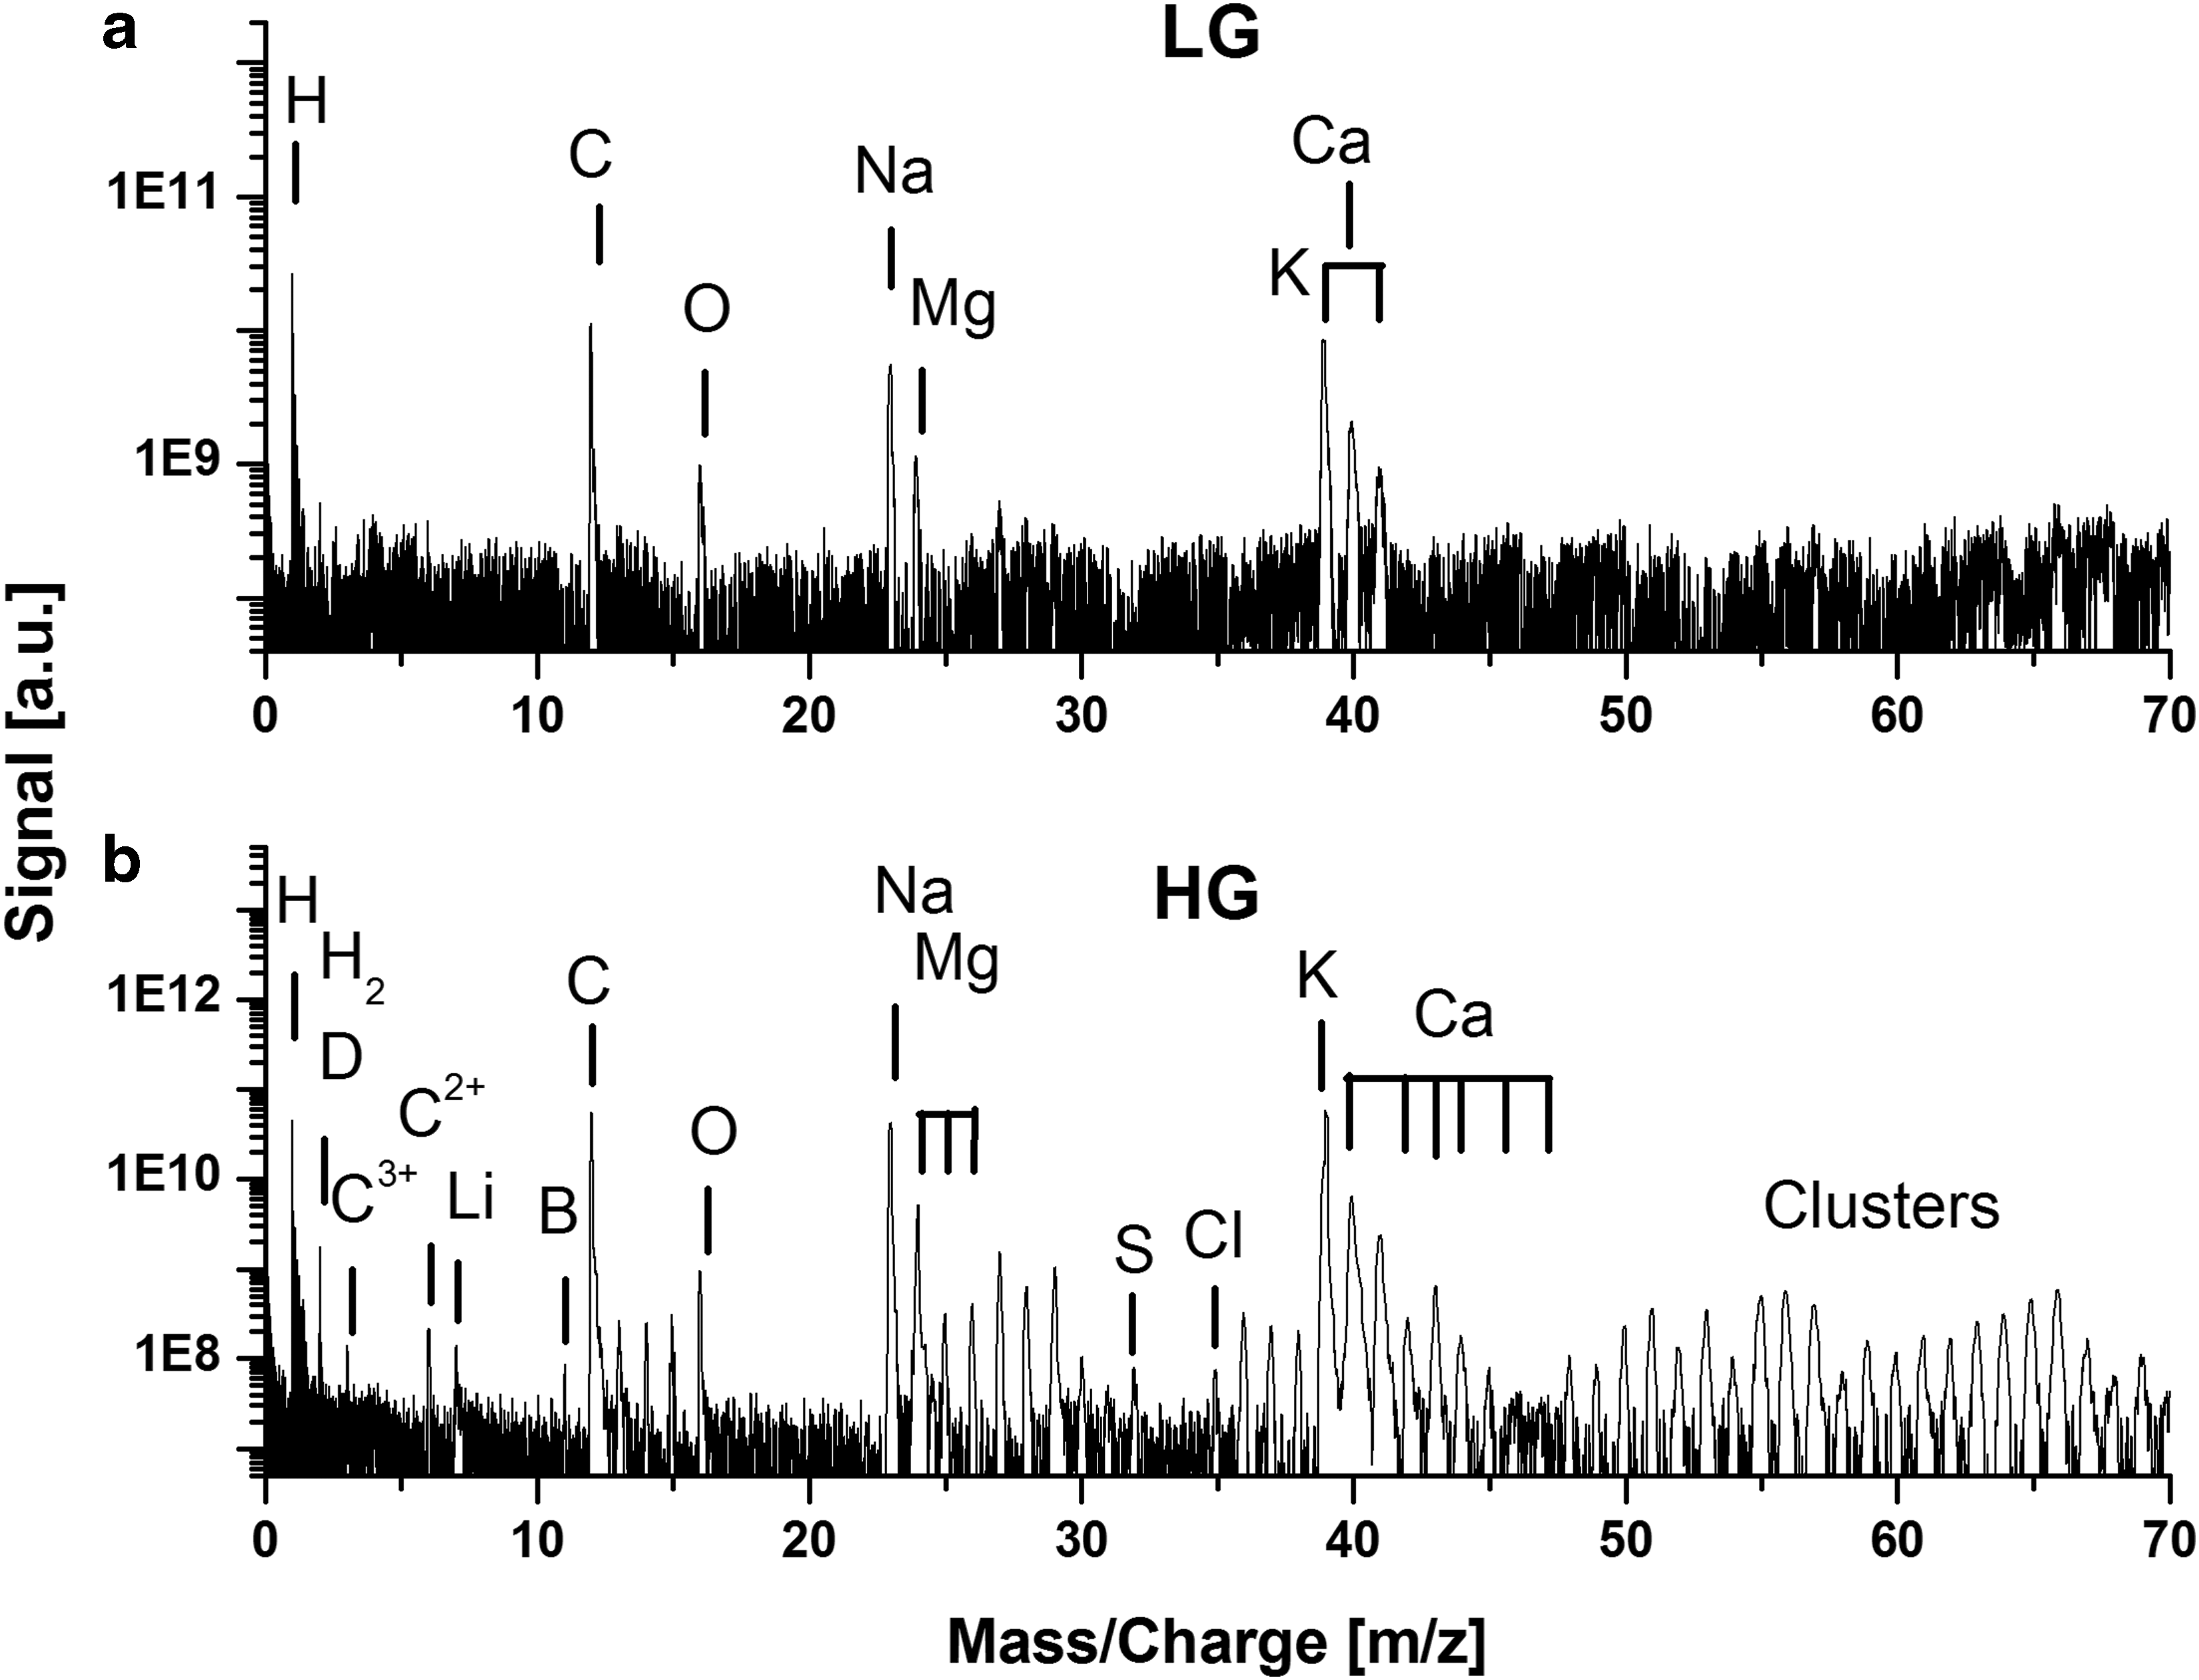
Mass spectrum of the aragonite mineral (M1). (
The atomic fractions of the elements determined for aragonite matrix are given in the last column.
The example of the chemical depth profiling of the aragonite matrix prepared across 300 ablated layers (60,000 laser shots) at location 60 (M2) is presented in Fig. 5. The graphs display the signal variation of several elements with the ablation depth, given as the ablated layer number. The ablated layer is defined here as the surface thickness that was ablated by 200 laser shots. The signal variation observed in this study is similar to that typically observed in ablation studies of homogeneous material. After initial rise for the first few ablation layers (crater building, removal of the first uppermost atomic layers of the sample surface), overall signals rapidly decrease and begin to stabilize for the rest of the ablation progress. The ion rates are observed to steadily decrease at a somewhat similar rate (Riedo et al., 2013c).
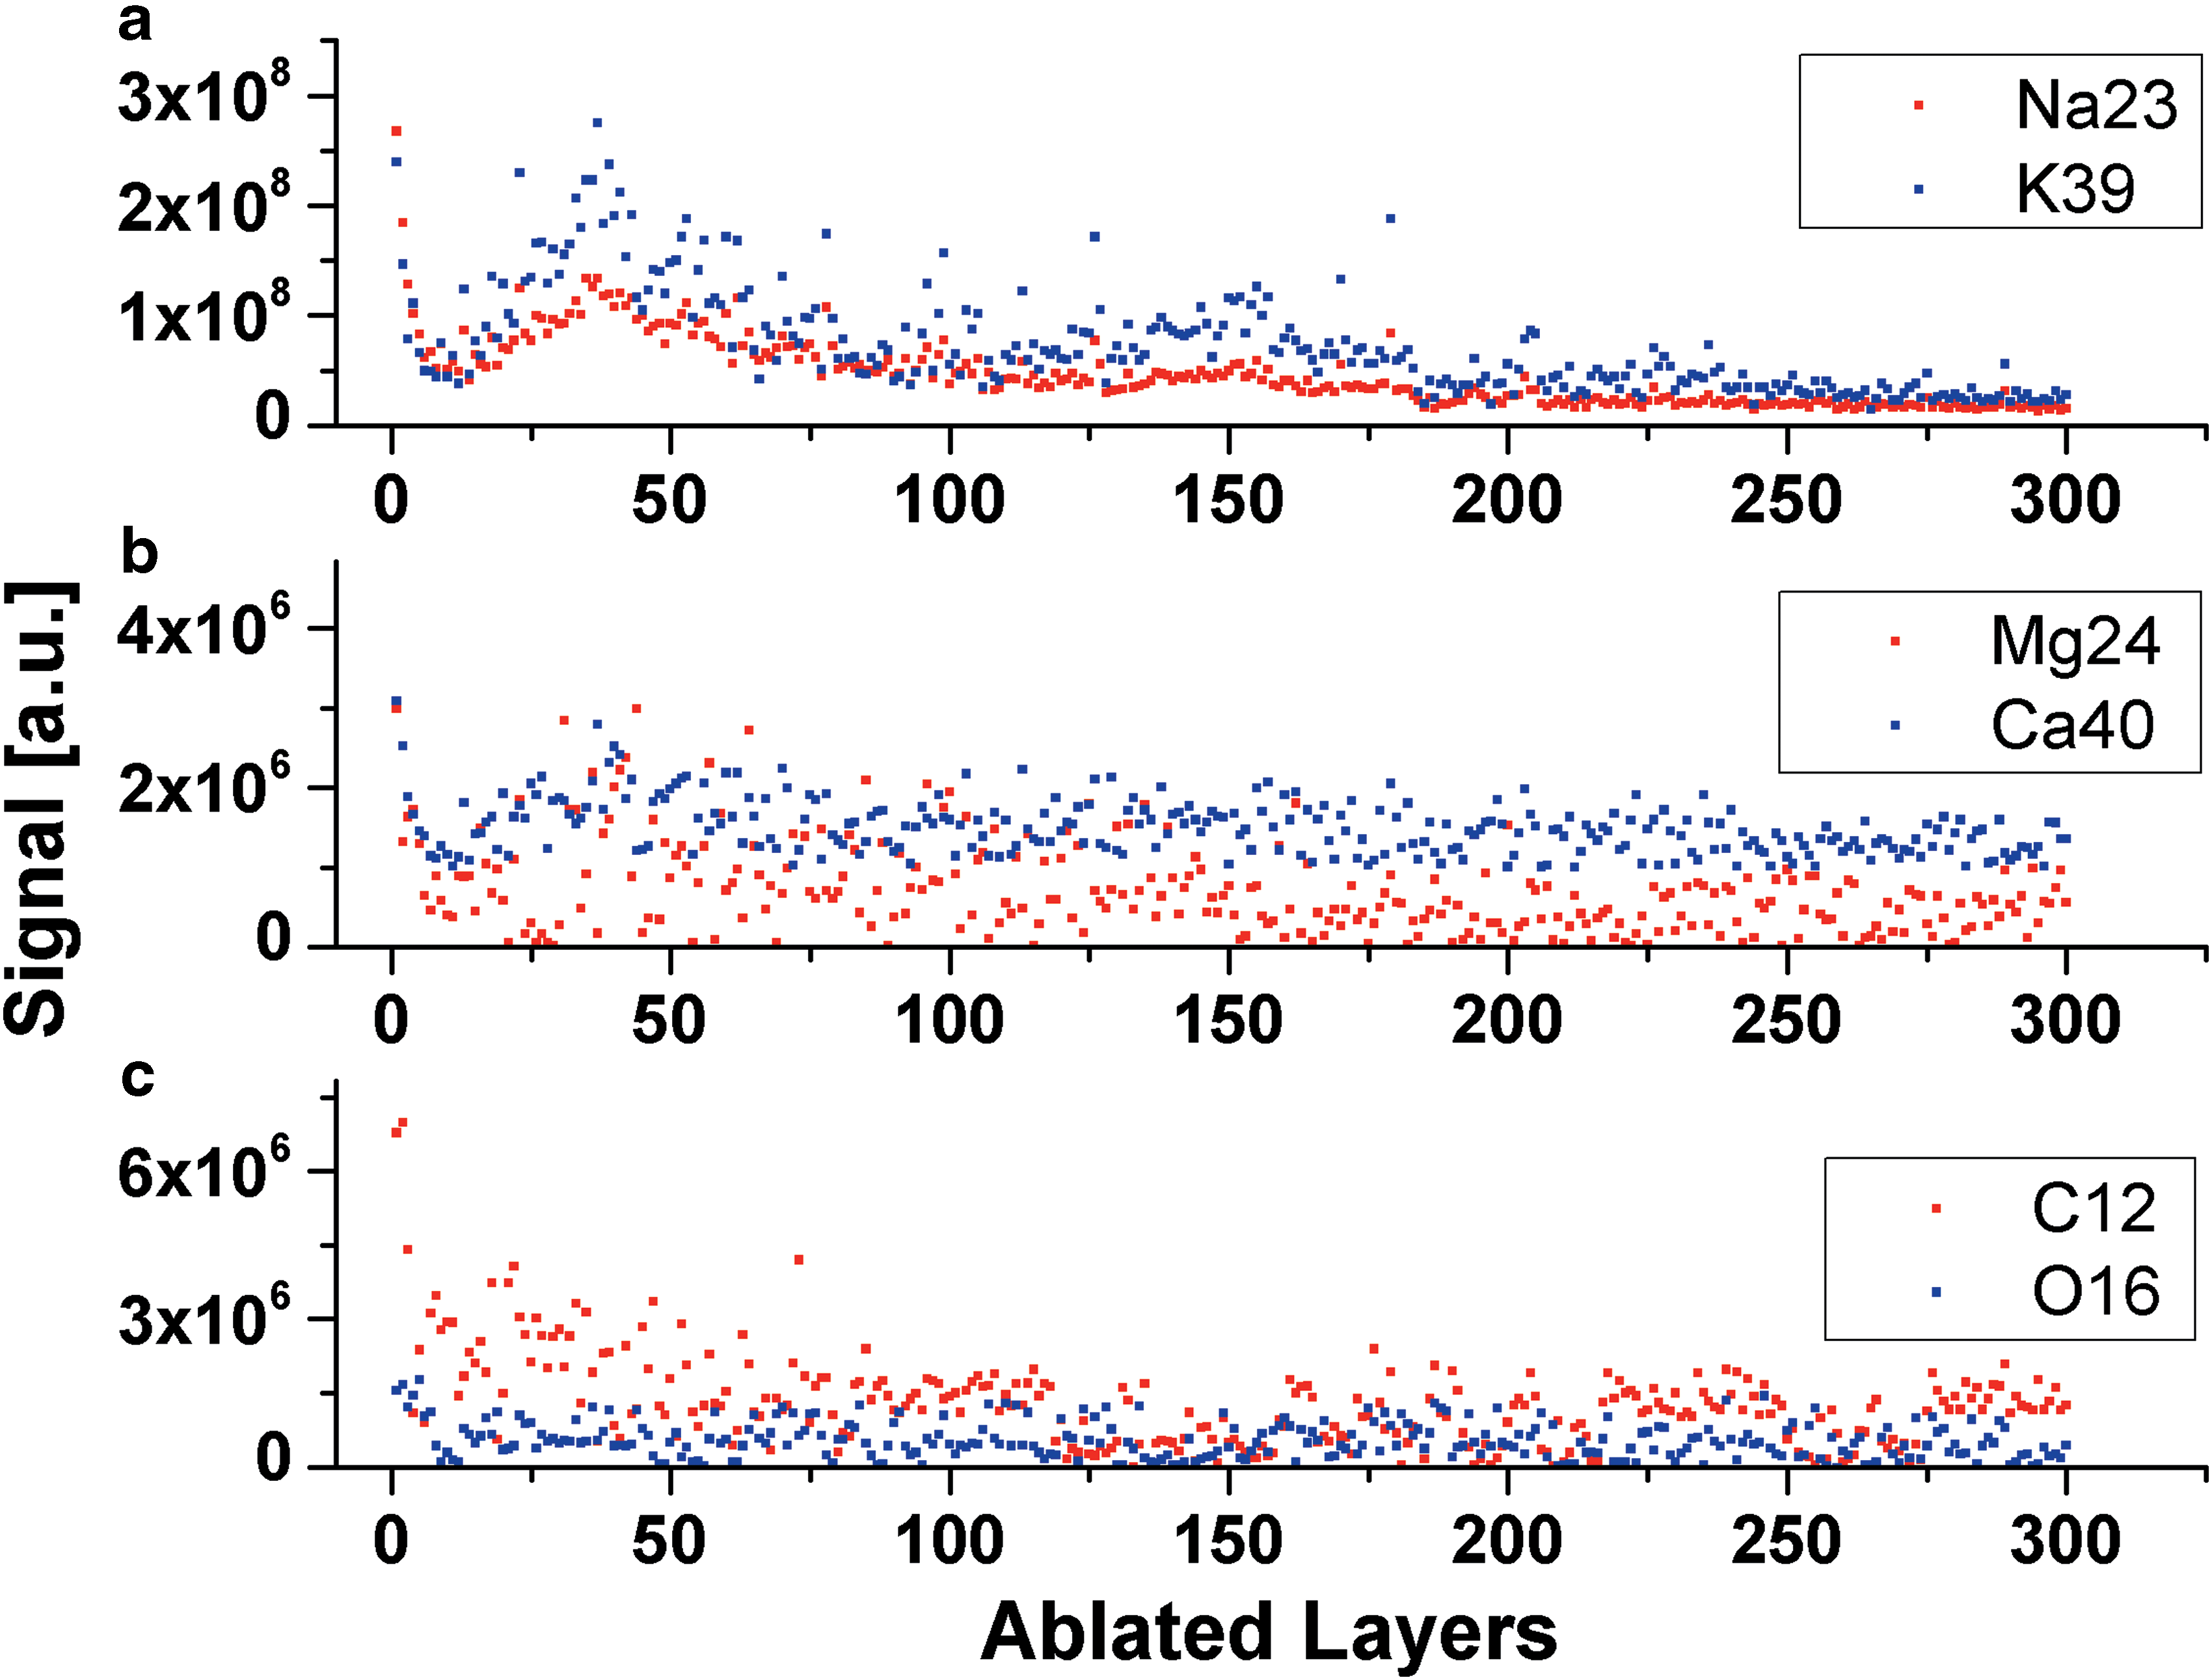
Chemical depth profiling of the aragonite matrix at location 60 (M2) by means of major elements (see Fig. 2). The changes of the signals of all major elements are observed to be well correlated, and no large variations are observed with the ablation progress. (Color graphics available at
3.2.2. Chemical composition of filaments
The mass spectra of the investigated filaments have a distinctly different chemical composition compared to that of the aragonite host matrix. An example of the mass spectrum of the filament identified at location 36 (M2) is shown in Fig. 6. In the LG spectrum (Fig. 6a), several major (O, Na, Mg, K, Ca, Mn, Fe, and Co) and minor (C, Si, S, Cl) elements are identified. The MG (the channel with a gain intermediate between low and high gain) and HG spectra (6b and 6c) yield, in addition, the detection of trace elements (B, N, F, Al, P, Ti, Cr, and Ni). Several metallic and nonmetallic elements were readily observed, including (B, N, F, Al, P, S, Cl, Ti, V, Cr, Mn, Fe, Ni, and Co). For most of the elements, the identification is based on the accurate mass determination and the observation of their characteristic isotope pattern. Nevertheless, some of the mass peaks, including N, Si, P, Ti, Fe, Ni, and Co, can coincide with the mass peaks of clusters and molecules, which are expected to form via plasma chemistry in the ablation plume. Particularly troublesome are the carbon molecules and clusters. Carbon is known to be reactive, and it can initiate complex carbon chemistry with production of a variety of carbon molecules and clusters containing H, O, and other elements. Since the mass spectrometer records mass spectra with a mass resolution of about m/Δm=400–600, the contribution of molecules and clusters to element mass peaks cannot be resolved, and molecules and cluster mass peaks will interfere with mass peaks of elements. The comparison of the mass spectra of aragonite matrix and filaments in the mass ranges of 70–100 also yields a tentative detection of Se, Sr, and Rb. Due to low accuracy of the isotope ratio determination from these spectra, we consider these detections to be tentative.
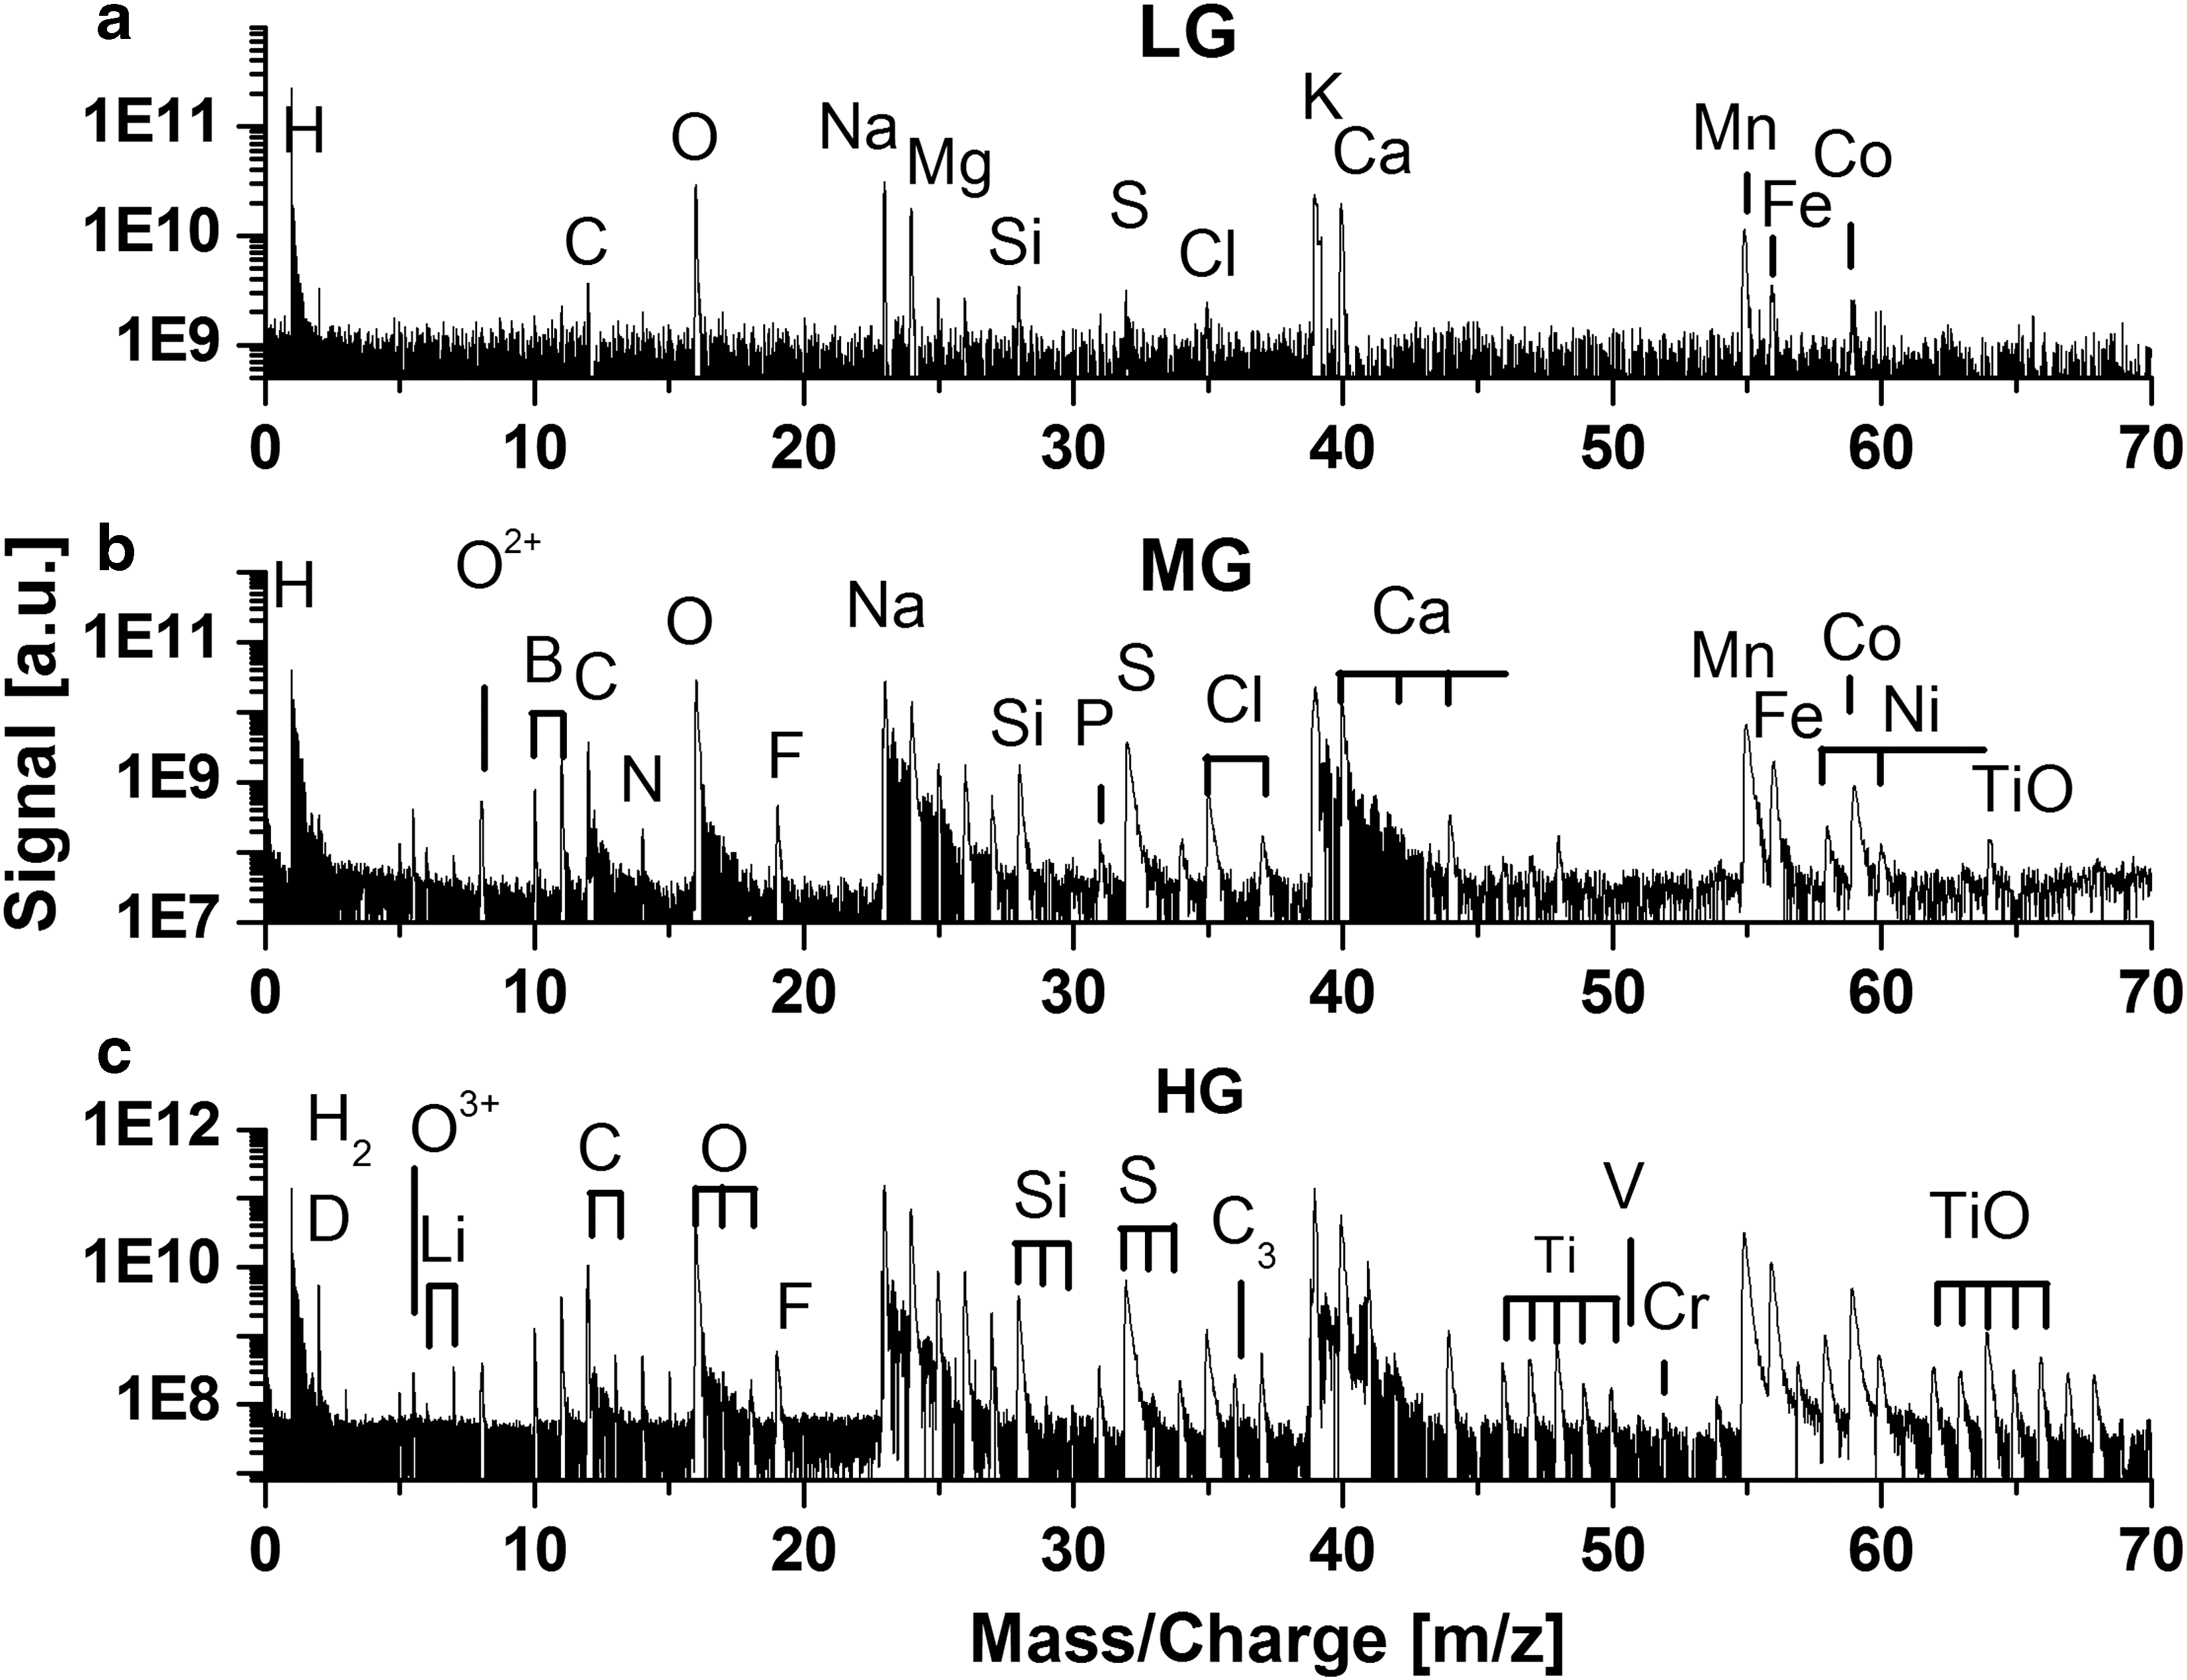
Typical mass spectrum measured at a filament location. In the LG spectrum (
Figure 7 displays the variation of the element signals with the ablation depth for locations 35 (M2) and 44 (M2) (see also Figs. 2 and 3). By following the S and Mn signal variations with the ablation progress, a sharp transition from the filament to the host matrix can be observed (see Fig. 7). At location 35, the mass spectrometric analysis indicated that the filament was located just below the aragonite surface, and several layers of the aragonite had to be ablated to observe the elements contained only in filaments. In following, weak element signals are observed within 40–75 ablation layers (8000–15,000 laser shots), and subsequently a steady rise of the filament element signals is observed for the next 200 (40,000 laser shots) ablation layers. At location 44, the filament material is observed at the surface level only, within the first 20 ablation layers (4,000 laser shots). In following, weak signals are observed within 25–175 and 200–300 ablation layers. The depth profiling analysis showed that the concentration of elements across ablated layers can be substantially modulated and there are layers at which no filamentous material is observed. In the latter case, only main elements of the aragonite matrix contribute to the spectrum. While the signal variation of the elements identified in filaments correlates very well with the ablation progress, the relative signals of the main elements (C, O, Mg, Ca, Na, and K) are observed to vary on the transition from the aragonite matrix to filament. The C abundance in the filament is observed to be much lower than that measured in the aragonite matrix, and the O abundance rises in most cases sharply when the studies are conducted on the transition from the aragonite matrix to the filament. Also, the Mg signal is observed to be increasingly larger relative to that of Ca at the filament location. Similarly, the K and Na signals differ in magnitude at the filament location and aragonite matrix, respectively.
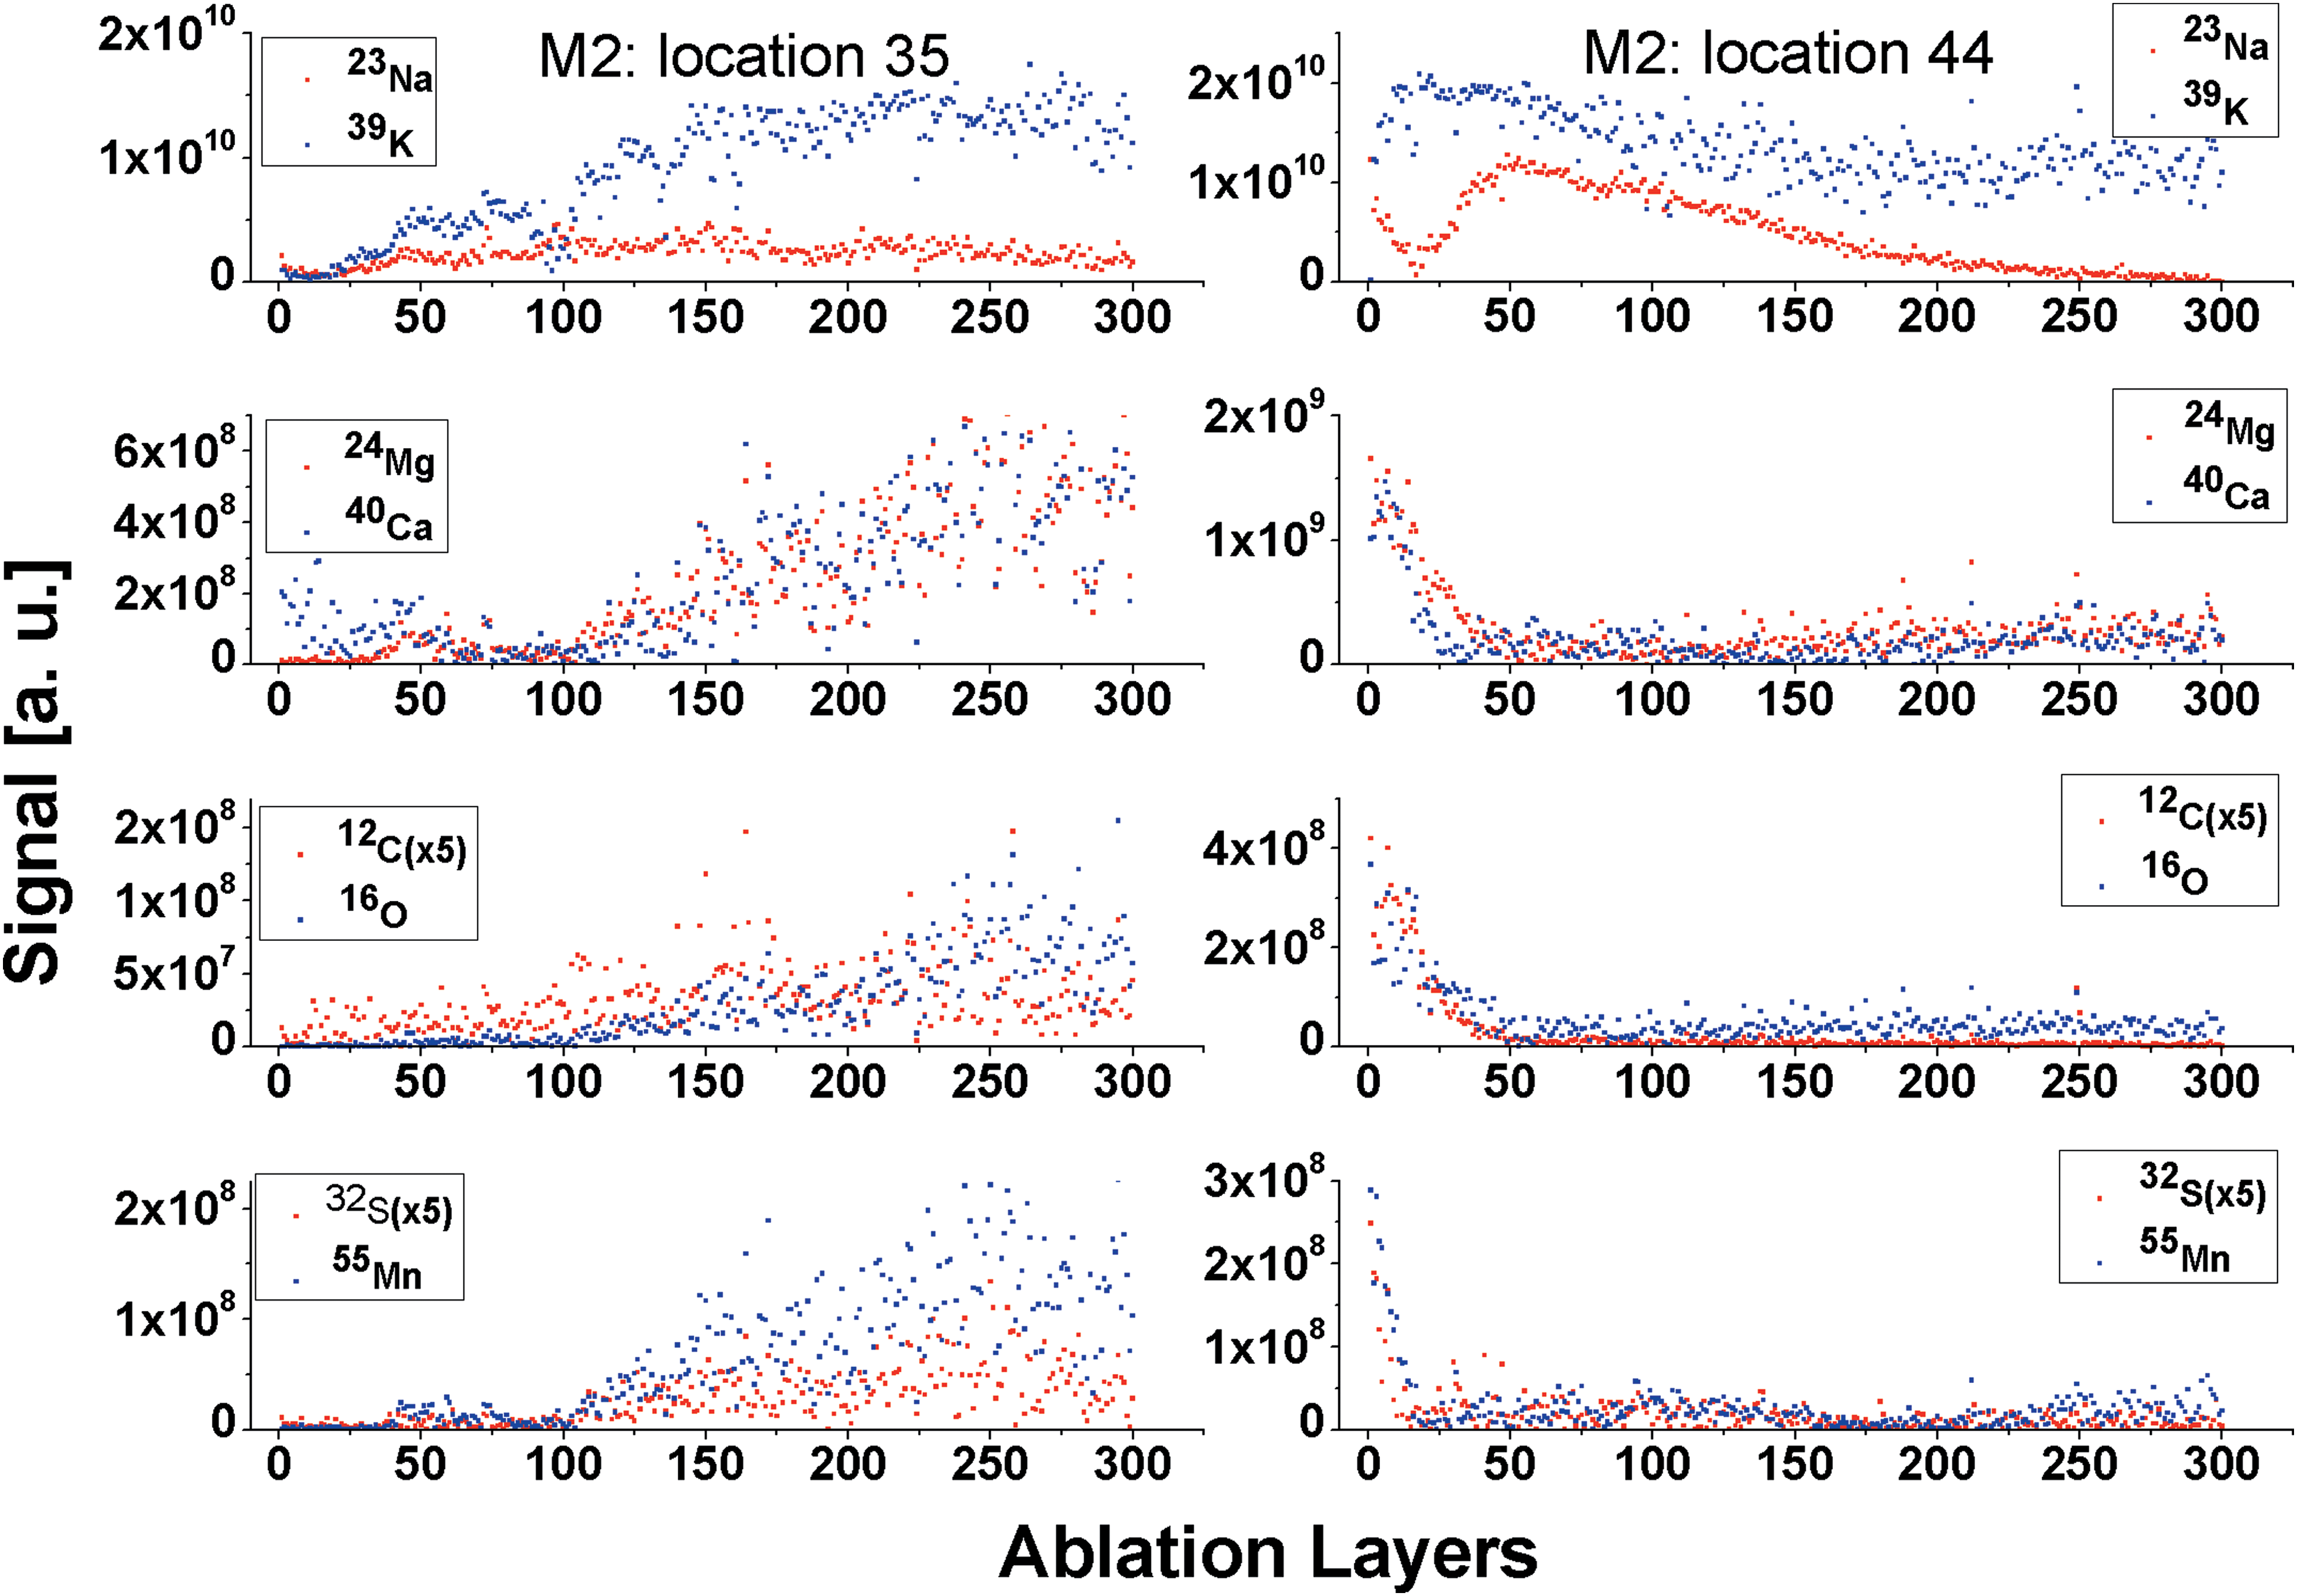
Depth profiling at surface locations 35 (left panel) and 44 (right panel). At location 35, the filament is reached after ablation of some uppermost layers of aragonite surface. At location 44, most of the filament material is located at the first layers. (Color graphics available at
Although the differences in the signal magnitudes of C, O, Mg, Ca, Na, K in the filament and matrix for these main elements are readily observed, their atomic fractions cannot be easily determined in the filament material due to limited lateral resolution of these studies. For the filamentous structures smaller than the laser ablation spot, a contribution of the matrix elements to the measured chemical composition would be expected. Table 1 shows an example of the mass spectrometric analysis of filaments by considering a contribution from the main elements only. The analysis takes into account mass spectra measured on a few filaments in both M1 and M2 campaigns. The atomic fractions of relevant elements are observed to not differ substantially between various filaments investigated in both campaigns. They are also similar to the atomic fractions obtained by summing up the spectra of all filaments measured in M1 and M2 campaigns, respectively (see Table 1). The atomic abundance of the main elements—Na, K, Ca, and Mg—contained in the filaments differs readily from the abundances in the carbonate phase. For the atomic fractions of Na and K, the analysis yields similar values close to 20%. The mass spectrometric analysis indicates also that the filaments are enriched in Na relative to the carbonate phase. Also, the atomic fraction of Mg is determined to be larger in the filaments than in the carbonate phase and is comparable to the Ca atomic fraction (see Fig. 3 and Table 1). Measurement of the filaments yielded values approximately 14 times lower for the atomic fraction of C compared to O. Typically, the C signal is observed to decrease at the filament, while the O signal rises sharply. This is in contrast to the carbonate phase where a substantially larger atomic fraction of C, as compared with that of O, is measured and the signals are observed to be correlated. All these main elements are also the most abundant in the spectra of filaments, and the atomic fraction of all the other elements contained in the filaments is measured to be in the range of 18–33%.
A number of metallic and nonmetallic elements were measured in the filaments, and their signals were well correlated; the rise and decay of the element signals occur almost with the same rate (Fig. 7). Our studies indicate that these elements are redistributed nearly homogeneously within the filament volume. The instrument has the capability to detect and measure the composition of small mineral grains with sizes down to submicrometer, and if present, they would be identified within the volume of the filament by means of correlation and anti-correlation of elements. The atomic fractions of elements determined in the filaments are presented in Table 2. The most abundant elements in the investigated filaments are Mn, Fe, Co, Ni, S, Cl, Al, and N. Also Ti, Cr, and V elements were observed occasionally in a few filaments at the trace level.
The results of isotope analysis of the elements contained in filaments are presented in Tables 3 and 4. The studies show that, for most of the major elements, the isotope analysis can be conducted with a few per mill accuracy and precision if signal-to-noise ratio (SNR) is larger than a hundred and there are no isobaric interferences from clusters and molecules that would otherwise affect this ratio (Riedo et al., 2013b, 2013c). For intense mass peaks of C, O, Na, Mg, K, and Ca, there are signal ringing effects observed that can modify mass peak shape and make the peak integration difficult. These are due to a small impedance mismatch and feedback of the ADC components (saturation effect).
The isotope ratios of B and S are expected to be only little affected by isobaric interference with molecules and clusters, whereas the 37Cl isotope mass peak may interfere with the isobaric C3H carbon radical.
The accuracy of isotope ratio determination for the minor and trace elements is readily limited. For the elements identified in the filaments, possible reasons for lack of required accuracy are identified as follows. In the case of the Li isotopes, the 6Li mass peak overlaps with 12C+2 and the 7Li mass peak with the 14N2+ mass peak. The mass peak of the carbon isotope 13C coincides with the mass peak of the 12CH+ radical, which can readily form in post-ablation plasma. Similarly, the accuracy of the determination of the O isotopes is affected by the presence of the OH radical in addition to possible ringing effects. Moreover, to investigate the O isotope ratios, large SNR is required. Ringing effects induced by the 12C, 23Na, and 39K signals can affect low intense mass peaks of 13C, 24Mg, and 40Ca, respectively. The presence of carbon clusters formed in postplasma chemistry introduces uncertainty in the analysis of several isotopes (e.g., 24Mg mass peak is more intense due to underlying C2 cluster). The analysis of heavier elements and their isotopic composition can be affected by more complex molecules of type H x C y O z , which are readily observed in the HG mass spectra obtained either for aragonite host matrix or filaments. Table 3 summarizes the results obtained in the isotope analysis of main elements. In most cases, the analysis of small isotope peaks is limited by SNR of the investigated mass peaks.
The mass peaks of B and S elements are observed to be only somewhat affected by isobaric mass peaks of clusters and molecules as well as by detection interferences. The isotope ratio analysis for these two elements was conducted for several filaments identified in both the M1 and M2 campaigns, and the results are presented in Table 4. The results show that the isotope ratios of the lighter isotopes are observed to be larger compared to that measured in the relevant standards. Nevertheless, the accuracy of isotope ratio analysis is too low. One of the main reasons is the low SNR because of a relatively low concentration of S element in filaments. Increasing the number of recorded mass spectra of the filaments helps improve the isotope accuracy to some extent. The results from the analysis of the mass spectra obtained by adding all spectra of filaments measured in M1 and M2, respectively, showed some improvements of the isotope ratio accuracy. More accurate results were obtained for B and Cl for the individual filaments when the mass spectrum obtained by summing up all spectra of filaments was analyzed (Table 4).
4. Discussion
The size and morphology of the observed filaments correspond to known filamentous microorganisms, and their occurrence is similar to fossilized endolithic microorganisms from subseafloor basalts (Ivarsson et al., 2008a, 2008b). Proving biogenicity of putative fossilized microorganisms is a complex task that requires detailed morphological and chemical studies (Ivarsson and Holm, 2006), and it is beyond the scope of this report. The reason we chose these samples was that they were appropriate for the aim of the study. The samples represent the rock type, mafic to ultramafic in composition, that dominates on other planets, and they contain defined filamentous structures that correspond to the morphology of known fossilized microorganisms in this type of rocks. The aim is thus to develop a methodology with which to analyze such features in situ, rather than proving their biogenicity at this stage.
In the present study, we applied chemical mapping and depth profiling methods to isolate filamentous microstructures from the matrix in which they are embedded. This procedure allowed highly accurate spatial localization of the filaments and insight into understanding their shape and element redistribution within the filament volume.
Although no biogenicity can be determined from the current isotope analysis, the elemental composition is suggestive of a biological origin. One also has to consider that diagenetic processes during mineralization may influence the abundances of elements in the putative fossil, and this needs to be accounted for (Castanier et al., 1999; Le Metayer-Levrel et al., 1999). Nevertheless, high abundances of several bio-relevant nonmetallic and metallic elements important in metabolic processes within microbiological systems are found in the filaments but not in the host material (Wackett, 2004a, 2004b, 2004c). High abundances of Mn, Co, Fe, and Ni elements are consistent with their possible accumulation due to life processes (Wackett, 2004b; Ehrlich and Newman, 2008; von Blanckenburg et al., 2008; Cameron et al., 2009). The specific element composition of the filaments is not comparable with the mineralogy of the host rock harzburgite and aragonite; thus the elements have been concentrated into the filaments (Tréhu et al., 2003). Organometallic compounds containing, for example, Mn, Fe, Co, Ni, and Se are important intermediates in the microbial metabolic pathways. Also, biologically common alkylated elements were determined and include N, S, O, F, and Cl. B is also thought to be important for appropriate biological functionality, but to date its function is poorly understood (Wackett et al., 2004). B can be of environmental interest. The B isotopic fractionation is observed in the environments with hydrous fluids, melts, and minerals where 11B preferentially partitions into the fluid relative to minerals or melts (Liebscher et al., 2005). The most significant mineral on which boron isotope analysis has been conducted, so far, is tourmaline (Meyer et al., 2008; Bast et al., 2014). The lowest observed δ11B values are of about −30‰ to −50‰ for certain tourmalines and nonmarine evaporates (Chaussidon and Albarede, 1992; Swihart et al., 1986). The most enriched 11B reservoir is given by brines with δ11B values of up to 60‰ (Vengosh et al., 1991). Halogen elements (F, Cl) observed in the filaments can be likely remnants from the salty ocean from which the aragonite mineral was formed. Cl is observed also at trace levels in the aragonite host. Natural isotope variations in Cl isotope ratios are expected due to the mass difference between 35Cl and 37Cl as well as to variations in coordination of Cl in the vapor, aqueous, and solid phases. A natural variation range in Cl isotopic composition is of about 15‰. In subduction zone pore waters, δ37Cl values can be down to 8‰, and in minerals in which Cl substitutes OH, δ37Cl values can reach 7‰ (Ransom et al., 1995). The measurement of S isotopes is an important test of bio-relevant fractionation. Microorganisms are known to fractionate isotopes during sulfur metabolism (dissimilatory sulfate reduction), which produces the largest fractionations in the sulfur cycle. There are also various exchange reactions between sulfate and sulfides that play a role in the isotope differentiation. Wide variations of the δ34S values ranging from −65‰ up to 120‰ have been observed (Seal, 2006; Seal et al., 2000). In the present study, isotope fraction analysis conducted for the filaments was not sufficiently accurate to conclude a possible fractionation of B, S, and Cl, though in all cases a light isotope component was determined to be enriched.
While satisfactory results with the isotope ratio accuracy in the range of per mill can be obtained for several elements with SNR values of isotope mass peaks larger than 100, for lower SNR values the isotope ratio accuracy is less accurate (see Tables 3 and 4). This is consistent with the results obtained during the instrument calibration campaigns (Riedo et al., 2013a, 2013b, 2013c). An increase in the instrument sensitivity is possible such that it would compensate for this effect by fine tuning the laser ablation ion source performance (spot size, laser irradiance) and signal amplification. A coupling with a microscope camera system for on line visualization of the filaments when performing measurements would be helpful for an accurate overlap of the laser spot on the filament (Tulej et al., 2014).
Taking into account that no special arrangement to the setup was made during measurement of micrometer-structures, the obtained results are encouraging. Mass spectrometric investigation of micrometer-sized particles is generally difficult, and typically only advanced laboratory instrumentation can deliver relevant chemical information (Zinner et al., 2011). Our investigation proves high sensitivity in the measurement of elements and isotope ratios. To improve the accuracy of the latter, the sensitivity of measurements has to be increased when such small objects are a subject of investigation.
5. Summary
Analysis of the chemical composition of micrometer-sized filamentous structures embedded in an aragonite host mineral were performed with a laser ablation/ionization mass spectrometer designed for in situ space research. Analyses yielded the element composition of the host material and filaments. The major elements detected in the aragonite mineral were H, C, O, Na, Mg, K, and Ca; and two trace elements, S and Cl, were measured at the few-parts-per-million level. The investigated filaments contain distinct atomic fractions of nonmetallic (Li, B, N, F, P, and S) and metallic (Mn, Fe, Co, Ni) elements in addition to elements that were also detected in the aragonite matrix. It will be more difficult to derive fractions of Ca, Mg, C, and O at the present time because of a possible contribution from the aragonite matrix. Nevertheless, substantial differences between the abundances of these elements in filaments and the aragonite matrix were observed. Traces of Ti, V, Cr, Se, and Sr were also observed, but their atomic fractions could not be determined with high accuracy due to isobaric interferences. The detection of high atomic fractions of bio-relevant elements, including B, S, Mn, Co, Fe, and Se, is considered to be in favor of a bio-origin of the investigated filaments. Enrichment of the light isotope of S was measured for all investigated filaments, but the accuracy of the measurement is presently too low. A few other abundant elements, including B, F, and Cl, were observed in filaments. These can be important in metabolic processes, but they can also be remnants of the ocean where the aragonite mineral was formed. The present study forms the basis for further investigation of these putative fossils by other analytical instrumentation. The laser ablation/ionization mass spectrometer has proved to be highly sensitive and allow for high spatial resolution to deliver sensitive measurements of the element composition of microstructures. Although at present the isotope analysis is not sufficiently accurate, improvements of these measurements can be made by optimizing the laser ablation ion source conditions and instrument sensitivity with the intent to increase the SNR of the detected isotopes. By combining LMS with a microscope-camera system, direct viewing of microstructures will be helpful in optimizing measurement efficiency. Such a suite would also be of considerable interest for in situ investigation of planetary surfaces.
Footnotes
Acknowledgments
This work was supported by the Swiss National Science Foundation Grant No. 200020_153047. We wish to acknowledge Wolfgang Bach at Bremen University for providing the samples. M. Ivarsson is funded by the Swedish Research Council (Contract No. 2012-4364) and Danish National Research Foundation (DNRF53). A. Neubeck is funded by the Swedish National Space Board (Dnr: 100/13) and the Royal Swedish Academy of Sciences.
Author Disclosure Statement
No competing financial interests exist.