




Abstract
Minerals could have played an important role in concentration, protection, and polymerization of biomolecules. Although iron is the fourth most abundant element in Earth's crust, there are few works in the literature that describe the use of iron oxide-hydroxide in prebiotic chemistry experiments. In the present work, the interaction of adenine, thymine, and uracil with ferrihydrite was studied under conditions that resemble those of prebiotic Earth. At acidic pH, anions in artificial seawater decreased the pH at the point of zero charge (pHpzc) of ferrihydrite; and at basic pH, cations increased the pHpzc. The adsorption of nucleic acid bases onto ferrihydrite followed the order adenine >> uracil > thymine. Adenine adsorption peaked at neutral pH; however, for thymine and uracil, adsorption increased with increasing pH. Electrostatic interactions did not appear to play an important role on the adsorption of nucleic acid bases onto ferrihydrite. Adenine adsorption onto ferrihydrite was higher in distilled water compared to artificial seawater. After ferrihydrite was mixed with artificial seawaters or nucleic acid bases, X-ray diffractograms and Fourier transform infrared spectra did not show any change. Surface-enhanced Raman spectroscopy showed that the interaction of adenine with ferrihydrite was not pH-dependent. In contrast, the interactions of thymine and uracil with ferrihydrite were pH-dependent such that, at basic pH, thymine and uracil lay flat on the surface of ferrihydrite, and at acidic pH, thymine and uracil were perpendicular to the surface. Ferrihydrite adsorbed much more adenine than thymine; thus adenine would have been better protected against degradation by hydrolysis or UV radiation on prebiotic Earth. Key Words: Ferrihydrite—Nucleic acid bases—Seawater—Adsorption—Prebiotic chemistry. Astrobiology 15, 728–738.
1. Introduction
I
Iron oxide-hydroxides have been investigated in prebiotic chemistry experiments (Zaia, 2012), including the adsorption of amino acids (Holm et al., 1983; Matrajt and Blanot, 2004; Norén et al., 2008; Vieira et al., 2011; Pandey et al., 2013), adenine (Cohn et al., 2001), nucleotides and polynucleotides (Holm et al., 1993), organic acids (Filius et al., 1997), and aromatic amines (Shanker et al., 2013). In general, adsorption of amino acids by iron oxide-hydroxides can reach up to and exceed 80% (Matrajt and Blanot, 2004; Vieira et al., 2011). Goethite adsorbed much more adenosine and 5'-AMP than akaganéite (Holm et al., 1993). The adsorption of adenine onto magnetite was low when compared to forsterite, pyrrhotite, quartz, and pyrite (Cohn et al., 2001). Iron oxide-hydroxides were also used to catalyze the condensation D/L-glyceraldehyde to ketohexoses (Weber, 1992), and the synthesis of amino acids (Jiang et al., 2013), peptides (Matrajt and Blanot, 2004; Marshall-Bowman et al., 2010; Shanker et al., 2012), and nucleic acid bases (Shanker et al., 2011). It should be noted that when using goethite, akaganéite, and hematite, the formation of dipeptides was observed even at temperatures as low as 50°C (Shanker et al., 2012). Ferrihydrite has a large surface area, which qualifies it as an excellent adsorbent of organic molecules. However, ferrihydrite is a poorly ordered iron oxide whose structure has been the subject of much controversy. Usually, ferrihydrites are characterized as two lines or six lines, due to the number of reflections in the X-ray pattern (Cornell and Schwertmann, 2003).
Minerals and organic molecules coexisted on prebiotic Earth, and their interaction is an important issue for prebiotic chemistry (Schoonen et al. 2004; Zaia, 2012). However, only a few studies have investigated the adsorption of organic molecules by minerals or the effects of such adsorption on both minerals and organic molecules (Zaia, 2012). Additionally, the effect of biomolecules in solution on mineral properties should be addressed in prebiotic chemistry experiments; for example, the dissolution of Na-montmorillonite was reduced in the presence of Gly, α-Ala, and β-Ala, as was that of amorphous silica in the presence of Ala, Cys, Asn, Ser, Trp, and Thr (Kawano and Obokata, 2007; Kawano et al., 2009; Farias et al., 2014). On the other hand, the dissolution of amorphous silica was enhanced by His, Arg, and Lys (Kawano and Obokata, 2007; Kawano et al., 2009). Adenine exhibited a protective effect on zeolites; however, thymine enhanced zeolite dissolution (Baú et al., 2012). Thus, the adsorption of organic molecules (mostly, amino acids and nucleic acid bases) onto minerals should be analyzed by different techniques to assess the changes that have occurred. Minerals also have an effect on organic molecules. Strašák (1991) reported the formation of hypoxantine after adenine was adsorbed onto Cu-montmorillonite, and Carneiro et al. (2011) reported that Fe2+ decreased or even vanished after nucleic acid bases were adsorbed onto montmorillonite. When minerals interact with organic molecules, chemical reactions could occur, and they could be misinterpreted as adsorption. Indeed, because of interaction with minerals, a new organic compound could be formed (Strašák, 1991).
As reviewed by Zaia (2012), prebiotic chemistry experiments of adsorption of biomolecules onto minerals have been typically performed in solutions of distilled water or sodium chloride, which are probably not representative of seawater of prebiotic Earth. Because the concentration of salts in seawater could range from 2.5% to 4.0%, our group has been working with artificial seawater (Brown et al., 2004) that is an average of the composition of the major elements of seawater of today (see the review, Zaia, 2012; Anizelli et al., 2014, 2015; Farias et al., 2014). Winter and Zubay (1995) also used artificial seawater to study the adsorption of adenine, 5'-ATP, 5'-ADP, and 5'-AMP on montmorillonite. However, this seawater did not contain Ca2+, and the concentration of Mg2+ was lower than the concentration of Na+. Therefore, these artificial seawaters were not likely representative of that of prebiotic Earth. Based on the work of Izawa et al. (2010), artificial seawater that could be more representative of Earth's prebiotic seas was suggested by Zaia (2012). Specifically, Izawa et al. (2010) performed sequential leaching experiments of the Tagish Lake meteorite, which showed the following order for the cations: Mg2+ > Ca2+ >> Na+ ≈ K+ and for the anions
The aim of this work was to compare the effect of distilled water, different artificial seawaters, and pH on the adsorption of adenine, thymine, and uracil (Fig. 1) onto ferrihydrite. A study of the interaction between nucleic acid bases and ferrihydrite in different pHs was performed. Also studied was the effect of pH, nucleic acid bases, and artificial seawater on the dissolution of ferrihydrite. The effect of artificial seawater, pH, and nucleic acid bases on the pH at the point of zero charge (pHpzc) of the samples of ferrihydrite was also measured.

Molecular structures of nucleic acid bases studied in this work.
2. Materials and Methods
2.1. Materials
2.1.1. Ferrihydrite
Ferrihydrite (two lines) was synthesized as described by Schwertmann and Cornell (1991). Fe(NO3)3 · 3H2O (8.0 g) was added to a plastic container with a 450 mL capacity and containing 100 mL of distilled water, preheated to 75°C. While keeping the temperature at 75°C and stirring, approximately 66 mL of hydroxide potassium (1.0 mol L−1) was added slowly, and at a steady flow, during a 1 h period. During the synthesis, the pH of the solution was kept at 7.5. After synthesis, the material was filtered on a vacuum system with a Kitassato flask and Buchner funnel and low-porosity filter (8 μm pores). Then the material was washed with distilled water in order to remove nitrate. The material was lyophilized and stored in a dark flask.
2.1.2. Nucleic acid bases
All reagents were of analytical grade, and all nucleic acid bases (Fig. 1) were purchased from Acros Organics (USA) and used as received.
2.1.3. Artificial seawater
Artificial seawater of today (AST) was prepared as suggested by Brown et al. (2004). Based on the work of Izawa et al. (2010), Zaia (2012) suggested artificial seawater 4.0 Ga (AS-4.0 Ga) (Table 1). Both seawaters were described by Zaia (2012).
Billion years ago. bEach salt should be added in the order that they are shown (Zaia, 2012).
2.1.4. Silver citrate colloid
Silver citrate colloid was used for surface-enhanced Raman (SER) spectroscopy. It was prepared as described by Lee and Meisel (1982). Silver nitrate (90 mg) was added to an Erlenmyer flask (wrapped with aluminum foil) with 500 mL of distilled water and heated to boiling. While stirring vigorously, 10 mL of 1 wt % sodium citrate solution was added, dropwise, to the distilled water, and heated for a subsequent 40 min. It was stirred for 90 min. After the solution reached room temperature, the solution volume was returned to 500 mL by adding distilled water, and it was stored in the refrigerator.
2.1.5. Sample preparation
The solutions of adenine, thymine, and uracil were dissolved in distilled water or in artificial seawaters (AST and AS-4.0 Ga) at a concentration of 720 μg mL−1. For each sample, 100 mg of ferrihydrite was placed in a separate Eppendorf tube (2.0 mL) containing either (a) 1.8 mL of distilled water, AST, or AS-4.0 Ga or (b) 1.8 mL of distilled water, AST, or AS-4.0 Ga with 720 μg mL−1 of adenine, thymine, or uracil. For each set of samples, the pHs were adjusted to 3.00, 7.20, or 10.0 with HCl (1.0 mol L−1) or NaOH (1.0 mol L−1). The tubes were shaken for 24 h. Then the pH of the solution in each tube was measured, and the ranges of pH were added to Tables 2 –5. The solid precipitate was lyophilized and analyzed with Fourier transform infrared (FT-IR) spectroscopy, SER spectroscopy, and X-ray diffractometry. For samples spiked with nucleic acids, the overlying aqueous phase was decanted, and nucleic acid concentration was measured (see below).
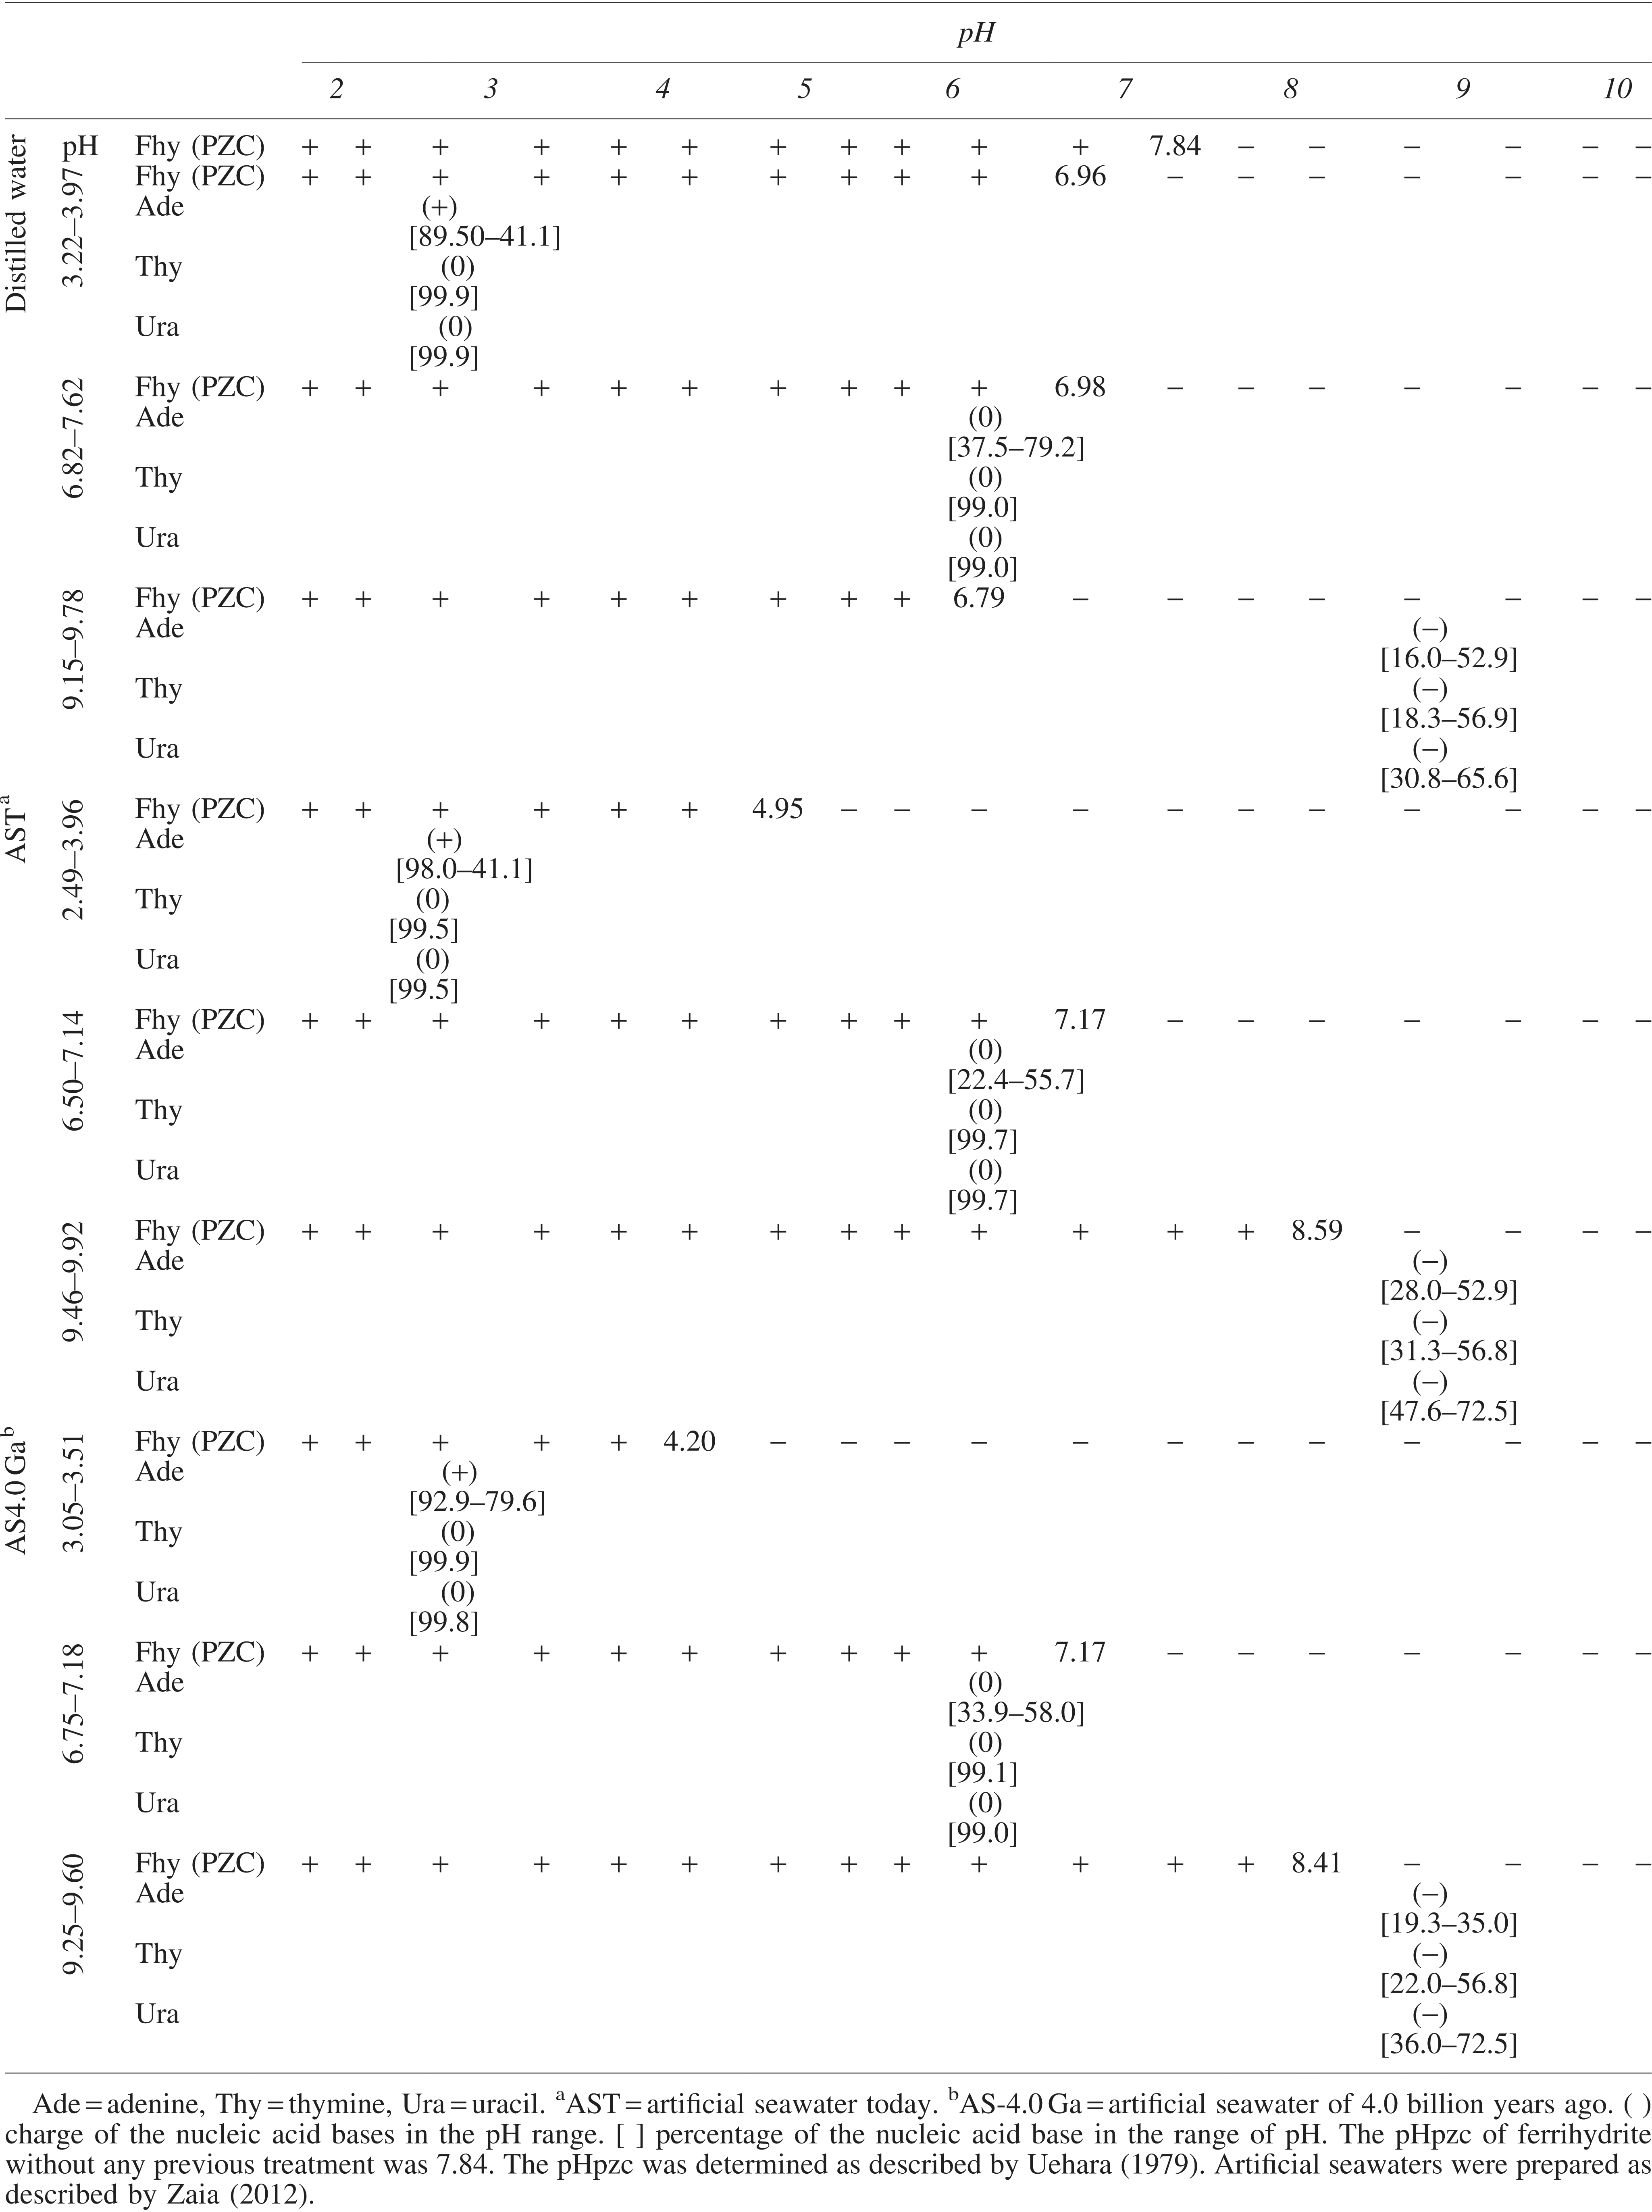
pH = pH range. bAST = artificial seawater with ions of similar composition to today's seawater. cAS-4.0 Ga = artificial seawater with the composition of ions as at 4.0 billion years ago. The pHpzc of ferrihydrite without any previous treatment was 7.84. The pHpzc was determined as described by Uehara (1979). Artificial seawaters were prepared as described by Zaia (2012).
pH = pH range. bAST = artificial seawater with ions of similar composition to today's seawater. cAS-4.0 Ga = artificial seawater with the composition of ions as at 4.0 billion years ago. Artificial seawaters were prepared as described by Zaia (2012). NA = no adsorption.
The results are presented as mean ± standard error of the mean. The numbers in parentheses indicate the number of repetitions. To all samples was added 1.80 mL of nucleic acid base (720 mg mL−1) dissolved in distilled water or artificial seawater plus 100 mg of ferrihydrite. For all rows, means with different lowercase letters were statistically different from each other by Tukey test (p < 0.05). For all columns at same pH, means with different capital letters were statistically different from each other by Tukey test (p < 0.05). For all columns effect of pH at the same solvent, means with Greek letters were statistically different from each other by Tukey (p < 0.05).
Adenine/Thymine ratios of the present work. bAdenine/Thymine ratios obtained by several authors. cAdenine/Thymine ratios of several organisms (Lehninger, 1984). dAST = artificial seawater with the similar composition of ions today. eAS-4.0 Ga = artificial seawater with the composition of ions as at 4.0 billion years ago. Artificial seawaters were prepared as described by Zaia (2012).
2.2. Methods
2.2.1. Determination of pHpzc
One hundred milligrams of ferrihydrite was placed into each of two Eppendorf tubes, 250 μL of distilled water was added to one of the tubes, and 250 μL of KCl solution (1.0 mol L−1) was added to the other. The samples were shaken for 30 min and incubated at room temperature for 24 h. Then the pH was measured. The pHpzc was calculated by using the equation pHpzc = 2 pH (1.0 mol KCl L−1) − pH (distilled water) (Uehara, 1979).
2.2.2. Fourier transform infrared spectroscopy
The IR spectra were recorded with a Shimadzu 8300 FT-IR spectrophotometer. KBr disc pellets were prepared, and spectra were recorded from 400 to 4000 cm−1 with a resolution of 4 cm−1 after 98 scans. FT-IR spectra were analyzed with the Origin program (8.0, 2007).
2.2.3. Surface-enhanced Raman spectroscopy
Surface-enhanced Raman spectra were obtained using a DeltaNu Raman spectrometer with a 532 nm laser with 28.6 mW of power and a spectral resolution of 8 cm−1. Each spectrum was obtained after acquiring 10 spectra. DeltaNu's software was used to remove background fluorescence by using baseline features. Silver citrate colloid was used to obtain the SER effect; approximately 20 mg of solid sample (nucleic acid bases, ferrihydrite, ferrihydrite onto which nucleic acid bases were adsorbed) plus 50 μL of colloid were placed on a microscope slide for SER analysis. SER spectra were analyzed with Origin software (5.0, 2001).
2.2.4. Ultraviolet spectrophotometric method
Absorbance was measured with a Shimadzu UV–vis spectrophotometer. Adenine, thymine, and uracil concentrations were determined by reading the absorbance in the UV region (259–265 nm). The following equation was used for the calculation of the amount of base adsorbed on ferrihydrite.
where C is the concentration of the nucleic acid and Abs is the absorbance at 259–265 nm.
2.2.5. X-ray diffractometry
Ferrihydrite samples were analyzed by powder X-ray diffraction with a Shimadzu D 6000 diffractometer, Cu Kα radiation (40 kV, 30 mA), and an iron filter in a step-scanning mode (0.02°2θ/0.6 s). All peak positions were analyzed with Grams 8.0 software.
2.2.6. Statistical analysis
A Tukey test was used to compare means at a significance level of p < 0.05.
3. Results
3.1. Characterization of materials
3.1.1. pH at the point of zero charge
The pHpzc of ferrihydrite without any previous treatment was 7.84 (Table 2). A decrease in pHpzc was observed after ferrihydrite was mixed with distilled water and distilled water plus nucleic acid bases (Fig. 1) at several ranges of pH (Table 2). When ferrihydrite was mixed with AST and AS-4.0 Ga, the pHpzc was within the range of pH at neutral pH, but the pHpzc value was above the range of pH in acidic artificial seawater and below this range in basic artificial seawater (Table 2). In general, the same trend was observed when ferrihydrite was mixed with artificial seawater amended with nucleic acids (Table 2). It should be noted that the adsorption of adenine onto ferrihydrite was much higher than thymine and uracil (Table 3). For all samples of ferrihydrite plus artificial seawaters with and without nucleic acid bases, the pHpzc was in the range from 3.15 to 9.29 (Table 2).
3.1.2. X-ray diffractometry and FT-IR spectroscopy
X-ray diffractograms of ferrihydrite without any previous treatment exhibited two peaks (Fig. 2), which are typical of ferrihydrite two lines (Cornell and Schwertmann, 2003). The diffractograms did not show any change when ferrihydrite was mixed with distilled water plus adenine (Fig. 2) nor when mixed with distilled water or artificial seawater or in solutions containing nucleic acid bases (data not shown).
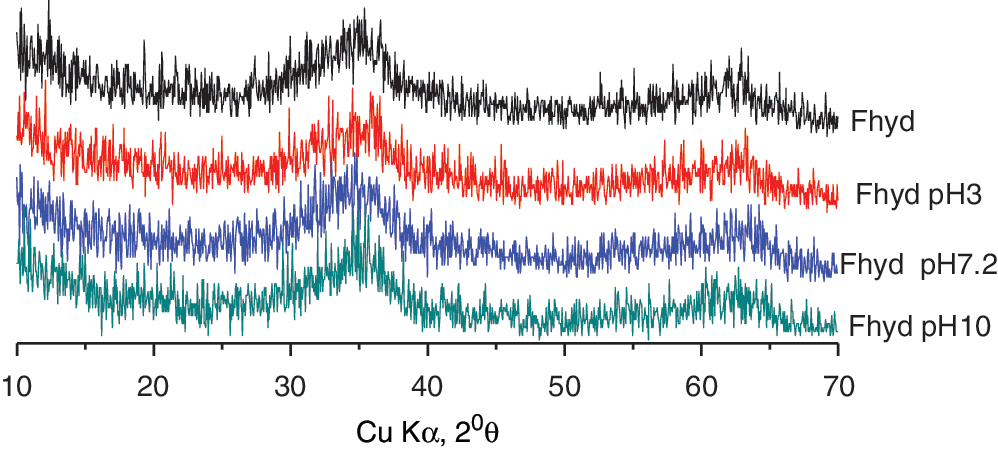
X-ray diffraction patterns for ferrihydrite without any previous treatment (Fhyd), ferrihydrite plus adenine in distilled water at pH 3.00 (Fhyd pH 3), ferrihydrite plus adenine in distilled water at pH 7.20 (Fhyd pH 7.2), and ferrihydrite plus adenine in distilled water at pH 10.0 (Fhyd pH 10). (Color graphics available at
Fourier transform infrared spectra show that sulfate was adsorbed onto ferrihydrite (data not shown). It should be noted that both artificial seawaters contain sulfate (Table 1). However, FT-IR spectra do not show any evidence that nucleic acid bases were adsorbed onto ferrihydrite or that artificial seawater had an effect on ferrihydrite absorption.
3.1.3. Surface-enhanced Raman spectroscopy
Because FT-IR spectra do not show any bands belonging to nucleic acid bases, SER spectroscopy was used to enhance the adsorption signal. However, SER spectroscopy could only be used for samples in distilled water (Figs. 3 –5) because the salts in artificial seawater enhance several bands of citrate (Nascimento et al. 2014).
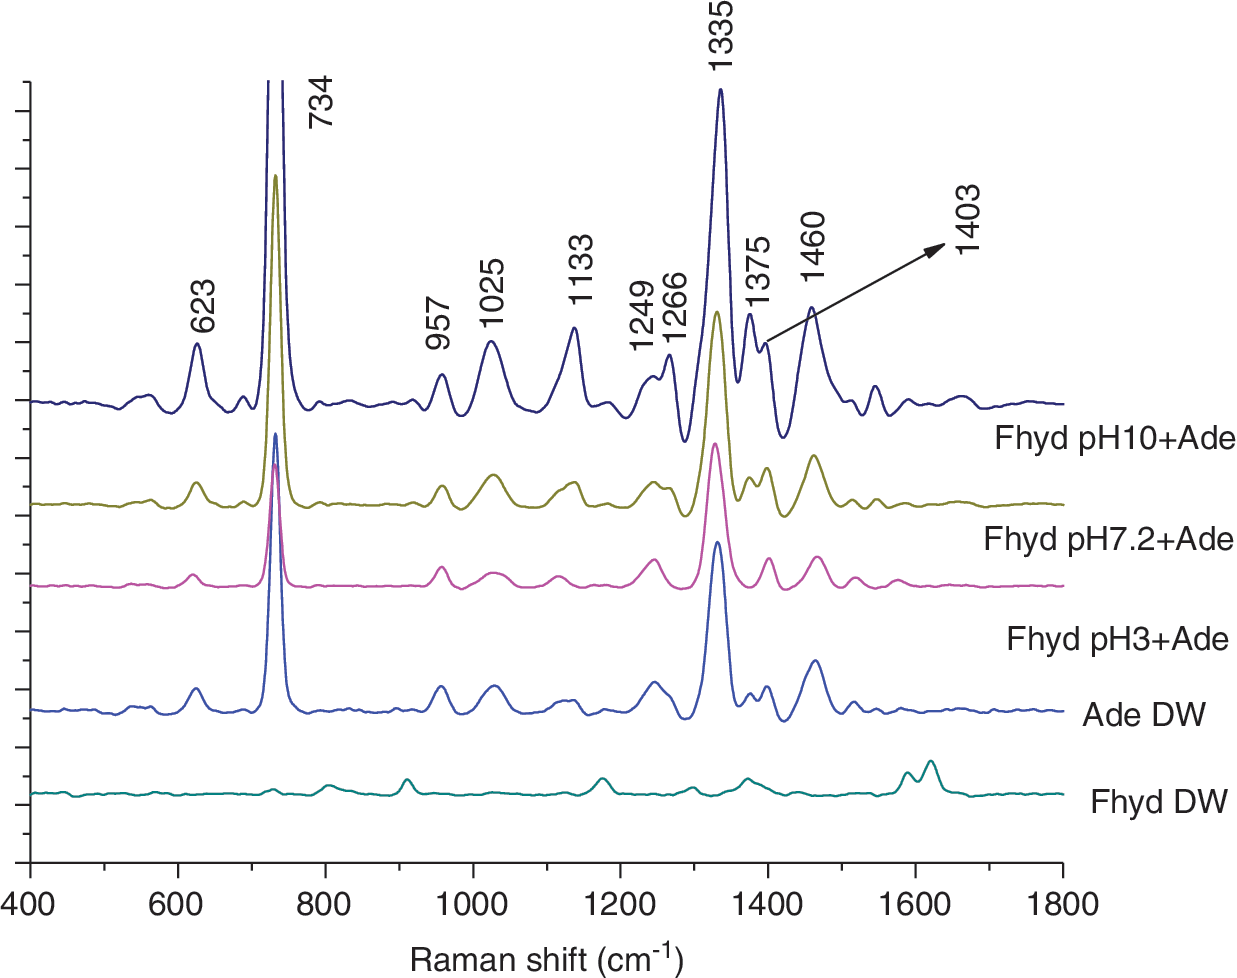
Surface-enhanced Raman spectra of ferrihydrite in distilled water (Fhyd DW), adenine in distilled water (Ade DW), ferrihydrite in distilled water pH 3.00 plus adenine (Fhyd pH3+Ade), ferrihydrite in distilled water pH 7.20 plus adenine (Fhyd pH7.2+Ade), and ferrihydrite in distilled water pH 10.0 plus adenine (Fhyd pH10 + Ade). For all samples, in microscope slide was added 20 mg of each solid plus 50 μL of silver citrate colloid. (Color graphics available at
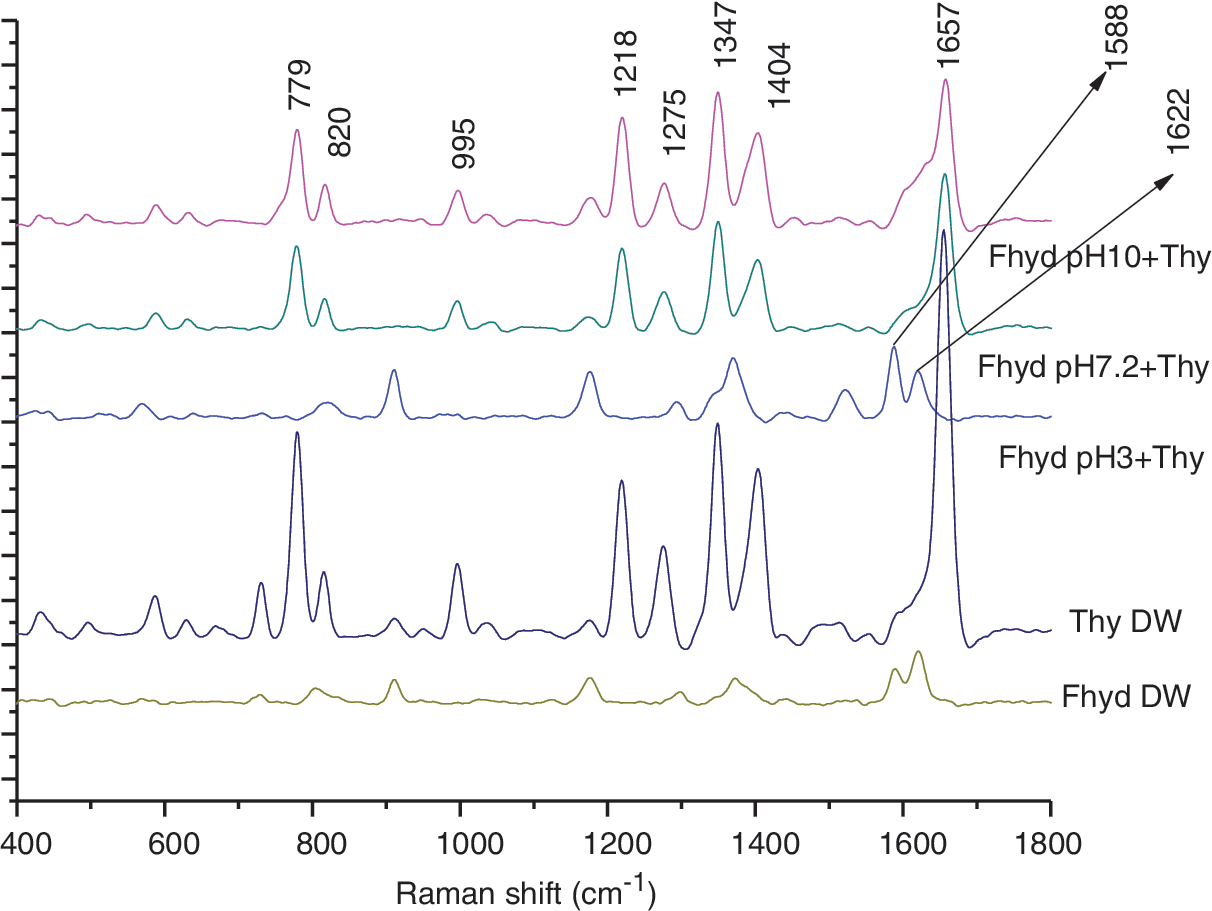
Surface-enhanced Raman spectra of ferrihydrite in distilled water (Fhyd DW), thymine in distilled water (Thy DW), ferrihydrite in distilled water pH 3.00 plus thymine (Fhyd pH3+Thy), ferrihydrite in distilled water pH 7.20 plus thymine (Fhyd pH7.2+Thy), and ferrihydrite in distilled water pH 10.0 plus thymine (Fhyd pH10+Thy). For all samples, in microscope slide was added 20 mg of each solid plus 50 μL of silver citrate colloid. (Color graphics available at
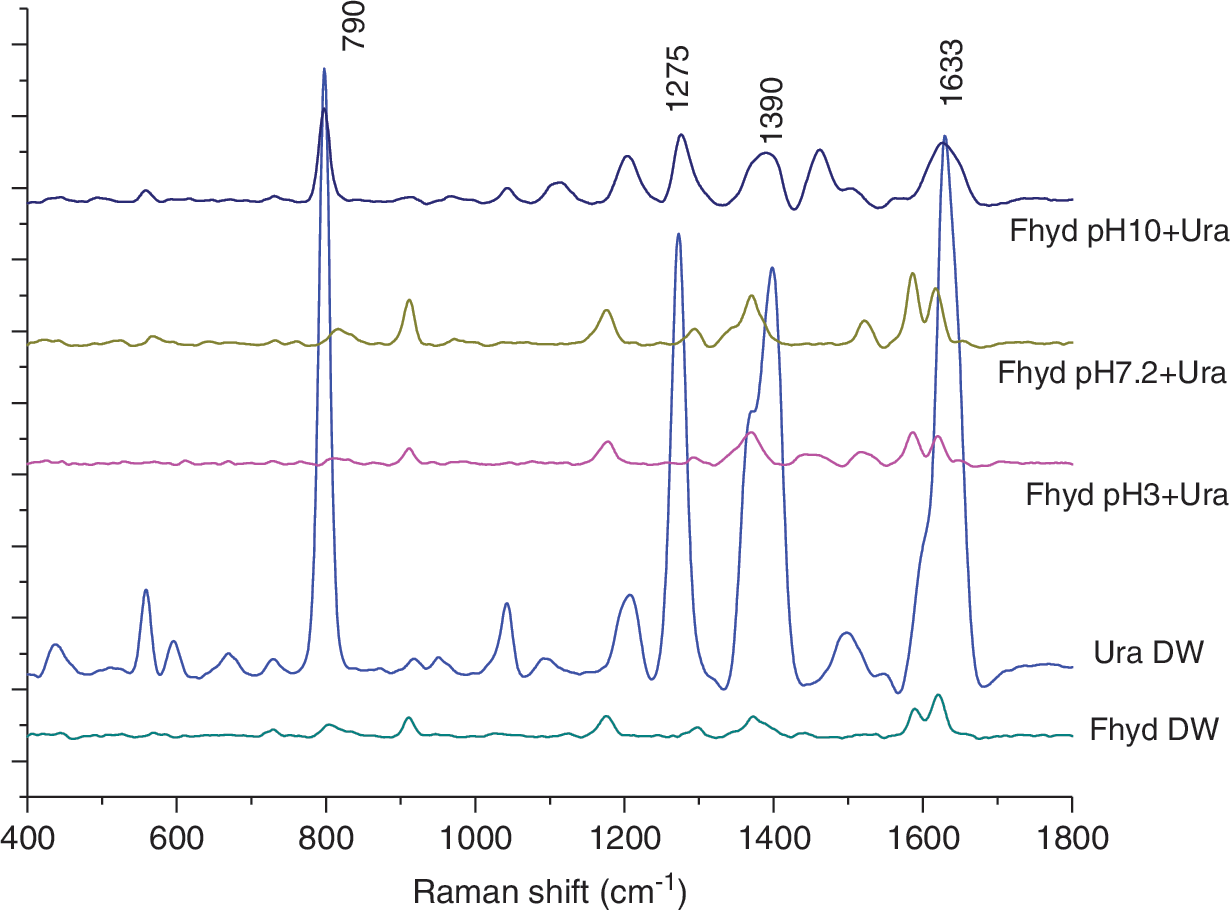
Surface-enhanced Raman spectra of ferrihydrite in distilled water (Fhyd DW), uracil in distilled water (Ura DW), ferrihydrite in distilled water pH 3.00 plus uracil (Fhyd pH3+Ura), ferrihydrite in distilled water pH 7.20 plus uracil (Fhyd pH7.2 + Ura), and ferrihydrite in distilled water pH 10.0 plus uracil (Fhyd pH10 + Ura). For all samples, in microscope slide was added 20 mg of each solid plus 50 μL of silver citrate colloid. (Color graphics available at
After adenine was adsorbed onto ferrihydrite, the solid was separated from the aqueous solution. The SER spectra of these samples were not different from the SER spectrum of adenine alone (Fig. 3). This result confirmed that adenine was adsorbed onto ferrihydrite (Table 3). After silver citrate colloid was added to the solid ferrihydrite, adenine interacted with the Ag colloid, as indicated by the appearance of several bands from adenine in the SER spectra (Fig. 3). Each band could be a contribution of several vibrational modes of adenine, such as 623 cm−1 (deformation C4-C5-C6, N1-C6-N10), 734 cm−1 (ring breathing), 957 cm−1 (deformation N7-C8-N9), 1025 cm−1 (rocking NH2), 1133 cm−1 (stretching C9-N9, bending N9-H, C8-H), 1249 cm−1 (rocking NH2, stretching C5-N7, N1-C2, C2-N3), 1266 cm−1 (shoulder, bending C8-H, N9-H, stretching N7-C8), 1335 cm−1 (stretching C5-N7, N1-C2 and bending C2-H, C8-H), 1375 cm−1 (bending C2-H, N9-H, stretching C8-N9, C4-N9) 1403 cm−1 (stretching C4-N9, C4-C5, C6-N10, N7-C8, bending C2-H), and 1460 cm−1 (stretching N7-C8, bending C8-H, scissoring NH2) (Giese and McNaughton, 2002).
In general, the SER spectra of thymine mixed with ferrihydrite at pH 7.2 and 10.0 are not different from the SER spectrum of thymine alone (Fig. 4); and similarly to the experiment with adenine, after adding Ag colloid to the solid ferrihydrite, thymine interacted with the Ag colloid. In contrast, the SER spectrum of thymine mixed with ferrihydrite at pH 3.0 is very different from the other SER spectra (Fig. 4). The results also suggest that thymine was adsorbed by ferrihydrite, as confirmed by adsorption experiments (Table 3). According to Zhang et al. (2010), the bands at 779, 995, 1218, 1347, 1404, and 1657 cm−1 could be attributed to wagging C6-H, ring breathing and asymmetric stretching CH3, stretching -CN, bending N-H and C-H, deformation -N-H, and stretching C = O and asymmetric bending of N-H/C-H, respectively (Fig. 4). For the sample at pH 3.0, instead of an enhancement of a single band at 1657 cm−1, two bands at 1588 and 1622 cm−1 are enhanced, supporting the conclusion that both C = O groups of thymine (Fig. 1) interacted with the Ag colloid (Fig. 4). Similarly, uracil adsorbed onto ferrihydrite at pH 3.0 and 7.2 showed similar bands (Fig. 5). Additional bands arising from the adsorption of thymine onto ferrihydrite at pH 3.0 are not enhanced, indicating that thymine was not interacting with the Ag colloid through those groups (Fig. 4).
In general, the SER spectrum of uracil adsorbed onto ferrihydrite at pH 10 is similar to the SER spectrum of uracil alone; however, the SER spectra of uracil adsorbed onto ferrihydrite at pH 3.0 and 7.2 are notably different (Fig. 5). At basic pH, a band in the region of 1633 cm−1 due to C = O stretching is enhanced. At acidic and neutral pH, the band at 790 cm−1 is not enhanced; instead, two bands belonging to both C = O groups of uracil appeared in the spectra (Fig. 5).
3.2. Adsorption
In general, the adsorption of nucleic acid bases onto ferrihydrite followed the order adenine >> uracil > thymine (Table 3, p < 0.05). Adenine adsorption was also higher than that of uracil or thymine onto clays (Lailach et al., 1968a, 1968b; Lailach and Brindley, 1969; Winter and Zubay, 1995; Perezgasga et al., 2005; Benetoli et al., 2008; Hashizume et al., 2010; Carneiro et al., 2011), rutile (Cleaves et al., 2010), and zeolites (Baú et al., 2012; Anizelli et al., 2015).
The adsorption of adenine onto ferrihydrite increased when the pH increased from 3.0 to 7.0 and decreased at pH 10.0 (p < 0.05, Table 3). These results can be explained considering the charge of ferrihydrite and the relative amount of adenine molecules with positive or negative charges (Table 4). At acidic pH, 41.1–98.0% of adenine molecules were positively charged, and ferrihydrite was also positively charged. At neutral pH ranges, 22.4–79.2% of adenine molecules were neutral, and ferrihydrite was either positively or negatively charged. Finally, at basic pH, 16.0–52.9% of adenine molecules were negatively charged, and ferrihydrite was also negatively charged (Table 4).
In general, in solutions of distilled water or AST, the adsorption of thymine and uracil increased as pH was increased (Table 3, p < 0.05). At basic pH, 18.3–72.5% of the nucleic acid bases were negatively charged, and ferrihydrites were also negatively charged (Table 4). However, when dissolved in AS-4.0 Ga, decreased adsorption of uracil and thymine was observed when pH increased from 3.0 to 7.0, and adsorption increased at pH 10.0 (Table 3, p < 0.05).
The adsorption of adenine onto ferrihydrite was highest in distilled water, followed by AST, and then AS-4.0 GA (Table 3, p < 0.05). However, artificial seawater did not strongly influence the adsorption of thymine or uracil onto ferrihydrite (Table 3).
3.3. Adenine/thymine ratios
Adenine/thymine ratios ranged from 4.75 to 31.7, indicating that ferrihydrite preferentially adsorbed adenine over thymine (Table 5), which is similar to most minerals (Zaia, 2004, 2012).
4. Discussion
4.1. Characterization of materials
4.1.1. pH at the point of zero charge
The pHpzc of ferrihydrite is in good agreement with previous reports (Davis and Leckie, 1978; Schwertmann and Fechter, 1982), and the pHpzc of samples in distilled water were in the range reported for untreated ferrihydrite (5.3–8.0; Davis and Leckie, 1978; Schwertmann and Fechter, 1982). Thus, in this case, pH and the presence of nucleic acid bases appear to have no effect on pHpzc.
The wide range of pHpzc observed for the samples with artificial seawater was due to the cations and anions (Table 2). FT-IR spectra of the samples of ferrihydrite mixed with artificial seawater show characteristic bands of sulfate. Thus, under acidic conditions, anions in artificial seawater (e.g., Cl-,
Given the decrease or increase of pHpzc of ferrihydrite in artificial seawater, cations or anions could have played an important role in the adsorption of organic molecules in hydrothermal environments. The pH of the fluid in black smoker systems can be very acidic (Martin et al., 2008); therefore, ferrihydrite could adsorb negatively charged organic molecules, and they could be protected against degradation. On the other hand, in hydrothermal environments with basic fluids, such as the Lost City hydrothermal fields (Martin et al., 2008), ferrihydrite could adsorb, and it could protect positively charged organic molecules. However, in acidic pH, even ferrihydrite that was positively charged (Tables 2 and 4) adsorbed positively charged adenine (Tables 3 and 4). Thus, in the case of ferrihydrite, other forces should be taken into account.
4.1.2. X-ray diffractometry and FT-IR spectroscopy
Prebiotic chemistry experiments should monitor the effect of experimental conditions on mineral properties (Zaia, 2012) because the interaction of salts from seawater or organic molecules with minerals can precipitate new phases or even dissolve them (Kawano and Obokata, 2007; Kawano et al. 2009; Baú et al., 2012; Farias et al., 2014). In the current study, the data from X-ray diffractometry and FT-IR spectroscopy did not show alteration of ferrihydrite. However, FT-IR spectroscopy showed that the characteristic band belongs to sulfate (figure not shown). Thus, the nucleic acid bases did not alter the mineral properties of ferrihydrite, and interactions between them likely involve adsorption.
4.1.3. Surface-enhanced Raman spectroscopy
There are several works showing that adenine interacts with clays, zeolites, and metals through the NH2 group (Chen et al. 2002; Yamada et al., 2004; Furukawa et al., 2007; Benetoli et al., 2008; Carneiro et al., 2011; Baú et al., 2012). However, in this case, because in the SER spectrum of adenine alone as well as the SER spectra of adenine adsorbed onto ferrihydrite the same bands are enhanced, it is difficult to say which group of the adenine is interacting with ferrihydrite.
The interaction of thymine with ferrihydrite or Ag colloid is pH-dependent, since at pH 7.2 and 10 thymine interacted with the Ag colloid through C = O and at pH 3.0 with both C = O groups of thymine. Therefore, based on the conclusions of Oh et al. (1988), using uracil as a model for the interaction of thymine with an Ag colloid, we suggest that thymine lies flat on the surface of the Ag colloid or ferrihydrite at neutral and basic pH but lies perpendicular at acidic pH.
According to Oh et al. (1988), at basic pH, uracil is deprotonated and lies flat on the surface of the Ag colloid. Therefore, we suggest that at basic pH, uracil lay flat on the surface of the Ag colloid or ferrihydrite; and at acidic and neutral pH, uracil was perpendicular to the surface. Oh et al. (1988) also observed the band at 790 cm−1 due to ring breathing of uracil. For thymine, at basic pH, Oh et al. (1988) also observed a band in the region of 1633 cm−1 caused by C = O stretching.
It should also be pointed out that cations in artificial seawater can form complexes with nucleic acids, but they cannot degrade them (Anizelli et al., 2014). This result is important for prebiotic chemistry because it suggests that nucleic acid bases were not degraded by ferrihydrite. Instead, they could have been protected against degradation and thus participated in the process of molecular evolution, providing a simple pre-RNA amino acid discrimination mechanism, for example (Sowerby et al., 2002).
4.2. Adsorption
The high adsorption of adenine when compared to thymine and uracil usually is explained due to electrostatic forces between the negatively charged mineral and positively charged adenine. However, adenine adsorption onto ferrihydrite occurred both at acidic pH, when both adenine and ferrihydrite were positively charged, and at basic pH, when both were negatively charged (Tables 3 and 4). Therefore, electrostatic forces cannot uniformly account for the adsorption of adenine onto ferrihydrite. It should be pointed out that the highest adsorption of adenine onto ferrihydrite occurred at neutral pH when the electrostatic repulsion was the lowest. Hashizume and Theng (2007) similarly examined the effect of pH on the adsorption of adenine onto allophone. One explanation for this order of adsorption is that it is the inverse order of solubility of these bases in distilled water (25°C): thymine (2.78 ± 0.06 × 10⁻² mol L−1) > uracil (2.38 ± 0.02 × 10⁻² mol L−1) >> adenine (0.704 ± 0.008 × 10⁻² mol L−1) (Herskovits and Harrington, 1972). Another explanation would be that Fe3+ is a hard acid, and the R-NH2 group of adenine is a harder base than the C = O group of uracil and thymine. Therefore, the interaction between adenine and ferrihydrite should be stronger than that of uracil or thymine and ferrihydrite (Pearson, 1963; Lemire et al., 2013).
When thymine and uracil were dissolved in distilled water or AST, the adsorption increased as the pH increased. Thus, at basic pH, the interaction of these nucleic acid bases with ferrihydrite overcame the electrostatic repulsion (Table 4). However, when dissolved in AS-4.0 Ga, a different pattern was observed. In this case, at basic pH, thymine and uracil (negatively charged, Table 4) probably formed complexes with Ca and Mg (Hashizume et al., 2010; Anizelli et al., 2014), facilitating the adsorption of these nucleic bases onto ferrihydrite (negatively charged, Table 4). This result shows that seawater pH has an effect on the adsorption of nucleic acid bases onto ferrihydrite. As such, the composition of seawater could have played an important role in the adsorption of biomolecules on prebiotic Earth.
Adsorption of adenine decreased in the presence of artificial seawater, while the adsorption of thymine and uracil was not affected. Winter and Zubay (1995) also observed decreased adsorption of adenine onto montmorillonite in artificial seawater compared to a buffer solution. This may mean that adenine and salts from seawater are competing for the same adsorption sites of the ferrihydrite.
4.3. Adenine/thymine ratios
The high adsorption of adenine onto minerals when compared to thymine could have significant implications for our understanding of prebiotic chemistry. For example, when adsorbed onto ferrihydrite, adenine would be preferentially protected against degradation by hydrolysis or UV radiation. Biondi et al. (2007) studied the effect of UV radiation on samples of RNA adsorbed onto montmorillonite. According to them, these molecules were protected more against UV radiation by a factor of 3 when adsorbed onto montmorillonite than when not adsorbed. Kranksith et al. (2010) observed high recovery of amino acids (Asp, Glu, Trp) adsorbed onto Na+-montmorillonite after the material was irradiated with γ-radiation. Andersson and Holm (2000) observed that, under hydrothermal conditions, decomposition of amino acids (Asp, Ser, Leu, Ala) was lower when in the presence of minerals than when not. Because the adenine/thymine ratios in living beings are close to 1.0 (Table 5), both nucleic acid bases were likely necessary for molecular evolution. Therefore, minerals that adsorb organic molecules irrespective of their charge (e.g., zeolites, Table 5) were likely more important for prebiotic chemical reactions.
5. Geochemical and Prebiotic Chemistry Significance of This Work
Because the major ions included in the artificial seawater used in this work (AS-4.0 Ga) probably reflect the composition of seawater from 3.7 to 4.2 billion years ago, before life arose on Earth, this study provides a novel point of view for interpreting geochemical reactions on prebiotic Earth. The effect of cations and anions in seawater on the pHpzc of ferrihydrite provides the mineral with versatility to protect organic molecules against degradation in different hydrothermal environments. Ferrihydrite was not affected by the presence of nucleic acid bases, artificial seawater, or changes in pH; it could thus be an excellent model with which to study adsorption of biomolecules in environments that simulate prebiotic Earth. Also, nucleic acid bases were not decomposed by ferrihydrite; thus they could be protected for the next step of molecular evolution, such as the pre-RNA amino acid discrimination mechanism suggested by Sowerby et al. (2002). Although the salts of the artificial seawater decreased the adsorption of adenine, this effect was much higher in experiments performed with montmorillonite (Winter and Zubay, 1995). It should also be pointed out that the adsorption of thymine and uracil onto ferrihydrite did not decrease in seawater. Adsorption of biomolecules onto minerals was the centerpiece idea of Bernal (1951) and also for the origin of life. Because salts in seawater can prevent the adsorption of biomolecules onto minerals, Bernal's hypothesis about how life arose on Earth may require major revision.
Footnotes
Acknowledgments
This research was supported by grants from CNPq (474265/2013-7) and CNPq/Fundação Araucária (Programa de Apoio a Núcleos de Excelência—PRONEX, protocolo 24732).
Author Disclosure Statement
On behalf of all authors, I guarantee that the present paper has not been published before, it is not presently being considered for publication elsewhere, it does not violate any intellectual property right of any person or entity, it does not contain any subject matter that contravenes any laws (including defamatory material and misleading and deceptive material), and it meets ethical standards applicable to the research discipline.