
Abstract
Raman spectroscopy can provide chemical information about organic and inorganic substances quickly and nondestructively with little to no sample preparation, thus making it an ideal instrument for Mars rover missions. The ESA ExoMars planetary mission scheduled for launch in 2018 will contain a miniaturized Raman spectrometer (RLS) as part of the Pasteur payload operating with a continuous wave (CW) laser emitting at 532 nm. In addition, NASA is independently developing two miniaturized Raman spectrometers for the upcoming Mars 2020 rover mission, one of which is a remote (stand-off) Raman spectrometer that uses a pulse-gated 532 nm excitation system (SuperCam). The other is an in situ Raman spectrometer that employs a CW excitation laser emitting at 248.6 nm (SHERLOC). Recently, it has been shown with analyses by Curiosity that Gale Crater contains significantly elevated concentrations of transition metals such as Cr and Mn. Significantly, these transition metals are known to undergo fluorescence emission in the visible portion of the electromagnetic spectrum. Consequently, samples containing these metals could be problematic for the successful acquisition of fluorescence-free Raman spectra when using a CW 532 nm excitation source. Here, we investigate one analog environment, with a similar mineralogy and sedimentology to that observed in martian environments, as well as elevated Cr contents, to ascertain the best excitation wavelength to successfully collect fluorescence-free spectra from Mars-like samples. Our results clearly show that CW near-infrared laser excitation emitting at 785 nm is better suited to the collection of fluorescence-free Raman spectra than would be a CW laser emitting at 532 nm. Key Words: Raman spectroscopy—Gypsum—Chromium—Manganese—Iron-oxide dust—Mars. Astrobiology 15, 761–769.
1. Introduction
R
It is well documented that sulfate minerals are present on Mars. For example, orbital spectroscopic studies have detected extensive deposits of sulfate minerals interpreted to be gypsum (Gendrin et al., 2005; Squyres et al., 2006; Bishop et al., 2007; Roach et al., 2007; Wiseman et al., 2009). In addition, in situ spectroscopic analyses by Spirit, Opportunity, and Curiosity have detected the presence of gypsum (Arvidson et al., 2006; Hurowitz et al., 2006; Wang et al., 2006; Johnson et al., 2007; Grotzinger et al, 2014; McLennan et al., 2014; Vaniman et al., 2014). The major goal of ESA's and NASA's planned missions slated to go to Mars in 2018 and 2020, respectively, is the search for preserved ancient biosignatures. Therefore, considering the potential of gypsum to preserve microbial fossils here on Earth, this evaporitic mineral serves as an ideal target to search for the presence of ancient martian biology.
2. Raman Spectroscopy Goes to Mars
One of the analytical techniques scheduled to interrogate gypsum on Mars is Raman spectroscopy, which has several appealing features that, above and beyond analysis of sulfate minerals, offer a beneficial general analytical technique to take to Mars. Collecting Raman spectral data involves typically quick spectral acquisition times, nondestructive analysis, little to no sample preparation, and the ability to provide chemical information on minerals and biomarker compounds, while the instrumentation can be miniaturized to have light mass and low power constraints. Given these attributes, ESA and NASA are planning on taking three miniaturized Raman spectrometers on two forthcoming missions to Mars. The ESA ExoMars planetary mission scheduled for launch in 2018 will contain a miniaturized Raman spectrometer (RLS) as part of the Pasteur payload, utilizing a continuous wave (CW) laser with an excitation wavelength emitting at 532 nm to interrogate crushed samples from the surface or shallow subsurface (e.g., Rull et al., 2011). Currently, NASA is independently developing two miniaturized Raman spectrometers for the slated Mars 2020 rover mission, consisting of a remote (stand-off) Raman spectrometer that uses a pulse-gated 532 nm excitation system (SuperCam) (Clegg et al., 2014) and an in situ Raman spectrometer employing a CW excitation laser emitting at 248.6 nm (SHERLOC) (Beegle et al., 2014).
The selection of the appropriate wavelength of laser excitation is very important to consider for a Mars-bound Raman spectrometer in order to ensure the acquisition of meaningful spectra. Wavelength of excitation is a crucial parameter when determining how to successfully analyze a compound of interest, as the Raman scattering intensity is inversely proportional to the fourth power of the laser wavelength (I Raman ∼ 1/λ4). Thus, a shorter-wavelength laser could provide increased Raman scattering in the absence of fluorescence issues. However, shorter-wavelength lasers are high enough in energy to promote electronic transitions and hence fluorescence emission, which leads to fluorescence interference.
Additionally, wavelength can be chosen with respect to a particular analyte of interest. Typically, Raman cross sections of materials change with excitation wavelengths, for example resonant enhancement of pigment compounds. However, as the samples on Mars will be a mixture of many minerals and potentially biomarker compounds, it is difficult to judiciously select an appropriate wavelength based on the spectral response of one analyte of interest. For example, CW 532 nm excitation systems have been proposed to detect carotenoids if present on Mars by resonance enhancement (e.g., Marshall et al., 2007; Marshall and Wang, 2010), while CW 248.6 nm excitation systems have been proposed to detect N- and S-bearing heterocyclic compounds and polycyclic aromatic hydrocarbons if present on Mars by resonance enhancement (e.g., Bhartia et al., 2008; Beegle et al., 2014). The problem with this approach is that the surrounding rock/regolith matrix may pose a potential issue with these wavelengths and thus make the analyses meaningless. Therefore, an all-purpose excitation wavelength needs to be considered.
On the whole, all previous studies investigating the best choice of wavelength selection for a miniaturized Raman spectrometer to take to Mars have been based on pure salts, minerals, organic compounds, and microbial cultures (e.g., Marshall et al., 2007; Bhartia et al., 2008; Lui et al., 2009), the rationale being that pure salts and minerals produce identical spectra as naturally occurring minerals (Lui et al., 2009). For example, Lui et al. (2009) showed that spectra could be obtained from a CW laser excitation wavelength at 532 nm without fluorescence interference on pure sulfate salts, which they proposed were analogous to sulfate minerals on Mars. However, recent data collected by Curiosity have revealed that Gale Crater contains significantly elevated concentrations of transition metals such as Cr and Mn. For example, Curiosity has measured an average Cr concentration of 2984 ppm at Gale Crater and, more significantly, Cr concentration as high as 5170 ppm in a calcium sulfate vein at Gale Crater (McLennan et al., 2014). From a Raman analytical perspective, these transition metals are problematic, as they are known to undergo fluorescence emission in the visible portion of the electromagnetic spectrum, thus potentially rendering these samples problematic for successful collection of fluorescence-free Raman spectra using a CW 532 nm excitation source. Here, we investigate one analog environment, with a similar mineralogy and sedimentology to that observed in martian environments, and in addition elevated Cr contents, to ascertain the best excitation wavelength to successfully collect fluorescence-free spectra from Mars-like samples.
3. The Biggest Challenge in Raman Spectroscopy—Fluorescence
One of the major limitations of Raman spectroscopy is fluorescence emission induced in samples from the wavelength of laser excitation. Fluorescence emission occurs when the energy of the excitation, typically in the visible region of the electromagnetic spectrum, is adequate to induce an electronic transition in the molecule being interrogated. The generated fluorescence has a longer lifetime than the Raman effect and hence is more intense than the Raman scattering. From a practical perspective, fluorescence emission can be problematic and more often than not can hinder Raman spectral collection resulting in spectra that have much lower signal-to-noise ratios and the Raman bands are superimposed on an intense sloping baseline that increases with increasing Raman shift, or in the worst case no Raman bands can be discerned on the intense sloping baseline.
Fluorescence emission in geological samples can arise from transition metals (e.g., Cr, V, and Mn), rare earth elements, and organic material (e.g., aliphatic hydrocarbons and low-molecular-mass aromatic hydrocarbons). These substances can either be present within the sample as impurities substituted into the crystal lattice or mixtures present in heterogeneous samples. Transition metals like Cr, V, and Mn undergo electronic transitions (d-d transition) that result in fluorescence emission over the visible range from 400 to 730 nm (e.g., Orange et al., 1996). Rare earth elements such as Nd3+, Sm2+, Sm3+, Eu2+, Eu3+, Gd3+, Tb3+, and Ce3+ undergo electronic transitions (d-f and f-f transitions) that result in fluorescence emission over the visible range from 400 to 750 nm (Panczer et al., 2012). Usually, it is the C-H bonded functional groups in organic material commonly found in geological organic matter such as substituents in aliphatic hydrocarbons and low-molecular-mass aromatic hydrocarbons that will undergo an electronic transition in the visible range from 400 to 700 nm that results in fluorescence emission (e.g., Wopenka, 1988; Marshall et al., 2006; Olcott Marshall and Marshall, 2015).
There are multiple approaches and techniques to mitigate fluorescence emission from a sample. Perhaps the easiest method to mitigate fluorescence is the judicious selection of wavelength, either choosing UV or near-IR. Given the three main causes of fluorescence emission in geological samples as discussed above, the best choice to mitigate fluorescence would be to use a mid-UV or near-IR laser excitation source. For example, SHERLOC (Scanning Habitable Environments with Raman and Luminescence for Organics and Chemicals) has chosen to use a mid-UV laser to reduce the risk of fluorescence effects from analytes such as polycyclic aromatic hydrocarbons, N- and S-bearing heterocyclic compounds, and bacterial cells (Bhartia et al., 2008; Beegle et al., 2014).
Fluorescence can also be quenched by photobleaching. This is a process whereby the laser is allowed to irradiate the sample for a short period of time before a spectrum is collected. However, this technique should be avoided for samples that are photosensitive, as they will undergo photodegradation and hence be chemically transformed or destroyed (Kato, 1974). Another approach is sequential wavelength shifting, which exploits the phase difference between the fluorescence and the Raman emission sinusoids and is potentially capable of resolving the weak Raman scatter from the intense fluorescence. However, this methodology has yet to be applied to chemically complex samples such as geological samples. Another background suppression methodology is time or pulse gating. This methodology is underpinned on using pulsed excitation and gated signal detection for Raman scattering discrimination from fluorescence emission, also stray light, and thermal radiation in a time domain (Martyshkin et al., 2004). The Raman scattered light occurs pretty much instantaneously with the laser pulse; however, fluorescence lifetimes are in the order of nanoseconds or longer. Hence, the coupling of a picosecond excitation pulse with a subnanosecond signal gating affords an effective rejection of the major part of the broad time domain fluorescence signal (Martyshkin et al., 2004). This methodology will be employed in the Raman system as part of the SuperCam instrument (Clegg et al., 2014).
Another Raman methodology that has shown potential to mitigate fluorescence is surface-enhanced resonance Raman spectroscopy (SERRS). This methodology is the combination of surface and resonance enhancement (SERRS), which can occur when adsorbates have intense electronic absorption bands in the same spectral region as the metal surface plasmon resonance, yielding an overall enhancement as large as 1010 to 1012. A further advantage of SERRS is that very often the intense luminescence background, which sometimes results from laser excitation under resonance conditions, is almost completely quenched in SERRS due to the interaction with the metal surface providing an efficient pathway for rapid nonradiative decay. However, this method requires sample preparation and adsorbing (either electrostatic or chemical binding) the analyte of interest on a roughened metal surface. Recording anti-Stokes Raman spectra can reduce the fluorescence interference, as the fluorescence occurs at a lower energy than the excitation frequency; consequently, anti-Stokes scattering can be avoided to avoid fluorescence. Coherent anti-Stokes Raman spectroscopy (CARS) is another Raman methodology that can eliminate fluorescence interference since the energy of coherent anti-Stokes scattering is greater than the energy of fluorescence emission.
However, despite these many approaches and methodologies available to the Raman spectroscopist to eliminate fluorescence, very few are practical and feasible to scale down to a miniaturized system with low sample mass, simple sample presentation, and little to no sample preparation. To date, current technology options for miniaturized instrument development that are close to flight readiness are CW visible (green—532 nm) and mid-UV (248.2 nm) and pulse-gated 532 nm excitation instruments.
4. Materials and Methods
4.1. Samples
For this study, we picked one analog environment with a similar mineralogy and sedimentology to observed martian environments. The Late Permian El Reno Group, exposed throughout south-central Kansas and northern Oklahoma, contains thick siliciclastic units interspersed with evaporative gypsum beds (Fig. 1). A recent study has lead to the recognition that these rocks were deposited in a terrestrial setting (Sweet et al., 2013), as the thick red bed units contain a high proportion of eolian-delivered dust. It is thought that this dry, arid environment would form transient saline lakes, which would leave behind evaporative minerals as they dry (Sweet et al., 2013). These rocks provide a good analogue for the mineralogical and sedimentological features found on Mars (Fig. 1B and 1C) and also contain elevated Cr concentration, with an average concentration of 80 ppm (Sweet et al., 2013), over twice the concentration of the average upper crust (Taylor and McLennan, 1995).
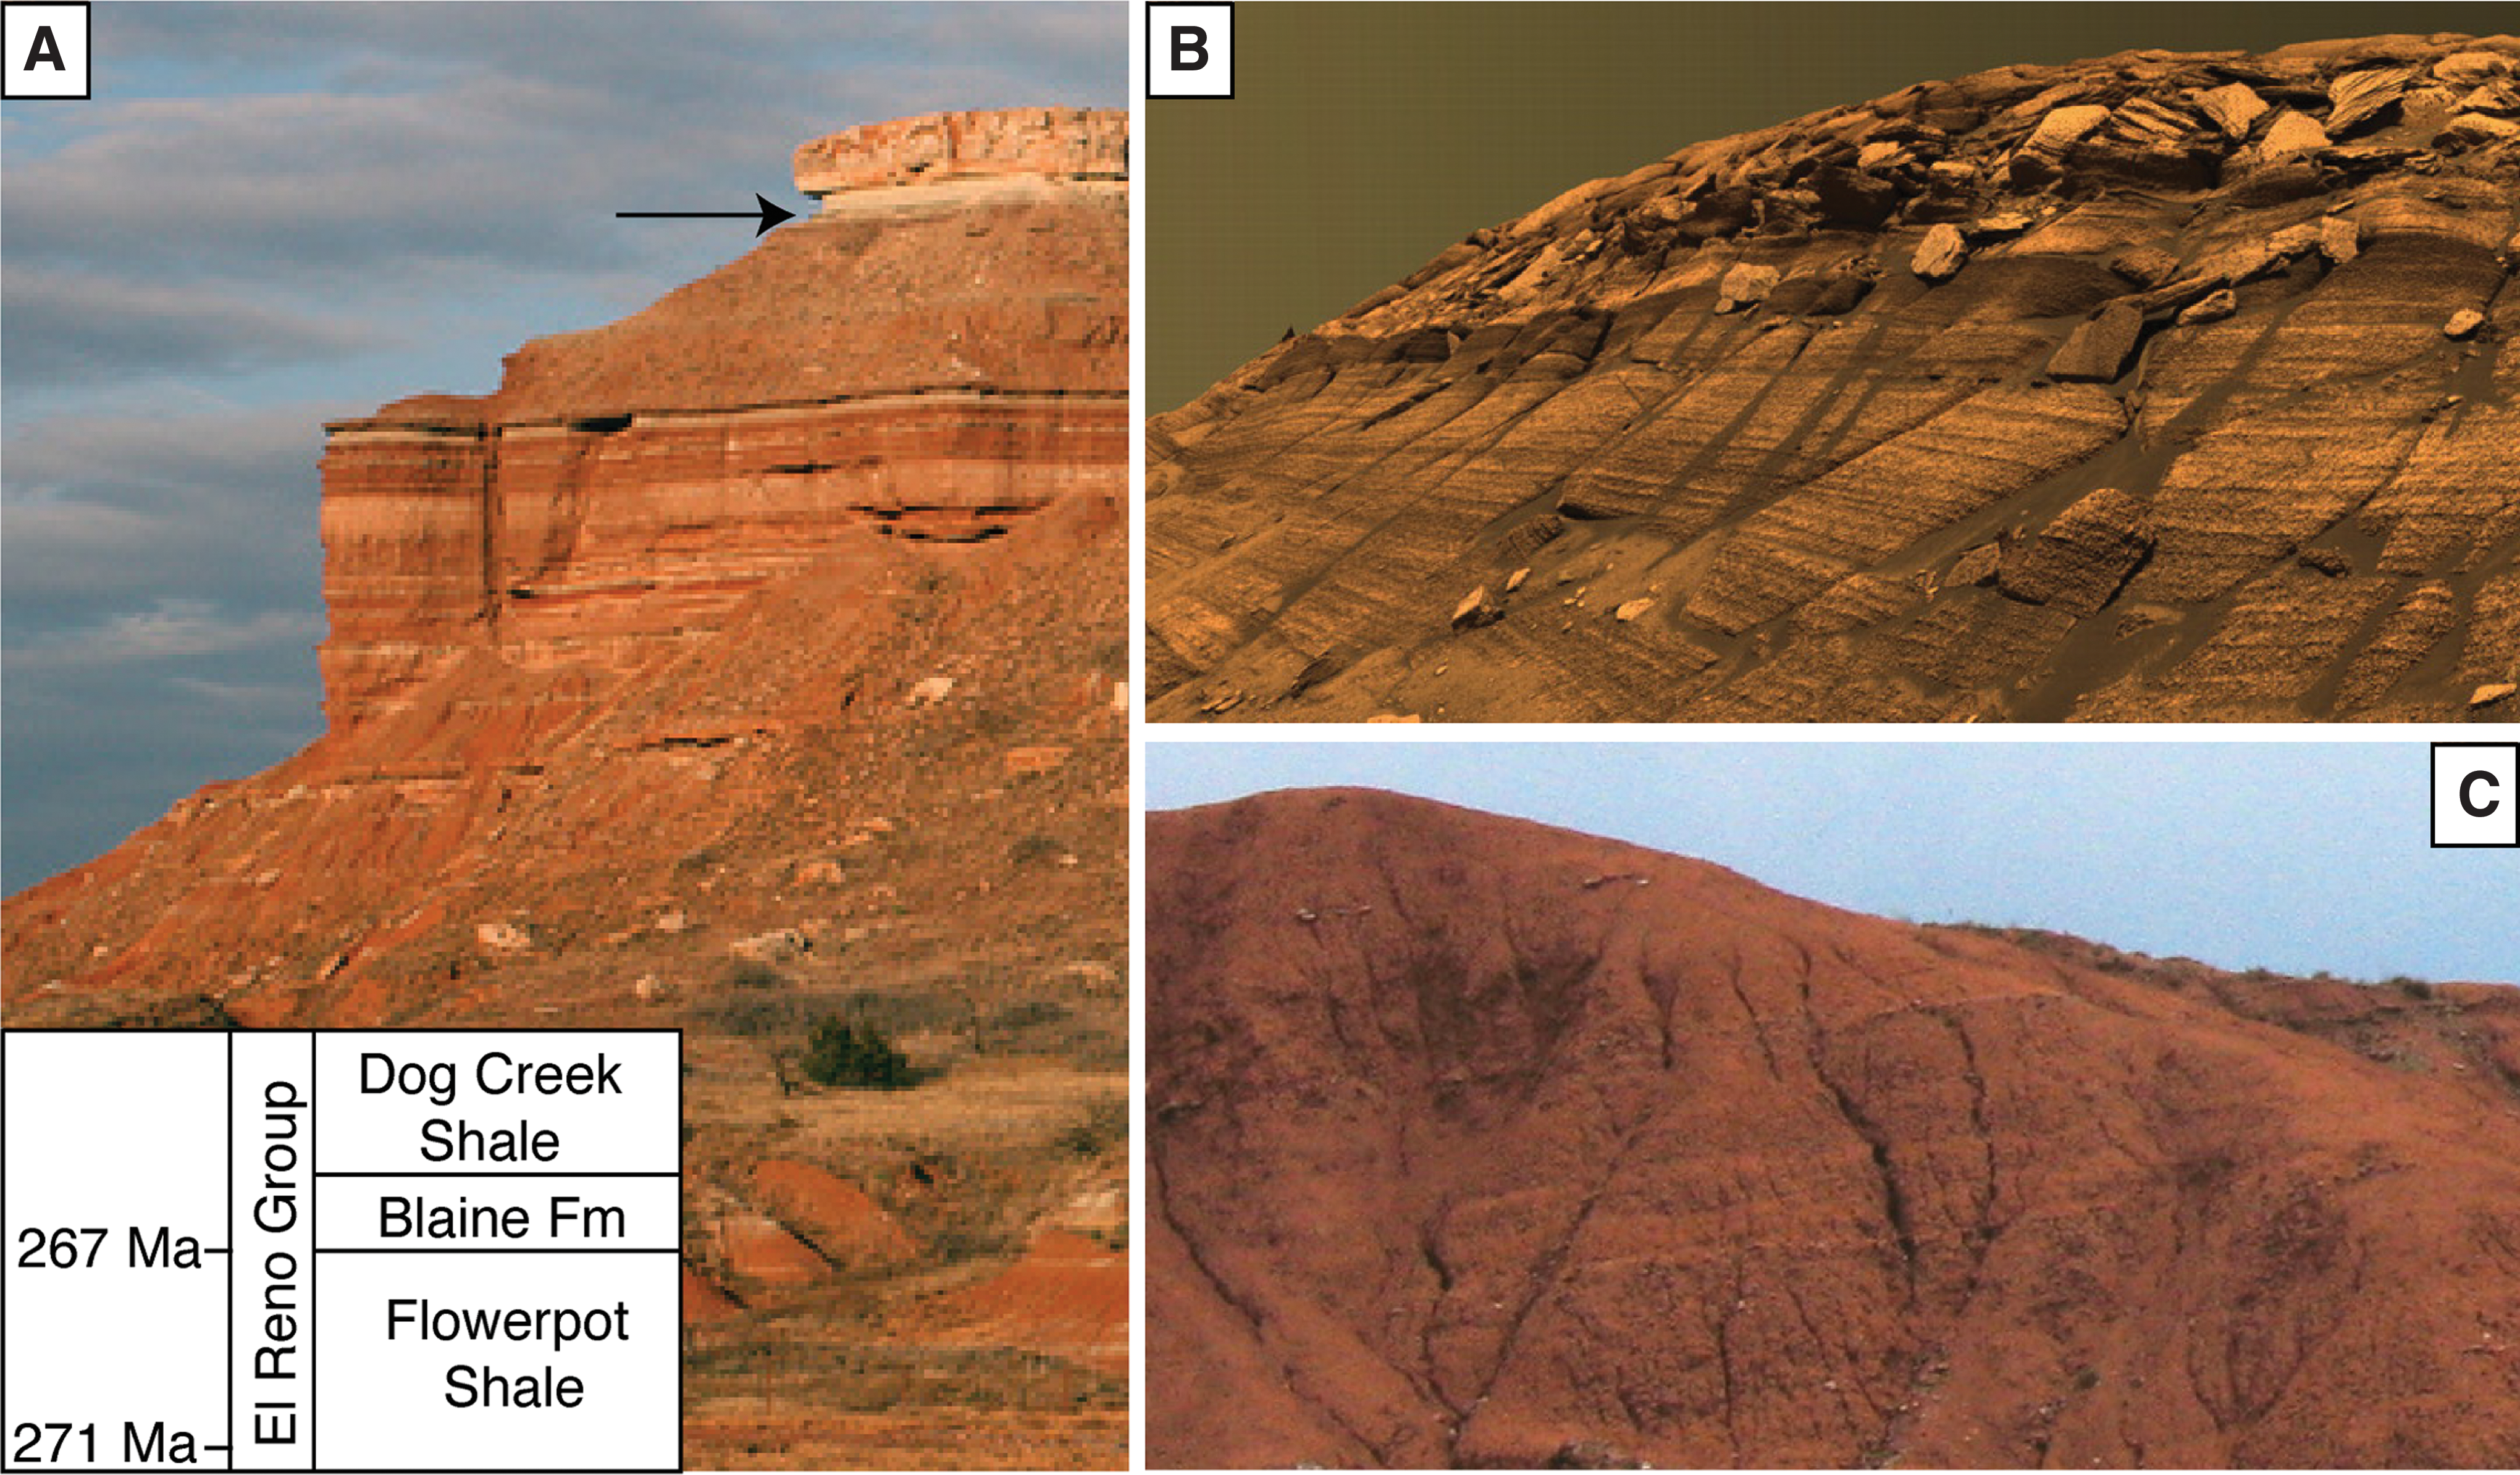
(
Our study area, Lone Peak Mountain (36°21′54.6″N, 98°34′45.3″W), contains two formations from the El Reno Group: the siliciclastic Flowerpot Shale overlain by the gypsiferous Blaine Formation (Fig. 1A). As western Oklahoma has been tectonically inactive since the end of the Permian (Johnson, 1989), these rocks have only experienced minimum burial, no more than a kilometer deep (Carter et al., 1998); thus the shales are friable and highly weathered (Fig. 1C). However, the contact between the two formations is a centimeter-thick laminated gypsum underlying massive beds (over 1.5 m) of gypsum. These gypsum deposits are resistant to weathering; regionally, including at Lone Peak Mountain, the Flowerpot Shale has been protected by this basal gypsum bed, which has formed an escarpment nearly 300 km long (Sweet et al., 2013; Fig. 1A). Although the Flowerpot Shale does not contain bedded gypsum, it does contain nodular gypsum.
For this study, gypsum with a variety of mineral textures and colors was selected for analysis. Cleared surfaces and surfaces covered in iron-oxide dust, similar to that which covers many of the surfaces on Mars (Christensen et al., 2003), were analyzed (Figs. 2, 3, and 4).
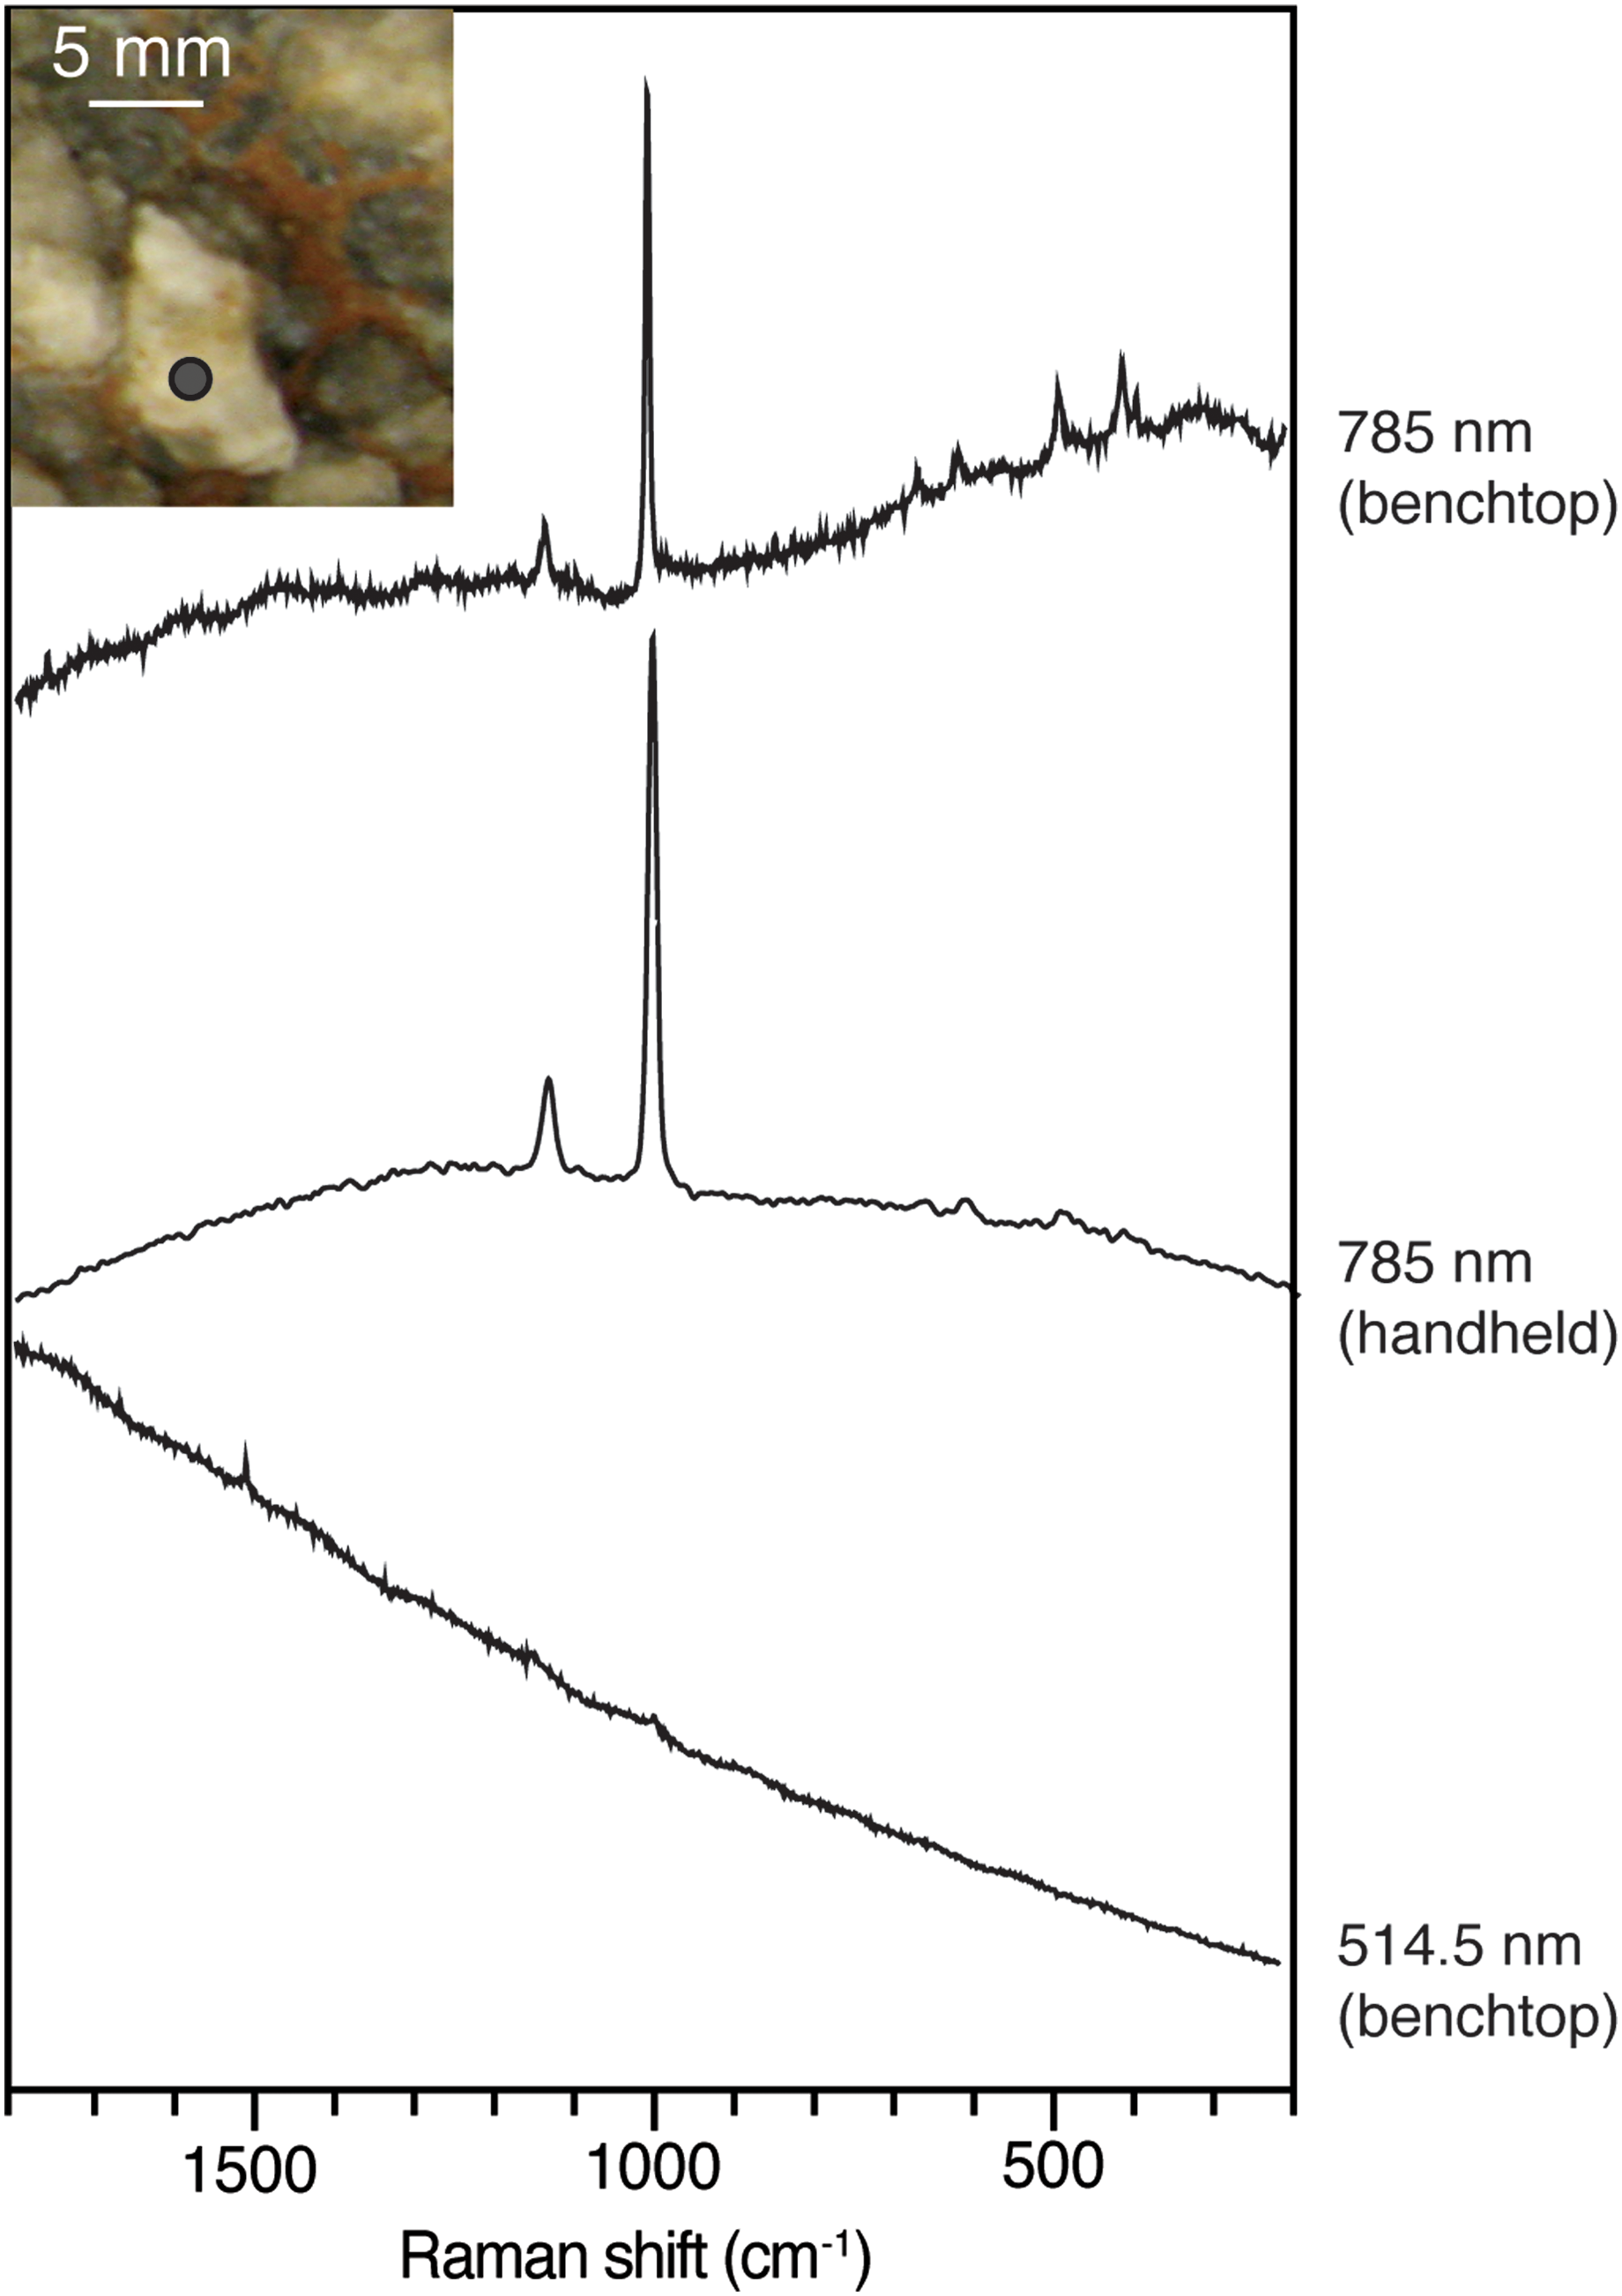
Spectra collected on white-colored gypsum from samples from the El Reno Formation using a benchtop and a portable near-IR 785 nm laser excitation system and a benchtop system using 514.5 nm laser excitation. (Color graphics available at
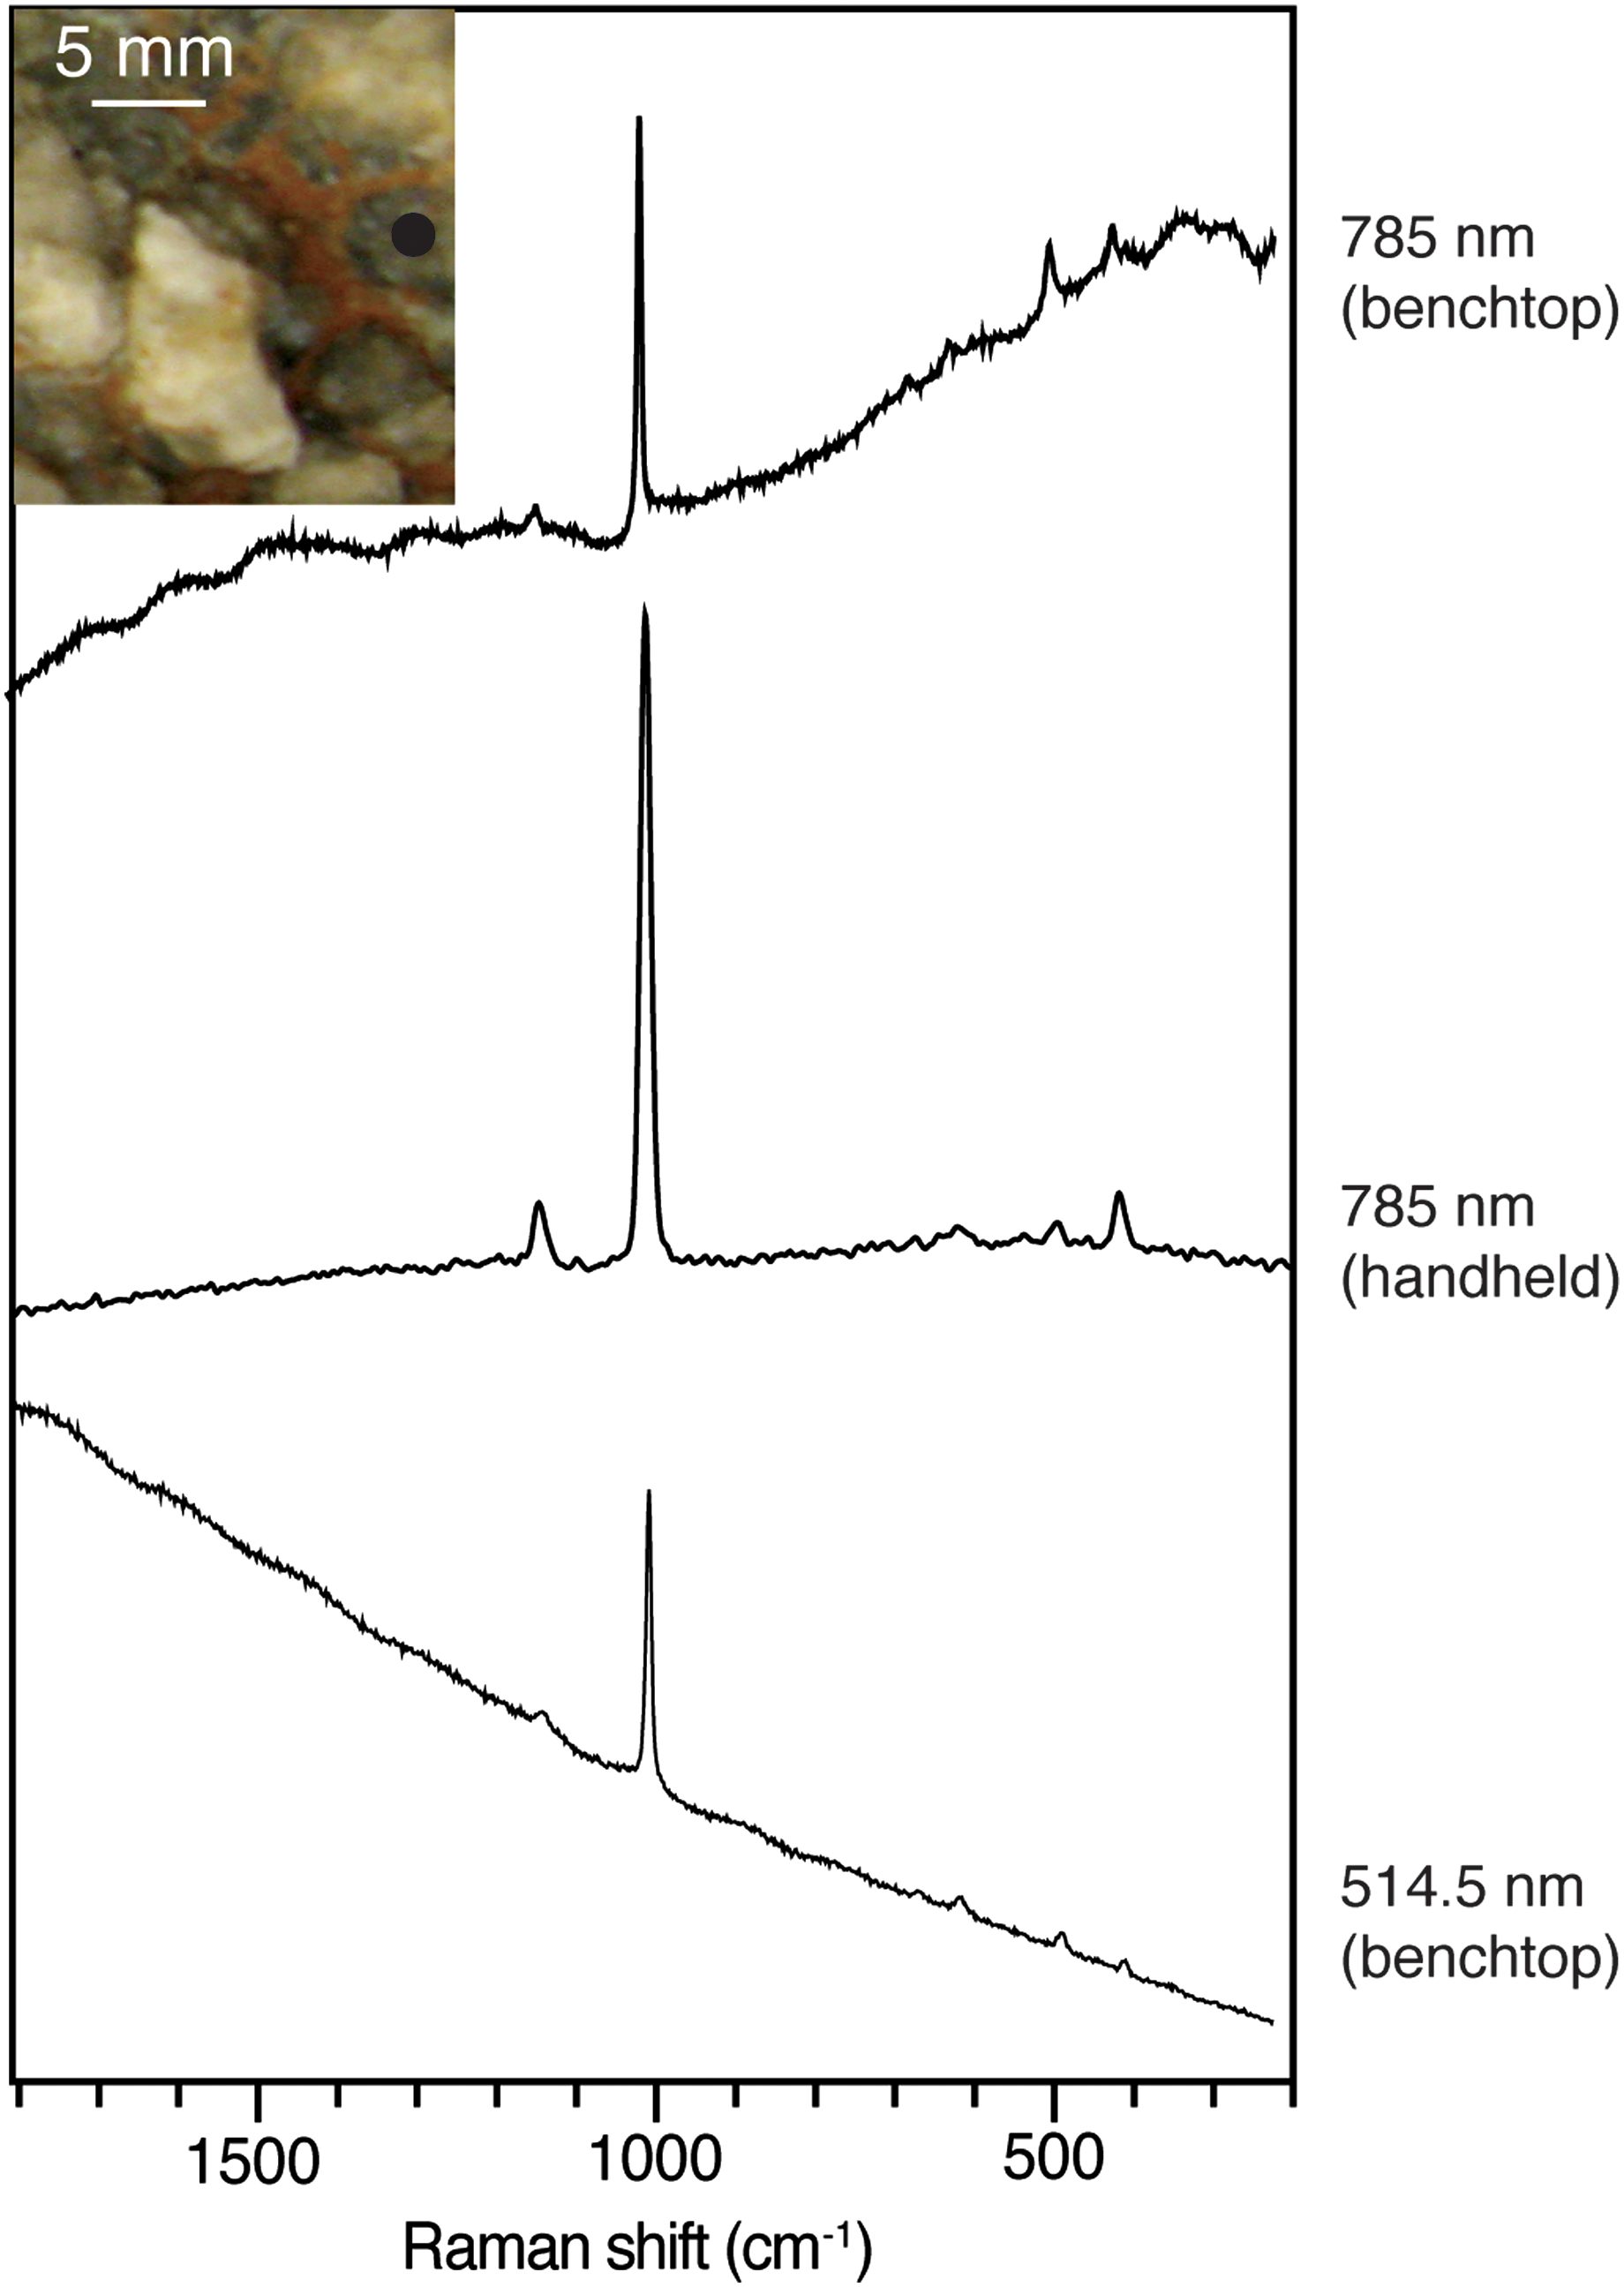
Spectra collected on black-colored gypsum from samples from the El Reno Formation using a benchtop and a portable near-IR 785 nm laser excitation system and a benchtop system using 514.5 nm laser excitation. (Color graphics available at

Spectra collected on hematite-covered gypsum from samples from the El Reno Formation using a benchtop and a portable near-IR 785 nm laser excitation system and a benchtop system using 514.5 nm laser excitation. (Color graphics available at
4.2. Near-infrared light (785 nm) excitation portable Raman spectroscopic analyses
The DeltaNu RockHound is a lightweight field-portable miniaturized Raman spectrometer that weighs 2.26 kg and operates for approximately 5 h on a rechargeable battery. The system has a simple point-and-shoot attachment, which is used to obtain Raman spectra on a variety of solid materials over the Raman-shift 200–2000 cm−1 spectral region. This instrument is operated remotely (e.g., 100 m) from a PC laptop using Bluetooth technology. The system has a thermoelectrically cooled charge-coupled device (CCD) detector, a diode laser of 120 mW with a CW excitation at 785 nm. The laser spot size is 35 μm and is focused and simultaneously viewed on a discrete portion of the sample. The instrument has an 8 cm−1 spectral resolution. The NuSpec software operates the system and spectral acquisition. All the spectra were collected for 10 s, 1 accumulation, and 1–5 mW laser power. The instrument is calibrated by using a polystyrene ASTM standard and the four vibrational modes of polystyrene at 795.8, 1031.8, 1153.3, and 1583.1 cm−1.
4.3. Green (514.5 nm) and near-IR (785 nm) light excitation benchtop Raman spectroscopic analyses
Raman spectra collected with green excitation were obtained on a Renishaw inVia Reflex Raman Microprobe (Renishaw plc, Wotton-under-Edge, UK) equipped with a Peltier cooled CCD camera (1024 × 256 pixels). Sample excitation was achieved with a CW argon ion laser (Modu-Laser, Utah, USA) emitting at a wavelength of 514.5 nm and a 300 mW air-cooled near-IR diode emitting at a wavelength of 785 nm. The Raman light was dispersed by a diffraction grating with 2400 and 1200 mm/line, and the signal was analyzed with a Peltier cooled CCD camera at room temperature. The attached microscope is a Leica DMLM and is equipped with four objectives (×100/0.9 NA, ×50/0.75 NA, ×20/0.40 NA, ×5/0.12 NA) and a trinocular viewer that accommodates a video camera that allows direct viewing of the sample. The ×5.0.12 NA objective was used, and in addition the beam was defocused in order to approximate the beam diameter that is available with the DeltaNu RockHound Raman spectrometer. All the spectra were collected for 10 s, 1 accumulation, and 1–5 mW laser power. Calibration of the Raman shift is achieved by recording the Raman spectrum of the silicon F1g mode for one accumulation and 10 s. If necessary, an offset correction is performed to ensure that the position of the F1g band is at 520.50 ± 0.10 cm−1.
4.4. Spectral processing
An important note for this study is that all the spectra collected were not processed or treated in any way (i.e., no baseline correction or spectral smoothing) in order to access the best choice wavelength of excitation for the successful acquisition of Raman spectra from Mars analog gypsum samples.
5. Results
5.1. Structure, selection rules, and vibrational spectra of gypsum
Derived from space group, site symmetries of atoms, and number of atoms in the Bravais unit cell, factor group analysis can be performed to calculate the irreducible representations of vibrational modes that are Raman and IR active to predict the vibrational spectra for gypsum. The mineral gypsum (CaSO4 · 2H2O) crystallizes in the monoclinic
Here, we will only consider the Raman active modes. Nine of the 36 Raman active modes are generated by the internal vibrational modes of the
5.2. Raman spectra: near-IR (785 nm) versus green (514.5 nm) excitation wavelength
Spectra shown in Figs. 2, 3, and 4 show bands diagnostic for the internal vibrational modes of the
By comparison, the spectra collected with a green laser line (514.5 nm) on the various locations on the gypsum sample (Figs. 2, 3, and 4) are clearly not as informative as those collected out in the field and the benchtop instruments with the near-IR (785 nm) source (Figs. 2, 3, and 4). Significantly, there are varying effects due to fluorescence emission in the spectra when collected with the green-wavelength laser (Figs. 2, 3, and 4). Most notably, in Fig. 2 the fluorescence effect is so prominent in the clear white gypsum that it obscures any Raman bands in spectra collected with the green laser line (514.5 nm), thus rendering the white gypsum unanalyzable at this wavelength. Figure 3 shows comparative spectra collected from the black gypsum, which reveal that both near-IR (785 nm) instruments afford more spectral information with respect to the weaker vibrational modes of the
Significantly, spectra acquired from the various gypsum colors and hematite covering by the benchtop near-IR and portable near-IR systems contain both of the diagnostic bands (at 1008 and 1135 cm−1) used to identify gypsum, while spectra collected with the green laser line benchtop instrument do not (Figs. 2, 3, and 4).
6. Discussion
6.1. Mars analog gypsum
Curiosity has measured Cr concentrations as high as 5170 ppm in a calcium sulfate vein at Gale Crater, with an average concentration of 2984 ppm (McLennan et al., 2014). In addition to high concentrations of Cr, Curiosity has also measured elevated Mn concentrations (Lanza et al., 2014). From a structural perspective, gypsum can readily accommodate the incorporation of foreign ions, which can replace matrix ions within the lattice sites. It is significant to note here that it is well known that gypsum can incorporate a significant quantity of Cr ions as impurities as the mineral crystallizes (e.g., Hamdona and Al Hadad, 2007). Given the astrobiological interest in gypsum and the elevated Cr and Mn contents that are present on Mars, we discuss here the likelihood of collecting fluorescence-free Raman spectra by the upcoming ESA and NASA missions.
6.2. Near-infrared (785 nm) versus green (514.5 nm) excitation—best choice of wavelength
As Cr is a strong fluorescence emitter (e.g., Moncorge et al., 1991), even trace quantities of Cr can produce spectra collected with a CW green excitation laser where the spectrum is effected by a broad photoluminescence baseline. Additionally, increased Cr content can also affect the signal-to-noise ratio of spectra collected. Our work clearly shows that the Raman spectra collected by near-IR excitation is fluorescence-free, while the spectra collected by green excitation is effected by fluorescence artifacts. For example, the Raman spectra collected by the green excitation on the white gypsum shows a very weak band at 1008 cm−1, and perhaps more importantly no other bands. Commonly, to unambiguously assign a band in spectroscopy, its intensity should at least equal two or three times the noise (e.g., Vandenabeele and Moens, 2012). The very weak band in the spectrum collected from the white gypsum does not fulfill this criteria and could potentially lead to an incorrect band assignment and consequently an erroneous identification of a substance.
Similarly, our results shown here are in accordance with the previous investigation by Schopf et al. (2012). They observed similar fluorescence issues when collecting Raman spectra on natural gypsums using laser excitation of 351.1 (near-UV) and 457.9 (blue) nm. Significantly, their study investigated gypsums with elevated Mn and/or Cr from Pernatty Lagoon, South Australia; Salines de Otuma, Peru; and Chinkapook Lake, Australia (e.g., Long et al., 1992; Oswald, 1992; DeVries, 1998). They could only successfully collect spectra using near-UV and blue light sources from a locality in which the gypsum was devoid of substituted Cr and Mn.
6.3. Potential implications for ESA and NASA slated Raman spectrometers to go to Mars
Our work, as well as that of Schopf et al. (2012), clearly illustrates potential problems for collecting fluorescence-free Raman spectra when using CW near-UV, blue, and green laser light sources on Mars analog gypsums. Given these results, the slated ESA ExoMars Raman spectrometer operating with a CW laser emitting at 532 nm might pose problematic with respect to collecting meaningful spectra when interrogating gypsum deposits on Mars. Furthermore, Olcott Marshall and Marshall (2013), Harris et al. (2014), and Harris et al. (2015) clearly demonstrated that using a near-IR laser light source is much better for collecting fluorescence-free Raman spectra of disordered sp2 carbonaceous materials from Archean cherts than a 532 nm laser light source. These studies demonstrate that perhaps using CW green laser excitation sources for the analyses of minerals and disordered sp2 carbonaceous materials on Mars might not be the best choice of wavelength.
SHERLOC, the Raman spectrometer selected to fly on the 2020 Mars mission, will use a mid-UV laser excitation source (248.6 nm), ostensibly to avoid the issue of fluorescence interference (Bhartia et al., 2008; Beegle et al., 2014). However, chromium oxides are also known to undergo resonant Raman enhancement when excited with mid-UV wavelength excitation such as 244 nm light sources (e.g., Chua et al., 2001). Resonance Raman enhancement occurs when the incident laser frequency (here, 248.6 nm) is close to the electronic transition of the molecule being studied. This resonance leads to a greatly enhanced intensity of the Raman bands, meaning that trace quantities of the resonantly enhanced material can swamp out the bands produced by other compounds, including any potential biosignatures, like carotenoids, which do not undergo resonance enhancement in the mid-UV (e.g., Marshall et al., 2007). Our work clearly shows the need for either developing a near-IR laser system or a time or pulse gating system with a 532 nm laser source, such as the Raman spectrometer as part of SuperCam, for a miniaturized Raman spectrometer to take to Mars as part of an analytical suite.
7. Conclusion
The data shown here demonstrate that the near-IR (785 nm) laser excitation source is better suited to collecting data from iron- and sulfate-rich environments than the green (514.5 nm) laser is. Given the interest in Raman spectroscopy for Mars investigation, it is crucial to test wavelengths in Mars analog environments to determine which excitation wavelength is most suited to collecting data free from spectral artifacts on the iron- and Cr and Mn–substituted sulfate-rich martian rocks.
Near-IR excitation is an ideal choice of excitation wavelength, as few molecules have excited states low enough in energy to give fluorescence. This largely, but not completely, gets round the problem of fluorescence. In addition, near-IR excitation has a deeper depth of penetration than UV and visible lasers and consequently can optically section deeper into a sample to reduce the risk of inference from iron-oxide coatings.
Footnotes
Acknowledgments
A.O.M. would like to acknowledge the KU general research fund and Chesapeake Energy. We thank the reviewers for great input into making this manuscript better.
Disclosure Statement for All the Authors
No competing financial interests exist.