




Abstract
One of the major exploration targets for current and future Mars missions are lithofacies suggestive of biotic activity. Although such lithofacies are not confirmation of biotic activity, they provide a way to identify samples for further analyses. To test the efficacy of this approach, we identified carbonate samples from the Eocene Green River Formation as “microbial” or “non-microbial” based on the macroscale morphology of their laminations. These samples were then crushed and analyzed by gas chromatography/mass spectroscopy (GC/MS) to determine their lipid biomarker composition. GC/MS analysis revealed that carbonates visually identified as “microbial” contained a higher concentration of more diverse biomarkers than those identified as “non-microbial,” suggesting that this could be a viable detection strategy for selecting samples for further analysis or caching on Mars. Key Words: Life detection—Biomarkers—Stromatolites—Green River Formation. Astrobiology 15, 770–775.
1. Introduction
I
Earth-based Mars analogues are crucial to the development of life-detection strategies, as they allow testing on samples that are known to contain biosignatures. Here, we use samples collected from the Green River Formation as our Mars analogue. The Green River Formation was deposited in a continental lake system that covered large portions of what are now western Colorado, northeastern Utah, and southwestern Wyoming. Two large paleo-lakes, Lake Gosiute in what is now Wyoming and Lake Uinta in what is now Colorado and Utah, deposited sediment in the Green River, Great Divide, Washakie, and Sand Wash Basins in the north, and the Uinta and Piceance Basins in the south (Fig. 1A) (Eugster and Surdam, 1973; Vanden Berg, 2008; Mercier and Johnson, 2012). These lakes were terminal lakes and thus had no outlets and variable shorelines for most of their depositional history (Bradley, 1964). It is thought that these lakes were stratified, with anoxic, perhaps euxinic, bottom waters in the center surrounded by playa lake-like waters around the shore, as geochemical measurements have indicated that the water in the lakes was alkaline and often highly saline (Bradley, 1964; Eugster and Surdam, 1973; Surdam and Wolfbauer, 1975; Collister et al., 1992). As the salinity and anoxia of the lake would increase, metazoan grazers would not be able to live in the lake, the classic conditions under which microbial mats can be preserved and lithified (Riding, 2000, 2010, 2011), accounting for the wide variety of microbialites, stromatolites, and thrombolites found in the Green River Formation (Buchheim et al., 2012; Sarg et al., 2013). The rocks of the Green River Formation provide an analogue for lacustrine environments found on Mars (Grotzinger et al., 2014), which could also have been deposited in playa-type environments and may have precipitated carbonate or evaporative minerals (McLennan et al., 2005).

(
Here, we report on the preserved lipid biomarker compounds preserved within rocks collected from a core drilled through the Piceance Basin. Samples visually identified as “microbial” based on their morphology had more biomarkers than samples identified as “non-microbial,” indicating that identifying targets for further analysis on the basis of their macromorphology may be a viable technique for searching for life on Mars.
2. Materials and Methods
2.1. Geological setting
Samples were collected in stratigraphic context from US Bureau of Mines/AEC Colorado Core #1 at the USGS Core shed. This core, drilled at 40°03′14.6″N, 108°20′05.5″W in 1965–1966, comprises 957 m (3140 ft) of the Green River Formation, through much of the Parachute Creek and Garden Gulch Members (Fig. 1B). This core has been studied by many; thus its bulk geochemistry has been determined. It has been correlated to the so-called rich and lean oil shale zones found across the Piceance Basin and tied to the depth and development stages of paleo-Lake Uinta (Cole and Picard, 1978; Robinson, 1979; Johnson, 1981; Brownfield et al., 2010; Self et al., 2010; Tänavsuu-Milkeviciene and Sarg, 2012). Ten samples were selected for analysis down the core, representing four different lake stages: (1) fresh lake, (2) transitional lake, (3) highly fluctuating lake, and (4) rising lake (Fig. 1B). These lake stages correlate with salinity; stage 1 marks the original transgression of Lake Uinta, stage 2 represents an increasingly saline lake, and stage 3 represents a time when Lake Uinta was saline and restricted enough to produce evaporite and nahcolite beds, restriction that eases with the further deepening of the lake in stage 4 (Tänavsuu-Milkeviciene and Sarg, 2012). Three of the samples, 1751′, 1769′, 1774′, were selected from within a nahcolite bed (Fig. 1C). Stage 1 rocks are generally clay-dominated, while rocks from the other stages are, at least in this locality, carbonate-dominated.
2.2. Laboratory measurements
Once back in the laboratory, areas with marking pen were mechanically removed from the rock, and the remaining material was ultrasonicated in a bath of 9:1 dicholoromethane:methanol (v:v) for 5 min to remove any surface contaminants and then crushed in a Restek ball mill set to 225 rpm for 15 min. The stainless steel chamber and ball were solvent-cleaned between samples to prevent cross contamination. A total of 5 g of each powdered sample was then measured into a Teflon vessel, and 25 mL of 9:1 dicholoromethane:methanol (v:v) was added to each vessel. These vessels were then extracted in the 800 W microwave accelerated reaction system (MARS Xpress); the temperature was ramped to 100°C for 5 min, where it was held for 30 min, and then cooled back to room temperature for 15 min. The solvent-extracted organic material was then vacuum filtered to remove the powdered rock, and reacted with activate copper to remove elemental sulfur present in the extracts. Finally, 1 μL of each extract was splitlessly injected into the gas chromatograph through an inlet port heated to 150°C. The gas chromatograph was heated from 40°C to 130°C at a rate of 20°C per minute, and then ramped at 5°C per minute to 350°C, where it was held for 3 min. Analytes were then analyzed on a ThermoFinnigan Trace GC-DSQ in full-scan mode positive ion mode. Individual compounds were identified by using their relative retention times and mass spectral data and by comparison to published data.
3. Results
The 10 samples were analyzed by gas chromatography/mass spectroscopy (GC/MS) to search for preserved biomarkers. In general, a lipid biomarker represents the geological form of a biologically synthesized molecule (Ourisson and Albrecht, 1992; Brocks and Summons, 2003). Different organisms synthesize different compounds in different environmental conditions, so the presence of a lipid biomarker can be quite informative, revealing ancient biota, paleoenvironments, and redox conditions (Brocks and Pearson, 2005; Olcott, 2007). Here, compounds identified included pristane, phytane, hopanes, and steranes. Straight hydrocarbon chains, n-alkanes, were also identified, even though they are not indicative of any particular organism or even of biological processes (Peters et al., 2005). However, the distribution of n-alkanes is thought to reflect source input: low-molecular-weight compounds < C15 are thought to indicate a bacterial source, middle-range compounds between about C19 and C25 are thought to indicate algal inputs, and high-molecular-weight compounds > C25 are considered a sign of higher plant input, as is a preponderance of odd-numbered n-alkanes over the even-numbered ones (Brocks and Summons, 2003; Peters et al., 2005). Pristane and phytane are thought to derive from the phytyl side chain on chlorophyll and, as such, are indicative of biological processes, although not of any particular organism (Powell and McKirdy, 1973; Didyk et al., 1978; Grice et al., 1998a). Hopanes and steranes, found with the m/z 191 and 217 trace, respectively, are more specific biomarkers; hopanes are the preserved remnants of bacteriohopanpolyols synthesized by bacteria, while steranes are the geological form of steroids, which are synthesized by eukaryotes.
3.1. Determining microbial versus non-microbial
At the time of collection, samples were categorized as microbial or non-microbial solely by visual inspection of their laminae. Although lamination morphology is not sufficient proof of biogenicity, as similar forms can be synthesized abiotically (Grotzinger and Rothman, 1996), this sample selection was done to mimic the types of visual identification that are necessary on Mars, where samples are currently identified as suggestive of microbial activity purely by their gross morphology (Noffke, 2015). These identifications were done on unprocessed core (Fig. 1C–1E) to mimic the conditions likely to be found on Mars. Thus, samples containing carbonate-rich areas with wrinkled, crinkly, or other stromatolitic lamination [Fig. 1C + 1D, similar to Fig. 7C + 7D in Sarg et al. (2013)] were identified as microbial, while carbonate-rich samples with planar lamination were identified as non-microbial (Fig. 1E).
3.2. Non-microbial samples' biomarker content
Only two of the total ion currents (TICs) for samples categorized as non-microbial show any peaks above background level. The sample from 1362′ and the one from 1549′ both display a large phytane peak and a smaller pristane peak (Fig. 2). The m/z 85 trace, used to detect alkanes, reveals a low concentration of high-molecular-weight n-alkanes in the sample from 1549′ and from 1540′, ranging from C22 to C26. Similarly, although the m/z 191 and 217 traces show hints of peaks, the signal cannot be cleanly resolved from the noise (Fig. 2).
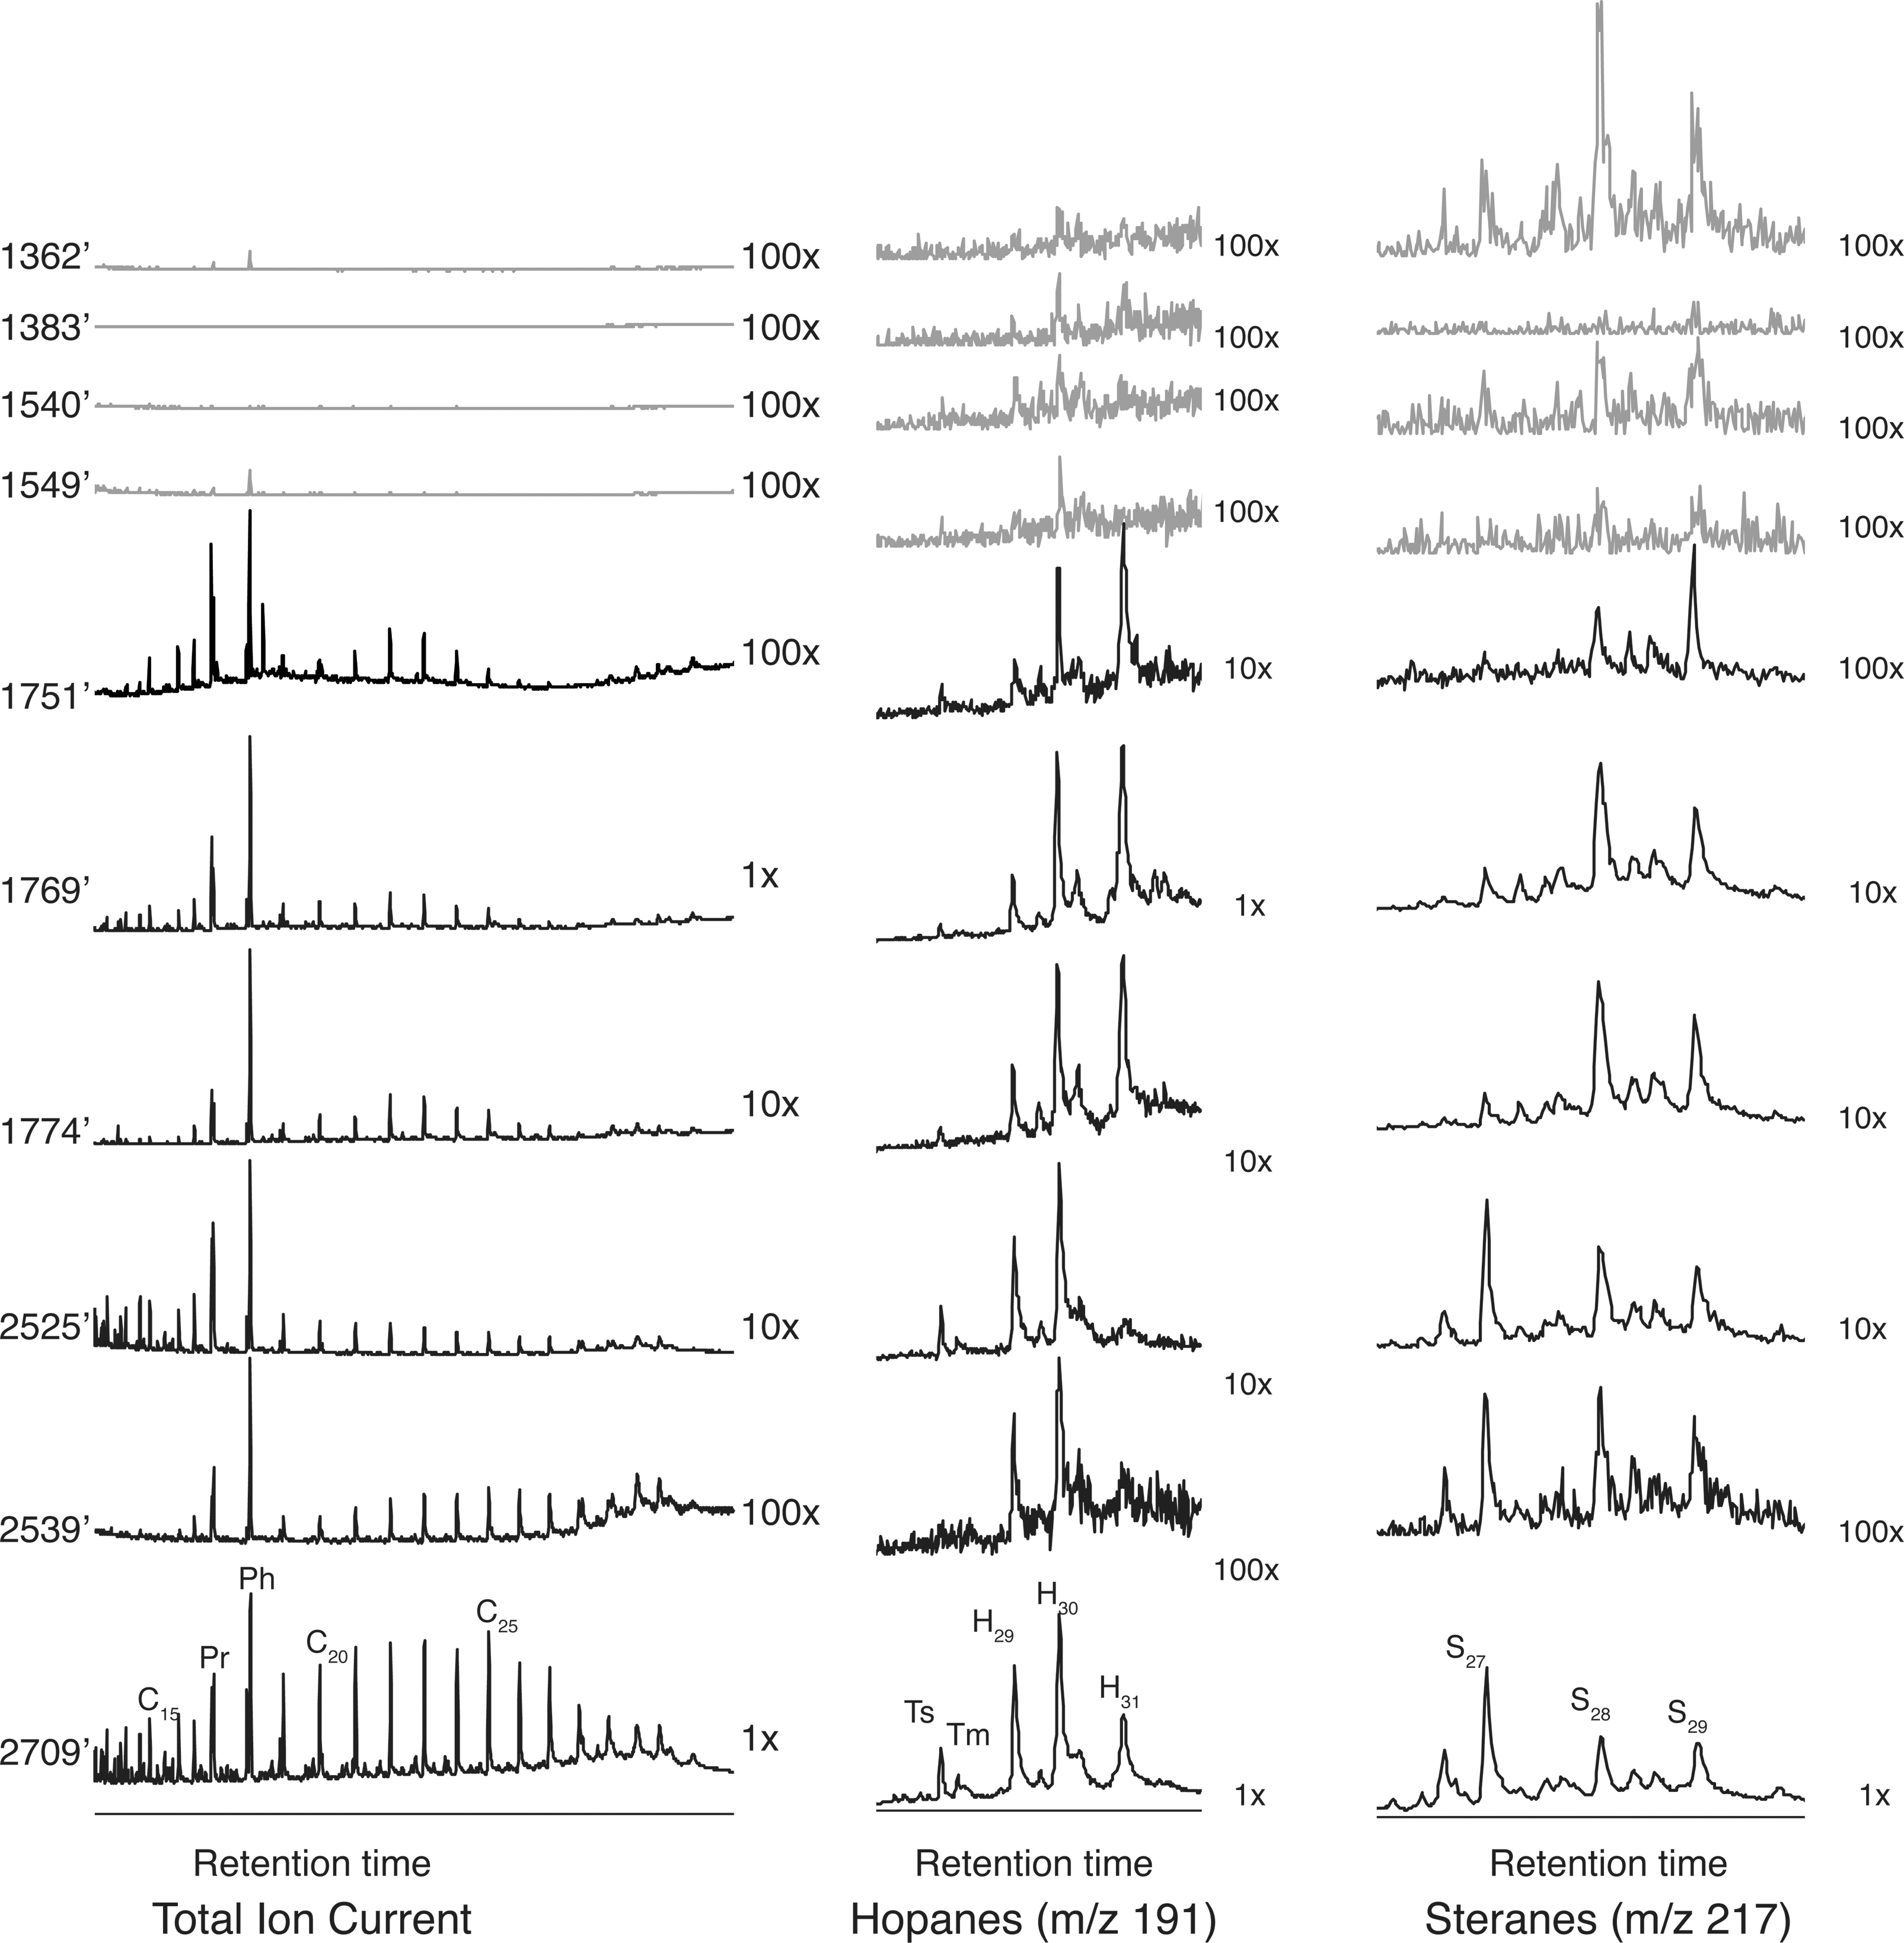
Chromatograms from all samples in stratigraphic order. Left: total ion current (TIC). Middle: m/z 191, used to detect hopanes. Right: m/z 217, used to detect steranes. For all samples in each category, compound abundance is shown relative to the sample collected at 2709′; samples listed as 1× are at the same concentration, samples listed at 10× are a tenth as concentrated, and 100× indicates samples that are a hundredth as concentrated. Samples visually identified as non-microbial due to the morphology of their laminations are in gray; those visually identified as microbial are in black. Despite the fact that an equal amount of sample was analyzed in all cases, the microbial samples contain a much higher abundance of extractable compounds. Pr = pristane, Ph = phytane, C n = n-alkane with n carbon atoms, H n = hopane with n carbon atoms, S n = sterane with n carbon atoms, Ts and Tm = trisnorhopanes.
3.3. Microbial samples' biomarker content
In comparison, the TICs from the six samples categorized as microbial all reveal a variety of compounds (Fig. 2). Each sample is dominated by phytane and pristane, similar to what has been found by others (Eglinton et al., 1966; Robinson, 1979), but also contains n-alkanes ranging from C12 to C31. The four youngest samples show a general bell-shaped distribution centering at C22 to C23, while the two oldest show a slight odd-over-even preference in the C23–C27 range; although similar to the other samples, the n-alkanes follow a general bell-shaped distribution (Fig. 2). The m/z 191 traces reveal C29–C31 hopanes in all six samples, although the distribution is different. The three younger samples within the nahcolite zone are dominated by the C30 and C31 hopanes, while the three older samples are instead dominated by the C29 and C30 hopanes (Fig. 2). A similar distribution is seen in the m/z 217 trace: all samples contain steranes, although the three younger samples and the three older samples have similar distributions of steranes. The younger are dominated by C28 and C29 steranes, while the older samples are dominated by the C27 sterane cholestane (Fig. 2).
4. Discussion and Implications
The data show a clear difference between the microbial and the non-microbial samples. Although the same amount of each type of sample was analyzed, the samples visually identified as microbial revealed a rich assortment of biomarkers, while the ones identified as non-microbial barely contained any detectable biomarkers, at least at the concentration analyzed here. The microbial samples also revealed differences in the source inputs at the different stages of the lake's development. The sample from stage 1, at 2709′, reveals the richest biota, as it contains the highest concentration of biomarkers. The transitional lake, represented by the samples from 2539′ and 2525′, has a smaller concentration of biomarkers and does not contain the plant inputs found in the sample from the freshwater lake. In contrast, the stage 3 samples, when the lake was highly fluctuating, contain a different distribution of biomarkers, including the preservation of more pristane and phytane than n-alkanes. Interestingly, with the exception of the ratio of pristane to phytane, the three samples from within the nacholite bed did not contain the biomarker assemblages thought to be typical of evaporative environments (ten Haven et al., 1988; Grice et al., 1998a, 1998b; Schinteie and Brocks, 2014), despite the presence of evaporative minerals. This could be an indication that the lake was not an evaporative environment long enough to establish a representative microbial community.
As the microbial and non-microbial samples represent different stages of the lake evolution, it is possible that the biomarker distribution revealed here is a product of lake chemistry rather than of biological source differences. In other words, if non-microbial samples were selected from the same stage as the microbial samples, it is feasible that they, too, could have contained biomarkers. Currently, we are conducting further analyses to see if these differences are a product of lake chemistry or whether there is in fact differential preservation within the microbial carbonates. Whatever the source of these compounds, these results show that, although remotely selecting samples suitable for in-depth chemical analysis by visual examination of morphology is a process that requires making assumptions, it can be a viable tool to select samples for further analysis.
Footnotes
Acknowledgments
A.O.M. thanks the University of Kansas General Research Fund and Chesapeake Faculty Research Award for funding.
Author Disclosure Statement
No competing financial interests exist.