
Abstract
Ultraviolet radiation is common to most planetary environments and could play a key role in the chemistry of molecules relevant to abiogenesis (prebiotic chemistry). In this work, we explore the impact of UV light on prebiotic chemistry that might occur in liquid water on the surface of a planet with an atmosphere. We consider effects including atmospheric absorption, attenuation by water, and stellar variability to constrain the UV input as a function of wavelength. We conclude that the UV environment would be characterized by broadband input, and wavelengths below 204 nm and 168 nm would be shielded out by atmospheric CO2 and water, respectively. We compare this broadband prebiotic UV input to the narrowband UV sources (e.g., mercury lamps) often used in laboratory studies of prebiotic chemistry and explore the implications for the conclusions drawn from these experiments. We consider as case studies the ribonucleotide synthesis pathway of Powner et al. (2009) and the sugar synthesis pathway of Ritson and Sutherland (2012). Irradiation by narrowband UV light from a mercury lamp formed an integral component of these studies; we quantitatively explore the impact of more realistic UV input on the conclusions that can be drawn from these experiments. Finally, we explore the constraints solar UV input places on the buildup of prebiotically important feedstock gasses like CH4 and HCN. Our results demonstrate the importance of characterizing the wavelength dependence (action spectra) of prebiotic synthesis pathways to determine how pathways derived under laboratory irradiation conditions will function under planetary prebiotic conditions. Key Words: Laboratory investigations—Origin of life—Planetary environments—UV radiation—RNA world. Astrobiology 16, 68–88.
1. Introduction
U
Many experimental studies of prebiotic chemistry have sought to include the effects of UV irradiation. A large number of them are concerned with formation of prebiotic molecules on interstellar ices and cometary surfaces (see, e.g., Bernstein et al., 2000). Such studies usually use lamps or synchrotron sources in ultrahigh vacuum, and the UV output is below λ < 160 nm (see, e.g., Bernstein et al., 2002, and Öberg et al., 2009).
Prebiotic chemistry experiments in aqueous solution also often use UV lamps, because they are safe, stable, and affordable UV sources. However, their output is often characterized by narrowband emission at specific wavelengths; for example, mercury lamps with primary emission at 254 nm are commonly used as proxies for prebiotic solar UV input (see, e.g., Moradpour and Kagan, 1974; Ferris and Chen, 1975; Kuzicheva and Gontareva, 2001; Guillemin et al., 2004; Ferris et al., 2005; Pestunova et al., 2005; Powner et al., 2007; Simonov et al., 2007; Guzman and Martin, 2008; Barks et al., 2010). However, solar UV input in that wavelength range is characterized by broadband emission. Many photoprocesses involving biological molecules are wavelength-dependent (e.g., Matsunaga et al., 1991); hence, conclusions drawn from simulations conducted when using monochromatic UV light may not hold true under more realistic conditions. In addition, solar UV input also shapes atmospheric photochemistry, which may impact the availability of reactants for some of these prebiotic pathways, as well as the energy deposited at the surface.
In this work, we explore the impact of UV light on prebiotic chemistry in liquid water on planetary environments that correspond to young Earth, and the implications for laboratory simulations. Therefore, we consider effects including atmospheric absorption, attenuation by water, and stellar variability to estimate the UV input as a function of wavelength in prebiotically important environments. We compare these estimates to the output of UV lamps and discuss the implications for laboratory studies like the ribonucleotide synthesis pathway of Powner et al. (2009) and the sugar synthesis pathway of Ritson and Sutherland (2012). We selected these two experiments as our case studies because they comprise the core part of a recently developed prebiotic chemistry network for the common origin of RNA, proteins, and lipid precursors (Patel et al., 2015). Irradiation by narrowband UV light from a Hg lamp formed an integral component of these studies; we quantitatively explore their viability under more realistic UV input. Finally, we determine the constraints solar UV input places on the buildup of prebiotically important feedstock gasses like CH4 and HCN.
2. Background
2.1. UV light and prebiotic chemistry
In this subsection, we review the impact of UV light on prebiotic chemistry. By “prebiotic chemistry,” we refer to the chemistry of small molecules, principally those containing C, H, N, O, P, or S, relevant to the origin of life. We focus on small molecules because large, complex molecules like proteins are not expected to be abundant prior to abiogenesis. We focus on molecules containing C, H, N, O, P, and S because those elements are the building blocks of life as we know it. We also include the chemistry of mineral catalysts that may be relevant to prebiotic chemistry. An example of a potentially relevant molecule is hydrogen cyanide, which may be a source of fixed nitrogen for organic molecules (Zahnle, 1986). An example of a potentially relevant catalyst is the mineral montmorillonite ((Na,Ca)0.33(Al,Mg)2(Si4O10)(OH)2·nH2O), which has been shown to promote polymerization of nucleotides (Ferris et al., 1996).
Ultraviolet light directly impacts the chemistry of small molecules. UV light can break molecular bonds (photolysis), produce secondary electrons (photoionization), and excite molecules out of the ground state (photoexcitation). All three of these mechanisms can affect prebiotic chemistry. We discuss the importance of each mechanism in the following pages.
Many evaluations of the role of UV light in prebiotic chemistry focus on photolysis of molecular bonds, stressing the potential of UV light to destroy populations of prebiotically interesting molecules. Photolyzed molecules can also recombine to form substances toxic to biological life today; for example, photolyzed water fragments can produce toxic hydrogen peroxide, H2O2 (Alizadeh and Sanche, 2012). From this perspective, UV light is considered a biological stressor, and many disfavor high-UV environments from a habitability perspective (Sagan, 1973; Cockell, 2000). However, UV photolysis may also play a role in promoting prebiotic chemistry. For example, Sagan and Khare (1971) relied on UV photolysis of H2S to produce superthermal H atoms that collisionally provide activation energy for reactions involving hydrocarbons, such as dissociation of CH4 for participation in subsequent reactions. Bond dissociation energies for prebiotically interesting molecules vary but are often contained in the range 1–10 eV (23–230 kcal/mol), corresponding to photons of wavelengths λ = 120–1200 nm. For example, the dissociation energy of the C = C bond in the alkene C2H4 is 7.55 eV (171 kcal/mol, λ = 164 nm), and the bond dissociation energy of the H-OH bond in water is 5.15 eV (119 kcal/mol, λ = 240 nm) (Blanksby and Ellison, 2003).
Absorption of UV light can photoionize molecules and release free electrons (termed secondary electrons) into the surrounding medium. Photoionization of liquid H2O begins at low efficiencies at 6.0–6.5 eV and increases to 100% efficiency at 11.7 eV (270 kcal/mol, λ = 106 nm) (Bernas et al., 1997; Mozumder, 2002), while benzene, the simplest aromatic hydrocarbon, photoionizes at 9.3 eV (214 kcal/mol, λ = 130 nm) at 350 K (Lias and Ausloos, 1978). Production of secondary electrons generates free radicals that can interact chemically with other compounds in the system. This can lead to detrimental effects for biological systems. For example, secondary electrons can induce strand breaks in DNA and damage proteins (Alizadeh and Sanche, 2012). However, photoionization can also drive relevant prebiotic chemistry. For example, Ritson and Sutherland (2012) relied on photoionization of cyanocuprates to drive their synthesis pathway for simple sugars. Generation of secondary electrons by photoionization may also help explain the origin of chirality in biomolecules. Rosenberg et al. (2008) demonstrated generation of chiral excesses at the 10% level in butanol via selective bond cleavage by spin-polarized electrons from a substrate. They suggested spin-polarized electrons generated by UV light incident on magnetic substrates as a potential mechanism for the origin of chirality.
Ultraviolet light can excite molecules (photoexcitation), promoting electrons from the ground state to a higher energy state. Excited molecules can decay to the ground state via fluorescence (emission of photons from excited state to ground) or phosphorescence (emission of photons over multiple transitions through lower-energy excited states on the way to ground). Excited molecules can also dissipate this energy vibrationally or collisionally. These pathways can transfer energy to other molecules, “sensitizing” them for further interactions. Finally, excited molecules can return to their ground states by rearranging their electronic orbitals (undergoing chemical changes), including breakage of the bond corresponding to the excited electron. An example of such a process is the hydration and deamination of the nucleobase cytosine into uracil (U). Under exposure to UV light, water is taken up by photoexcited cytosine to form a photohydrate. This photohydrate is unstable and decays in part to uracil, releasing ammonia in the process (Peng and Shaw, 1996). This is the mechanism for generation of uracil in the synthesis pathway discovered by Powner et al. (2009). Another example of photoexcitation-induced chemistry is the formation of thymine-thymine dimers in DNA (Matsunaga et al., 1991). Through such mechanisms, photoexcitation can influence prebiotic chemistry.
2.2. UV light and the RNA world
A major theory for the origin of life is the RNA world hypothesis (Gilbert, 1986; McCollom, 2013). Under this hypothesis, RNA was the original autocatalytic information-bearing molecule, with enzymatic functions being accomplished by short RNAs. Eventually, proteins supplanted RNA as enzymes due to greater diversity of monomers, and DNA supplanted RNA as an information-bearing molecule due to greater stability. This model is appealing because it resolves the metabolism/genetics-first debate by leveraging RNA's ability to fulfill both catalytic and structural and genetic roles, and it explains the origins of RNA's intermediary role in the modern “Central Dogma” of molecular biology. While other models for the origin of life do exist (see, e.g., Yu et al., 2013), the RNA world remains a dominant hypothesis (Copley et al., 2007). Recent work, in particular that of Powner et al. (2009) and Ritson and Sutherland (2012), has furnished key steps toward a plausible prebiotic synthesis of RNA. In this subsection, we discuss the pathways discovered by these studies and their interaction with UV light.
2.2.1. Powner et al. (2009) pathway for synthesis of activated pyrimidines
A key challenge with the RNA world hypothesis is how the comparatively complex RNA molecule originated (McCollom, 2013). Powner et al. (2009) achieved a remarkable step forward with their synthesis of the activated pyrimidine ribonucleotides cytosine and uracil under prebiotically plausible conditions. This pathway is the first plausible candidate for the synthesis of activated ribonucleotides and potentially fills in a missing step in the road to abiogenic RNA 1 .
A key ingredient of the Powner et al. (2009) pathway is irradiation with UV light. UV irradiation, by a lamp with primary emission at 254 nm, plays two key roles in this pathway. First, UV irradiation destroys a number of competing pyrimidine molecules generated by the synthesis pathway. Indeed, the exceptional photostability of the pyrimidine ribonucleotides might in part explain why these particular pyrimidines were selected by evolution for incorporation into an informational polymer. Second, UV light is required to photoactivate ribocytidine to enable a partial conversion to ribouridine via hydration and deamination.
2.2.2. Ritson and Sutherland (2012) pathway for synthesis of simple sugars
Irradiation by UV light is also a necessary element of a companion synthesis mechanism to the Powner et al. (2009) pathway, the Ritson and Sutherland (2012) synthesis of the two- and three-carbon sugars glycolaldehyde and glyceraldehyde from hydrogen cyanide (HCN), and the one-carbon sugar formaldehyde. These sugars are required for the synthesis of the pentose sugar ribonucleotide backbone in the Powner et al. (2009) process. Previously, the mechanism generally invoked to explain the prebiotic formation of sugars was the formose reaction, whereby formaldehyde polymerizes to form longer sugars. However, the formose reaction is nondiscriminate, meaning that it produces not only glycolaldehyde and glyceraldehyde but also longer sugars as well as structural isomers of the sugars. Additionally, the polymerization tends to run away, generating longer and longer chains until the products form an insoluble tar, useless to prebiotic chemistry (Ritson and Sutherland, 2012; McCollom, 2013). By contrast, the Ritson and Sutherland (2012) pathway uses a much more selective Kiliani-Fischer synthesis that generates a small number of products, including glycolaldehyde and glyceraldehyde in solution, available for further chemistry.
Ritson and Sutherland (2012) suggested that their synthesis relies on production of solvated electrons and protons via photoionization of the photocatalytic transition metal cyanide complex tricyanocuprate (I)
Banerjee et al. (2014) suggested an alternate mechanism underlying the photoredox synthesis of simple sugars discovered by Ritson and Sutherland (2012). They conducted theoretical calculations to suggest that instead of photoionizing electrons from tricyanocuprate (I) to reduce HCN, the UV input excites the transition metal complex from its ground S0 state to its excited S1 state. The S1 state then decays to the triplet T1 state via intersystem crossing. This state favorably binds HCN. The resulting molecular complex can then relax by dissociation to HCN- and tricyanocuprate (II), from which point the cycle can proceed. This mechanism is appealing because it avoids generating free radicals, which (due to their high reactivity) might impair the selectivity of the reaction process.
The Ritson and Sutherland (2012) and Banerjee et al. (2014) photoredox pathways differ significantly in their wavelength dependence on the input UV energy. The Ritson and Sutherland (2012) process simply calls for the photoionization of the tricyanocuprate (I) complex. This process should proceed with approximately equal quantum efficiency for input photons with energy exceeding the ionization energy of tricyanocuprate (I). If the ionization energy of tricyanocuprate (I) is E 0, then for λ < λ0 = hc/E 0 the pathway should proceed; for λ > λ0, it should not. By contrast, the Banerjee et al. (2014) pathway requires the excitation of tricyanocuprate from S0 to S1, which then decays to a reactive triplet state via intersystem crossing. Banerjee et al. (2014) calculated that this initial excitation occurs upon the absorption of photons with energies corresponding to a wavelength of 265 nm. Under the Banerjee et al. (2014) mechanism, the quantum efficiency of the process should peak at 265 nm.
3. Results
As discussed in Section 2, UV radiation has a key influence on prebiotic chemistry, and many experiments that seek to replicate prebiotic conditions have sought to incorporate it into their studies. However, many if not most of these studies have used narrowband UV lamps whose emission spectra are characterized by line emission. In this section, we provide estimates of the UV input in environmental conditions relevant to prebiotic chemistry and compare them to narrowband lamp input. We review factors including stellar output and activity, atmospheric attenuation, and aqueous shielding of UV flux. We also consider the constraints furnished by UV input on buildup of feedstock gases relevant to prebiotic chemistry. Our objective is to furnish guidance to experimentalists seeking to better simulate the prebiotic environment in laboratory settings.
3.1. Solar UV output in the prebiotic era
The dominant source of UV light in the prebiotic era, as today, was the Sun. The young Sun around the era of abiogenesis was as much as 30% dimmer and significantly more active than the Sun today. Studies of the star κ1 Ceti, which is a proxy for the 3.7–4.1 Ga Sun, show that despite being less luminous than the modern Sun overall, κ1 Ceti's emission exceeds solar emission for wavelengths shorter than 170 nm by 10–15% (Ribas et al., 2010). This is due to a higher level of magnetic activity powered by a more rapidly rotating stellar dynamo. Based on observations of this solar analogue, we expect the young Sun to have delivered far more of its energy in the UV wavelengths than does the Sun today. As an initial estimate of the young Sun's luminosity, we turn to the model of Claire et al. (2012), which uses data from the Sun and solar analogues to calibrate wavelength and time-dependent scalings for the modern Sun's emission spectrum. The net data product is a model for the solar spectrum through time. For purposes of our study, we chose 3.9 Ga as the era of abiogenesis. This period coincides with the end of the Late Heavy Bombardment (LHB) and is consistent with available geological and fossil evidence for early life (see Appendix A for details).
3.1.1. Effect of stellar variability
Shortwave UV flux (λ < 170 nm) is formed in the upper solar atmosphere, which is composed of high-temperature plasma sensitive to phenomena such as stellar activity and flares (Ribas et al., 2010). As the young Sun formed a larger fraction of its emission from shortwave radiation (Cnossen et al., 2007), this argues that the young Sun should have had stronger fractional variations in UV output than the present day. What level of variability might we expect, and how might this variability affect biologically relevant molecules?
We can obtain an initial estimate of young Sun UV variability by using the modern Sun as a proxy for the young Sun. Since we expect the young Sun to have been more variable than the modern Sun, this estimate can be interpreted as a lower bound on the young Sun's variability. Thuillier et al. (2004) presented composite spectra of the Sun synthesized from multiple data sources during the ATLAS 1 (March 1992) and ATLAS 3 (November 1993) space shuttle missions. These spectra correspond to moderately high (ATLAS 1) and low (ATLAS 3) periods of solar activity, and the epochs of observation “span half of the solar cycle amplitude in terms of the Mg II and F10.7 indices” (Thuillier et al., 2004). These data are accurate to 4% for the data spanning λ = 122–400 nm. Figure 1a presents the ratio between these two measured spectra. UV variability is higher at shorter wavelengths due to greater relative emission from the hot outer atmosphere of the Sun. Line variability reaches as high as 20% at sampling of 0.05 nm over the temporal and wavelength range presented, but the highest-variability lines are also the short-wavelength (λ < 200 nm) lines most strongly screened by atmospheric absorbers like CO2 and H2O. For most of the unshielded λ > 200 nm region, variability is less than 5%. However, the Mg II k and h lines at 279.6 and 280.3 nm (Ayres and Linsky, 1980) are variable at the 11% and 8% levels, respectively, and these are not strongly shielded by expected atmospheric absorbers. Since the ATLAS 1 and 3 periods spanned only about half the amplitude of the solar cycle as measured by the Mg II index, over the full solar cycle we may expect variance at levels as high as 20% in these lines. We note these lines are comparatively narrow, with the entire Mg II line complex having a width of ∼2 nm.
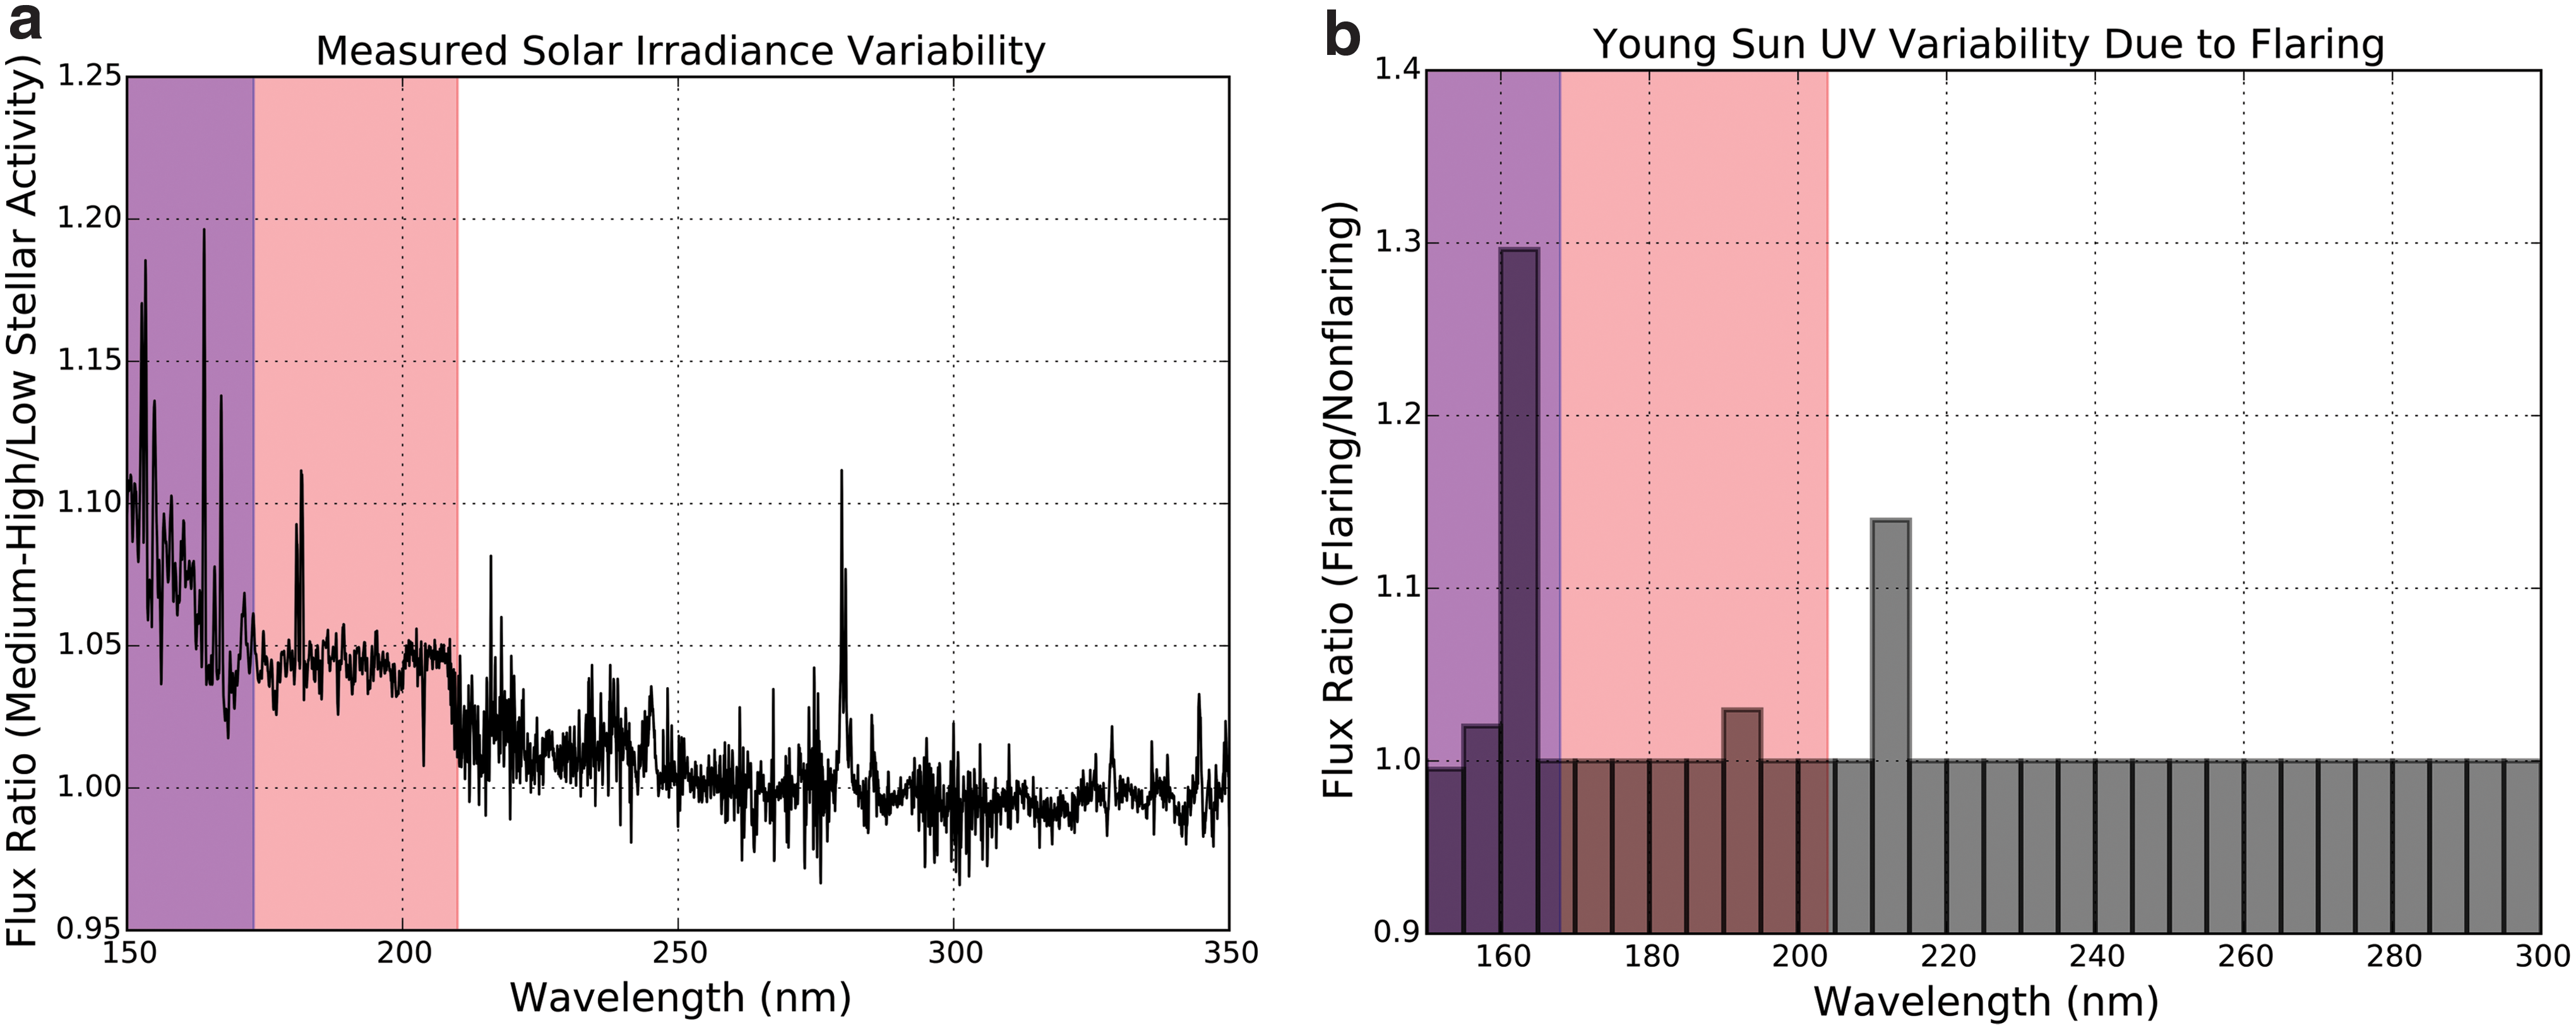
Two estimates for variability in the emission spectrum of the young Sun. Shaded in red is the region of the spectrum shielded by the 3.9 Ga atmosphere. Shaded in purple is the region of the spectrum shielded by a 1 μm layer of water. The impact of flux variations in these regions will be damped by atmospheric and aqueous attenuation. (
We obtain a second estimate of the UV variability of the young Sun by considering the effects of a flare on the stellar spectrum, as modeled by Cnossen et al. (2007). Cnossen et al. (2007) estimated the emission spectra of the young Sun in flaring and nonflaring states. To do so, they divide the emission of the 4–3.5 Ga Sun into components due to the photosphere and the outer atmosphere (corona + chromosphere). Cnossen et al. (2007) estimated photospheric emission by scaling the emission of the modern Sun by 75%. To estimate the emission due to the outer atmosphere, Cnossen et al. (2007) used the young solar analogue κ1 Ceti. κ1 Ceti is a M ⋆ = 1.04 M ⊙, [Fe/H] = 0.10 ± 0.05, T = 0.4–0.8 Gyr analogue to the 3.7–4.1 Ga Sun (Ribas et al., 2010). Cnossen et al. (2007) used UV and X-ray observations of κ1 Ceti to derive an emission model for the outer atmosphere of the star. Adding this outer-atmosphere component to the previously derived photospheric component yields an estimate of the UV spectrum of the 3.7–4.1 Ga nonflaring Sun. To estimate the UV spectrum of the flaring Sun, they scale a solar flare to κ1 Ceti to form a new emission model for the outer atmosphere, and proceed as before. Figure 1b presents the Cnossen et al. (2007) ratio between the flaring and nonflaring young Sun models. For wavelengths shorter than 150 nm, chromospheric/coronal emission dominates, and there exist differences in flux that exceed a factor of 100. However, wavelengths shorter than 210 nm are shielded by atmospheric absorption, which mutes their impact on terrestrial prebiotic chemistry. For wavelengths longer than 210 nm, photospheric emission dominates, and variability is again low. The maximum UV variability at wavelengths longer than 200 nm is found in the 210–215 nm bin, which displays variability at the 14% level.
We sought to obtain a quantitative estimate of the impact of variability on prebiotic chemistry. We noted that the variable Mg II h and k lines are nearly coincident with absorption peaks of some ribonucleotides (see Fig. 2). Absorption of UV photons by ribonucleotides can drive a variety of chemistry, ranging from photodegradation to photohydration/degradation. To gain a quantitative estimate of the potential photochemical impact of the variability of the Mg II h and k lines on the absorption of UV photons by ribonucleotides, we compute the difference in the rate of ribonucleotide photon absorption for the low and medium-high activity Thuillier et al. (2004) solar spectra. We weight these composite spectra with the absorption spectra corresponding to ribocytidine (at pH = 7.9 and 2.5) and ribouridine (at pH = 7.6 and 3.2), taken from Voet et al. (1963) 2 . We integrate these weighted spectra across the photochemically relevant 200–300 nm and compare the resulting photoabsorption rates. Integrated across the λ = 200–300 nm UV window, the variation in photoabsorption rate is ≤0.4% for all ribonucleotides, with the variation ranging from 0.09% (ribocytidine, pH = 2.5) to 0.4% (ribocytidine, pH = 7.9). Note that our data cover only half the solar cycle amplitude; hence, we can expect that over a full solar cycle, we would see twice the variation in photoabsorption rates. The change in ribonucleotide UV photoabsorption rate due to the solar cycle as measured from the modern Sun is small (<0.65%) in the broadband (λ = 200–300 nm), though in narrowband (0.05 nm) it can change by as much as 11% (Mg II line).
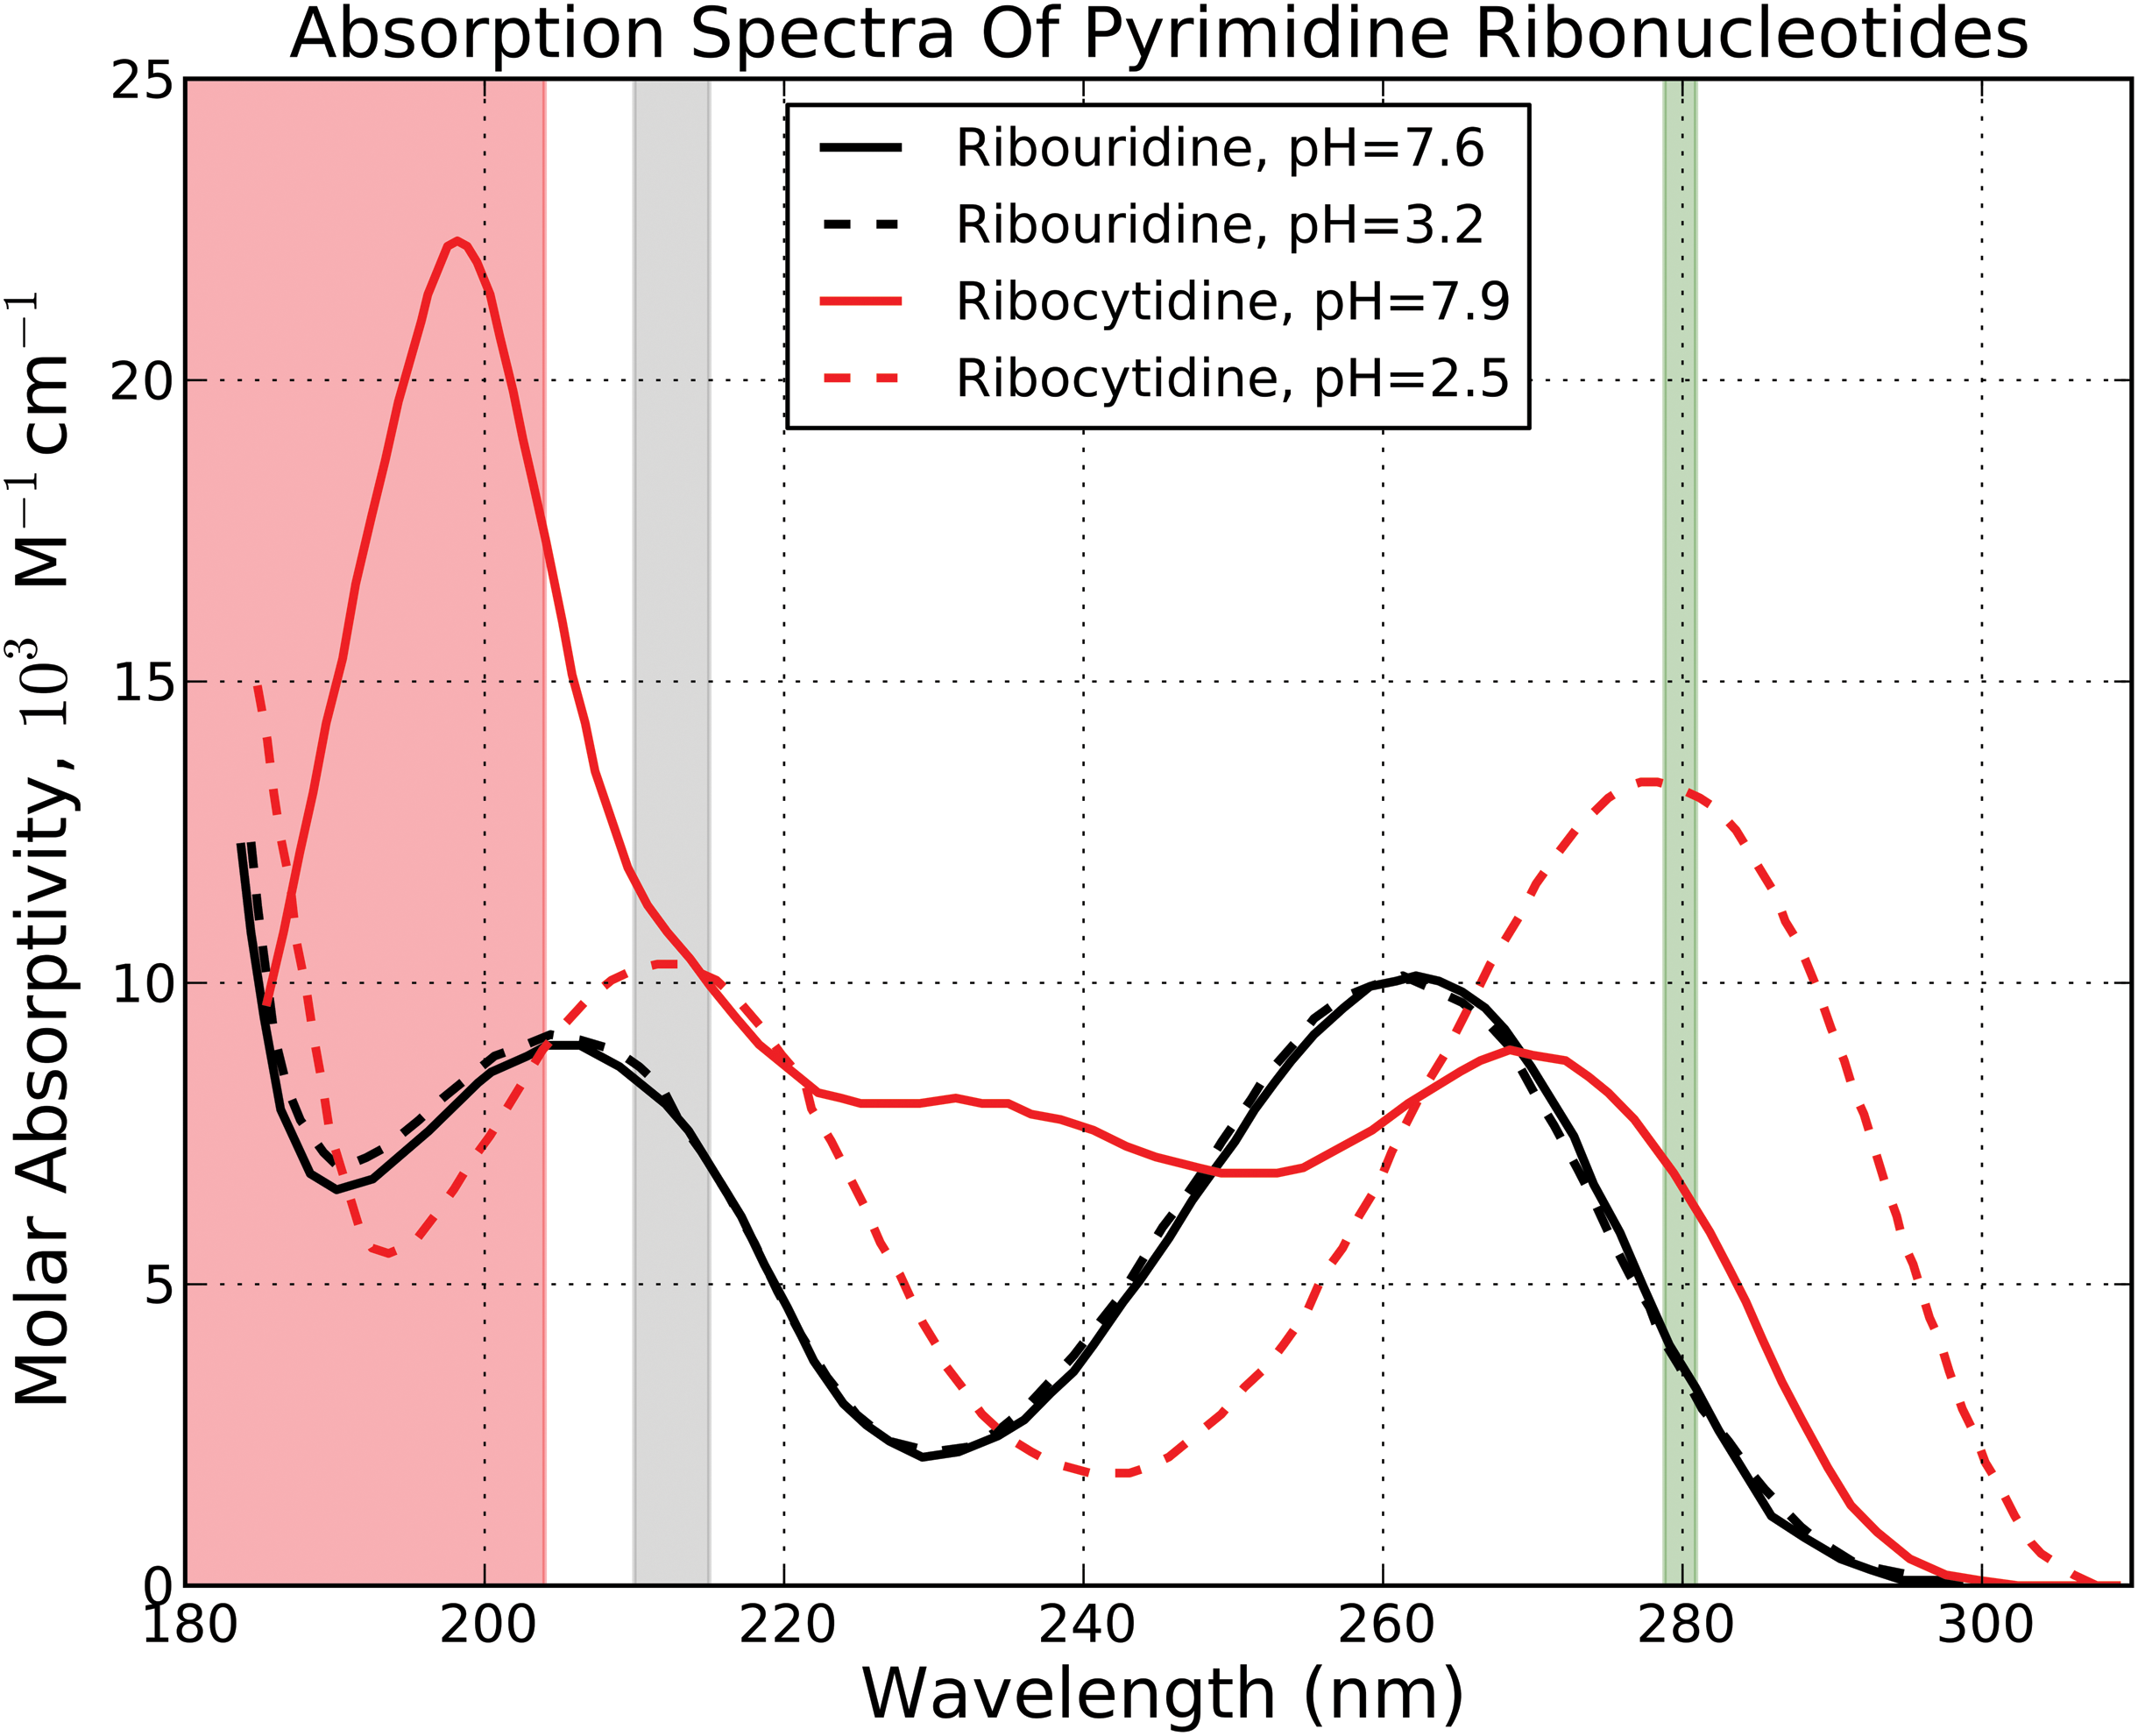
Absorption spectrum of pyrimidine ribonucleotides at different pH values, taken from Voet et al. (1963). Shaded in red is the region of the spectrum shielded by the prebiotic atmosphere. Shaded in gray is the region of the spectrum corresponding to the 210–215 nm variability feature due to flaring from the work of Cnossen et al. (2007). Shaded in green is the region of the spectrum corresponding to the Mg II k, h line complex identified from the data of Thuillier et al. (2004). (Color graphics available online at
We perform a similar analysis with the Cnossen et al. (2007) young Sun flare models. We convolve their flaring and nonflaring models against the ribonucleotide absorption spectra from Voet et al. (1963). Integrated across λ = 200–300 nm, the variations in photoabsorption rates are 0.2–0.3%, with the minimum and maximum variation again corresponding to ribocytidine at pH = 2.5 and 7.9, respectively. As with solar cycle–driven variation in UV output, flare-driven variations in UV output can affect the ribonucleotide UV photoabsorption rate by up to 14% in a narrow band (5 nm), but integrated across λ = 200–300 nm variation in photoabsorption rates falls to <1%.
Overall, UV variability in the λ > 204 nm region of the emission spectrum of the young Sun that is relatively unshielded by atmospheric absorbers (especially CO2) is low, usually at the level of a few percent or less. UV variability within individual features can vary at the level of tens of percent, but these features are generally narrow, muting their effect on the total UV power being received by Earth.
3.2. Attenuation of UV light by aqueous environments
Prebiotic chemistry, both on Earth and in space (e.g., on meteorite progenitors, see Glavin et al., 2012) is thought to have occurred in an aqueous environment. In this section, we explore attenuation of incident UV flux by water.
For the absorption spectrum of water in the UV, we draw upon the data presented by Segelstein (1981), compiled by Querry et al. (1991), and made available online by Jonasz (2007). This work aggregated previous measurements of the absorption coefficient κ(λ) of liquid water near standard conditions from 101 to 1010 nm and confirmed their validity with an electron sum rule calculation. Figure 3 presents the UV spectrum of the 3.9 Ga Sun derived from the models of Claire et al. (2012) filtered through varying depths of water. Water absorption rises sharply at wavelengths shorter than 173 nm, with 1 μm of water enough to reduce stellar flux by a factor of 10 or more for λ < 168 nm. One micrometer of water is enough to extinguish transmission by 6 orders of magnitude at λ = 160 nm, while 78 m of water is required to extinguish flux at wavelengths λ = 300 nm by an equivalent amount. This high level of absorption is due to a broad, strong absorption band (peaking at 65 nm) corresponding to a superposition of transitions associated with the photoionization and photodissociation of water (Wozniak and Dera, 2007). For example, incident photons with wavelength 180 nm and shorter have enough energy to promote the 1b1 → 4a1 orbital transition, dissociating water to OH + H; for more details, see the work of Mota et al. (2005) and Wozniak and Dera (2007). The implication is that even a thin film of water on an asteroid is enough to shield mineral chemistry from XUV flux (λ < 168 nm), but midrange UV flux (λ > 168 nm) can readily penetrate. For comparison, the fatty acid vesicles studied as model systems for protocell membranes in work such as that of Mansy et al. (2008) and Hanczyc et al. (2003) are of order 100 nm (0.1 μm) in size.
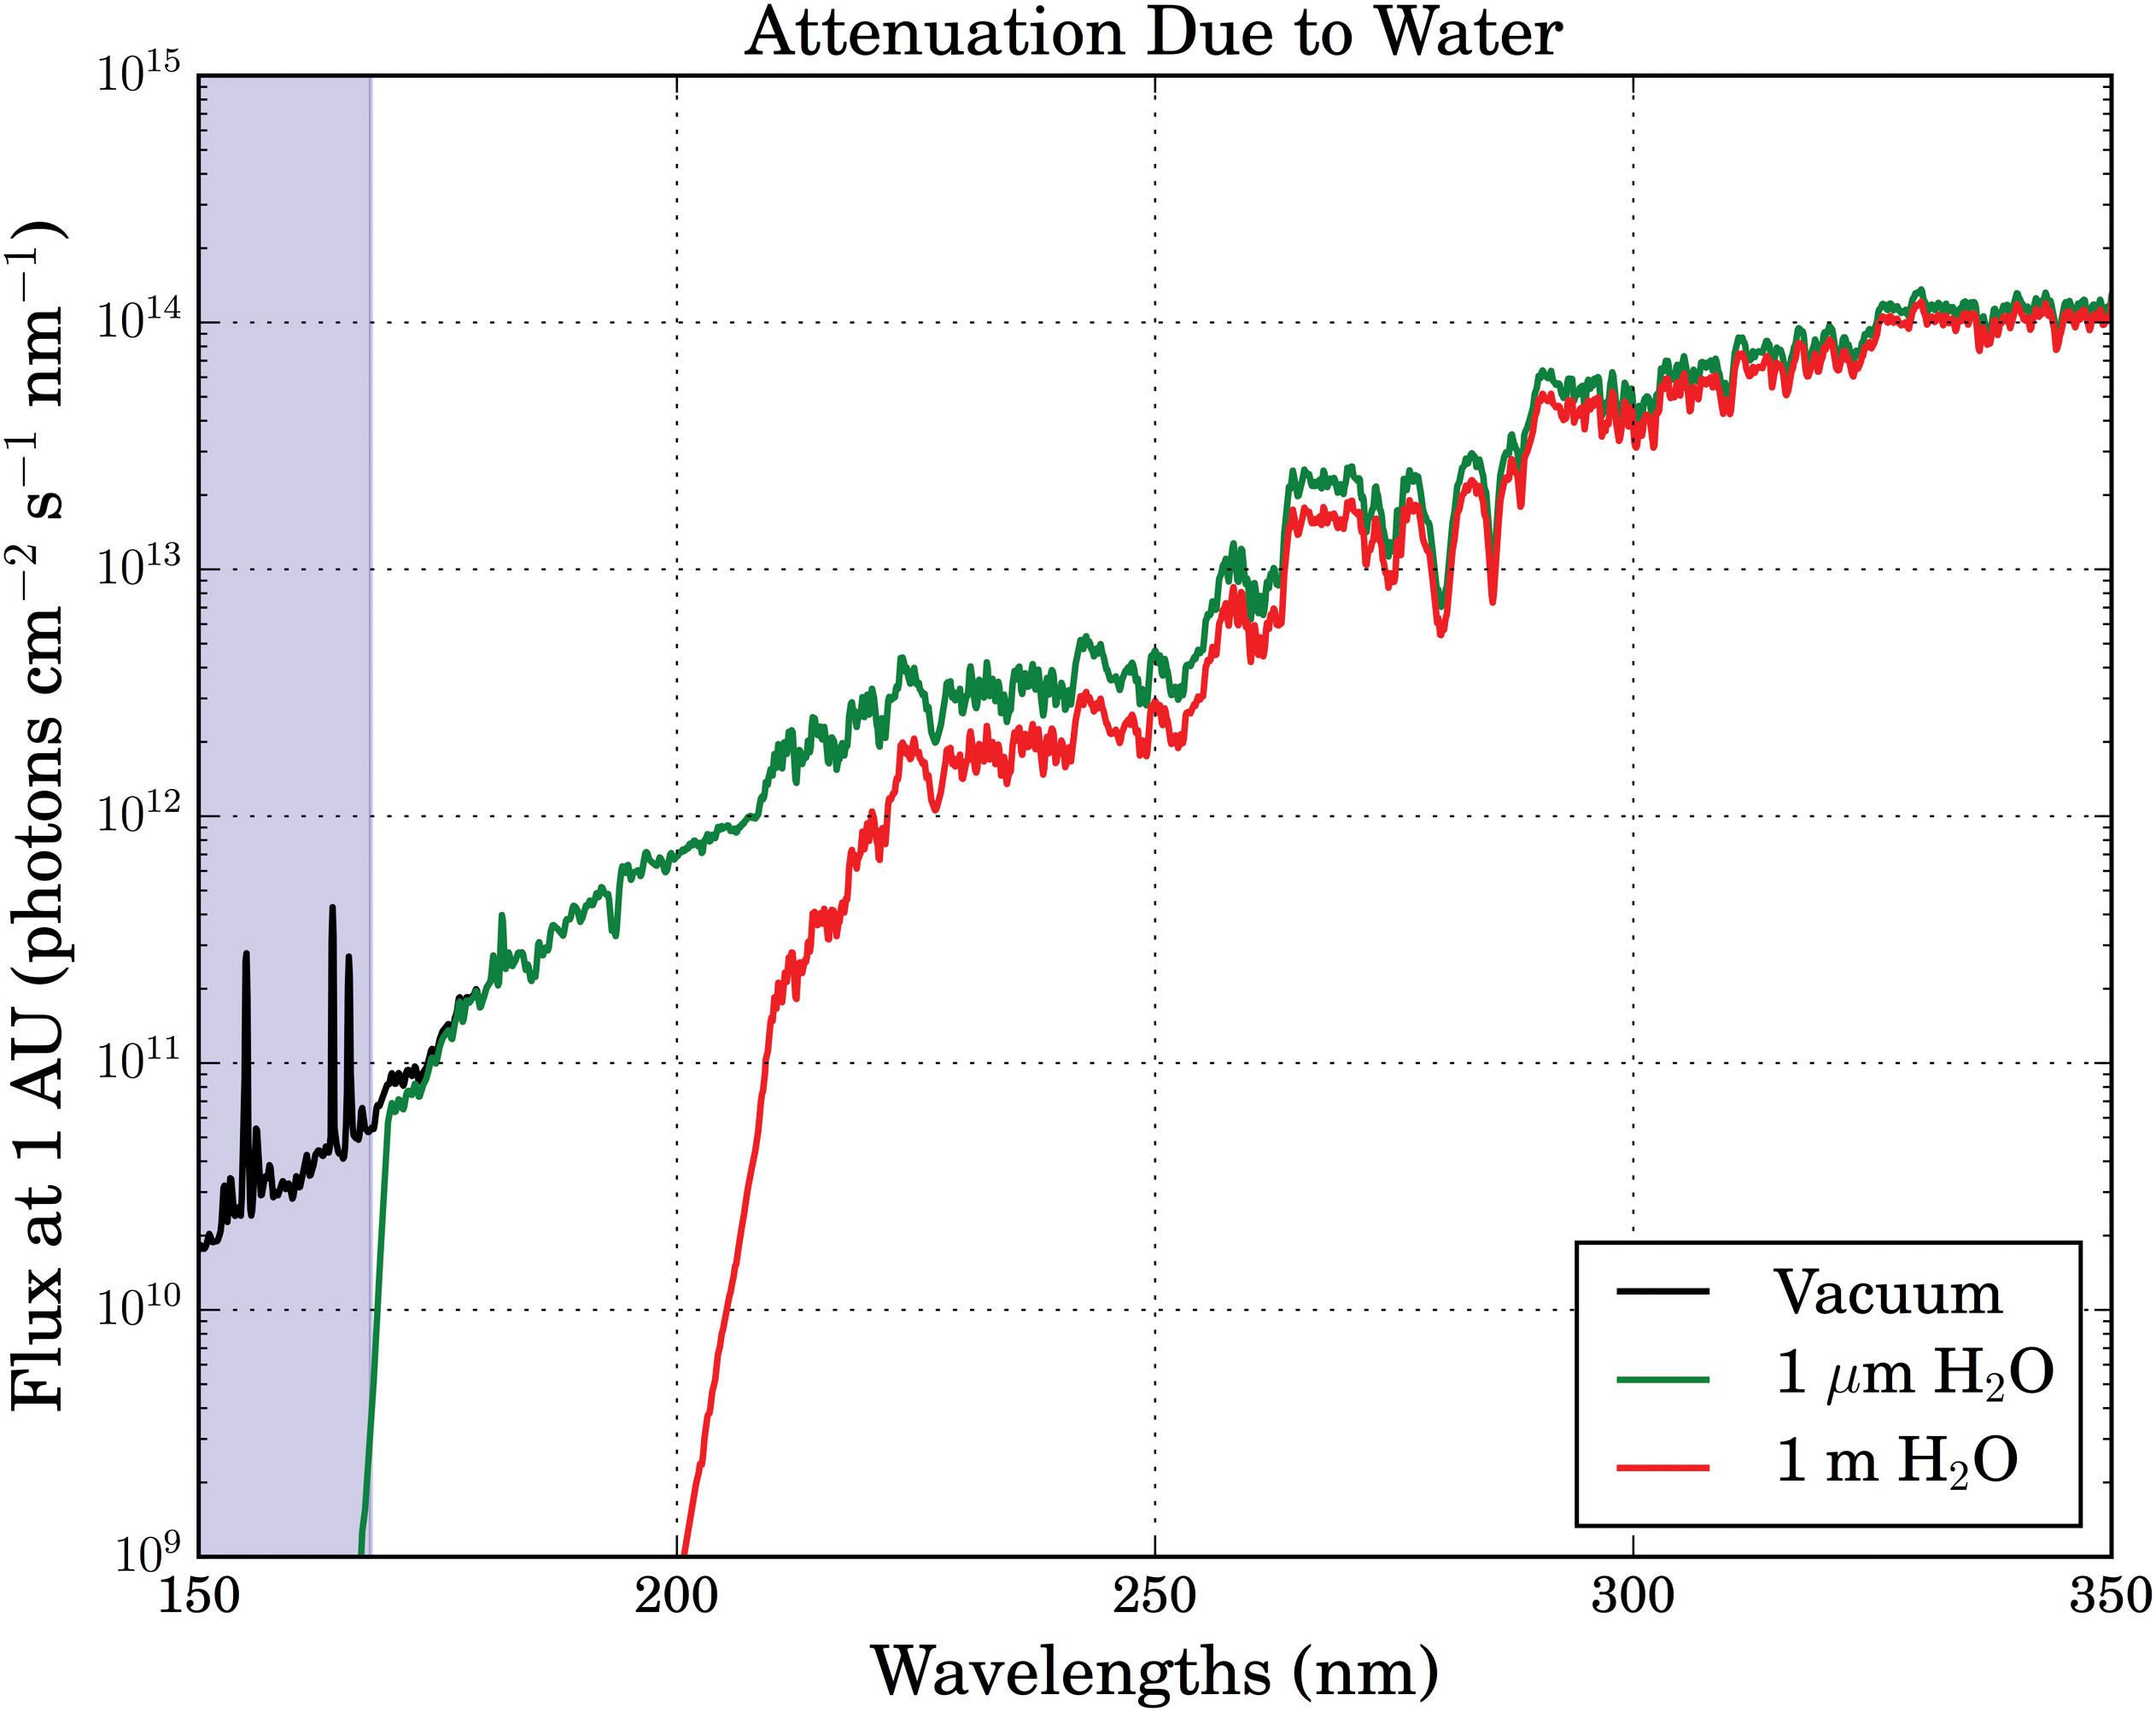
Attenuation of UV spectrum of the 3.9 Ga Sun through water layers of varying thickness. The spectral region shielded by absorption from a 1 μm layer of water is shaded in blue. (Color graphics available online at
The results described above are for pure water. Prebiotic synthesis requires solutes as input for chemical reactions. We use modern seawater as a guide to approximate how dissolved constituents might affect the absorption of a water layer. Ninety-six to ninety-seven percent of seawater molecules are H2O. The remaining 3–4% of molecules are dominated by dissolved salts, but also suspended organic and inorganic particulates and dissolved bioresidue (“Gelbstoff”) (Jonasz and Fournier, 2007; Wozniak and Dera, 2007). The addition of salts causes increased absorption in the far UV, as well as enhanced scattering due to variations in refractive index due to salt concentration variations (Cleaves and Miller, 1998; Jonasz and Fournier, 2007). Bioresidue (“Gelbstoff”) also absorbs in the UV, but in pre-abiogenesis waters it would not be present. Scattering due to suspended particulates is also an important effect in seawater, with particle sizes ranging from roughly 0.01 to 1000 μm (Jonasz and Fournier, 2007). In general, inorganic suspensions are weak absorbers in the UV (Wozniak and Dera, 2007). In summary, inorganic dissolved and suspended minerals have the effect of enhancing UV attenuation; hence, the transmitted UV flux presented here should be interpreted as an upper bound to prebiotic conditions.
3.3. Attenuation of UV light by the terrestrial atmosphere
Estimating the UV input on the terrestrial surface requires computing the attenuation of UV flux due to the atmosphere. As Earth in the prebiotic era would have lacked the biogenic oxygen and ozone that play a dominant role in UV attenuation in modern Earth's atmosphere, we are unable to use modern Earth's atmosphere as a proxy for young Earth's and must instead estimate an atmospheric model from available information.
3.3.1. Constraints on the prebiotic atmosphere
Relatively little is known about Earth's atmosphere in the prebiotic (∼3.9 Ga) era. Synthesizing the available constraints (see Appendix B), we find that what evidence we have points to an N2-CO2 dominated atmosphere, with a high enough concentration of greenhouse gases (e.g., CO2, CH4) to sustain liquid surface water. Volcanogenic gases such as SO2 may also have been important constituents during periods of high volcanic activity, and for a warm planet water vapor would also be an important atmospheric constituent. We therefore focus on these four gases as the major absorbers to consider when estimating UV flux to the planetary surface.
We note that Wolf and Toon (2010) suggested the possibility of hydrocarbon hazes in providing planetary greenhouse warming, similar to what is seen on Titan today. Such hazes could act as UV shields. However, the formation of such hazes requires high CH4 production rates, corresponding to a CH4/CO2 abundance ratio of 0.1 (DeWitt et al., 2009). Given the absence of biogenic production and lack of significant volcanic production of CH4 based on the redox state of the mantle, such CH4 production rates are unlikely. We consequently do not focus on hydrocarbon hazes in estimating atmospheric attenuation of UV light.
3.3.2. Attenuation due to the prebiotic atmosphere
To estimate atmospheric attenuation due to the prebiotic atmosphere, we use the atmospheric model of Rugheimer et al. (2015). This model uses a coupled radiative-convective model that includes the effects of climate, photochemistry, and radiative transfer. This model uses stellar input equivalent to the Sun at an age of 3.9 Ga as modeled by the Sun Through Time project (Claire et al., 2012), squarely within the 3.5–4.3 Ga age range of plausible abiogenesis. It assumes an overall atmospheric pressure of 1 bar and atmospheric mixing ratios of 0.9, 0.1, and 1.65 × 10⁻⁶ for N2, CO2, and CH4, respectively. It also assumes modern abiotic outgassing rates of gases such as SO2 and H2S, and includes humidity (water vapor). Hence, the model includes the four key absorbers identified in the previous section. The nitrogen partial pressures adopted in the model are consistent with the constraints measured by Marty et al. (2013) for the 3.5 Ga Earth. The high CO2 abundance relative to the present day is consistent with an atmosphere dominated by volcanic outgassing. The trace methane level is adopted from the work of Kaltenegger et al. (2007). When iterated to convergence, this model indicates a surface temperature above freezing, indicating consistency with the constraints from zircon that suggests at least transient surface liquid water on Earth during this era.
Figure 4 presents the attenuation of the UV flux of the 3.9 Ga Sun due to the primordial atmospheric model of Rugheimer et al. (2015). Compared to the present day, prebiotic Earth would have received much more >204 nm radiation due to the absence of UV-shielding oxygen. The planetary surface would still have been shielded from extremely shortwave radiation due to atmospheric CO2; this fiducial atmosphere reduces incident stellar flux by a factor of 10 or more for wavelengths shorter than 204 nm. These results are consistent with the prebiotic atmosphere study of Cnossen et al. (2007). High surface UV is also consistent with the findings of Farquhar et al. (2001) that primitive Earth was exposed to high UV.
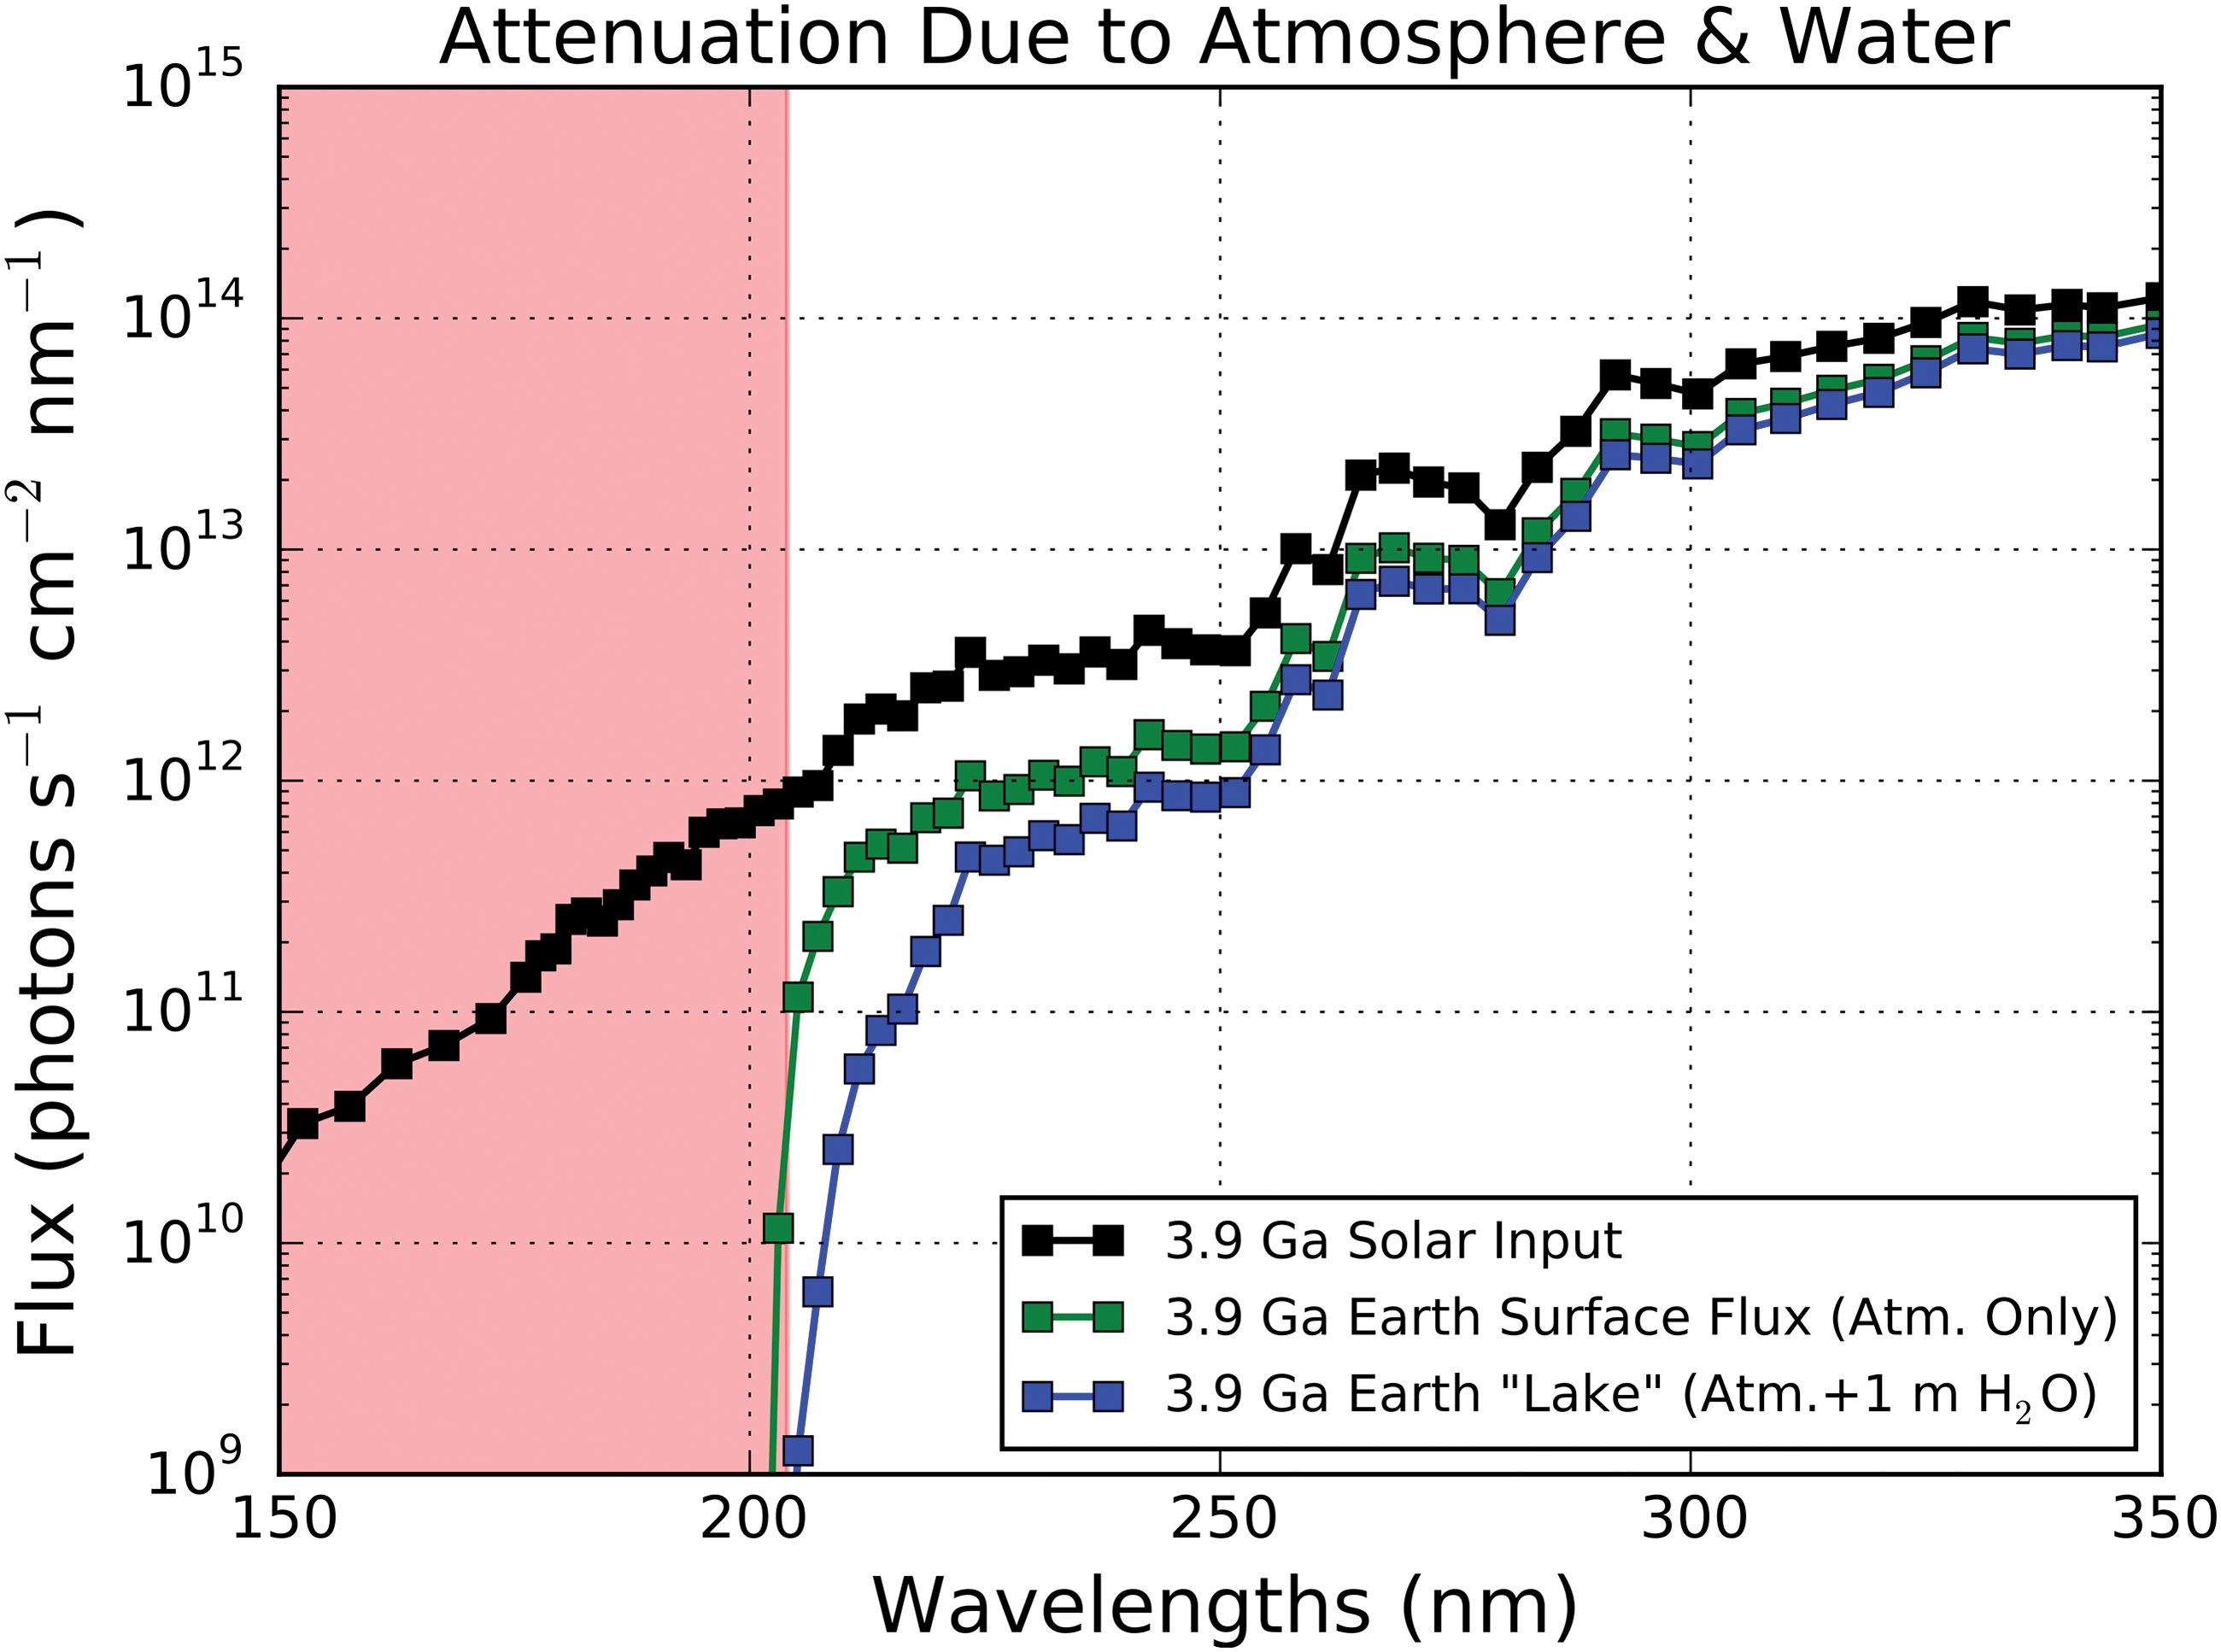
Attenuation of the 3.9 Ga solar UV spectrum due to the atmosphere modeled by Rugheimer et al. (2015), corresponding to the surface UV flux. Also shown is the surface flux attenuated by 1 m of water, corresponding to a surficial lake. The spectral region shielded by atmospheric absorption (primarily CO2) is shaded in red. (Color graphics available online at
Figure 4 also presents the attenuation of the surficial solar flux due to a 1 m water layer. For surface water layers of thickness ≥ 1 m, UV light with wavelengths up to 224 nm are additionally shielded out, meaning that for water layers with depth ≥ 1 m, UV light at wavelengths less than 224 nm is not relevant to prebiotic chemistry. For water column depths < 1 m, attenuation of UV at wavelengths shorter than 200 nm is dominated by atmospheric absorption. At the 254 nm wavelength range probed by mercury lamps, the attenuation due to this fiducial prebiotic atmosphere is equivalent to that provided by 127 cm of liquid water. Hence, water absorption dominates the UV environment at 254 nm at depths greater than 127 cm (e.g., in the deep ocean).
This atmospheric model assumes modern levels of volcanogenic input of SO2 and H2S. It is plausible that volcanism levels and, hence, SO2 and H2S abundances were at least transiently higher on young Earth (see e.g., Kaltenegger and Sasselov, 2010). Higher SO2 and H2S levels could significantly impact the surface UV environment because these gases are better UV shields than CO2 (see Fig. 5).
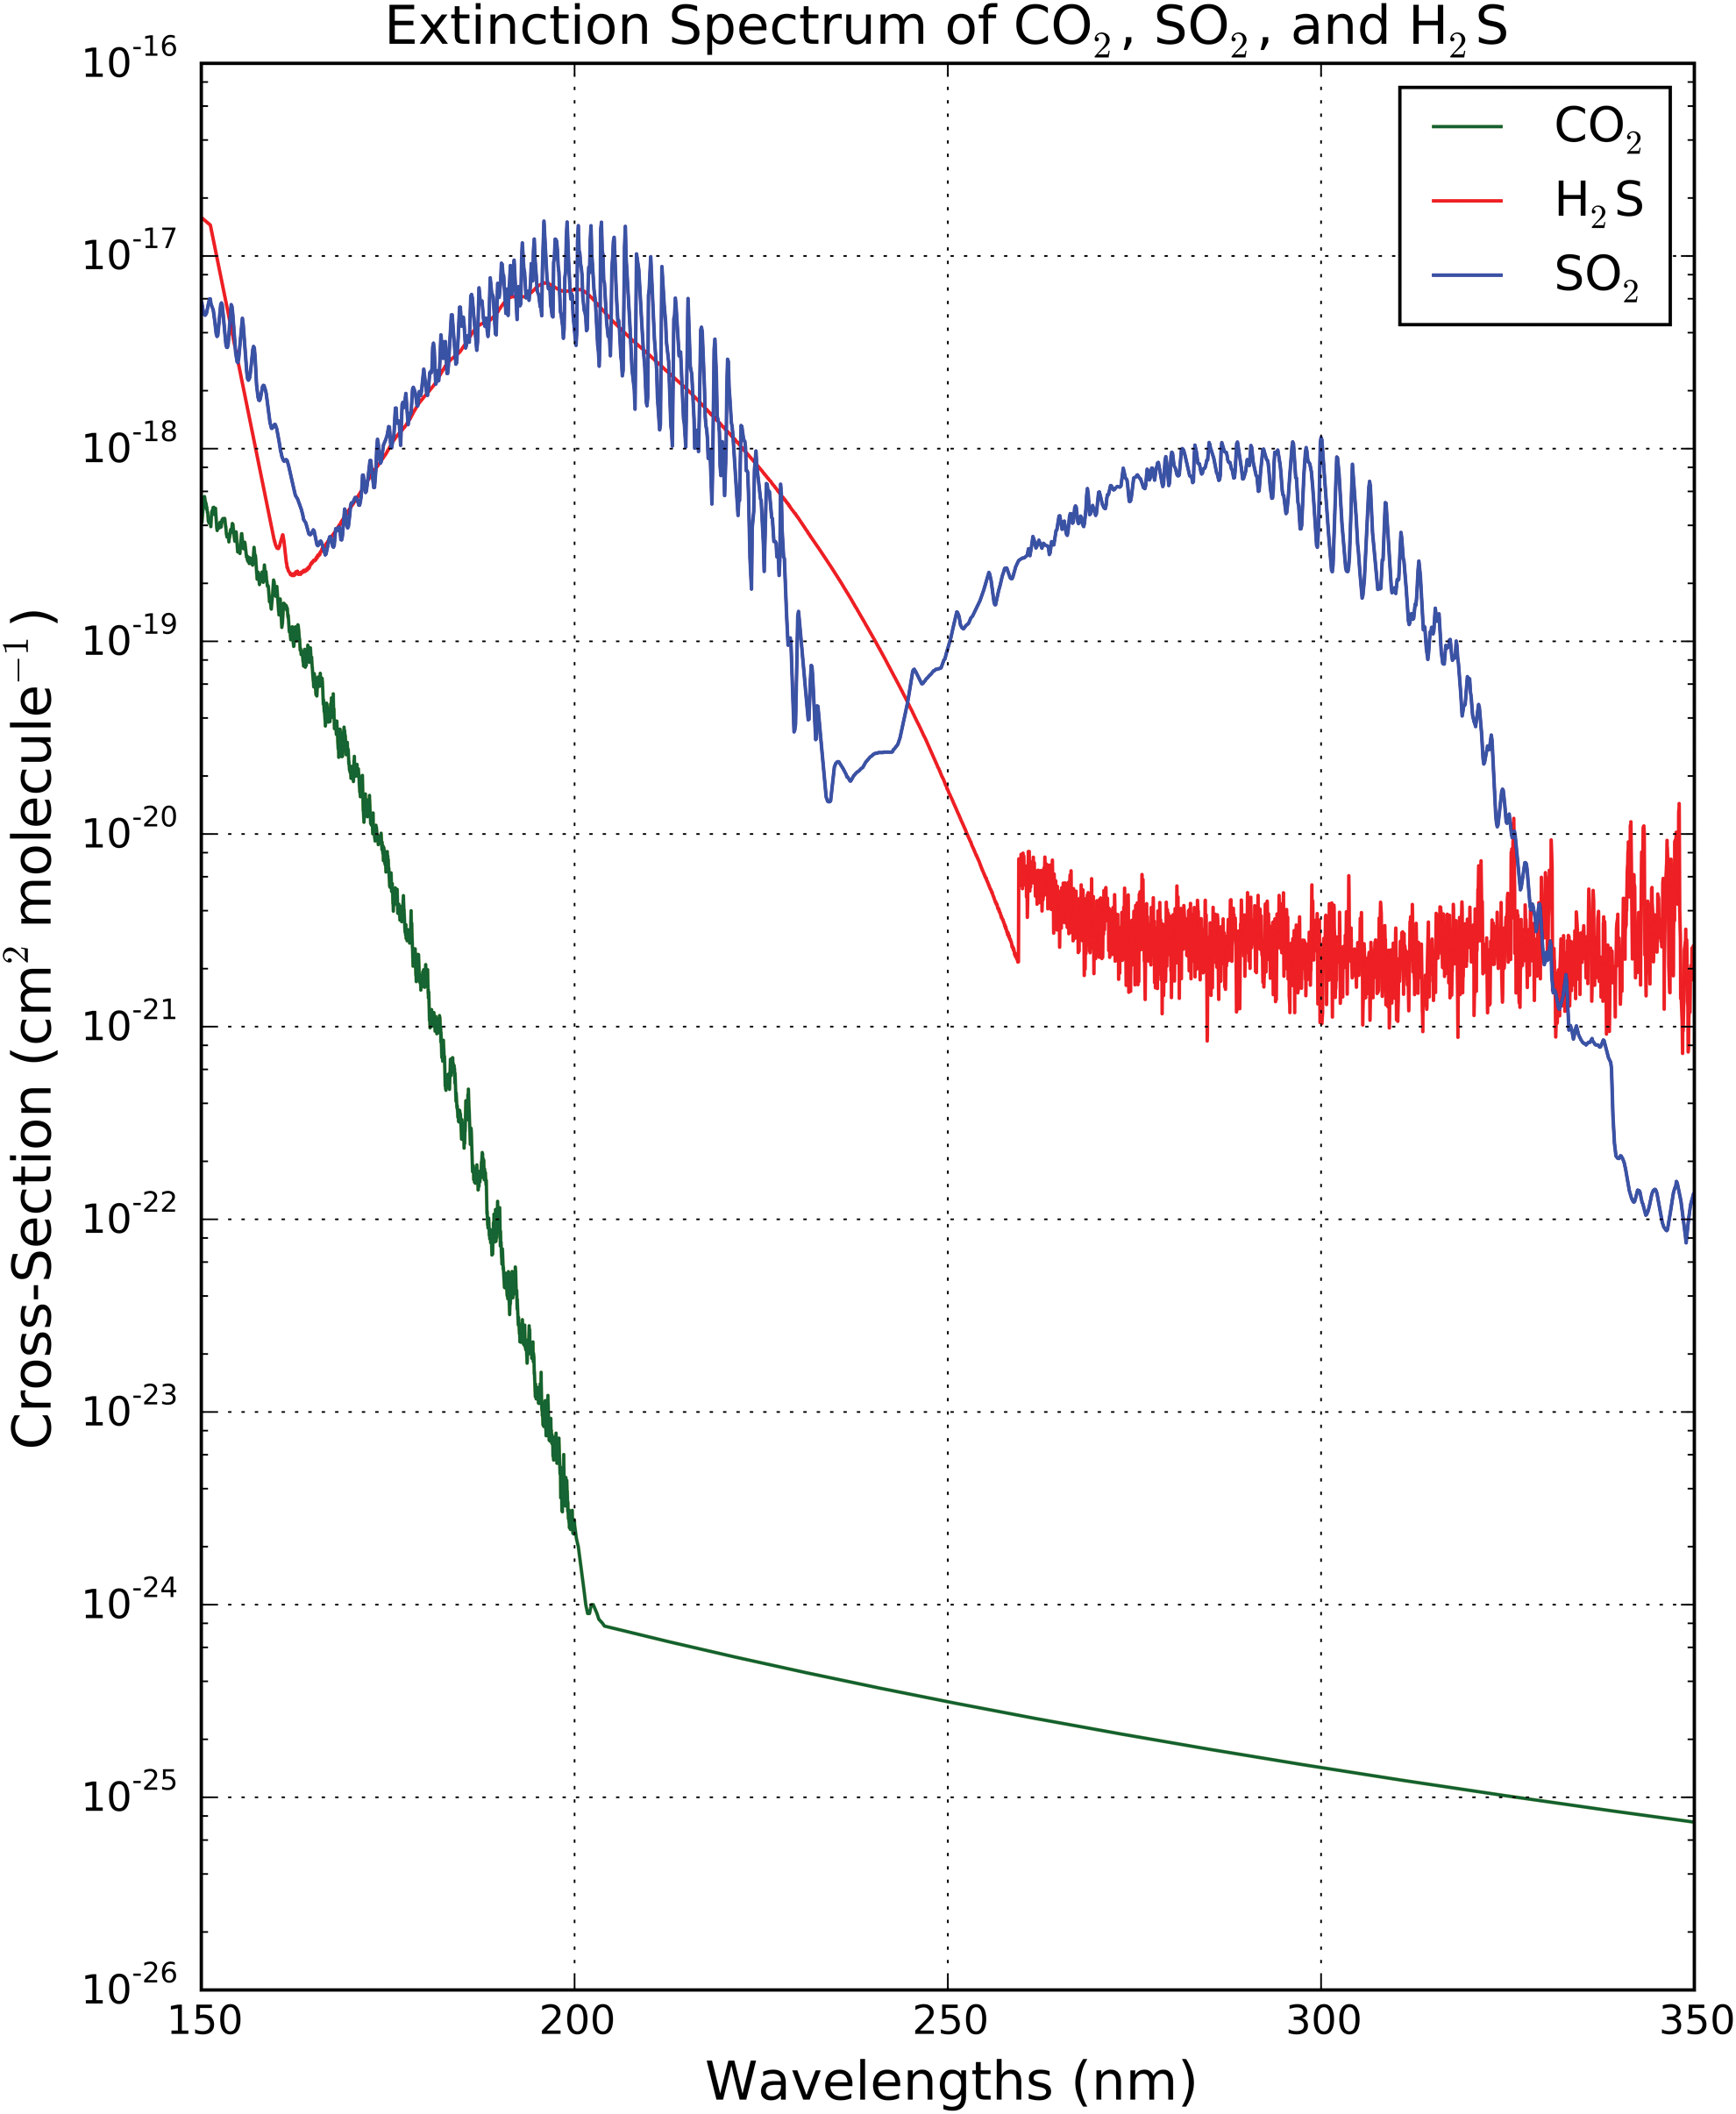
UV extinction cross sections of SO2, H2S, and CO2. Appendix E describes the sources of these cross sections. (Color graphics available online at
We are not aware of existing empirical constraints on SO2 and H2S levels at 3.9 Ga. We can place a theoretical upper limit on the abundance of SO2 by the work of Halevy et al. (2007), who explored potential sulfur cycle chemistry on Mars. Their work suggested that, at SO2 levels of 10−6 to 10−4, SO2 starts supplanting CO2 as the controlling agent for temperature, precipitation, weathering, and aquatic reservoir pH chemistry; that is, a sulfur cycle starts dominating over the carbon cycle. We take 10−4 as the upper bound on SO2 level at 3.9 Ga. We constrain H2S levels by assuming the [H2S]/[SO2] outgassing ratio to be the same as the present-day value. Halmer et al. (2002) found the annual volcanic SO2 and H2S fluxes to the atmosphere to be 15–21 × 1012 g and 1.5–37.1 × 10¹² g, respectively, corresponding to an [H2S]/[SO2] ratio of .29–9.9. We therefore adopt an upper bound of 10−3 on H2S levels at 3.9 Ga.
For λ = 200–300 nm, σSO2/σCO2 = 3 × 10⁶. At an SO2 level of 10−4, [SO2]/[CO2] = 10−3. At this SO2 level, attenuation from SO2 would outpace extinction from CO2 by 3 orders of magnitude. Similarly, integrated from 200 to 300 nm, σH2S/σCO2 = 2 × 10⁶. At an H2S level of 10−3, this corresponds to extinction from H2S outpacing extinction from CO2 by 4 orders of magnitude. It is difficult to confidently describe the impact of epochs of high volcanism on the UV surface environment, given the uncertainties in SO2/H2S levels as well as secondary photochemical effects, for example, formation of UV-shielding hazes (Tian et al., 2010; Wolf and Toon, 2010). Further modeling, with a framework capable of accounting for high SO2 cases, is required. However, it seems plausible that episodes of high volcanism may be low-UV epochs in young Earth's history.
3.4. CO2 shielding of prebiotic feedstock gases from photolysis
Theoretical and experimental explorations of prebiotic chemistry often assume the availability of feedstock gases, substances that may plausibly have been present in the prebiotic era that furnish biologically useful forms of elements relevant to prebiotic chemistry. Examples include CH4 as a source of reduced carbon and HCN as a source of reduced nitrogen (Zahnle, 1986).
One fundamental constraint on the abundance of such substances is photolysis. UV photolysis can destroy these compounds as they are formed, preventing them from being available to participate in prebiotic chemistry. UV attenuation from high CO2 atmospheres, like the 0.1 bar CO2 atmosphere invoked by Rugheimer et al. (2015), may be capable of shielding these gases from photolysis. However, such high CO2 atmospheric models are ad hoc models: the CO2 level is assumed. Effects such as the carbon cycle may present geophysical sinks not considered in these models that may make high CO2 levels impossible to sustain. We adopt such ad hoc models because they are the best guess we have at conditions at 3.9 Ga. However, from the point of view of understanding what feedstock gases are plausibly accessible for prebiotic chemistry, it behooves us to consider how sensitive the abundance of some of these gases is to the CO2 level.
In this section, we estimate the levels of CO2 required to quench direct photolysis of the prebiotic feedstock gases methane and HCN. These molecules are often included in prebiotic chemistry studies, and photolysis is a major sink for both. We conduct this study by estimating the abundance of these gases under equilibrium conditions using a simple 1 source/1 sink model, and computing the CO2 column density required to attenuate incoming UV flux to the point at which their abundances can build up to varying levels.
We assume the source of methane/HCN to be abiotic geochemical fluxes, and we assume the sink to be UV photolysis. To gain traction on the problem, we assume an isothermal atmosphere of ideal gases in hydrostatic equilibrium. Following Rugheimer et al. (2015), we take our young Earth atmosphere to be N2/CO2-dominated with a surface pressure of 1 bar. We assume the mixing ratio of the feedstock gas under consideration to remain constant until a height z
0, whereupon it goes to zero. Lastly, we assume the feedstock gas population to be optically thin; that is, we ignore self-shielding. This means our estimates will be upper bounds on the amount of CO2 required to permit a given methane/HCN level. We take our top-of-atmosphere input φ
0 to be the UV spectrum of the 3.9 Ga Sun computed from the models of Claire et al. (2012), spanning a wavelength range of 1–300 nm at 0.1 nm resolution. We obtain our CO2 cross sections σ
CO2(λ) from Huestis and Berkowitz (2010), who compile CO2 cross sections at 300 K from 0.12 to 201.6 nm. Appendix C presents the detailed calculations used to compute these estimates. The code used to implement these calculations is available at
We emphasize that these calculations are not intended as realistic models of early Earth's atmosphere. Rather, they are intended to estimate the column density of CO2, N CO2, that is required to quench photolysis to the degree required to build up the surficial partial pressure of a given feedstock gas to a level P gas. We emphasize that achieving this CO2 level does not automatically imply that the gas will build up to this degree; rather, if CO2 levels build up to or past N CO2, the constraint of photolysis on feedstock gas buildup to P gas is removed, though other constraints might remain.
3.4.1. CO2 shielding of CH4 from photolysis
Methane is important to prebiotic chemistry. Methane constitutes a reservoir of reduced carbon potentially useful to the synthesis of prebiotically interesting molecules (see, e.g., Zahnle, 1986; Ferris and Chen, 1975). Indeed, early prebiotic chemistry studies, including the Miller-Urey experiment, were conducted in reduced gas mixes with methane as a major constituent (Kasting and Brown, 1998). CH4 levels indirectly control the local oxidation state, affecting the prebiotic chemistry that can proceed. The buildup of methane is limited by photolytic processes, including direct photolysis as well as interaction with O and OH radicals (whose production is also dominated by photolysis) (Rugheimer et al., 2015). CO2 shielding can protect methane lower in the atmosphere from photolysis.
We estimate the column density of CO2, N CO2, required to shield CH4 buildup to a level P CH4 by the formalism presented in Appendix C. We choose z 0 = 50 km because the model of Rugheimer et al. (2015) shows a falloff in CH4 mixing ratio at this altitude. We take the rate of supply of methane to the atmosphere, S, to be equal to the present-day abiotic atmospheric flux of methane. Emmanuel and Ague (2007) estimated the present-day abiotic flux of methane to the atmosphere from serpentinization at mid-ocean ridges, volcanic emission, and other geothermal sources to be S ∼ 2.3 Mt/y = 7.3 × 10⁴ g/s = 2.7 × 1027 s−1. For comparison, for a 1 M ⊕, 1 R ⊕ planet, Guzmán-Marmolejo et al. (2013) estimated a maximum abiotic methane production rate of 9.2 × 10⁴ g/s, which is consistent with the Emmanuel and Ague (2007) estimate to 26%. We adopt the Emmanuel and Ague (2007) estimate for S. We obtain our methane cross sections from Au et al. (1993), who provided cross sections from 5.6 to 165 nm for 298 K methane. The methane cross-section data set the limits of the wavelength range considered in this calculation; that is, we calculated photolysis due to absorptions in the range of 5.6–165 nm.
We evaluate P CH4(z = 0) for various values of N CO2, holding all other parameters constant. We find that CO2 column densities of 1.04 × 1020 cm−2, 2.59 × 1020 cm−2, and 4.87 × 1020 cm−2 are required to remove photolytic constraints on methane surface pressures of 10−9, 10−6, and 10−3 bar, respectively. Under our assumption of an isothermal atmosphere in hydrostatic equilibrium, these column densities correspond via the formula P CO2 = N CO2 × kT/H to shielding CO2 partial pressures at z = z 0 = 50 km of 5.03 × 10⁻⁶, 1.25 × 10⁻⁵, and 2.35 × 10⁻⁵ bar, respectively. Note that this calculation implicitly assumes all attenuation of the solar signal occurs for z > z 0; hence, the CO2 surface pressure requirements estimated here are upper bounds. For N CO2(z = 50 km) ≥ 7.46 × 1020 cm−2 (P CO2(z = 50 km) > 3.60 × 10⁻⁵ bar), P CH4(z = 0) ≥ 1 bar. As this exceeds the total pressure of the atmosphere, this indicates that past this column density of CO2, photolysis is no longer a constraint on CH4 abundance. P CO2 = 3.60 × 10⁻⁵ bar at z 0 = 50 km of altitude corresponds to a surface partial pressure of CO2 of 1.49 × 10⁻² bar. Hence, a surface partial pressure of CO2 of 0.015 bar is required to shield CH4 from photolysis up to an altitude of z 0 = 50 km. On the other hand, if we are willing to restrict CH4 to the bounds of the modern troposphere (z 0 ≈ 17 km), then a CO2 surface partial pressure of only 2.77 × 10⁻⁴ bar is required to remove photolytic constraints on CO2 buildup. If we further restrict CH4 to the bottom 1 km of the atmosphere, then a CO2 surface partial pressure of 3.60 × 10⁻⁵ bar will suffice to shield the CH4. Table 1 summarizes these findings. At even 10−4 bar levels, CO2 is able to shield CH4 in the troposphere from photolysis. Hence, under our assumptions, we may expect photolysis to not constrain the availability of CH4 in chemistry in the lower atmosphere for a wide range of CO2 surface pressures.
3.4.2. CO2 shielding of HCN from photolysis
Like methane, HCN is a key feedstock gas for prebiotic chemistry. HCN provides a biologically accessible source of reduced nitrogen (Zahnle, 1986). Its presence has been invoked for a variety of prebiotic chemistry studies (see, e.g., Ferris and Hagan, 1984; Orgel, 2004; Ritson and Sutherland, 2012).
Following Section 3.4.1, we estimate the column density of CO2, N CO2, required to shield HCN buildup to a level P HCN by the formalism presented in Appendix C. Following Zahnle (1986), we take the rate of supply of HCN to the atmosphere, S, to be equal to 0.1× the methane flux. We adopt the same value for the methane flux as in Section 3.4.1, so S ∼ 2.7 × 1026 s−1. We obtain our HCN cross sections from the work of Nuth and Glicker (1982), who provided cross sections from 100.5 to 299.5 nm. Based on Lee (1980), we assume that all absorptions lead to photolysis.
Unlike methane, which in the UV absorbs only at wavelengths shorter than 165 nm (Romanzin et al., 2005), HCN absorbs until 190 nm. Due to higher solar output and reduced CO2 shielding at these longer wavelengths, HCN absorbs orders of magnitude more photons than CH4 and suffers a concomitant increase in photolysis rates. As a result, much higher levels of CO2 are required to shield equivalent amounts of HCN. Indeed, while the column density of CO2 required to shield CH4 from photolysis up to an altitude of z 0 = 50 km corresponds to a CO2 surface pressure of 0.015 bar, the amount of CO2 shielding required to remove photolytic constraints on HCN at this altitude would correspond to 4.75 bar of CO2 at the surface—far exceeding the 0.1 bar of surface CO2 assumed in our ad hoc model atmosphere.
However, if we restrict HCN to the bounds of the modern troposphere (z 0 ≈ 17 km), absorption corresponding to a much lower surface pressure of CO2 is required to shield HCN from photolysis. At z 0 = 17 km, CO2 column densities of 2.30 × 1020 cm−2, 4.78 × 1022 cm−2, and 1.37 × 1023 cm−2 are required to remove photolytic constraints on HCN surface pressures of 10−9 bar, 10−6 bar, and 10−3 bar, respectively. For N CO2 > 2.35 × 1023 cm−2, P HCN > 1 bar, indicating the photolytic constraint on HCN has been lifted. This corresponds to P CO2(z = 17 km) = 1.11 × 10⁻² bar, and P CO2(z = 0) = 8.81 × 10⁻². Table 2 summarizes the level of CO2 required to remove the constraint of photolysis on HCN up until different heights z 0. Overall, while very high (>1 bar) levels of CO2 are required to shield HCN from photolysis at high altitudes (z 0 = 50 km), CO2 levels of ≈ 0.1 bar are adequate to remove photolytic constraints on HCN in the troposphere (up to z 0 = 17 km), and levels of 0.01 bar can shield HCN below z 0 = 1 km. Compared to CH4, much higher levels of CO2 are required to shield HCN from photolysis, and photolysis constrains HCN to be lower in the atmosphere than CH4. Under our assumptions, surface CO2 levels corresponding to our ad hoc prebiotic atmospheric model (0.1 bar) are adequate to shield HCN in the troposphere from photolysis.
4. Discussion
4.1. Lessons for laboratory simulations
The prebiotic UV environment, both in space and on the terrestrial surface, was likely characterized by broadband UV exposure. On the ground, the terrestrial atmosphere will shield UV radiation shortward of 204 nm. However, there remains high UV throughput at wavelengths longer than 204 nm, even with additional shielding from layers of water as much as a meter thick. Sites of relevant prebiotic chemistry in space will lack this atmospheric shielding. However, even micron-thick layers of water will shield out UV radiation shortward of 168 nm.
This yields a few immediate lessons for prebiotic chemistry simulations involving UV light. For simulations of prebiotic chemistry on Earth, wavelengths shorter than 204 nm are not accessible. Lamps that operate at such wavelengths should therefore not be used as UV sources in prebiotic simulations. For example, ArF eximer lasers (193 nm) (e.g., Pestunova et al., 2005) and Hg lamps with strong emission at the 184.9 nm line (e.g., Ferris and Chen, 1975) are disfavored for use in simulations of surficial or near-surficial prebiotic chemistry. Similarly, for studies of aqueous chemistry on bodies not shielded by an atmosphere, lamps with emission shortward of 168 nm are disfavored.
More generally, energy is delivered to the prebiotic environment along a broad UV band. Experiments that use narrowband lamps risk under-activating chemical pathways with photoactivation curves that are not coincident with the lamp emission peaks, while over-activating pathways whose photoactivation curves are coincident with lamp emission. As such, broadband UV sources such as xenon arc-discharge lamps should be favored over narrowband sources in prebiotic chemistry. Such broadband sources should be fitted with filters to remove λ < 204 nm and λ < 168 nm radiation, as appropriate.
Estimates of UV variability derived from the modern Sun and from flare models of κ1 Ceti suggest that narrowband variability is low, generally on the order of a few percent or less and never more than ∼20%. Integrated from 200 to 300 nm, this corresponds to a <1% variance in the number of photons absorbed by biomolecules such as ribonucleotides. Based on these data, we argue that stellar UV variability is a less important phenomenon to consider when designing laboratory studies of prebiotic chemistry.
In addition to the differences in the shape of the input UV spectrum, UV lamps provide higher-intensity radiation than would have been accessible at the planetary surface. For example, the lamp apparatus used by Powner et al. (2007) and Powner et al. (2009) can be expected to deliver 6 × 10¹⁵ photons/s/cm2 to the sample integrated across its 254 nm emission feature at a distance of 1.9 cm. In comparison, we expect the surficial solar input to have delivered 4 × 10¹³ photons/s/cm2 from 250 to 260 nm, and 1 × 10¹⁵ photons/s/cm2 from 200 to 300 nm. Hence, we expect the lamp to deliver 1–2 orders of magnitude more flux to the sample than the natural environment. This difference has in the past been dismissed under the argument that increasing the UV flux serves simply to accelerate the UV photochemistry to timescales more readily accessible in the laboratory. However, care must be taken in the interpretation of such studies to ensure that nonlinearities at lower fluence levels (e.g., due to back reactions) do not disrupt the pathway. One way to probe such effects is to measure reaction rate as a function of fluence level and verify linearity down to natural fluence levels.
4.2. Narrowband versus broadband input
We have demonstrated that the natural prebiotic environment was characterized by broadband UV input, as compared to the narrowband input provided by sources like mercury lamps. However, the question remains as to the impact of using narrowband lamps instead of more realistic natural input: are narrowband sources viable proxies for prebiotic UV flux? We explore this question through the case studies of the Powner et al. (2009) and Ritson and Sutherland (2012) pathways.
4.2.1. Implications for Powner et al. (2009) process
The Powner et al. (2009) pathway for synthesis of activated pyrimidine ribonucleotides was derived under narrowband 254 nm emission from a mercury lamp. In this section, we explore whether this pathway can proceed under our modeled prebiotic UV input.
Ultraviolet light impacts the Powner et al. (2009) pathway in two ways. One is a relatively straightforward photohydration and deamination of cytosine, which is the mechanism for production of uracil. The second way is by destroying competitor pyrimidine nucleosides and nucleotides generated by the phosphorylation reaction. Nonbiogenic pyrimidine molecules generated along with the biogenic ribonucleotides photolyzed at higher rates than the biogenic molecules, amplifying the population of biogenic molecules over time. However, this phenomenon was observed only at 254 nm. It is unknown whether at different wavelengths competitor molecules might have higher survivability than the ribonucleotides, negating the amplification mechanism used in this pathway. It has been argued that the biogenic nucleobases emerged as informational polymers because of exceptional stability to UV radiation (see, e.g., Mulkidjanian et al., 2003). Under this hypothesis, ribocytidine and ribouridine are more photostable than competitor molecules across all wavelengths, in which case 254 nm radiation would be a good proxy for prebiotic UV input. However, this hypothesis has not been proven. It remains possible that, at other wavelengths, other competitor molecules might emerge as more stable than ribouridine and ribocytidine. In this case, 254 nm radiation would be a poor proxy for prebiotic UV input. Empirical measurements of nucleotide photostability as a function of wavelength are required to differentiate between these possibilities.
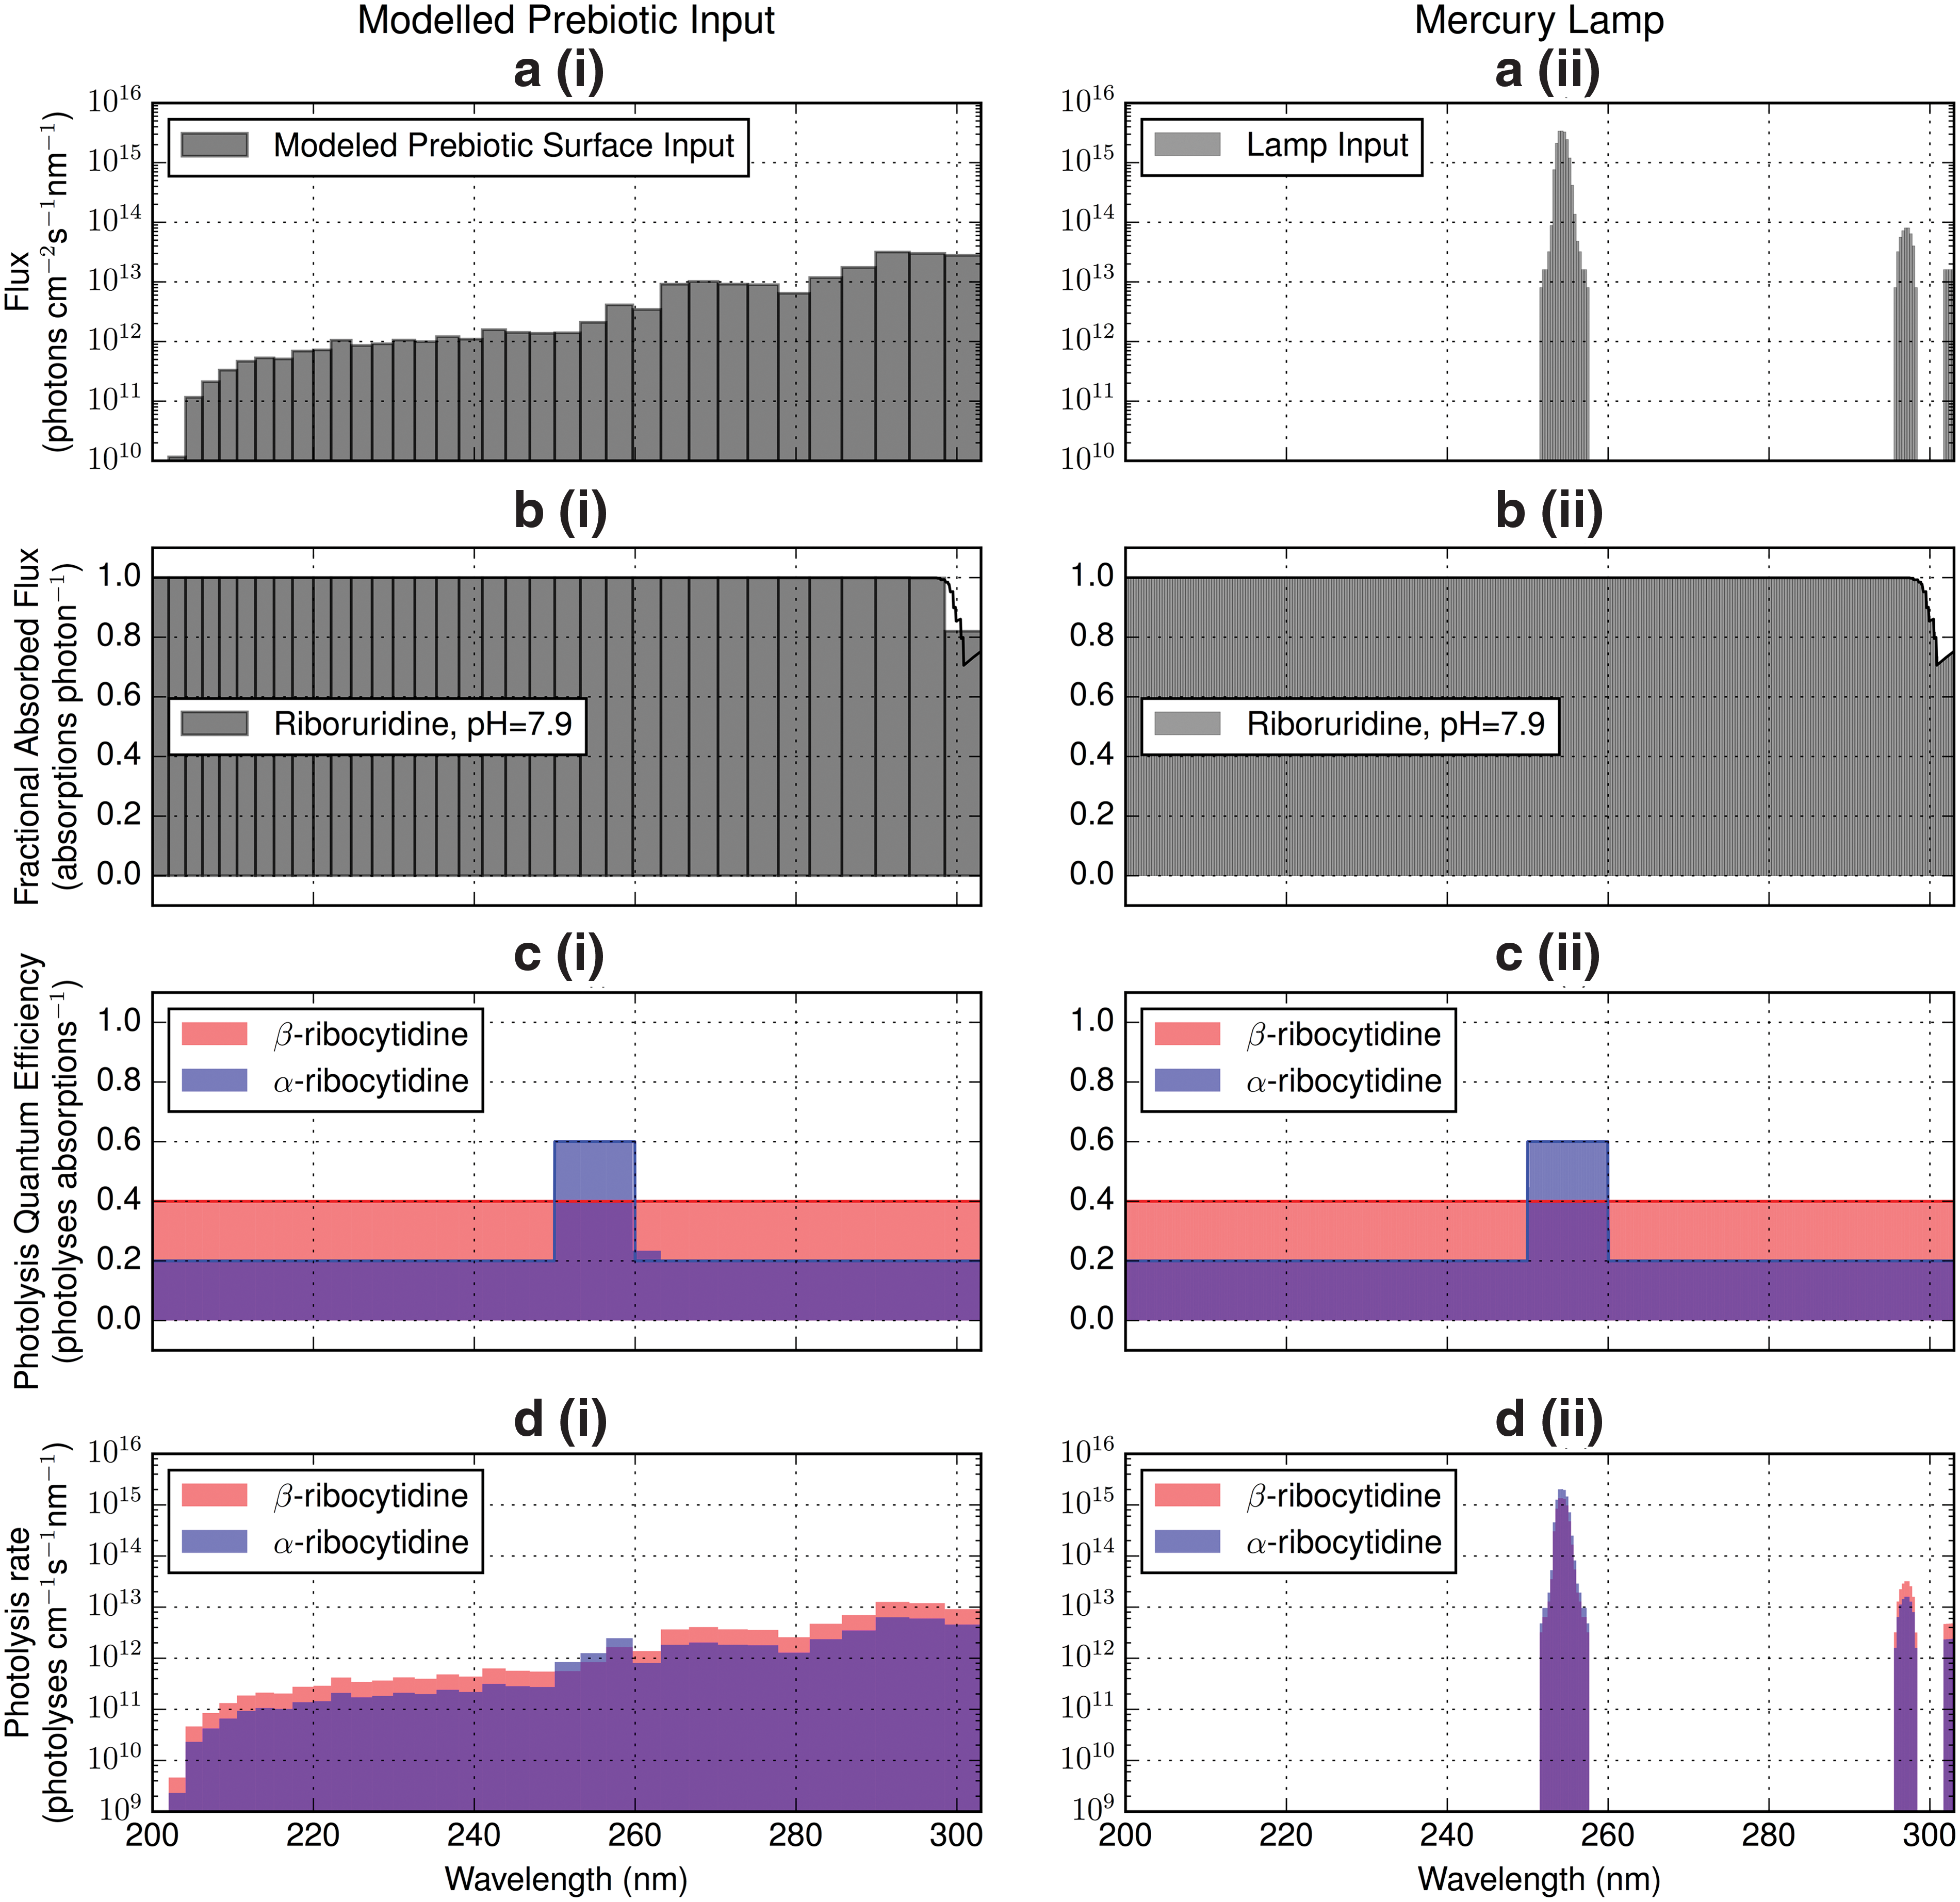
We illustrate this quantitatively with a numerical experiment. Powner et al. (2009) found irradiation to enhance the population of the biogenic β form of the molecule relative to the α form also produced previously in the synthesis pathway. This implies that the photolysis rate of the β form should be less than that of the α form. We compute photolysis rates for the α (nonbiogenic) and β (biogenic) stereoisomers of ribocytidine as a function of wavelength under irradiation by (1) a Pen-Ray mercury lamp of the type used by Powner et al. (2009) and (2) under modeled natural prebiotic input. To do so, we must define action spectra for photolysis of each of these molecules. These action spectra can be computed as the product of absorption spectra (fraction of incident photons absorbed) and quantum efficiency functions (QEFs, fraction of absorbed photons leading to photolysis). We assume that both forms of the ribocytidine molecule share the same absorption spectrum since they share similar chromophores, which we represent by the absorption spectrum of pH = 7.9 ribocytidine measured by Voet et al. (1963). For comparison, the Powner et al. (2009) experiments were conducted at pH = 6.5. As the QEFs for photolysis of α and β are not available, we assume functional forms for them. We represent the QEF of β-ribocytidine photolysis by a flat line at 0.4, and the QEF of α-ribocytidine photolysis by a step function with value 0.6 between 250 and 260 nm, and 0.2 elsewhere. We emphasize that these QEFs are not physically motivated and should not be taken to be representative of the true QEFs. Rather, they are constructed to illustrate the point that QEFs may exist that permit β-ribocytidine to be more stable than the α form at wavelengths accessed by the mercury lamp but not at other wavelengths.
Figure 6 presents the formation of the photolysis rate calculation. We represent the prebiotic flux with the emergent surface spectrum computed by Rugheimer et al. (2015), corresponding to the radiation environment on the surface following attenuation by the atmosphere. We represent the lamp flux by the emission spectrum of a Pen-Ray 90-0012-01 UVP mercury lamp emitting 4.4 × 10⁴ erg/s/cm2 at a distance of 1.9 cm integrated across the 254 nm line. We compute the fraction of incident flux absorbed as a function of wavelength via the molar absorptivities from the work of Voet et al. (1963); we assume a path length of 0.53 cm and a nucleotide concentration of 20 mM, chosen to accord with the experimental setup of Powner et al. (2009). At this concentration and path length, the absorption spectrum is optically thick across most of the wavelength range under consideration, implying the photolysis rate should depend only weakly on the spectral absorbance. We consider fluxes from 200 to 303 nm, chosen to encompass the 200–300 nm region of photochemical interest while avoiding truncating the wavelength bins of our computed prebiotic UV spectrum.
(
We convolve the two different incident flux distributions against the absorption spectrum and the assumed quantum efficiency curves to derive photoreaction rates as a function of wavelength. Figure 6 shows each of these input curves and the product of their convolution. Integrating over wavelength, we find that under these assumed QEFs, α-ribocytidine has a 47% higher photolysis rate under irradiation by lamp flux than β-ribocytidine, yielding the stability advantage to the biogenic β stereoisomer observed in the Powner et al. (2009) experiment. However, under irradiation by prebiotic UV input, α-ribocytidine photolyzes at a rate 46% lower than β-ribocytidine, meaning that under prebiotic input, the nonbiogenic stereoisomer would be amplified relative to the biogenic. This numerical experiment demonstrates that there exist QEFs consistent with the Powner et al. (2009) laboratory experiments that would nonetheless cause the reaction pathway to fail under exposure to a more realistic prebiotic UV environment. These results highlight the importance of employing realistic simulations of UV environments when conducting prebiotic chemistry studies. Additionally, it is important to characterize the wavelength dependence of the action spectra of the underlying photoprocesses of these pathways, for example, by repeating the experiment at different irradiation wavelengths using tunable UV sources and measuring yield. Measuring these action spectra permits characterization of the underlying photochemistry, enabling extrapolation from laboratory results to prebiotic settings.
4.2.2. Implications for Ritson and Sutherland (2012) process
The Ritson and Sutherland (2012) process also relies on narrowband mercury lamp emission at 254 nm. In this section, we explore how irradiation under our modeled natural prebiotic UV input would affect this process.
There are two presently postulated mechanisms by which UV light reduces HCN to drive the Ritson and Sutherland (2012) pathway. The first is the hypothesis outlined by Ritson and Sutherland (2012) whereby UV light photoionizes an electron from tricyanocuprate (I). In this case, any incident radiation at wavelengths shorter than a critical wavelength λc will drive this synthesis, where λc corresponds to a photon with energy equal to the work function of tricyanocuprate (I). Empirically, we know λc ≥ 254 nm, since the reaction proceeded under action of 254 nm radiation. Alternately, Banerjee et al. (2014) suggested that the pathway is driven by UV excitement of tricyanocuprate (I) from the S0 to the S1 state. The energy difference between these states is calculated to correspond to 265 nm; consequently, 265 nm radiation should be much more efficient than 254 nm radiation at promoting this transition, and the Ritson and Sutherland (2012) experiments may underestimate the reaction rate. As the models suggest that both λ > 254 nm and λ ≈ 265 nm radiation are abundant on the surface of primeval Earth, the Ritson and Sutherland (2012) pathway should function in both scenarios; however, depending on the nature of the mechanism, the difference between lamp and primeval input may drive significant differences in reaction rate. We note that two reductions are required to produce a single molecule of product.
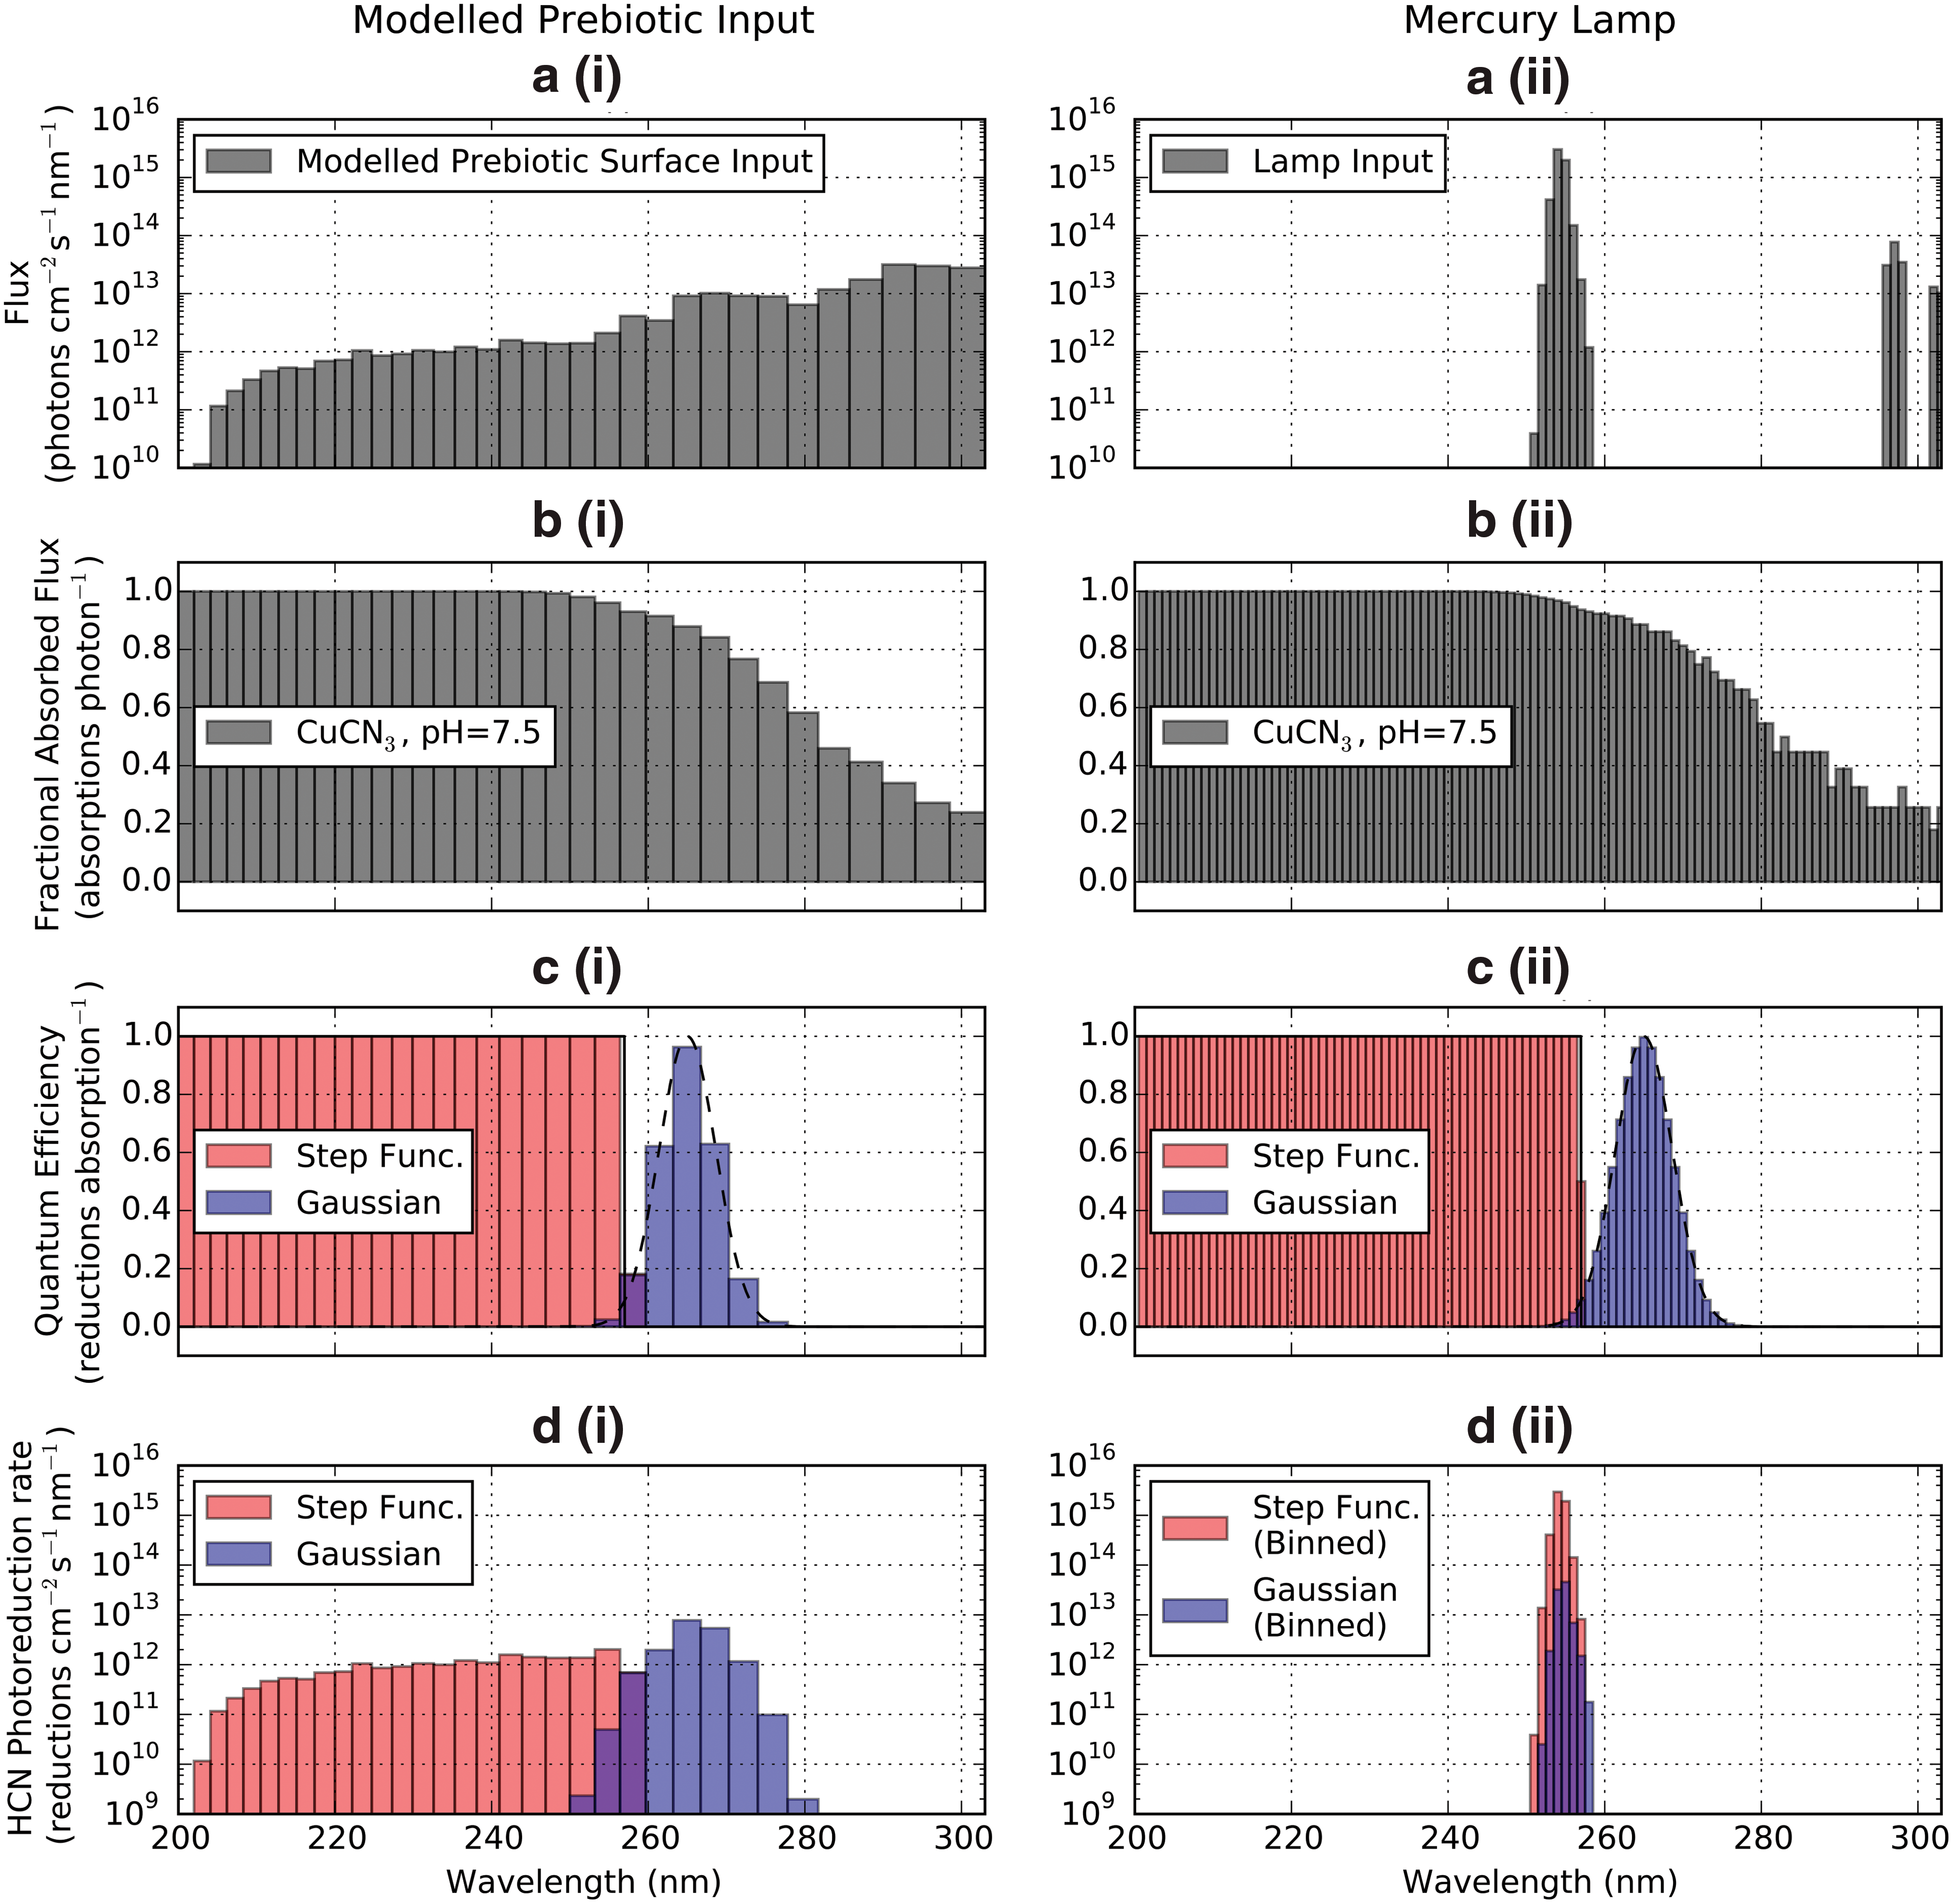
To explore this question quantitatively, we again conduct a simple numerical experiment to that done in Section 4.2.1. We again represent the two UV light sources by the Rugheimer et al. (2015) surficial emergent spectrum and a Pen-Ray Hg lamp radiating 4.4 × 10⁴ erg/cm2/s integrated across the 254 nm line at a distance of 1.9 cm. We again consider fluxes from 200 to 303 nm, chosen to encompass the 200–300 nm region of photochemical interest, while avoiding truncating the wavelength bins of our computed prebiotic UV spectrum. We compute the fraction of incident flux absorbed by
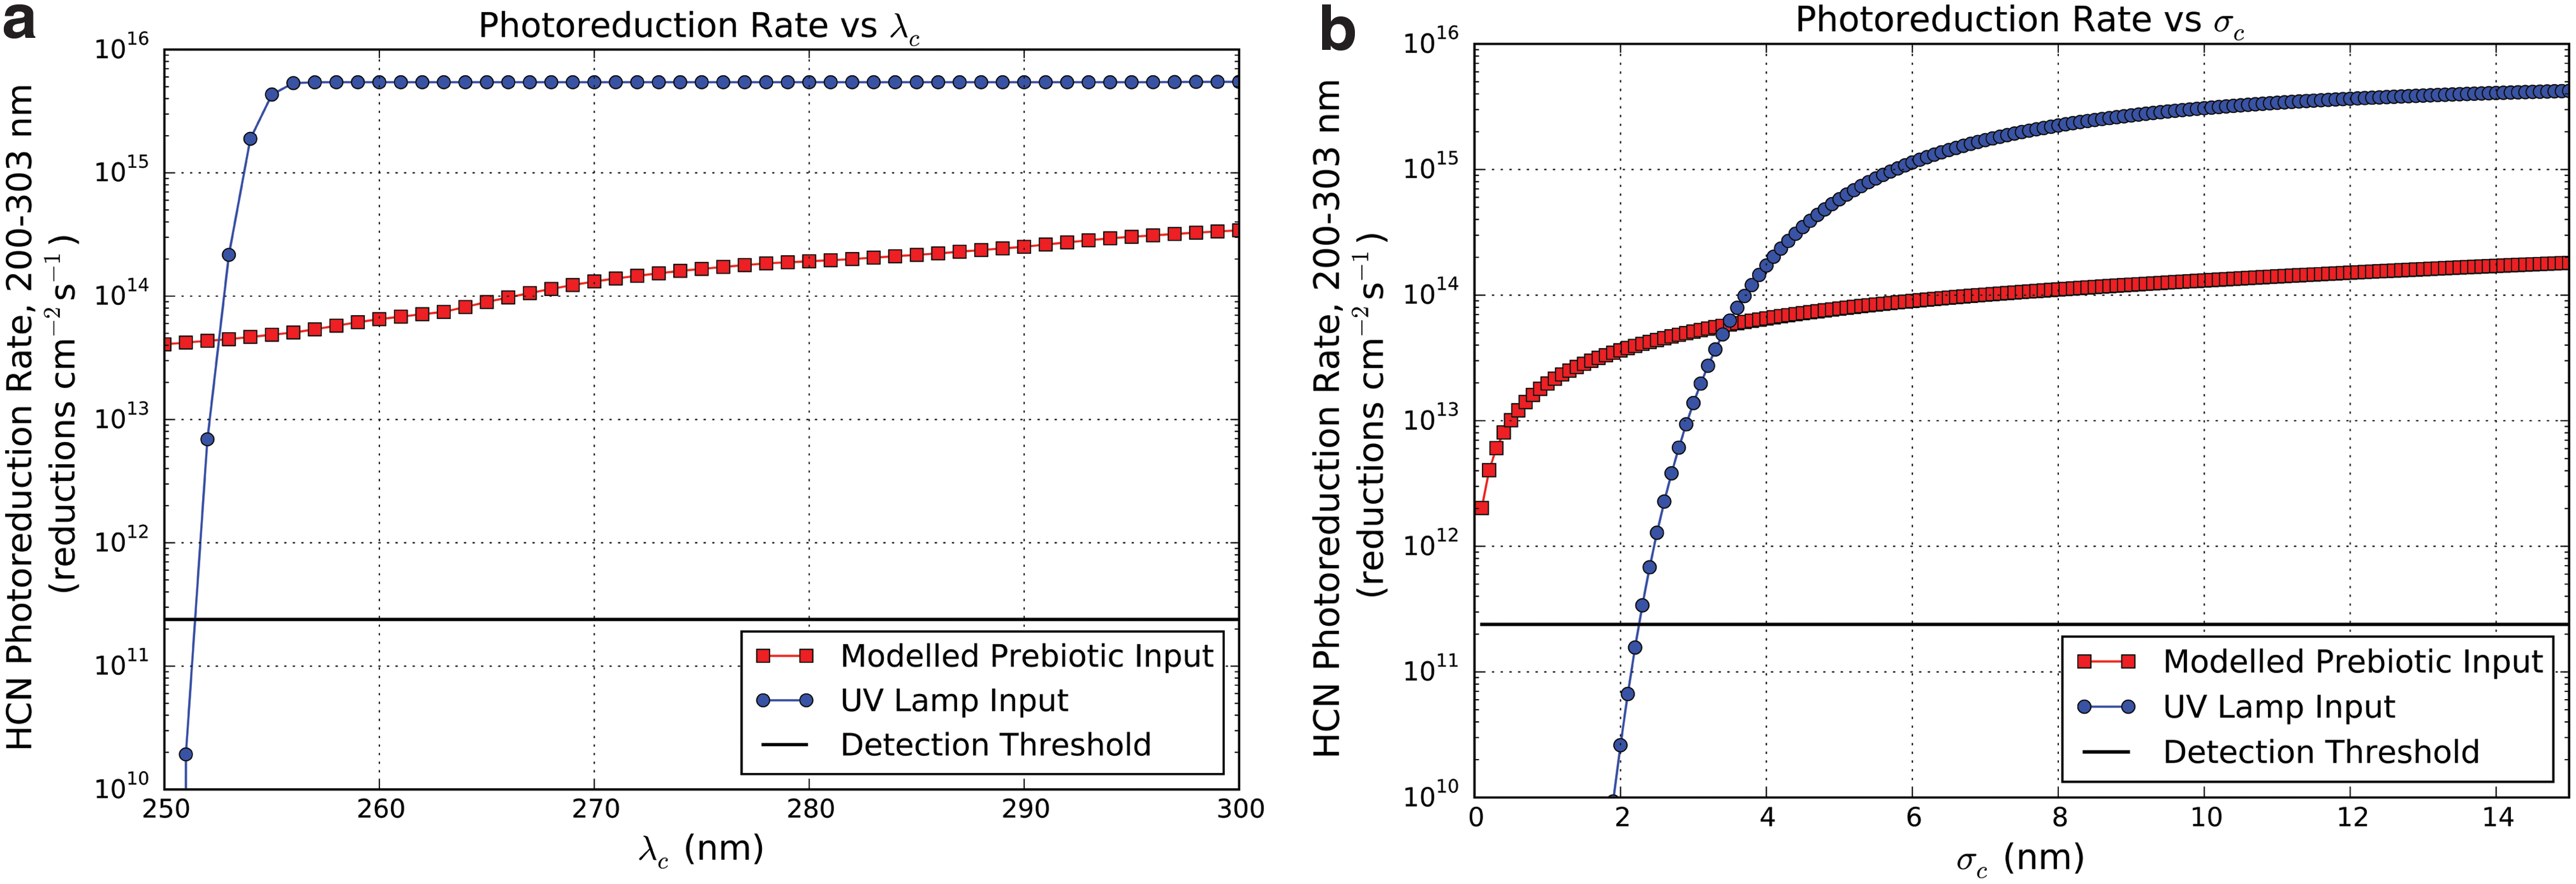
Dependence of HCN photoreduction rate on (
Figure 7a shows the integrated HCN photoreduction rate under exposure to lamp and model prebiotic spectra as a function of λc. The lamp photoreduction rate increases rapidly as λc increases from 251 to 257 nm, corresponding to the mercury emission line. The photoreduction rate then levels off, reflecting the minimal flux produced outside the emission line. By contrast, the prebiotic photoproduction rate increases monotonically with λc as more and more of the absorbed flux is usefully exploited. The lamp photoreduction rate is greater than the prebiotic photoreduction rate even at λc = 300 nm. This is because the irradiance from the UV lamp at the distance we have modeled here (1.9 cm) is larger in amplitude than the prebiotic flux. A dimmer lamp or larger irradiance distance will lead to lower lamp fluxes and hence photoreduction rates.
Figure 7b shows the integrated photoreduction rate under exposure to lamp and model prebiotic spectra as a function of σc. For values of σc < 3.4 nm, the lamp photoreduction rate is less than the prebiotic photoreduction rate. This reflects the displacement between the 254 nm emission of the lamp and the 265 nm center of the QEF. However, for σc > 3.4 nm, the wings of the QEF are wide enough to capture adequate lamp flux to exceed the photoproduction rate under prebiotic UV input. This is a function of both the wavelength dependence of the action spectrum as well as the greater amplitude of UV flux emanating from the lamp.
Also plotted in both figures is the experimental detection threshold, the photoreduction rate required to generate a detectable quantity of product. The detection threshold is dependent on the laboratory setup and experimental technique used to measure the photoreduction rate, as well as the experimental integration time. The example plotted here is based on an experimental setup that requires 50 pmol of product to be present in 10 μL samples for an LCMS detection 3 . We assume an integration period of 7 h for the example presented here, corresponding to the integration period used by Ritson and Sutherland (2012). Under these assumptions, a detectable quantity of product is generated for a wide range of λc and σc. This suggests experimental measurements of the action spectrum of this photoprocess should be tractable.
Figure 8 shows the photoreduction rate calculation for λc = 257 nm and σc = 3.65 nm. At these values, the photoreduction rates under exposure to the lamp emission spectrum are equal under both mechanisms. However, under prebiotic emission, the Gaussian QEF yields photoreduction rates 69 times higher than the step function QEF. The HCN photoreduction rate can vary by 2 orders of magnitude depending on whether lamp or modeled prebiotic fluxes are used! This numerical experiment illustrates the importance of characterizing action spectra of prebiotic photoprocesses, to enable extrapolation from laboratory to prebiotic contexts.
(
5. Conclusions
The prebiotic UV environment was exposed to high levels of UV radiation relative to the present day due to lack of UV-shielding O2 and O3. However, environmental constituents likely blocked the shortest-wavelength radiation. Micron-thick films of water can extinct UV flux with λ < 168 nm, suggesting that even on bodies such as asteroids and comets such short wavelengths are not relevant to prebiotic chemistry. On Earth, attenuation of solar UV flux due to atmospheric carbon dioxide means that UV inputs with λ < 204 nm were sharply attenuated. However, UV flux with λ > 204 nm would have been readily available. It is possible that SO2 absorption during epochs of high volcanism may have been comparable to, or even exceeded, that due to CO2; future work should self-consistently include SO2 absorption at varying levels in estimating atmospheric UV attenuation.
These findings bear lessons for efforts to simulate prebiotic photochemistry in laboratory settings. First, UV sources emitting radiation with λ < 168 nm, such as 158 nm fluorine lasers, should not be used to simulate aqueous prebiotic chemistry in any situation. For surficial chemistry on prebiotic Earth, sources should emit at wavelengths λ > 204 nm; sources like ArF eximer lasers, which emit at 193 nm, or Hg lamp emission at 184.9 nm should not be used. Second, broadband UV sources are favored over narrowband sources like UV lamps. Sources able to incorporate the effects of solar atomic lines and molecular absorption, like tunable UV lasers, would provide an even higher-fidelity simulation of the UV environment. Tunable sources will also enable simulation of phenomena such as solar activity, which may influence photochemistry. However, based on proxies for the young Sun such as κ1 Ceti and the modern Sun, the variation in UV output of the young Sun may have been comparatively modest, corresponding to a <1% variation in ribonucleotide photoabsorption rates integrated over 200–300 nm. This suggests variations in UV output-driven solar variability are not crucial drivers of prebiotic chemistry. Third, there can be significant differences (1–2 orders of magnitude) between natural UV fluence levels and those generated by UV lamps. The often-higher fluence levels of UV lamps can make the timescales of photochemistry-driven processes more tractable to laboratory study, but such studies should take care when extrapolating from high-fluence regimes to natural conditions. Sensitivity studies characterizing the dependence of reaction rate on fluence level can help with such extrapolations.
Simulations of prebiotic chemistry often rely on the availability of feedstock gases such as HCN and CH4. A key constraint on the availability of these gases is UV photolysis, which would have been higher in the prebiotic era due to higher UV throughput in the atmosphere. Atmospheric CO2 can shield such gases from photolysis, depending on its abundance. For CH4, N CO2 > 7.46 × 1020 cm−2 is enough to remove photolytic constraints on CH4 abundance. Under our assumptions of a uniform isothermal atmosphere in equilibrium, achieving this level of shielding at z = 50 km requires a CO2 surface pressure of 1.49 × 10⁻² bar, with lower CO2 levels being required the deeper one goes into the atmosphere. CO2 surface pressures of >2.77 × 10⁻⁴ bar will remove photolytic constraints on tropospheric (z < 17 km) CH4. The more photoactive HCN, the more shielding is required: N CO2 > 2.35 × 1023 cm−2 is required to lift photolytic constraints up to an altitude of 50 km, corresponding to a staggering 4.75 bar of CO2 required at the surface. If HCN is sequestered in the troposphere, then 8.76 × 10⁻² bar of CO2 is adequate to remove the photolytic constraint.
The works of Ritson and Sutherland (2012) and Powner et al. (2009) toward prebiotic synthesis of RNA provide case studies into the relevance of accurately reproducing the UV environment. The Ritson and Sutherland (2012) pathway for the controllable synthesis of simple sugars uses UV light to reduce HCN using tricyanocuprate (I) as an electron donor. Two theoretical mechanisms have been suggested whereby this is accomplished. We have demonstrated that under both mechanisms, narrowband 254 nm mercury lamp radiation is an acceptable proxy for prebiotic UV flux with the caveat that, depending on the underlying mechanism, reaction rates measured under narrowband lamp radiation may conceivably be different from those measured under irradiation corresponding to the prebiotic environment by multiple orders of magnitude.
The Powner et al. (2009) pathway for the synthesis of activated ribonucleotides uses UV light in two steps. The most crucial of these is the amplification of ribocytidine and ribouridine relative to other products of the synthesis reaction due to differential UV photolysis. The wavelength dependence of this relative photostability advantage is not known for this set of molecules. It is plausible that photolysis rates will vary as a function of molecule and wavelength. We have demonstrated that it is possible for there to exist photolysis quantum efficiency curves such that the Powner et al. (2009) process proceeds in laboratory settings but not in a radiation environment corresponding to the surface of young Earth. Further experimental work, for example, replicating the experiment under broadband or tunable laser UV input, is required to fully validate this pathway.
In general, our work suggests the importance of characterizing the action spectra (wavelength dependence) of UV-sensitive chemical pathways thought relevant to prebiotic chemistry. Determining these action spectra enables the extension of laboratory studies to the natural prebiotic environment. Further, these action spectra can be used to determine the viability of proposed chemical pathways on alien planetary environments, for example, exoplanets. Characterizing the action spectra of prebiotic pathways is crucial to understanding whether mechanisms hypothesized to have led to abiogenesis on Earth could also operate on other planets.
Appendix A. Constraints on the Era of Abiogenesis
This appendix presents the literature review underlying our decision to choose 3.9 Ga as the time period relevant to abiogenesis.
Based on evidence such as the discovery of fossilized microorganisms (microfossils) (Javaux et al., 2010) and microbially induced sedimentary structures generated by microbial mats (Noffke et al., 2006), life was established by 3.2 Ga. Reports of putative stromatolites 4 (Hofmann et al., 1999; Buick, 2007), microbially induced sedimentary structures (Noffke et al., 2013), and potentially biogenic carbon and sulfur fractionation (Buick, 2007) are suggestive of life being established by 3.5 Ga. Carbon fractionation arguments have been used to argue for life as early as 3.7 Ga, but this is still debated (Buick, 2007; Ohtomo et al., 2013). For purposes of this work, therefore, we constrain the era of abiogenesis to have been earlier than 3.5 Ga.
Upper bounds on the era of abiogenesis suffer from even more paucity of information. Surface liquid water existed as early as 4.3 Ga (Mojzsis et al., 2001; Catling and Kasting, 2007). Another constraint on the era of abiogenesis may come from the LHB. From 4.1 to 3.8 Ga, Earth experienced a high flux of extraterrestrial impactors (Deamer, 2007), peaking sharply at 3.9 Ga (Chapman et al., 2007). Maher and Stevenson (1988) argued that bombardment would have sterilized the planetary surface and would have heated the oceans, potentially to uninhabitable levels. Sleep et al. (1989) went further, arguing that LHB impacts could vaporize the oceans. However, Abramov and Mojzsis (2009) incorporated better cratering records and new Solar System dynamical and terrestrial lithospheric models to conclude that the 3.9 Ga peak of the LHB may not have entirely sterilized life. We cannot therefore state with certainty that the LHB sterilized Earth. Consequently, abiogenesis may have occurred as early as 4.3 Ga.
Hence, the range of ages potentially relevant to prebiotic chemistry is 3.5–4.3 Ga. We choose 3.9 Ga as it lies squarely in the middle of this range and postdates the LHB, hence avoiding planetary sterilization concerns.
Appendix B. The 3.9 Ga Terrestrial Environment
This appendix summarizes available constraints on the prebiotic atmosphere at 3.9 Ga.
Evidence from zircon samples demonstrates the existence of surface liquid water starting 4.3 billion years ago (Mojzsis et al., 2001; Catling and Kasting, 2007). This means that the surface temperature had to be above the freezing point of water. This is a key constraint, as the young Sun was as much as 30% fainter compared to the present day. To maintain surface liquid water, an enhanced greenhouse effect due to higher levels of CO2 is typically invoked (Kasting, 1993, 2014).
The atmosphere in the prebiotic era was likely dominated by volcanic outgassing from high-temperature magmas. Earth's interior had differentiated by 4.4 Ga, meaning that the composition of the mantle was set by this date (Catling and Kasting, 2007). Delano (2001) studied Cr and V abundance in ancient volcanic rocks to show that the redox state of volcanic rocks, and hence, the mantle, has not changed since 3.6 Ga, likely since 3.9 Ga 5 . Since the redox state controls speciation of H-C-O-S elements, this fact implies that primordial volcanic outgassing of H-C-O-S elements from T > 1300 K magma was dominated by H2O, CO2, and SO2, with ≤1% contributions of H2 and CO. Trail et al. (2011) extended this constraint by studying incorporation of Ce into ancient zircons. Their analysis suggests that the redox state of the mantle has been unchanged to within measurement error since 4.3 Ga, and they concluded that volcanic outgassing was dominated by H2O, CO2, SO2, and N2, consistent with Delano (2001). Zolotov and Shock (2000) gave the relative abundances of H2O, CO2, and SO2 in a quartz-fayalite-magnetite (QFM) buffer, which approximates the terrestrial mantle, as a function of temperature. For T > 1000°C, the abundances of H2O, CO2, and SO2 are roughly independent of temperature; for T = 1200°C, the mole fractions of H2O, CO2, and SO2 are 0.54, 0.31, and 0.15, respectively. It is generally assumed that gases are given off by magmas in the same proportions as they are dissolved 6 . Despite its high production rate, SO2 is not expected to be a major component of the atmosphere due to its tendency to photolyze or be oxidized into rock. However, during periods of high volcanism it is plausible for SO2 to build up to the level of hundreds of parts per million (Kaltenegger and Sasselov, 2010). Therefore, particularly on the more active primordial Earth, SO2 may have at least transiently been an important component of the planetary atmosphere.
Molecular nitrogen (N2) is another key component of the terrestrial atmosphere and may have been delivered by impacting planetesimals (Kasting, 2014). Factors affecting nitrogen abundance in the prebiotic era include production rates from planetesimals, which would have been higher on young Earth. However, atmospheric shock heating of nitrogen in a nonreducing (e.g., N2/CO2) atmosphere can also convert N2 to NO, which can be geochemically fixed and removed from the atmosphere (Summers et al., 2012). Goldblatt et al. (2009) argued that the nitrogen reservoirs in the mantle are subducted, not primordial, and that crustal nitrogen accumulated with the continents; based on these and the utility of high N2 levels for greenhouse warming to solve the Faint Young Sun paradox, they argued that primordial N2 levels were as much as 2–3 times the present level of 0.79 bar. However, Marty et al. (2013) used N2/Ar fluid inclusions in 3.5 Ga quartz crystals to demonstrate that N2 pressures and isotopic composition at this time were similar to present-day levels (0.5–1.1 bar).
In summary, existing evidence is suggestive of an N2/CO2-dominated atmosphere with sufficient concentration of greenhouse gases (e.g., CO2, CH4) to support liquid water on the surface. During epochs of high volcanism, volcanogenic gases (especially SO2) may also have formed an important constituent of the atmosphere. If young Earth were warm, water vapor would also be a significant atmospheric constituent.
Appendix C. Derivation of Photolytic Constraints on Feedstock Gas Buildup
In this section, we derive the equilibrium surface partial pressure of a feedstock gas X, assuming the sole sink to be photolysis. As discussed in Section 3.4, we assume an isothermal atmosphere of ideal gases in hydrostatic equilibrium dominated by 0.9 bar N2 and 0.1 bar CO2, with total surface pressure 1 bar. We assume the mixing ratio of the feedstock gas under consideration to remain constant until a height z0 , whereupon it goes to zero. Lastly, we assume the feedstock gas population to be optically thin. We take our top-of-atmosphere input φ 0(λ) to be the UV spectrum of the 3.9 Ga Sun computed from the models of Claire et al. (2012) spanning a wavelength range of 1–300 nm at 0.1 nm resolution. We obtain our CO2 cross sections σ CO2(λ) from the work of Huestis and Berkowitz (2010), who compiled CO2 cross-sections at 300 K from 0.12 to 201.6 nm.
If the rate of supply of methane to the atmosphere is S, and the rate of removal of X from the atmosphere due to photolysis is B, then B satisfies
where nX
(r) is the number density of X as a function of r, σ
X
(λ) is the cross-section of X as a function of wavelength, φ(λ) is the emergent flux irradiating X, r is the distance from the planet center, and Φ is the zenith angle of the irradiating flux. Then,
where R
⊕ is the radius of Earth. z
0
/R
⊕ << 1, so changing variables to z = r - R
⊕, we can write
Under our assumptions of an isothermal atmosphere of ideal gases in hydrostatic equilibrium, we can compute:
where the scale height H = (kT)/(μg), μ is the mean molecular mass of the atmosphere, g is the acceleration due to gravity, T is the temperature of the atmosphere. For a 0.1 bar CO2, 0.9 bar N2 atmosphere, μ = 29.6 amu. We take T = 290 K, the surface temperature computed in the model of Rugheimer et al. (2015). Then H = 8.3 km, comparable to H = 8.5 km for modern Earth.
We have labeled the input flux at the top of the atmosphere to be φ0(λ). Then
where N
CO2 is the column density of CO2 shielding X. We can then compute the quantity
where λmin and λmax correspond to the limits of the available absorption data for X. As an example, for N CO2 = 1.4 × 1021 cm−2, b CH4 = 3.1 × 10⁻²⁷ s−1.
Combining these relations by equating the source and sinks of X, we may reason:
Appendix D. Collection of
\documentclass{aastex}\usepackage{amsbsy}\usepackage{amsfonts}\usepackage{amssymb}\usepackage{bm}\usepackage{mathrsfs}\usepackage{pifont}\usepackage{stmaryrd}\usepackage{textcomp}\usepackage{portland, xspace}\usepackage{amsmath, amsxtra}\pagestyle{empty}\DeclareMathSizes{10}{9}{7}{6}\begin{document}$${\bf Cu} ( {\bf CN} ) _{\bf 3}^{\bf \,\,2 - }$$ \end{document}
Absorption Spectrum
The absorption spectrum of tricyanocuprate (I) used in this paper was taken from the work of Magnani (2015), an undergraduate thesis. While the content of this thesis is currently being prepared for publication, this material is not yet peer-reviewed and publicly available. Hence, with permission of the author, we briefly excerpt here a description of the techniques used to collect this spectrum. We emphasize that credit for this work must go to Magnani (2015) and his forthcoming paper.
The absorption spectra in this study were collected by using a Starna quartz cuvette (1 cm cube) mounted in a UV-vis spectrometer (Ultraspec 3100 Pro, Amersham Biosciences). First, an absorption spectrum was taken of a blank consisting of 2.5 mL of pure deionized water. Then, a
The titration of CuCN by CN demonstrated that, as CN concentration increased, the solution spectrum increasingly resembled the spectrum of pure CN−. This indicates that the additional CN was being partitioned preferentially into solution as opposed to into the tricyanocuprate complex. Therefore, we chose to use the spectrum corresponding to the solution formed by combining 0.2 mM CuCN with just 1.1 equivalent of CN− to represent the spectrum of the tricyanocuprate (I) complex; we term this the “base solution.” The tricyanocuprate species dominates the spectrum because the dicyanocuprate species is not photoactive and the tetracyanocuprate species is not thermodynamically favored at neutral pH (Horváth et al., 1984).
The base solution was prepared by combining a stock solution of 0.2 mM CuCN with a 1.1 equivalent of CN−, resulting in a solution containing 0.2 mM Cu+ and 0.42 mM CN−. Assuming all the CN− goes into the tricyanocuprate complex, this corresponds to a 0.14 mM solution of tricyanocuprate (I). However, the partitioning between the CN− in solution versus in the tricyanocuprate complex is not known. Hence, 0.14 mM represents an upper limit on the tricyanocuprate (I) concentration.
We computed the molar absorptivities via the absorbance formula A/(d × C) = e, where A is the absorbance, e is the molar absorptivity (M −1 cm−1), d is the path length in centimeters, and C is the concentration of the solution in moles per liter. A = log10(I 0/I), where I 0 is the intensity incident on the cuvette and I is the transmitted intensity. A is reported by the UV-vis spectrometer, the cuvette dimensions set d = 1 cm, and we took C = 0.14 mM. As 0.14 mM is an upper bound for C, this means that the values we compute for e are lower bounds.
Ritson and Sutherland (2012) reported that they formed their tricyanocuprate complex by adding 30 mg KCN (65.12 g/mol) and 2 mg CuCN (89.56 g/mol) to 2.2 mL of water and titrating with an unspecified amount of 1 M HCl to reach neutral pH. The amount of HCl solution added cannot exceed 1.3 mL, as the total volume of the cuvette used in their experiment was 3.5 mL. This corresponds to a total of 2.23 × 10⁻⁵ mol Cu+ and 4 × 10⁻⁴ mol CN−. Assuming all the Cu goes into the complex, which seems reasonable given that [Cu] << 3[CN], this corresponds to a tricyanocuprate concentration of (2.23 × 10⁻⁵ mol)/(2.2–3.5mL) = 6–12 mM. As the spectrum is saturated at the Ritson and Sutherland (2012) concentration of 6 mM (see Fig. 8) using even the lower of these values and our lower bounds for e the absorption spectrum, the use of our lower bounds for e has minimal impact on our results.
Appendix E. Extinction Cross Sections
This appendix specifies the sources of the extinction cross sections for the gases used in Fig. 5 (Section 3.3.2). We used laboratory measurements of cross sections where available and assumed extinction was due to Rayleigh scattering otherwise. Unless otherwise stated, all measurements were collected near room temperature (295–298 K) and 1 bar of atmospheric pressure, and the digitized data files of the empirical measurements were collected from the MPI-Mainz UV/VIS Spectral Atlas.
E.1. CO2
We take empirically measured cross sections shortward of 201.6 nm from the work of Huestis and Berkowitz (2010). Huestis and Berkowitz (2010) reviewed existing measurements of extinction cross sections for CO2 and aggregated the most reliable ones into a single spectrum (<1 nm resolution). They tested their composite spectrum with an electron-sum rule and found it to agree with the theoretical expectation to 0.33%. From 201.75 to 300 nm, the measurements of Shemansky (1972) provide coverage. However, the resolution of these data ranges from 0.25 nm from 201.75–203.75 nm to 12–25 nm from 210–300 nm. Further, Shemansky (1972) found that essentially all extinction at wavelengths longer than 203.5 nm is due to Rayleigh scattering (Ityaksov et al., 2008, derive similar results). Therefore, we adopt the measurements of Shemansky (1972) from 201.75 to 203.75 nm and take Rayleigh scattering to describe CO2 extinction at longer wavelengths.
We compute the Rayleigh scattering cross section of CO2 using the formalism of Vardavas and Carver (1984): σ = 4.577 × 10⁻²¹ × KCF × [A(1 + B/λ2)]/λ4, where λ is in micrometers and KCF is the King correction factor, and where KCF = (6 + 3δ)/(6 − 7δ), where δ is the depolarization factor. This approach accounts for the wavelength dependence of the index of refraction but assumes a constant depolarization factor. We take the values of the coefficients A and B from the work of Keady and Kilcrease (2000) and the depolarization factor of δ = 0.0774 from the work of Shemansky (1972).
E.2. SO2
From 106.1 to 403.7 nm, we take the cross sections for SO2 extinction from the compendium of SO2 cross sections of Manatt and Lane (1993) (0.1 nm resolution). Manatt and Lane (1993) evaluated extant UV cross sections for SO2 extinction and aggregated the most reliable into a single compendium covering this wavelength range at 293 ± 10 K.
E.3. H2S
We take empirically measured cross sections of H2S shortward of 159.465 nm from the dipole (e,e) spectroscopy measurements of Feng et al. (1999) (<10 nm resolution). From 159.465 to 259.460 nm, we take the cross sections for H2S extinction from the gas cell absorption measurements of Wu and Chen (1998) (0.06 nm resolution), as recommended by Sander et al. (2011). From 259.460 to 370.007 nm, we take the gas cell absorption measurements of Grosch et al. (2015) (0.018 nm resolution). Many of the cross sections reported in the Grosch et al. (2015) data set are negative, corresponding to an increase in flux from traversing a gas-filled cell. These cross sections are deemed unphysical and removed from the data set. Further, the Grosch et al. (2015) data set shows a great deal of high-resolution structure that is not relevant to our analysis. We use an 11-point mean boxcar filter to smooth the data we take from the Grosch et al. (2015) data set.
Footnotes
Acknowledgments
We thank C. Magnani for many discussions and sharing his measurement of the tricyanocuprate absorption spectrum with us. We thank S. Rugheimer for sharing her prebiotic atmosphere models and insight with us. We thank M. Powner for sharing insights on the photochemistry underlying the pathways in his work with us, as well as further discussions and his feedback on our manuscript. We additionally thank I. Ribas for kindly sharing his spectrum of κ1 Ceti and his insight upon request, I. Cnossen for sharing her young Sun models, C.Y. Wu for sharing his methane cross-section data, V. Vuitton for sharing her compilation of HCN cross sections, and E. Schwieterman for help with absorption spectra of atmospheric absorbers. We thank D. Zubarev, D. Ritson, K. Zahnle, R. Wordsworth, F. Tian, J. Delano, S. Harman, A. Bjorkbom, A. Glenday, and A. Fahrenbach for instructive discussions. We thank L. Schaefer and an anonymous reviewer for comments that substantially improved this manuscript.
This research has made use of NASA's Astrophysics Data System Bibliographic Services and the MPI-Mainz UV/VIS Spectral Atlas of Gaseous Molecules.
S.R. and D.D.S. gratefully acknowledge support from the Simons Foundation, grant no. 290360.
Author Disclosure Statement
The authors declare no competing financial interests.