
Abstract
As the number of detected extrasolar planets increases, exoplanet databases become a valuable resource, confirming some details about planetary formation but also challenging our theories with new, unexpected properties. Key Words: Exoplanets—Gravity—Planetary habitability and biosignatures. Astrobiology 16, 325–327.
1. Introduction
O
2. Surface Gravity
Since the first exoplanet was discovered orbiting a main sequence star (Mayor and Queloz, 1995), we have catalogued, to date, more than 2000 extrasolar worlds. And statistics suggest that our galaxy should host at least 100,000 million more exoplanets. Since 2011, astronomers have been uncovering an average of three exoplanets per week, and these discoveries have been published in several open access databases, such as the Exoplanet Orbit Database, the Extrasolar Planets Encyclopaedia, the NASA Exoplanet Archive, or the Open Exoplanet Catalogue, among others (Wright et al., 2011; EO, 2016; EPE, 2016; NEA, 2016; OEC, 2016). These databases compile several parameters of extrasolar planets that are reported in the peer-reviewed literature, with an easy-to-use interface to filter and organize data. More than half the exoplanets published in these databases were discovered by the successful Kepler mission (Basri et al., 2005) using the transit method (Rosenblatt, 1971). For transiting exoplanets, there is a rather straightforward way to estimate surface gravity (Southworth et al., 2007): First, by analyzing the transit light curve, one can measure the amount of starlight blocked by the planet, which, when combined with a good model of the central star size, yields an estimate of the planet size (given by its upper opaque layer). Second, by measuring spectroscopically the radial velocity amplitude of the planet's parent star, one can obtain an estimate of the planetary mass M. In fact, this second technique sets a lower bound to the planetary mass, as it measures M × sin(i), where i corresponds to the viewing angle (EO, 2016), but for transiting planets sin(i) is reasonably close to 1. Therefore, with estimates of size and mass and the use of Newton's gravity, g s = GM/R 2, surface gravity can be assessed.
Figure 1 shows the above estimates of surface gravity versus mass (blue dots) with data from
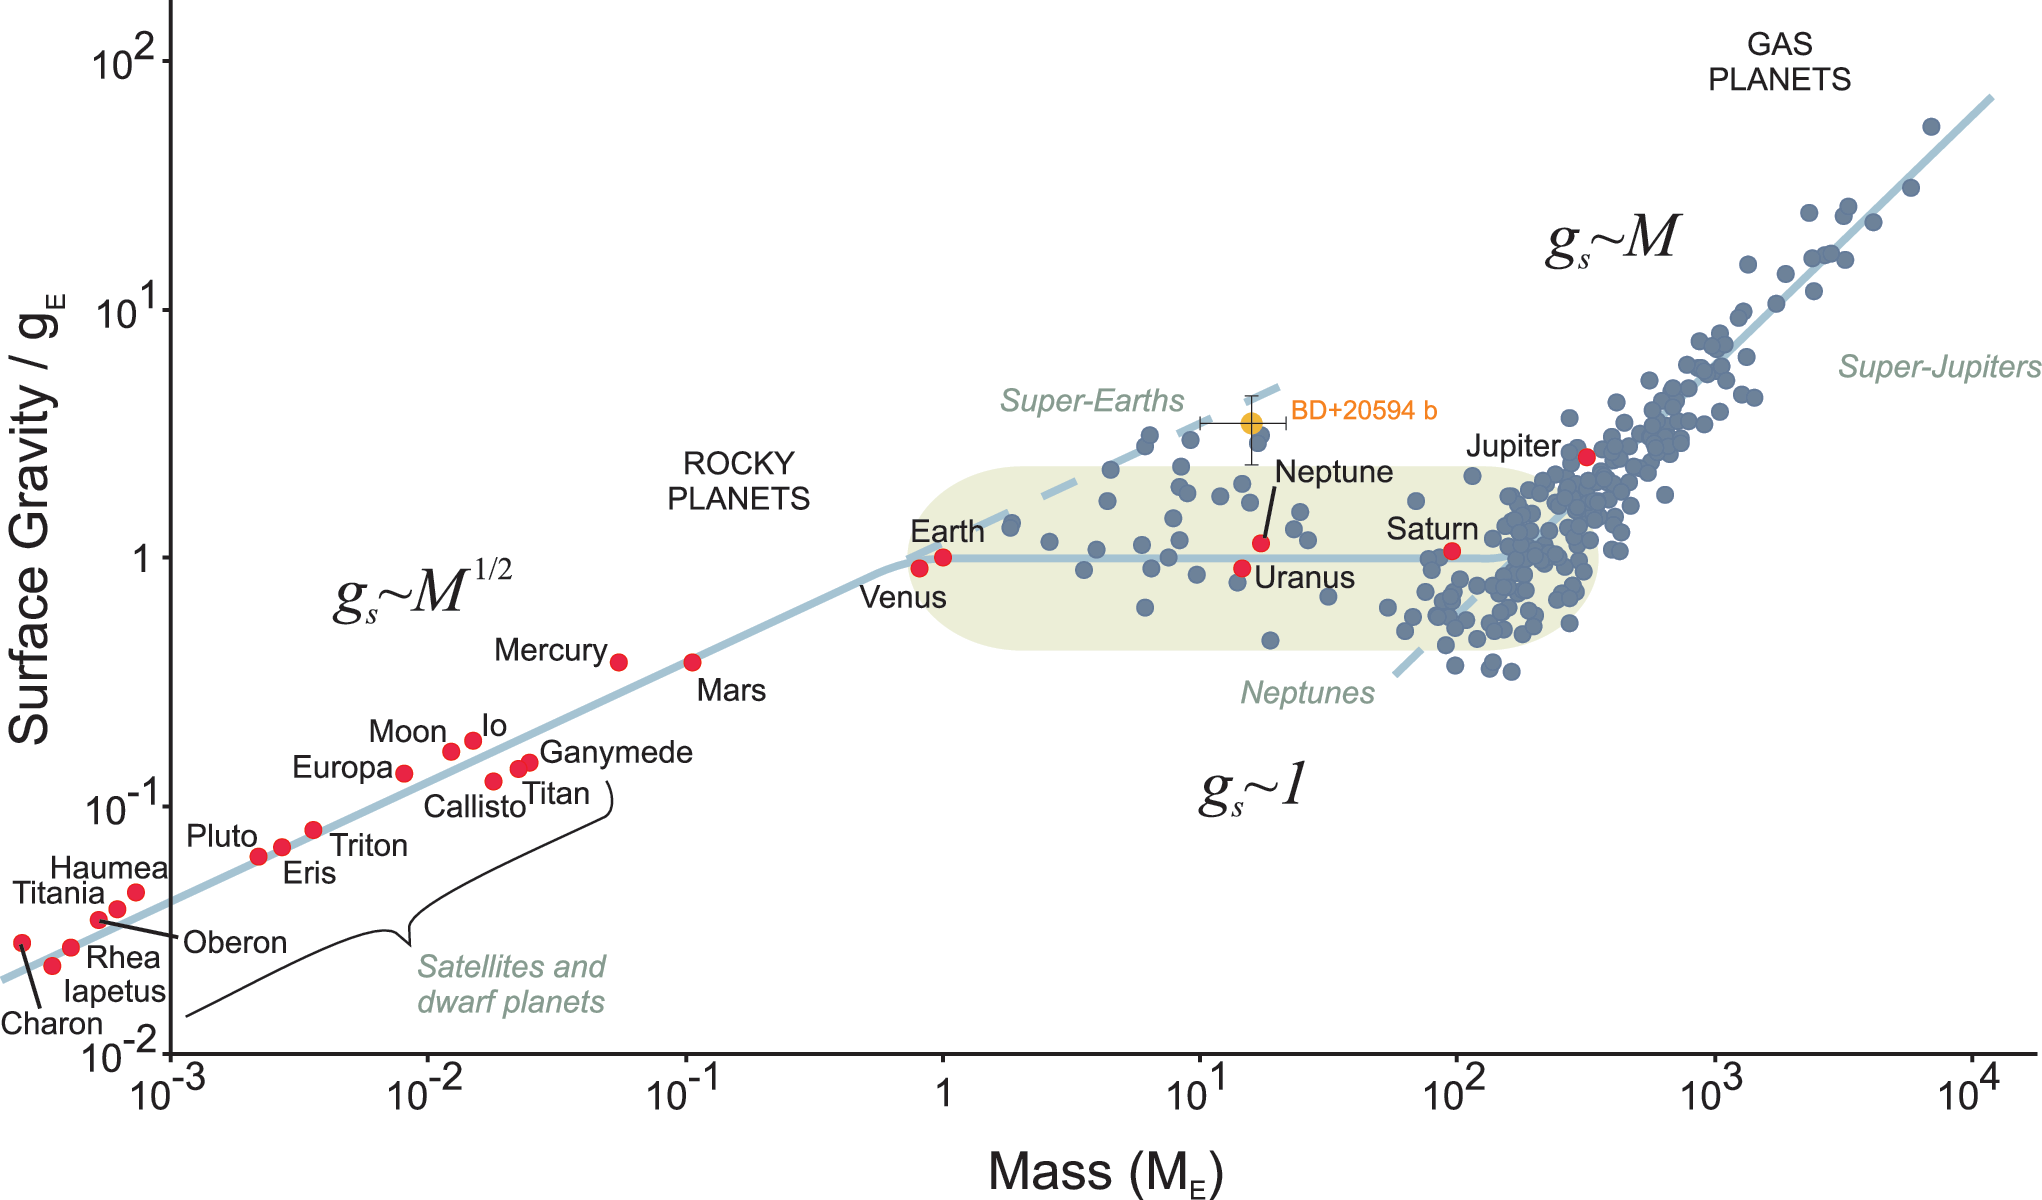
Mass versus surface gravity. Mass is represented in Earth's units M
E and surface gravity in units normalized with terrestrial surface gravity. From left to right, three scaling regions can be clearly distinguished: (i) rocky bodies with g
s ∼ M
½, (ii) the transition zone (green stripe) with g
s ∼ 1, and (iii) gas planets with g
s ∼ M. Solid line is a guide to the eye, not a fit. Red dots: Solar System objects. Blue dots: transiting exoplanets from
3. Discussion and Conclusions
This representation has the advantage of classifying planets into three distinct regimes, from left to right: (i) rocky bodies with masses below that of Earth, M E; (ii) the transition zone, with super-Earths, Neptunes, and some Solar System planets, with masses that range from one to hundreds of Earth masses; and (iii) gas giants, with masses above hundreds of Earth masses. In the first regime, planetary radius grows with mass as R ∼ M 1/4; therefore surface gravity grows as g s ∼ M 1/2 (faster than what would be expected for incompressible bodies, g s ∼ M 1/3). On the other hand, for gas worlds, planetary radius remains roughly constant (i.e., gas giants with very different masses have similar sizes due to electron degeneracy), so surface gravity grows linearly with mass, g s ∼ M. But in the transition zone, we find some sort of plateau where planetary radius has the fastest growth, as R ∼ M 1/2, which thereby yields a constant surface gravity roughly similar to that of Earth. This is especially evident in the Solar System: surface gravities for Venus, Uranus, Neptune, and Saturn, with 0.82, 14, 17, and 95 times Earth's mass, respectively, are 0.91g, 0.9g, 1.14g, and 1.06g. This similarity with Earth's surface gravity is surprising, considering the difference in mass between the plateau's extremes and the contrasting chemical compositions and physical structures of the planets along this region (Seager et al., 2007; Rogers, 2015).
Competing planetary formation models (Raymond et al., 2008) still present several issues. There are worlds, in principle, that have never been observed and are not excluded by models, and there are observed worlds with characteristics unpredicted by models (Spiegel et al., 2014). It still remains unclear how to connect allowable masses and radii (Howard, 2013), as for a given mass one could expect a diversity of sizes depending on the planetary composition and atmospheric size. And we do not even know whether all that we call super-Earths have a solid surface [although if they are over the curve g s ∼ M1/2 , they will likely be rocky. Note that this prediction has been fulfilled since this manuscript was submitted with the recent discovery by Espinoza et al. (2016) of the extremely massive rocky exoplanet BD +20594b, 16 times Earth's mass, whose surface gravity falls over this curve within the experimental error—orange dot in Fig. 1.]. This flat transition zone poses another challenge for theorists. In this region, the contribution of the atmosphere to the total planetary mass plays an increasing role as one moves from rocky worlds to Neptunes, but curiously does so in a way that total mass and radius compensate for each other. One could in principle propose a rocky planet as big and massive as one would wish, with no atmosphere at all, but no natural process produces it. The accretion process and the competition for materials during planetary formation impose severe constraints on feasible planets. Current models of population synthesis (Mordasini et al., 2015) are designed to take this into account and can address many of the observed features. However, such models fail to explain this plateau and predict instead a noticeable increasing trend in surface gravities in this region.
These kinds of observational properties, taken from real planetary systems, are becoming a helpful input with which to improve models. Known transiting planets, the number of which grows daily, are a valuable resource that aids in the refinement of theoretical models and shows that what we see in our solar system (five worlds with nearly the same surface gravity) is not a coincidence but a general trend. We still do not know the origin of this feature, but whatever the mechanism behind it, several rocky super-Earths with surface gravities similar to that of our planet have already been discovered. Therefore, if while viewing The Force Awakens the reader sees Harrison Ford walking on Takodana as if he were strolling down Hollywood Boulevard, do not be too critical. After all, this may not be so wrong.