
Abstract
The presence of nucleobases in carbonaceous meteorites on Earth is an indication of the existence of this class of molecules in outer space. However, space is permeated by ionizing radiation, which can have damaging effects on these molecules. Adenine is a purine nucleobase that amalgamates important biomolecules such as DNA, RNA, and ATP. Adenine has a unique importance in biochemistry and therefore life. The aim of this work was to study the effects of cosmic ray analogues on solid adenine and estimate its survival when exposed to corpuscular radiation.
Adenine films were irradiated at GANIL (Caen, France) and GSI (Darmstadt, Germany) by 820 MeV Kr33+, 190 MeV Ca10+, 92 MeV Xe23+, and 12 MeV C4+ ion beams at low temperature. The evolution of adenine molecules under heavy ion irradiation was studied by IR absorption spectroscopy as a function of projectile fluence.
It was found that the adenine destruction cross section (σ d) follows an electronic stopping power (S e) power law under the form: CS e n ; C is a constant, and the exponential n is a dimensionless quantity. Using the equation above to fit our results, we determined σ d = 4 × 10⁻¹⁷ S e 1.17, with S e in kiloelectronvolts per micrometer (keV μm−1). New IR absorption bands arise under irradiation of adenine and can be attributed to HCN, CN-, C2H4N4, CH3CN, and (CH3)3CNC.
These findings may help to understand the stability and chemistry related to complex organic molecules in space. The half-life of solid adenine exposed to the simulated interstellar medium cosmic ray flux was estimated as (10 ± 8) × 106 years. Key Words: Heavy ions—Infrared spectroscopy—Astrochemistry—Cosmic rays—Nucleobases—Adenine. Astrobiology 17, 298–308.
1. Introduction
A
Several groups have studied irradiation of ices that contain complex organic molecules such as amino acids, nucleobases, and polycyclic aromatic hydrocarbons (de Barros et al., 2012; Gerakines et al., 2012; Cataldo et al., 2013; Gerakines and Hudson, 2013; Mejía et al., 2013). In the present study, we focused on the effects on adenine due to exposure to galactic cosmic ray analogues. Although less than 1% of galactic cosmic rays consist of heavy ions at high energy, it has been shown that their effects on the destruction and formation of new molecules cannot be neglected (de Barros et al., 2012). With the use of different swift heavy ions, it is possible to determine the destruction cross section of adenine as a function of electronic stopping power. Here, we have evaluated the survival of adenine in the interstellar medium (ISM) and dense clouds (DCs).
2. Experimental Methodology
2.1. Sample preparation
Adenine powder purchased from Sigma-Aldrich (purity ≥99%) was dissolved in a solution of ethanol and water (Krzaczkowska et al., 2004) (60.8% ethanol in water v/v) at a concentration of 1.0 mg mL−1, and the solution was exposed to ultrasound until all solids were visibly dissolved. Thereafter, drops of this solution were dripped directly onto a ZnSe window (13 mm diameter, thickness 2 mm). The window was then heated up to 100°C until the liquid solvent evaporated and, consequently, the solid adenine samples were obtained.
2.2. Sample irradiation
Adenine films were irradiated at the beam lines IRRSUD (92 MeV Xe23+, 12 MeV C4+) and SME (820 MeV Kr33+) at GANIL (Caen, France) and at the M-Branch of UNILAC (190 MeV Ca10+) at GSI (Darmstadt, Germany).
The experiments at GANIL were performed in the CASIMIR setup (Seperuelo Duarte et al., 2010; Mejía et al., 2015). Each sample was mounted on a cold finger located inside a high-vacuum chamber (10−8 mbar). The objective of our setup was to simulate conditions, that is, temperature and pressure, within astronomical environments such as DCs and the ISM. The temperatures within these environments range from 10 to 50 K (Muñoz Caro and Schutte, 2003); thus the samples were irradiated at low temperature (13 K). Unfortunately, it is not possible to create the same pressure range as those that occur in astronomical environments (103 to 106 atoms cm−3) (Muñoz Caro and Schutte, 2003); so the main difficulty with working at low temperatures, under the pressures our setup was capable of generating, was the deposition of the residual gas, notably water and CO2. Nonetheless, in those few hours needed to run our experiment, the condensed ice on our samples was not thick enough to change the regime of deposition of energy of the incoming ions.
As illustrated in Fig. 1, the copper shield (which is used for thermal isolation) was coupled to the cold finger and both turned together. The irradiation was performed at a position of 0°; then at the intermediary fluences the ion beam was switched off and the sample turned to 90° and the IR spectra recorded. To prevent sputtering, one of the samples was turned to 180° and covered with a thin water-ice layer (0.22 μm) before irradiation began.
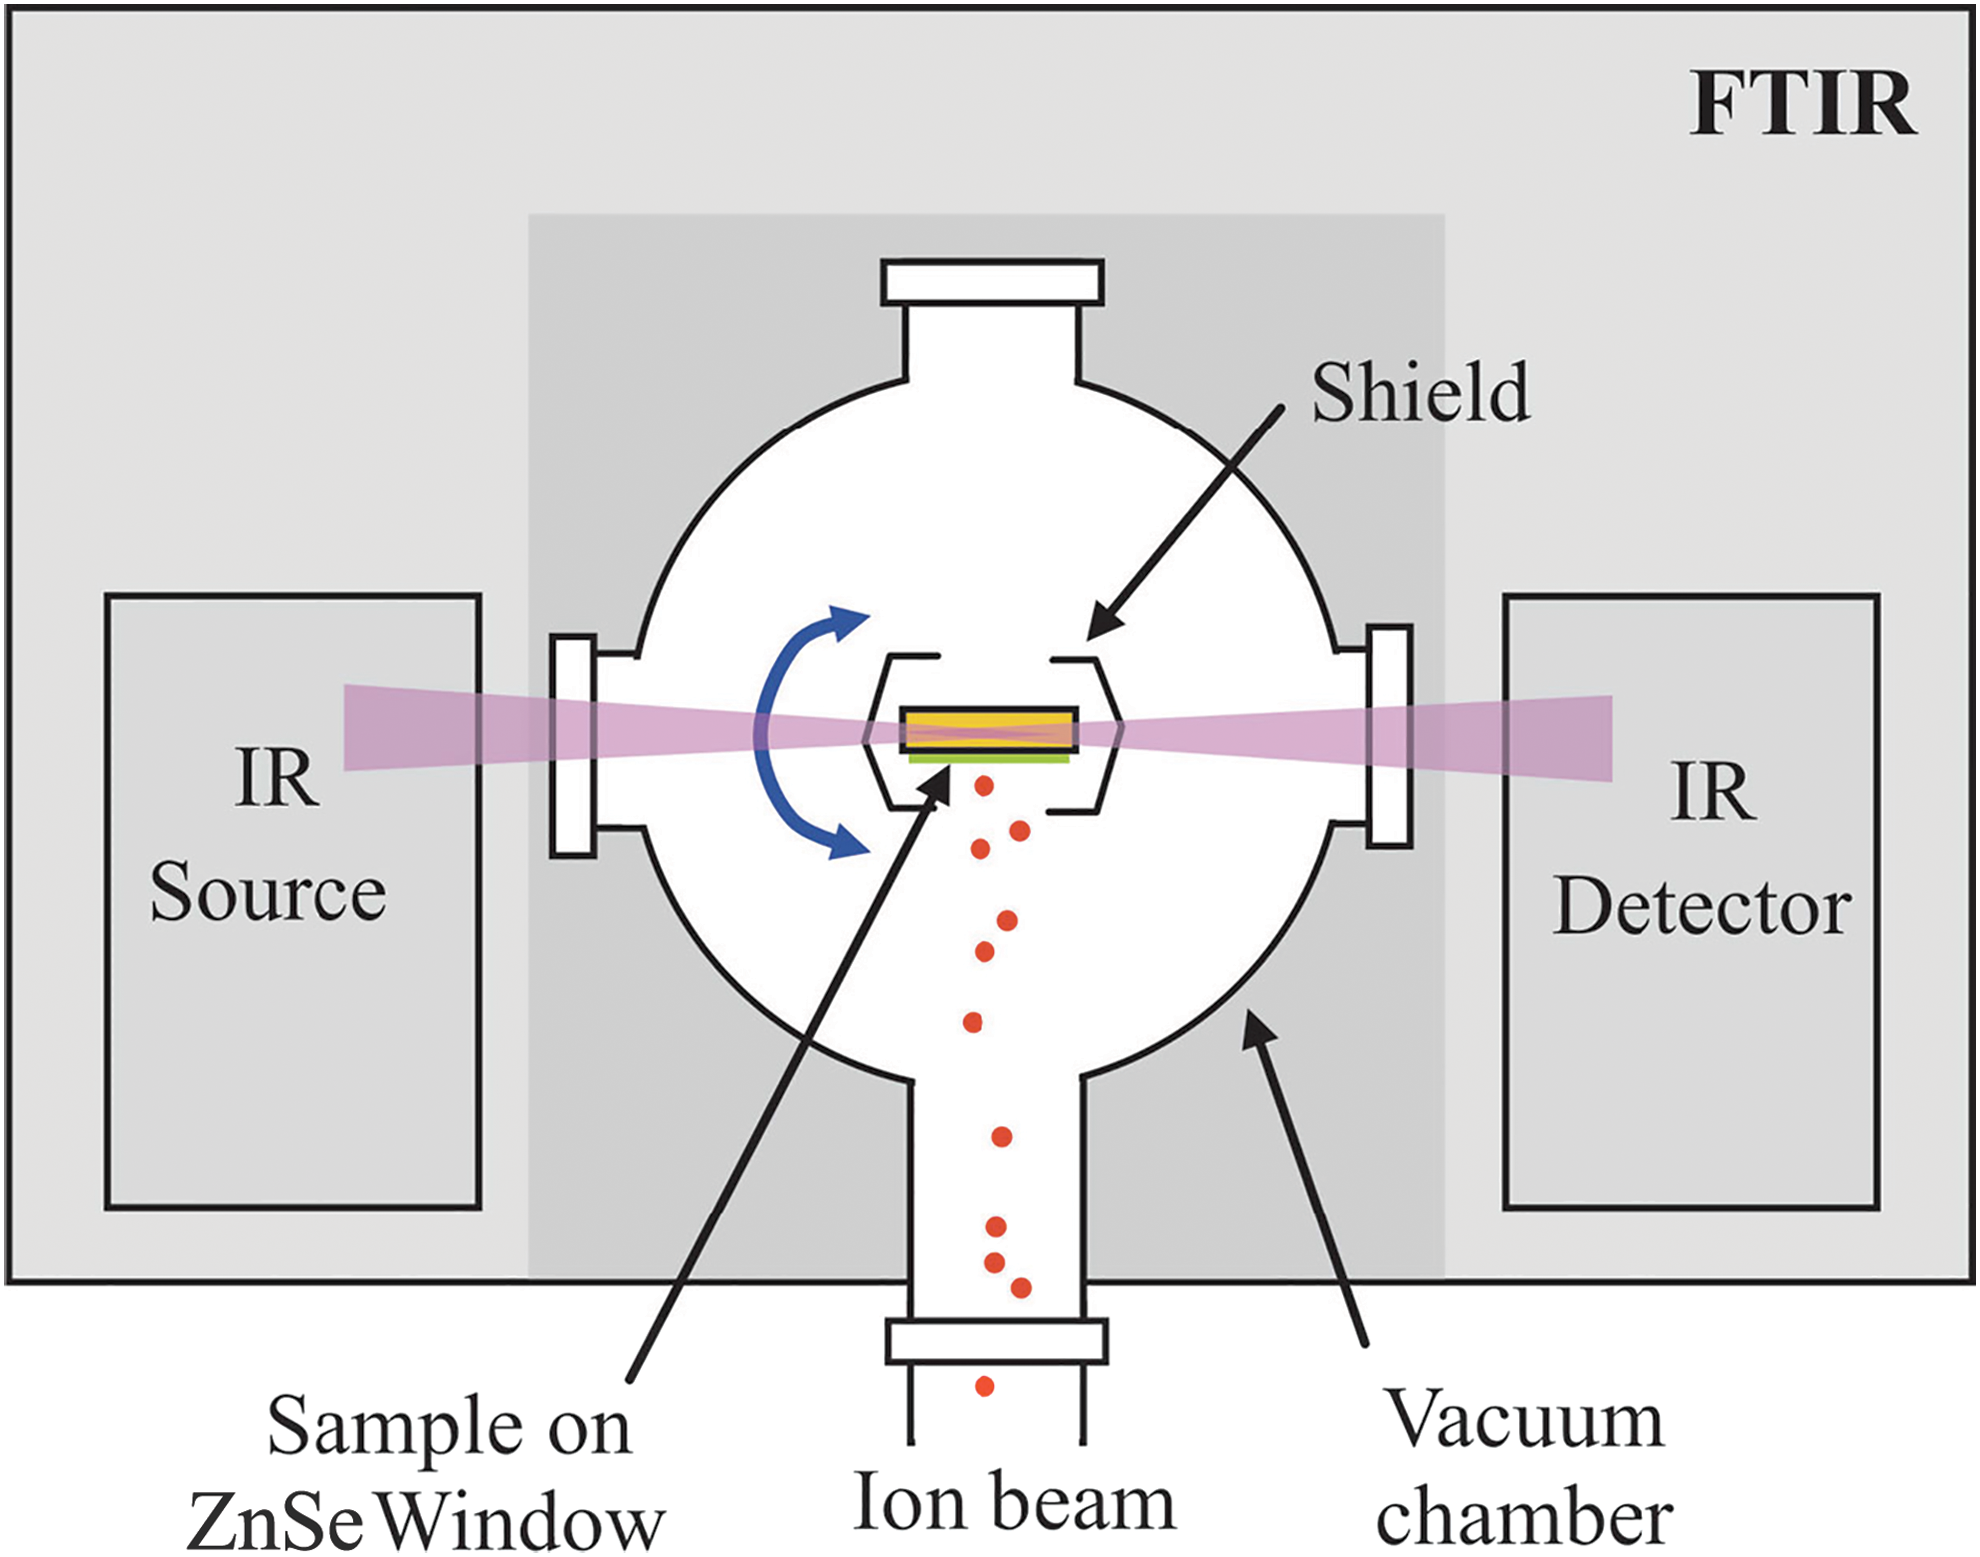
Schematic experimental setup employed for bombardment of solid adenine by heavy ions (Seperuelo Duarte et al., 2010).
The IR absorption spectra were obtained in situ before and after irradiation with a Fourier transform infrared (FTIR) spectrometer [Nicolet Magna 550, mercury-cadmium-telluride detector cooled with liquid nitrogen], operating in transmission mode. The spectra were acquired by 128 scans in the wavenumber range from 4000 cm−1 to 700 cm−1 with a resolution of 1 cm−1. Note that the background of the ZnSe window was taken before the irradiation at 300 and 13 K to avoid thermal optical effects.
The average flux was 109 ions cm−2 s−1. Using the Stopping and Ranges of Ions in Matter (SRIM) software (Ziegler et al. 2012), we calculated the electronic (S e) and nuclear energy loss (S n) of the ions in pure adenine and adenine covered with water ice. The projectile and target properties are summarized in Table 1.
The experimental setup at GSI was similar, though the irradiation temperature was slightly higher (≈20 K) (see Severin et al., 2008; Mejía et al., 2015).
2.3. Infrared absorption spectrum of adenine: band identification
The adenine molecule (Fig. 2) is formed by two heterocyclic rings, one with six atoms (R6) and the other with five atoms (R5). Its empirical formula is C5H5N5. It has a molecular weight equal to 135.13 g mol−1, and the adenine film density adopted was 1.5 g cm−3 (Evans et al., 2011).
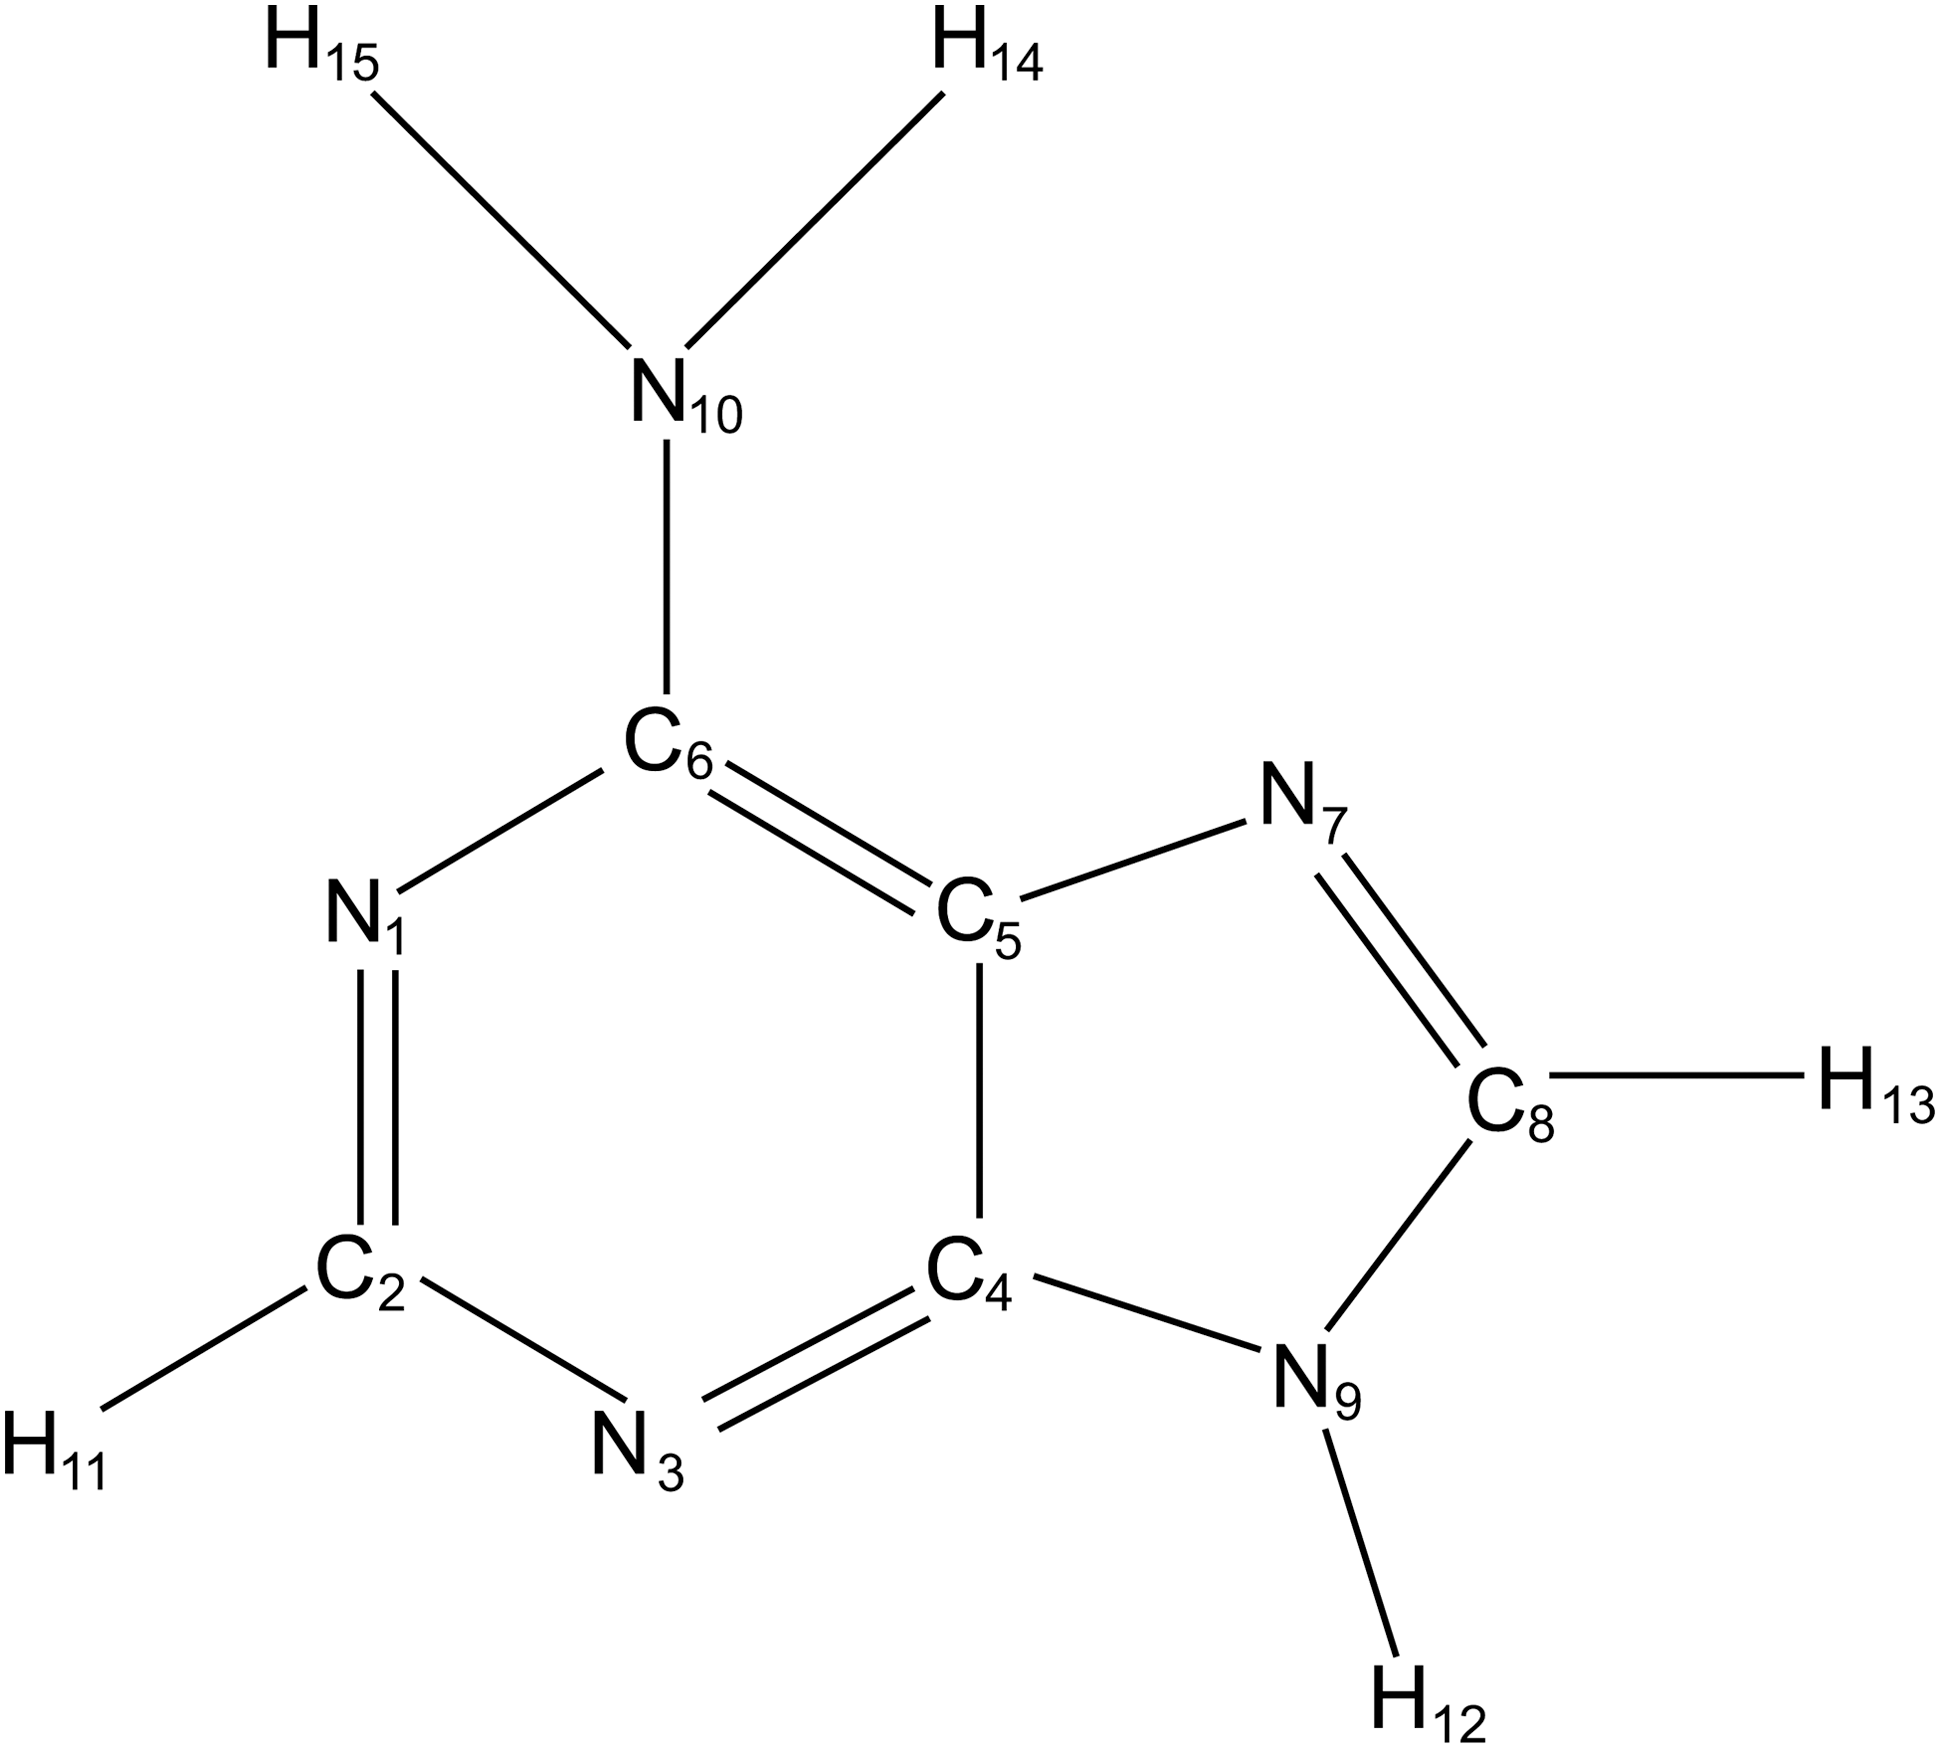
The structure of the adenine molecule (schematic).
The present adenine IR absorption spectrum at room temperature (peak position and assignment) is in good agreement with the results of other authors (Mohamed et al., 2009; Saïagh et al., 2014). Table 2 presents the comparison between the present work and the work of the cited authors.
Figure 3 shows the comparison of the adenine spectra at room temperature and at 13 K. The spectrum of solid adenine at 13 K exhibits a new absorption band at 3260 cm−1 and a small shift to higher wavenumbers. The band at 3115 cm−1 becomes thinner, and the absorption peak in the alpha band is better resolved.
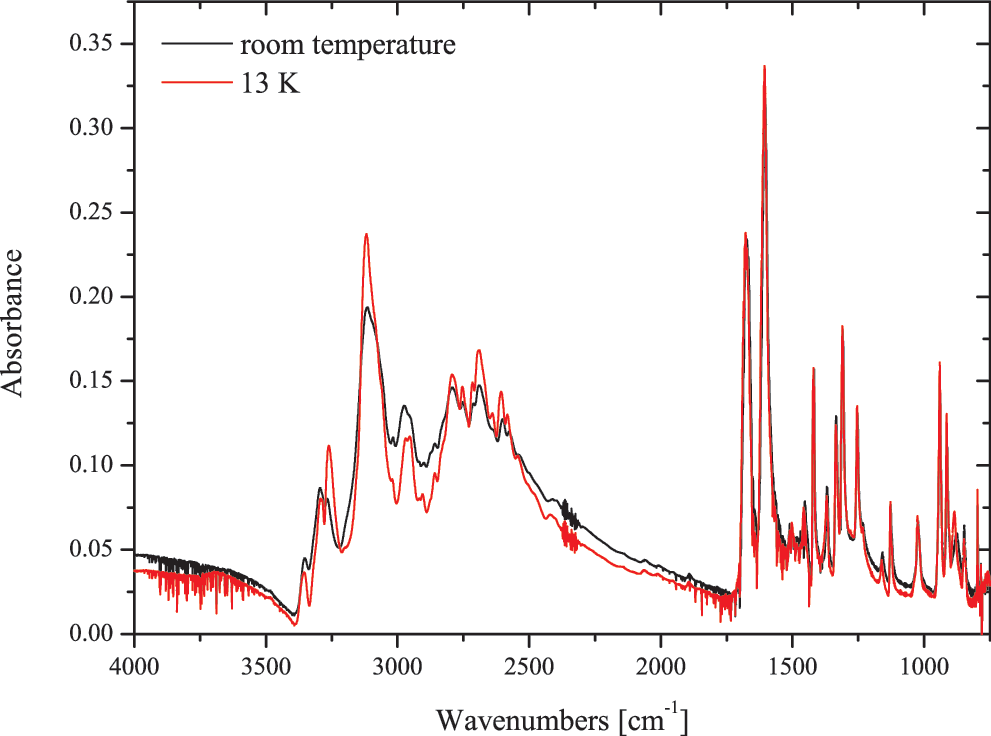
Infrared absorption spectra of solid adenine at 13 and 300 K.
2.4. Sample thickness
Saïagh et al. (2014) referred to the large absorption region in the adenine spectrum between 3400 and 2000 cm−1 as “alpha band.” By using different methods such as laser interference and interferometric microscopy, it has been shown that there is a linear relation between the thickness of solid adenine and its alpha band absorption at room temperature (Saïagh et al., 2014). In the present work, adenine IR spectra were first recorded at room temperature, and the thickness of the samples was estimated by using the linear relationship. Then, the sample was cooled down to around 20 K as earlier discussed in Section 2.2. Table 1 summarizes the experimental parameters.
3. Results
3.1. Adenine fragmentation
During energetic heavy ion irradiation of the adenine film, its overall IR absorption intensity decreases (Fig. 4). Furthermore, new IR absorption bands clearly arise between 2300 and 2000 cm−1. According to the Beer-Lambert law, the absorption area is directly proportional to the column density (number of molecules per cm2). Therefore, the reduction of IR absorption area is due to adenine molecule disappearance caused by either destruction or sputtering. Both effects (destruction and sputtering) can be quantified by introduction of the “apparent destruction cross section” (σ
d) (de Barros et al., 2012; Mejía et al., 2013). The evolution of the peak area as a function of the ion fluence can be written as

Infrared absorption spectra of adenine at 13 K under irradiation of (92 MeV) Xe23+ at different fluences. Inset: Infrared absorption peaks at 914 cm−1 at different ion fluences.
where F is the fluence, A 0 is the initial absorption of a given peak area, and σ d is the apparent destruction cross section.
The intensity of certain bands decreases more rapidly than that of others, yielding different values of the apparent destruction cross section (Appendix Table A1). Effectively, the destruction cross section for a molecule corresponds to the highest value. However, some authors prefer to work with “average” cross sections (Peeters et al., 2003; Evans et al., 2011; Portugal et al., 2014). Here, we choose the cross section that corresponds to the dissociation of NCN at R5 (914 cm−1), because not only does it show one of the highest observed values, but also the band located at 914 cm−1 is not overlapped by water-ice IR absorption bands and thus can be analyzed in a straightforward way without deconvolution. In the case of the samples covered by water ice, only the absorption peak area located at 914 cm−1 was taken into consideration.
Figure 5 shows the evolution of the peak area at 914 cm−1 of pure adenine and adenine covered with water ice as a function of (190 MeV) Ca10+ fluence. Water ice on adenine film prevents the sputtering. The difference between the two curves is within the error bar, showing that the evolution of adenine under irradiation is dominated by radiolysis. Moreover, since the difference between the two curves is insignificant, it is not possible to determine the adenine sputtering yield per incoming ion.
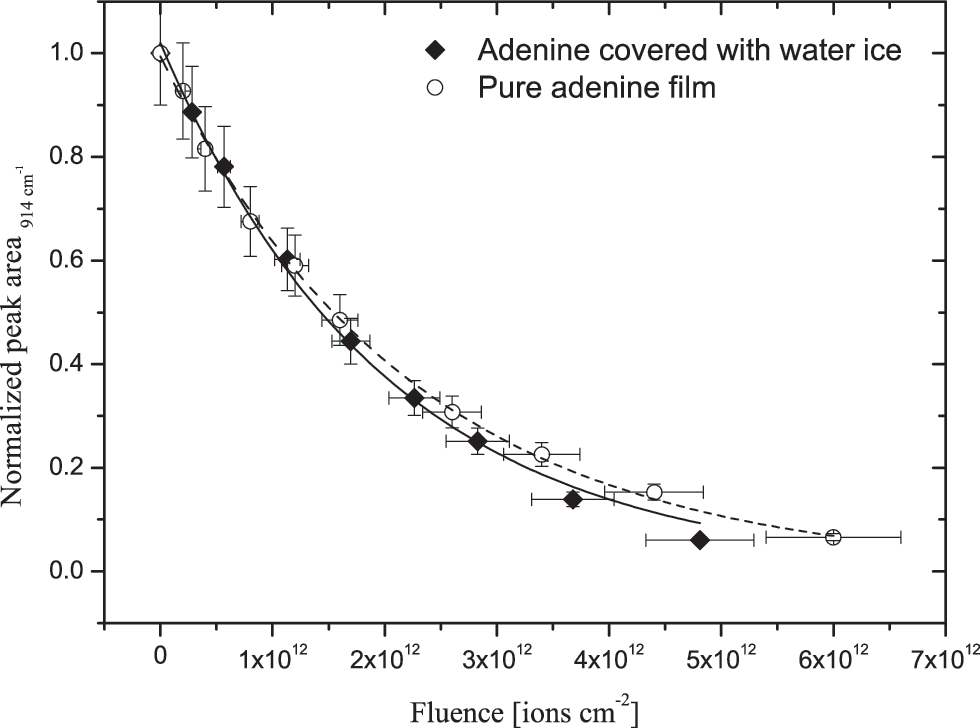
Evolution of peak areas at 914 cm−1 of pure adenine film and adenine film covered with water ice as a function of fluence of (190 MeV) Ca10+.
The physicochemical molecular modification induced by corpuscular irradiation can be divided into direct and indirect effects. The projectiles ionize the target directly; in the present case, ionization of adenine rings followed by dissociation or even atomization of the entire molecule occurs. The indirect effects are related to ionization of neighboring molecules (e.g., if the molecule is embedded in a matrix of water), which produces free radicals that can diffuse and interact with adenine and provoke its rupture.
According to Pullman and Pullman (1963), the reaction with free radicals and nucleobases consists of the addition of a pair of free radicals to one of the double bonds of the nucleobase. In the case of adenine, the most probable site of interaction with free radicals is the bond between the N7-C8 at R5. This is due to a high free valence of the atoms in this bond, in this case the free valence of the C8. Note that the absorption band at 914 cm−1 corresponds to the vibration of NCN at R5; this is an indication that the interaction between free radicals and adenine is important for its radiosensibility.
Table 3 displays the apparent cross section (914 cm−1) and the average apparent cross section for different projectiles. These values are around 104 times higher than for 5 keV electrons (Evans et al., 2011), 109 times higher than for UV photons (Guan et al., 2010), 105 times higher than for X-rays (Pilling et al., 2011), and 106 times higher than for UV photon degradation of adenine in argon matrix (more details in Section 3.2). The typical range of cross sections can be seen in Appendix Table A1 for the following: (1) Xe23+ (92 MeV) in the order of magnitude of 10−12 cm2; (2) Kr33+ (820 MeV) between 10−12 and 10−13 cm2; (3) Ca10+ (190 MeV) 10−13 cm2; and (4) C4+ (12 MeV) between 10−13 and 10−14 cm2.
Figure 6 shows the apparent destruction cross section as a function of the electronic stopping power (S e). Several authors have observed that the destruction cross section obeys a power law: σ = CS e n (de Barros et al., 2011, 2014; Andrade et al., 2013; Dartois et al., 2013; Mejía et al., 2013). Using this equation to fit the experimental data as a function of the electronic stopping power, calculated with SRIM (Ziegler et al., 2012), we find σ = 4 × 10⁻¹⁷ S e 1.17, with S e in kiloelectronvolts per micrometer (keV μm−1). These experiments were performed at two different laboratories (GANIL and GSI). Note that the adenine destruction cross sections obtained at those two different accelerators and with two different experimental setups fall onto one curve; this shows a good consistency and reproducibility of our experiments. Moreover, adenine destruction cross sections for electrons at 5 keV (Evans et al., 2011) match with our curve. The average destruction cross section is close to our curve, with n = 1.08.
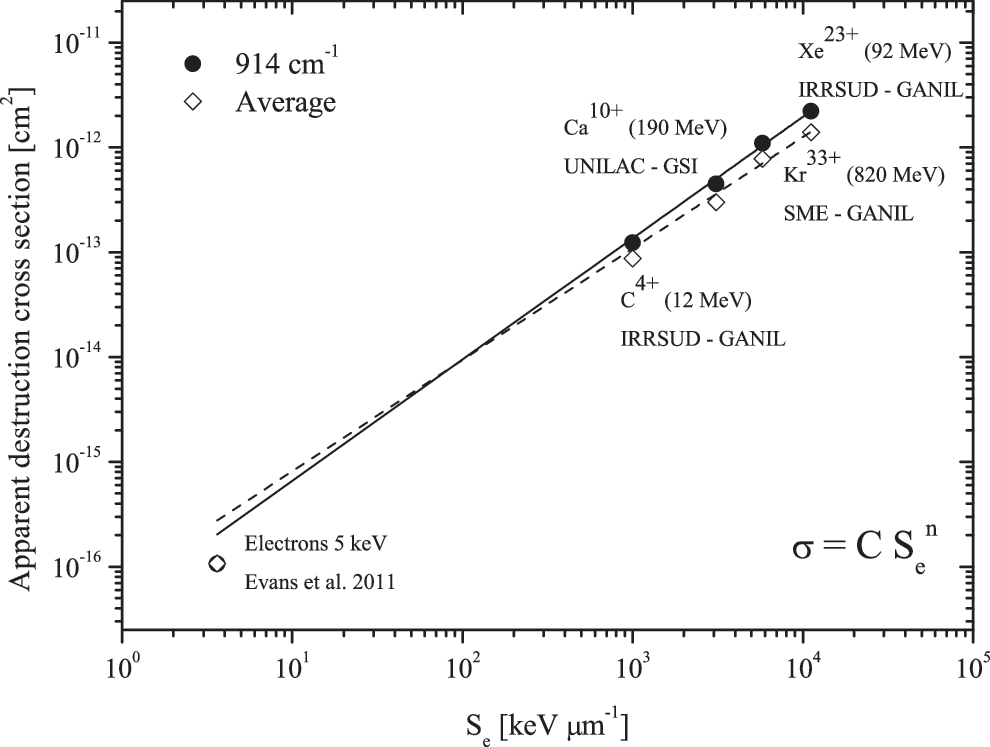
Adenine destruction cross section (914 cm−1) and the average destruction cross section as a function of the electronic stopping power.
3.2. Formation of new molecules
After a deposited local dose higher than 1 eV/molecule, all samples started to exhibit a new absorption band between 2300 and 2050 cm−1. Moreover, vibration modes of C═N (1654, 1478, and 800 cm−1) were observed. Those vibration modes are expected for a primary amine (Günzler and Gremlich, 2002) and are correlated to the opening of the adenine rings. To analyze the formation of new molecules, we deconvoluted the large band (2300–2050 cm−1) that appears when adenine is irradiated by Xe23+ at high fluence (1 × 10¹² ions cm−2) as shown in Fig. 7. This region is characteristic of C≡N and C≡C absorption, which is observable through the deconvolution of absorptions at 2044, 2070, 2092, 2100, 2124, 2144, 2174, 2212, 2240, and 2262 cm−1.
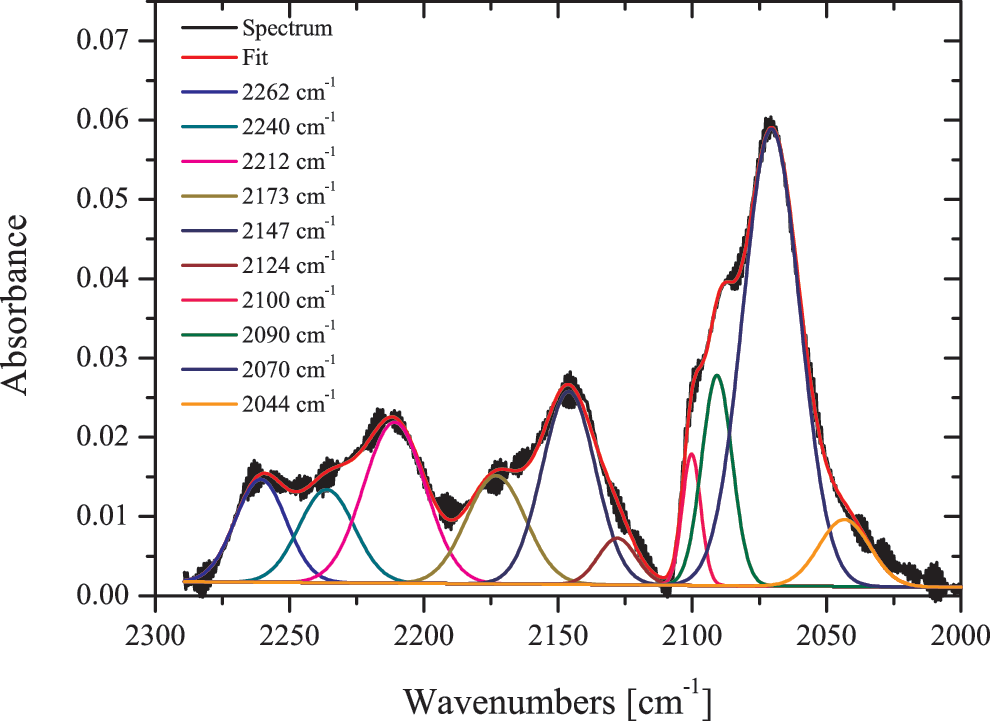
Deconvolution of the band between 2300 and 2000 cm−1 of adenine film irradiated with (92 MeV) Xe23+ at fluence of 1.0 × 10¹² ions cm−2.
Since the adenine IR absorption spectrum is complex, it is difficult to identify new molecular species formed by the fragmentation of these nucleobases, and it is probable that new absorption bands overlap with the bands from residual adenine.
Nevertheless, it is possible to speculate on some candidates of new molecular species responsible for observed absorption. Some molecules are natural candidates, such as HCN (2100 cm−1) (Moore and Hudson, 2003; Burgdorf et al., 2010), CN (2090 cm−1) (Moore and Hudson, 2003), and C2H4N4 (2212 and 2174 cm−1) (Gerakines et al., 2004). The molecule (CH3)3CNC, which has an absorption peak at 2140 cm−1 (Hudson and Moore, 2004), makes it yet another promising candidate. Its full width at half maximum (FWHM) of this absorption peak is 26.4 cm−1. Hence, we can disregard CO as a candidate because even with the same absorption peak at 2140 cm−1 as (CH3)3CNC, its FWHM peak at 1.6 cm−1 is too small for it to be CO (van Broekhuizen et al., 2006). The IR absorption band located at 2240 cm−1 is certainly made by a nitrile that has absorption peaks close within that region (Hudson and Moore, 2004; Evans et al., 2011). However, the interaction between the molecules in their neighborhood can shift the IR absorption peaks and make it difficult to determine which molecule is truly responsible for this absorption. The absorption peak at around 2260 cm−1 is the typical vibration of C≡N; for example, some molecules and radicals like HCNO (Peeters et al., 2003) and cyanomethyl radical (CH2–C≡N) (Pilling et al., 2012) have this absorption band. It is important to mention here that, despite the absence of oxygen in an adenine molecule, pollution from residual gases like water and CO2 is not excluded; therefore, formation of molecules containing oxygen cannot be eliminated. We were unable to attribute any candidates to the absorption peaks at 2044 or 2070 cm−1. There is also a probability of the formation of N2, but these symmetric molecules are difficult to detect by FTIR.
Exposing solid adenine to electromagnetic ionizing radiation did not produce new IR absorption bands. Guan et al. (2010) and Pilling et al. (2011) obtained just 2% of photolyzed adenine. Probably, the number of new molecules generated by the adenine photodegradation is under the limit of detection by IR absorption spectroscopy. In fact, in our case we only observe new IR absorption bands after the degradation of at least 20% of initial adenine. Poch et al. (2014) also exposed thin films of complex organic molecules to UV radiation. Among those molecules adenine was also photolyzed for a long time (2.5 days). Their results are in agreement with ours; for example, they observed a new IR absorption band that emerged from the adenine radiolysis. They assigned those absorption peaks to the vibration of isonitrile groups (R-N≡C) and/or nitrile groups (R-C≡N), the stretching of C═C and C═N corresponding to a vibration of a primary amine. Furthermore, they observed an absorption peak at 2173 cm−1; we believe that this absorption peak also could be attributed to C2H4N4 as in the case of our experiments. Moreover, note that one more indication of the absence of new absorption peaks in the experiments of Guan et al. (2010) and Pilling et al. (2011) is a low susceptibility of adenine to UV photons (Table 4). The photon fluence used by Poch et al. (2014) was around 1 order of magnitude higher than that used by Guan et al. (2010) and 4 orders of magnitude higher than that used by Pilling et al. (2011).
The adenine fragmentation by 5 keV electrons (Evans et al., 2011) produced an absorption band at 2235 cm−1, assigned as R–C≡N. With heavy ions, we also observed the emergence of this band after irradiation (2240 cm−1). The formation of HCN or CN- was not detected by Evans et al. (2011). Their samples were covered with thin O2 ice. Indeed, they describe new bands at 2108, 1035, 702 (O3), 1871 (R–C═O), 1750 (R–C═O), 1610 (C–O–C), 1242 (C–O–C) and 737 (C–O–C) cm−1. In our work, these bands were not observed. The difference between our observations and those of Evans et al. (2011) are probably caused by the reactions with O2 ice layers in their samples.
4. Discussion
4.1. Comparison between different sources of radiation
The comparison of molecular radiation damage provoked by different radiation sources needs to be analyzed with attention because electromagnetic and corpuscular radiation have different energy loss mechanisms. Moreover, the physical state and the environment of the irradiated molecule are important factors for its survival. Guan et al. (2010) exposed adenine films to 10.2 eV photons in the laboratory. Using the BIOPAN 6 facility, which was set outside the automated Russian science satellite Foton M3, they also exposed adenine films directly to the solar winds of Earth's orbit. They reported an adenine half-life 103 times higher than that of adenine in an argon matrix exposed to 10.2 eV photons (Peeters et al., 2003). Guan et al. (2010) claimed that this difference is due to the adenine's physical state; in an argon matrix, the Van der Walls force and H bonding would be weaker, which would favor molecule fragmentation.
We now compare the effects of different sources of radiation on solid adenine. As discussed by Loeffler et al. (2005), the radiation yield G is a useful scaling factor with which to compare effects from different ionizing radiation such as corpuscular and electromagnetic radiation. The definition of G for 10.2 eV photons and corpuscular radiation can be found in their work. To estimate the adenine destruction cross section and the G value for photons of 10.2 eV, we used the results of Guan et al. (2010) and Saïagh et al. (2014). Table 4 shows the destruction cross section and radiation G yield for various charged projectiles and electromagnetic radiation. The radiation G yield in the present case is defined as the number of adenine molecules destroyed per 100 eV absorbed. Note that the effect of swift heavy ions is 10 times higher than that of 5 keV electrons and around 105 times higher than that of 10.2 eV photons. This finding clearly shows that, even with low abundance, heavy ions play an important role in the survival of adenine. It was not possible to calculate the radiation G yield for solid adenine irradiated with 150 eV photons because its absorption cross section is unknown. Moreover, the irradiation of adenine by soft X-rays (Pilling et al., 2011) and UV photons (Guan et al., 2010) was performed at room temperature, and the radiation damage depends on temperature (Fryer et al., 1992; Portugal et al., 2014).
Evans et al. (2011) estimated the destruction cross section for 1 MeV and 1 keV protons under the assumption that they can be obtained by scaling the 5 keV electron data by the stopping power ratio. We can also estimate the destruction cross section for protons using our findings (Fig. 6). Calculating the electronic stopping power of protons by using the SRIM code (Ziegler et al., 2012) together with the observed power law allows us to estimate the destruction cross section for protons at those energies (1 MeV and 1 keV). We obtain the values σ = 1.5 × 10⁻¹⁵ and σ = 2.6 × 10⁻¹⁵ cm2 for 1 keV and 1 MeV protons, respectively. The cross sections reported by Evans et al. (2011) are 40% lower. However, this approximation is of the same order of magnitude as our calculation, which shows the validity of their extrapolation. It is important to say that the observed power law is valid in the electronic stopping power domain. In the case of 1 MeV and 1 keV protons, the electronic stopping power is at least 1 order of magnitude higher than the nuclear stopping power.
Our findings also allow us to compare the radiosensibility of adenine with the radiosensibility of other organic molecules. Portugal et al. (2014) performed an irradiation of glycine with Ni11+ (46 MeV) beams at different temperatures (14 and 300 K). Using the SRIM code (Ziegler et al. 2012) to estimate the electronic stopping power of adenine for Ni11+ (46 MeV), we estimate an adenine destruction cross section of σ = 1.16 × 10⁻¹² cm2 for this projectile. This is half the value reported for glycine at 14 K (Portugal et al., 2014). This demonstrates that adenine is less radiosensitive to radiation than glycine, a finding that can probably be explained in terms of aromaticity. Adenine is an aromatic molecule, and it is well known that aromatic molecules are more radioresistant than aliphatic molecules (Pullman and Pullman, 1963; Sawyer et al., 2008). The delocalization of the electrons allows the absorbed energy to spread out in the aromatic rings and prevents bonds between two individual atoms to be broken. In non-aromatic molecules, the absorbed energy is confined to the bonds that make the dissociation more probable.
4.2. Astrophysical implications
Radio spectroscopy is currently the most precise technique with which to detect molecules in outer space. However, there is a limitation to the detection of molecules in their solid phase. Despite some theoretical predictions, adenine was not detected in gas phase in space. It has been suggested that formation of adenine can occur inside or on the surface of the interstellar grains (Evans et al., 2011; Chakrabarti et al., 2015), and the presence of complex organic molecules including nucleobases in carbonaceous meteorites (Martins et al., 2008; Callahan et al., 2011) is an indication of abiotic synthesis of those molecules in astrophysical environments.
Therefore, if adenine exists in the ISM, its evolution probably happens inside and/or on the surface of icy grains in DCs. Our experiments are close to this scenario: condensed phase at low temperature. However, in icy grains the complex organic molecules are in a matrix of different elements, notably water. Gerakines and Hudson (2013) reported that organic molecules in water matrix (at different ratios) have distinct radiosensibility; when glycine is embedded in a water matrix, the radiation G yield is 1 order of magnitude smaller. Furthermore, astrochemical processes in space are far from being trivial. In this work, we do not take into account reactions that can happen on the surface of grains. Hence, it is important to mention that the present study is a first attempt to understand adenine radiolysis and an extrapolation to astrophysical environments.
By using the observed power law (Section 3.1) and the SRIM code (Ziegler et al., 2012), it is possible to determine the destruction cross section for the 10 most abundant ions in galactic cosmic rays at different energies. Figure 8 shows the adenine destruction cross section as a function of energy. To estimate the adenine half-life (
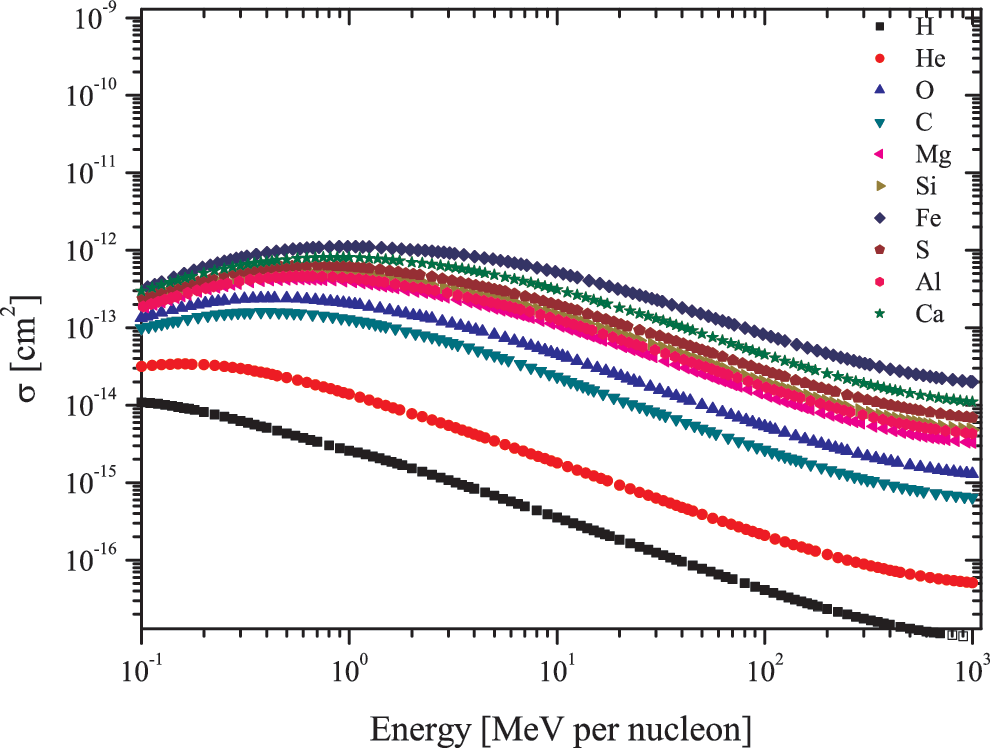
Adenine destruction cross section for different ions as a function of energy.
σ(Z, E) is the adenine destruction cross section, and Φ(Z, E) is the differential flux of cosmic ray ions of atomic number Z (the summation was obtained by using the 10 most abundant ions in galactic cosmic rays).
The distribution of cosmic rays is well known at energies above 1 GeV per nucleon (GeV/n) (Webber and Yushak, 1983; Shen et al., 2004). However, particles at low energies can be expelled from the heliosphere by solar wind and planetary magnetic fields. The spectra of cosmic rays observed from Earth are therefore modulated; hence the flux of cosmic rays is full of uncertainties, especially at low energies due to this modulation (Shen et al., 2004; Padovani and Galli, 2013). Webber and Yushak (1983) showed that Eq. 3 well represents a simulation of the observable cosmic ray distribution.
C(Z) is a normalization constant. The numerical values of the constant C(Z) can be found in the work of Portugal et al. (2014). E 0 is a parameter that modifies the flux at low energy but does not have an impact at high energies. According to Shen et al. (2004), E 0 = 400 MeV per nucleon (MeV/n) is the most accurate value to simulate the observed cosmic ray flux. Although Eq. 3 is just an estimation of the flux of cosmic rays, Dartois et al. (2013) showed that, with different values of the parameter E 0 (200, 400, and 600 MeV/n), it is possible to evaluate cosmic ray ionization rates, which are in agreement with astronomical observations (Indriolo et al., 2007). Following this procedure, we adopted different values of the parameter E 0 (200, 400, and 600 MeV/n) to understand the survival of adenine exposed to cosmic rays.
The destruction rate, that is, the product of the destruction cross section and the flux of cosmic rays, will determine the survival of adenine exposed to cosmic rays (Eq. 2). Cosmic rays are ions with a broad energy range from a few megaelectronvolts per nucleon to teraelectronvolts per nucleon. The energy range adopted in this study is from 10−1 to 103 MeV/n because it is the range with the most intense cosmic ray flux, as it is also within the range that S e is in, which is at least 2 orders of magnitude higher than S n. Our power law (Fig. 6) is valid in the electronic stopping power regime only. As an example, we plotted (Fig. 9) the loss of energy per unit of path length of iron nuclei in solid adenine as a function of energy; in Fig. 9 both electronic (S e) and nuclear (S n) stopping power are included. It should be kept in mind that maximum energy deposition occurs between 0.1 and 10 MeV/n. Thus, the ion beams employed in this work are good analogues for cosmic rays. Set aside from that, ions with energies above 1 GeV/n deposit a very little amount of energy electronically. There is also the possibility of nuclear reactions.
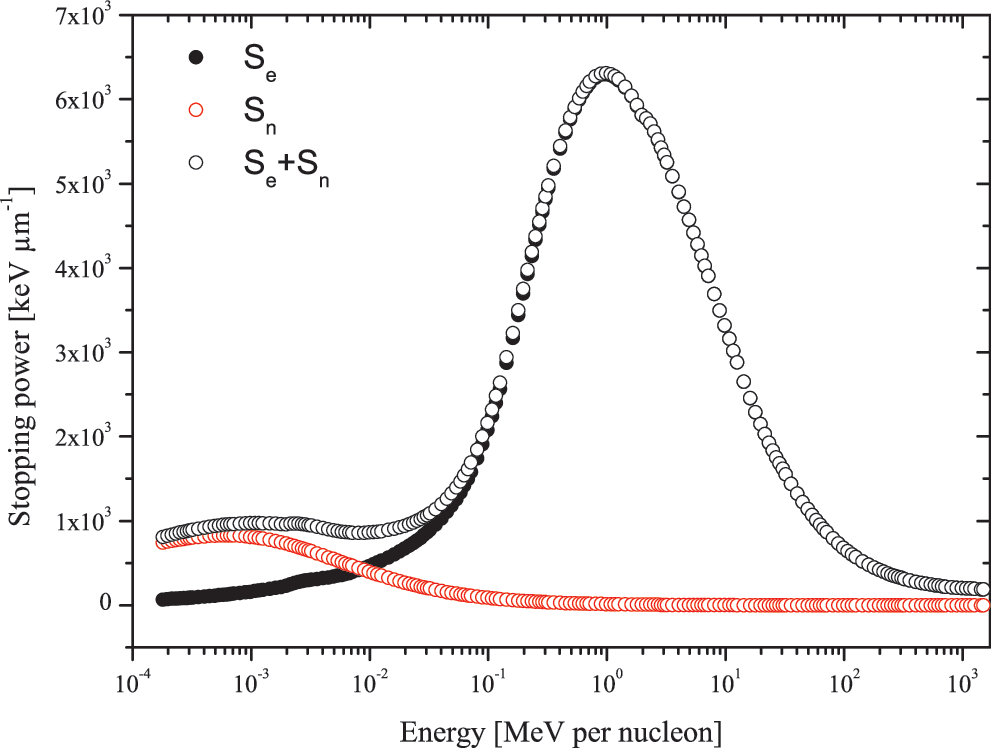
Electronic stopping power (S e), nuclear stopping power (S n), and the total stopping power (S e + S n) as a function of the projectile energy in solid adenine.
Figure 10 shows the destruction rate (σ d × Φ) as a function of energy for different ions. As can be seen in the figure, iron and protons are the biggest contributors to adenine destruction despite the fact that the flux of iron is much smaller than that of protons. This shows the importance of heavy ions: even if less abundant, their contribution cannot be neglected. Table 5 displays the half-life of solid adenine exposed to cosmic rays for different values of E 0 in the ISM and the average adenine half-life (the error given is the standard deviation).
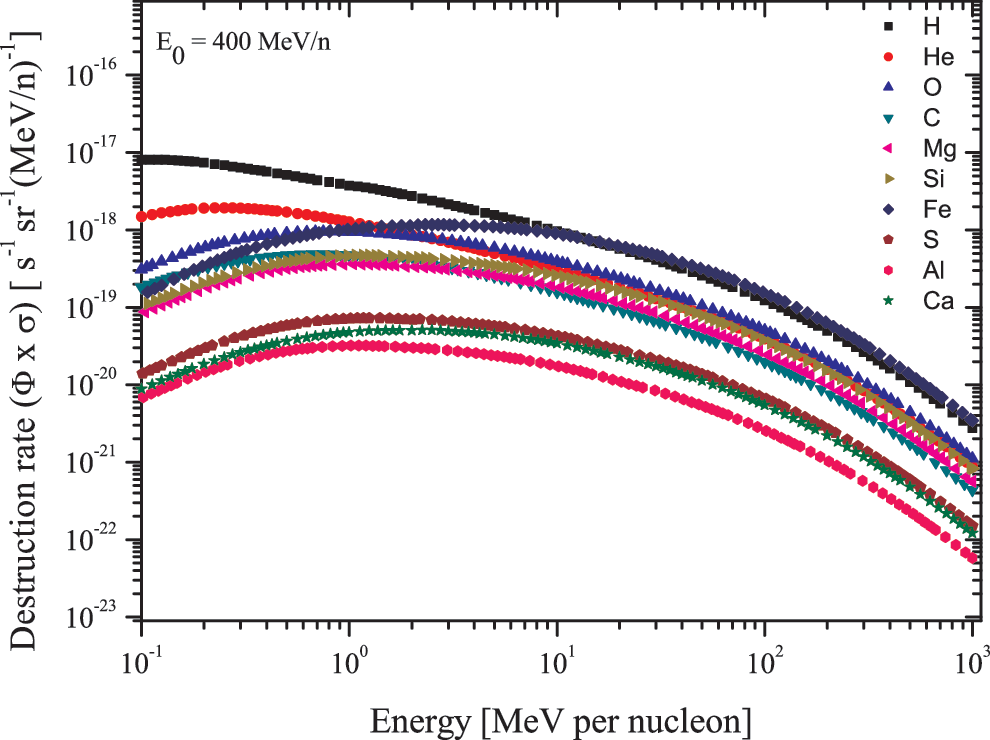
Adenine destruction rate for different ions as a function of energy. E 0 = 400 MeV/n.
As discussed by Peeters et al. (2003), the half-life of adenine is different within distinct regions of outer space due to UV deterioration. The scattering provoked by the grains and dust within DCs shields their interior against UV photons emitted from neighboring stars. The secondary UV radiation induced by the impact of cosmic rays on hydrogen plays an important role in those regions, but its flux is 5 orders of magnitude smaller in comparison with UV flux in the diffuse interstellar medium (DISM) (Ehrenfreund et al., 2001; Moore et al., 2001; Palumbo et al., 2008). By using the results of Peeters et al. (2003) together with the UV destruction cross section of solid adenine we calculated by referring to the work of Guan et al. (2010), it is possible to estimate the half-life of solid adenine exposed to UV photons in the DISM and DCs:
5. Conclusion and Outlook
In the present work, the destruction of pure adenine by heavy ions in the electronic stopping power domain was studied. The destruction cross section was determined as a function of electronic stopping power in the form CS e n , with n = (1.17 ± 0.06).
Our results exhibit an adenine destruction cross section about 109 times higher than for UV photons, 105 times higher than for soft X-rays, and 103 times higher than for 5 keV electrons. The yield G is around 1 order of magnitude higher for heavy ions in comparison with 5 keV electrons and 105 times higher than for UV photons. Our results show that destruction of adenine exposed to cosmic rays is dominated by iron nuclei and hydrogen. This is necessary for an understanding of formation and, in particular, survival of nucleobases in outer space.
Moreover, the adenine half-life was estimated inside DCs as
New IR absorption bands that come from the degradation of adenine under irradiation were detected. Molecules such as HCN, CN-, and C2H4N4 are possible candidates for these absorption bands. The present results can be of help toward the understanding of the abundance and origin of those organic molecules.
Footnotes
Acknowledgments
This work was supported by Brazilian agencies CNPq (INEspaço and Science without Borders) and FAPERJ, as well as the CAPES-COFECUB French-Brazilian exchange program. It is a pleasure to thank Thierry Been, Jean-Marc Ramillon, Toiammou Madi, Dr. Florent Moisy, and Dr. Clara Grygiel for their invaluable support. Many thanks to Dr. Emmanuel Balanzat, Dr. Yvette Ngono-Ravache, Prof. Dr. Enio da Silveira, and Dr. Diana Andrade for important discussions. The authors wish to acknowledge the staff of GANIL and GSI for their invaluable help during the course of the experiments. We are particularly thankful to Prof. Dr. Christina Trautmann, Dr. Daniel Severin, Dr. Markus Bender, Alexander Warth, and Arne Siegmund at GSI. The experiments were performed at Grand Accélérateur d'Ions Lourds (GANIL) Caen, France, and at GSI Helmholtzzentrum für Schwerionenforschung, Darmstadt, Germany. Part of this work was supported by the ANR IGLIAS project, grant ANR-13-BS05-0004 of the French Agence Nationale de la Recherche. This work was co-funded by the European Commission, FP7 for RTD Capacities Program (Contract No. 262010, ENSAR), and the EU's Horizon 2020 Research and Innovation Programme (grant agreement No. 654002 ENSAR2).
Author Disclosure Statement
No competing financial interests exist.