
Abstract
We developed a novel method for distinguishing abiotic and biological iron oxidation in liquid media using oxidation-reduction (redox) potential time series data. The instrument and processing algorithm were tested by immersing the tip of a Pt electrode with an Ag-AgCl reference electrode into an active iron-oxidizing biofilm in a groundwater discharge zone, as well as in two abiotic systems: a killed sample and a chemical control from the same site. We used detrended fluctuation analysis to characterize average root mean square fluctuation behavior, which was distinct in the live system. The calculated α value scaling exponents determined by detrended fluctuation analysis were significantly different at p < 0.001. This indicates that time series of electrode response data may be used to distinguish live and abiotic chemical reaction pathways. Due to the simplicity, portability, and small size, it may be suitable for characterization of extraterrestrial environments where water has been observed, such as Mars and Europa. Key Words: Oxidation-reduction potential—Detrended fluctuation analysis—Iron-oxidizing bacteria. Astrobiology 16, 846–852.
1. Introduction
M
The redox state of any aqueous environment is the quotient of the chemical activity of dissolved oxidized and reduced chemical species, as shown in the Nernst equation:
where E is the electrochemical potential of the cell, R is the universal gas constant, T is absolute temperature, n is the number of electrons participating per atom, F is Faraday's constant, and Q is the reaction quotient,
Microbial metabolic reactions transfer electrons from a reduced donor species and to an oxidized terminal electron acceptor, harnessing the energy released for cellular functions (Weber et al., 2006). As such, microbial bioenergetic metabolic activity is based on redox reactions; additionally, other metabolic reactions such as fermentation reactions can produce and consume redox active species. In this way, all metabolically active microorganisms directly influence the relative abundance of redox active substances and chemical properties of their environment (van Bochove et al., 2002; Bethke et al., 2011). Microbes mediate redox reactions, which can cause significant changes in pH and redox potential. Since redox potential represents a physically constrained measurement of a biological system, the biological manipulation of redox potential creates an opportunity to directly examine microbial influence on physicochemical system parameters.
Characterizing in situ microbial activity remains a pressing issue in environmental microbiology as 99% of microorganisms cannot be cultured (Hugenholtz et al., 1998). At present, describing microbial activity in pristine and contaminated environments most often involves measurement of specific metabolite concentrations in samples recovered from study sites of interest as well as studies using “-omics” approaches to determine community metabolic potential (genomics), gene expression (transcriptomics), and protein profiles (proteomics) (Dick and Lam, 2015). A technique that could distinguish between microbial and abiotic processes passively, in situ, would be an incredibly useful complement that could guide microbiological sampling and study but monitor systems on a longer-term basis.
Here, we present a novel method of analyzing in situ bacterial activity by the correlation strength of time series of redox potential in a series of circumneutral, microaerophilic, Fe(II)-oxidizing systems. We analyzed three chemically similar solutions from the same source—one live and two abiotic (mimicking autocatalytic and homogeneous oxidation, respectively) (Melton et al., 2014)—to determine the sensitivity of electrode response time series to changes in electrode response induced by the presence of microbes. We hypothesize that these differences in correlation strength arise from biological activity wherein cell surfaces not only act as reactive substrates but where microbes also actively manipulate the movement of O2, Fe2+, and Fe3+, and their metabolic substrates and products, giving rise to correlation.
This technique does not rely on constraining environmental or physiochemical conditions of a niche; instead, it depends on the diffusion of metabolically significant, redox-active species in solution (Oldham, 1966; Frateur et al., 1999; Mampallil et al., 2013). The method uses low-cost, straightforward instrumentation, allows broad comparisons between diverse systems, and does not necessitate either removing organisms from their niches or collecting samples of biomass for genomic analysis; all data are collected passively in situ. Any niche accessible to an electrode is suitable for this type of analysis.
Fluctuations of electrode response arise from the motion of dissolved chemical species, also known as Brownian motion or diffusion (Gabrielli et al., 1993; Eliazar and Shlesinger, 2013). Correlation is a property of a time series or process that describes the statistical dependence of directly and distantly neighbored values (Witt and Malamud, 2013); long-range correlations are where all, or almost all, values are correlated with one another. That is, values are correlated with one another at very long lags in time (Taqqu and Samorodnitsky, 1992; Beran, 1994; Witt and Malamud, 2013). Detrended fluctuation analysis (DFA) calculates a relationship between root mean square (RMS) fluctuation and time by quantifying the strength of long-range correlation in a time series (Hardstone et al., 2012; Witt and Malamud, 2013).
Here, DFA is used to assess time-domain, self-similarity, and correlation behavior in biological and chemical systems. We hypothesize that statistically significant differences in fluctuation patterns of redox potential, as evidenced by differences in scaling exponents, are the result of biological influence on redox transformations or, in the case of chemical systems, the lack of biological activity. We suggest that measuring the redox potential time series could be a good complement to the analysis of metabolites and genetic sequences, that is, multiple measurements of several different system parameters.
Iron-oxidizing systems are well suited for this type of analysis because of the direct link between iron redox state to both cellular metabolism and the redox potential of a solution, with a concomitant voltage change. Organisms that exploit the Fe(III)/Fe(II) redox couple to fuel cellular growth underpin global biogeochemical cycling of iron (Weber et al., 2006; Emerson et al., 2010).
In addition to varied terrestrial systems, this method may specifically be relevant to future missions to Mars (Bibring et al., 2004), Europa (Kargel et al., 2000), Enceladus (Waite et al., 2009), or other environments where liquid, and especially water, is known to be present. Redox instability has been documented on the surface of Mars (McSween et al., 1999), implying that, given suitable geochemical conditions, Fe-based biological activity might be possible.
2. Methods
2.1. Instrumentation
Electrode response time series were collected with a NI6009-USB data acquisition device (DAQ) interfaced with a PC running LabVIEW using standard National Instruments DAQmx VIs. This setup is intended for measuring voltage time series in aqueous environments with a design that (1) allows portability for use in the field, (2) is straightforward for interfacing and programming, and (3) provides a cost-effective tool for accurate and reproducible measurements. Figure 1 describes the experimental setup. The DAQ was configured to measure voltage from the electrode in analog mode using differential inputs, where the Pt wire was ground-referenced to a heavy iron rod driven at least 18 cm into soil, located a minimum of 2 m from the point of sampling in a hydrologically separated area. This reference location is typically in an unsaturated zone above and away from the measured environment. The DAQ was placed inside a metal box that was fitted with a BNC feedthrough to connect the differential inputs of the DAQ to the BNC signal cable from the electrode and a USB outlet for connecting the DAQ to the PC. The shielding of the electrode BNC signal cable, the DAQ ground, and the ground of the PC were all connected to the heavy iron grounding rod. This strategy was found to eliminate pickup noise.

Schematic diagram of the experimental setup designed to measure redox potential using a Pt working electrode and Ag/AgCl reference electrode. AI0+, AI0-, and GND describe specific pins on the NI-6009 USB DAQ.
By measuring the potential across the electrode in differential mode, any further variations in common mode noise were eliminated. Additional testing to assess the impact of aliasing was achieved with a Tektronix TDS 3054B oscilloscope, and testing indicated no visible contributions from common noise sources. No anti-aliasing filters were applied, because specifying a low-pass band assumes a priori knowledge of the frequency range where chemical reactions contributing to fluctuations would be observed.
Measurements are performed by immersing the tip of a double-junction, gel-filled redox electrode (combination Pt Ag/AgCl) in the aqueous medium for sampling. Measurements were collected at a sampling frequency of 500 Hz for approximately 12 min, then downsampled to individual realizations of 2–10 Hz. Oversampling was intentionally performed to permit statistical analysis on a pool of estimates, without having to make initial assumptions about scaling range or chemical interactions that might contribute to scaling.
Once immersed, redox-active ions in solution become mobile across a ceramic plug in the tip of the electrode due to the difference in electrochemical potential between the Pt tip and a reference Ag wire immersed in a KCl gel. The selection of Pt electrodes was based on the extensive use of Pt electrodes in environmental electrochemical studies (Flühler et al., 1976; Vershinin and Rozanov, 1983; Faulkner et al., 1989; Sampedro et al., 1999; Swerhone et al., 1999; van Bochove et al., 2002; Kasem and Jones, 2008; Ojumu et al., 2008), often for measuring redox potential and dissolved oxygen (Whitfield, 1969; Swerhone et al., 1999). Pt electrodes have been used continuously for measurements recorded over years, with either no or minimal changes in performance over the timescale of the study (Smith et al., 1978; Austin and Huddleston, 1999; Swerhone et al., 1999; van Bochove et al., 2002), and are known to be reliable under a variety of environmental conditions (Kasem and Jones, 2008).
Additionally, as this test system is characterized by circumneutral, microaerophilic Fe(II) oxidation, we have selected an electrode assuming that the electrode selected is responsive to the diffusing species of interest; Pt electrodes are known to be sensitive to the metabolic species of interest, dissolved Fe(II), as long as concentrations are higher than 10−5 M (Vershinin and Rozanov, 1983; Stumm and Morgan, 1996), which they are for this site (James and Ferris, 2004; Ferris et al., 2016).
When describing electrode response in diffusion-limited systems, both theoretical and laboratory studies have indicated that current is influenced by the redox state of the species in bulk solution and not by the electrode making the measurements (Mampallil et al., 2013); this is important as it confirms that redox potential and fluctuations being measured arise from the dynamics of the system as a whole and not from the microenvironment immediately surrounding the electrode tip.
2.2. Processing method
Collected time series were analyzed in MatLAB using a custom DFA routine (Peng et al., 1994).
The first step in DFA data processing is to remove the mean and integrate the time series. The time series is divided into windows of length n. A least-squares fit is calculated for each window, and the integrated signal is detrended by subtracting the local trend. The average fluctuation per window is calculated using a RMS algorithm, and the value for the average fluctuation, F(n), is plotted against the window size, n, in log space. If a straight line is observed over a range of time windows, the time series is persistent within that range, thus defining a scaling range. The slope of this line is the α value, or scaling exponent. Finally, the magnitude of α provides information about the strength of the long-range correlation behavior of the time series (Hardstone et al., 2012). Brownian motion gives rise to a scaling exponent α = 1 (Metzler and Klafter, 2000; Ramanujan et al., 2006), with 1 < α < 2 relating to processes exhibiting fractional Brownian motion (Metzler and Klafter, 2000; Eliazar and Shlesinger, 2013). In random uncorrelated time series, such as Gaussian white noise, α = 0.5 (Metzler and Klafter, 2000; Witt and Malamud, 2013), while α < 0.5 indicates negative persistence and α > 0.5 indicates positive persistence (Peng et al., 1994, 1995; Metzler and Klafter, 2000; Hardstone et al., 2012; Witt and Malamud, 2013).
Detrended fluctuation analysis provides two significant advantages over the more common Fourier analysis: no assumption of linearity, stationarity, or independence of measurements is made, and the amount of time required for a complete data set is achieved at n = ∼103, regardless of the sampling frequency (Metzler and Klafter, 2000; Shao et al., 2012). The inherent variability of field conditions over hours and days creates a preference for shorter time series, where stable conditions over the measurement window could be reasonably expected. However, the minimum time series length must be long enough in real time to cover the entire scaling range.
Collection of very long (several hours) low-frequency time series is complicated in field settings due to changes in conditions, such as temperature and light, over the course of a day. Environmental time series analyses are also complicated by the complexity of the chemical interactions being studied, the slower time scales of kinetic processes that give rise to fluctuations, and inherent variability of dilute aqueous systems. While several other time domain techniques are available, such as fluctuation analysis, adaptive fractal analysis (Riley et al., 2012), and detrended moving average analysis, DFA consistently performs well while requiring time series of only n = 1000 measurements (Shao et al., 2012).
2.3. Field site
To specifically isolate the biological influence on fluctuations, a well-characterized test site that hosts a thriving circumneutral microaerophilic Fe(II)-oxidizing microbial mat was used to test the field suitability of the technique. The study site was described in detail by James and Ferris (2004). Briefly, it is an anoxic anaerobic iron-rich groundwater seep colonized by a thriving microbial mat produced by Leptothrix ochrachea with a minor component of Gallionella ferruginea (James and Ferris, 2004). Oxygen for the oxidation of Fe(II) is supplied from the atmosphere, and the seep intersects a fully aerated stream about 3 m from the seep source; the reduced, anoxic groundwater is spatially confined to the narrow, shallow (3–15 cm) creek.
In addition to an in situ sample, two controls were prepared: a killed sample was used to evaluate the influence of the flocculent bacteriogenic iron oxides (BIOS) that are precipitated by the Fe(II)-oxidizing microbial community (autocatalytic oxidation; Melton et al., 2014), and a chemical control was used that removed both biological activity and the flocculent iron oxide particles (homogeneous oxidation; Melton et al., 2014).
The killed sample was prepared by collecting an aliquot of BIOS of equal volume to the Live system microcosm (described below) and sterilizing it by autoclaving. The chemical control was prepared by filtering water from the extant biofilm with 0.22 μm syringe filters. Microcosms were prepared and measured creek-side, with the time elapsing between removing the water from the creek and the first measurement at less than 5 min.
2.4. Determining Fe(II) oxidation rate constants
Pseudo-first-order oxidation rate constants were determined for the live system and both controls to confirm that the extant biofilm was active at the time of measurement. The protocol used for the microcosms was described by Ferris et al. (2016). Measurements of dissolved Fe2+ and total Fe were collected every 30 min for 2 h.
2.5. Additional test solutions
To create a test scenario as close as possible to an equilibrium state, the electrode was allowed to rest in an aluminum foil–wrapped bottle of 3 M KCl solution for several weeks, after which a time series was collected.
3. Results
3.1. Oxidation rate constants
The pseudo-first-order oxidation rate constants were determined to be 0.0093 min−1 for the live sample, 0.0069 min−1 for the autoclaved sample, and 0.0019 min−1 for a filtered creek water sample, broadly consistent with the results reported by James and Ferris (2004) and Ferris et al. (2016) for the same site. The significantly enhanced oxidation rate can only be explained by the presence of an actively metabolizing microbial community. This confirms that the differences in α values observed between the in situ system and the controls can be attributed to the presence of microbial activity.
3.2. Fluctuation analysis
Raw and integrated profiles from a 2 Hz downsampled realization of length n = 1000 (8.3 min) are presented in Fig. 2. The electrode response is distinct in each system, as evidenced by the dramatically different random walk paths. These differences would not be apparent from the slightly different potentials at which the electrode stabilizes in each system (Fig. 2).

Oxidation-reduction potential raw data and integrated data from each of the three time series; raw data, in mV, plotted against left axis, while the integrated signal is plotted on the right.
Fluctuations and the resulting α values (scaling exponents) are plotted in Fig. 3 for the time window for the same realization as Fig. 2; the three systems exhibit linear behavior from n = 20 to n = 1000, indicating a scaling range of 10–500 s. Table 1 shows the average α value (scaling exponent) and standard error of 54 independent realizations (2, 5, and 10 Hz) for each of the three test systems: the live system (Live; α = 1.676 ± 0.010); the killed system (Killed; α = 1.235 ± 0.014); and the filtered creek water system (Creek; α = 0.819 ± 0.098). The Live system scaling exponent indicates very strong correlation; the Killed system indicates moderately strong correlation, while the Creek system exhibits only moderate correlation. The presence of flocculent oxides appears to induce stronger correlation when compared to a fluid-only system.
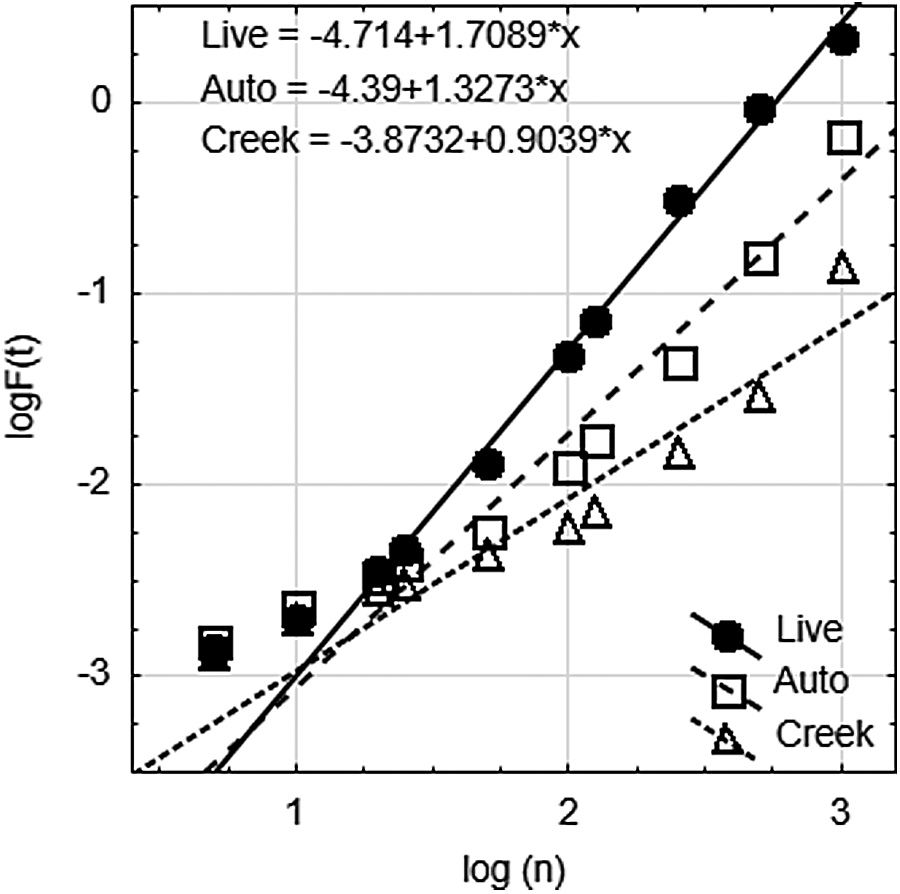
Detrended fluctuation analysis results for three experimental systems. These results represent α calculated for a single realization of each process with n = 1000, at measurement frequency 2 Hz. RMS is root mean square fluctuation as calculated using DFA. Scaling range is observed from n = 20 to n = 1000, corresponding to 10–500 s; short window sizes (n = 5, n = 10) which do not display linearity are excluded from linear regression analysis, as outlined in description of DFA algorithm.
By comparison, when the same processing steps were applied to one realization from the electrode in KCl storage solution, the scaling exponent was α = 0.6, which is slightly higher than the expected value for a system at equilibrium, α = 0.5, and indicates no correlation whatsoever (Metzler and Klafter, 2000; Jeon et al., 2014). This very weak correlation likely represents intrinsic instrument noise and confirms that the observed scaling exponents in the test systems result from system-intrinsic correlation behavior.
4. Discussion
4.1. Testing of alpha values
Two-sided t tests on the mean α values for each system confirm that each group of realizations is distinct at p < 0.001. Both the magnitude of drift and the shape of the potential profile are common to all electrochemical techniques, and the average size of a single fluctuation (as measured in step 2 of DFA) does not change over the course of the measured potential. This confirms that any electrode drift is fully corrected for in the detrending algorithm.
It must be noted that the decision to forego anti-aliasing filters comes with the limitation that this particular setup is optimized for low-noise environments, or those environments that can be electrically isolated using other methods (i.e., a Faraday cage) to distinguish the system of measurement from transient electrical phenomena. It is also possible to include an anti-aliasing filter provided enough data on the system is available to make informed decisions about rates and processes of interest.
4.2. Biogeochemical significance
The ability to distinguish between different chemical solutions on the basis of fluctuation behavior presents a significant step forward in the ability to monitor the in situ conditions of environments of geomicrobiological significance. The variation between α values indicates that biological processes give rise to stronger correlation of time series measurements of fluctuations in redox potential in the systems studied here. This is consistent with results of correlation analysis recently reported for low-biomass and high-biomass circumneutral, microaerophilic Fe(II)-oxidizing systems (Enright and Ferris, 2016), where the low-biomass condition gave rise to a scaling exponent of 1.67 and the high-biomass condition gave rise to a scaling exponent of 1.89 (Enright and Ferris, 2016).
The differences between the killed and chemical control are likely due to the presence of autocatalytic Fe(II) oxidation occurring in the system with iron oxide flocs. It would appear that long-range correlation in redox potential has the sensitivity to distinguish different kinetic pathways in situ. The experimental approach adopted here provides novel information about biological manipulation of metabolically significant species in solution and about the overall chemical environment a microorganism inhabits. Additionally, this technique provides a means of determining whether circumneutral Fe(II) oxidation is microbially influenced or fully abiotic.
The dominance of a single metabolic pathway in the test site selected here simplified interpretation of the observed electrochemical potentials, as the response could be attributed directly to a single metabolic process: the oxidation of iron. Application of this technique to other metabolic pathways and more complex microbial communities may require the selection of different electrode materials or even a suite of electrodes that would make it possible to determine the behavior of individual chemical species.
4.3. Astrobiological significance
The “follow-the-energy” approach to astrobiology was first proposed in 2007 (Hoehler, 2007), and since that time significant progress has been made to quantify minima of biological free energy (Amend and Teske, 2005; Hoehler and Jorgensen, 2013) and power (LaRowe and Amend, 2015a, 2015b). However, no in situ analysis method, to date, has been proposed to provide insight into habitability as a broad concept. Due to the fact that redox potential is, in fact, a measure of the chemical energy available in a system (DeLaune and Reddy, 2004), there is certainly now the possibility of examining not only redox potential but the in situ activity of specific metabolites using ion-selective electrodes.
Development of this method for future missions would require consideration of the detection limits of possible electrode materials, as well as their capacity to be poisoned under some chemical conditions, especially in the context of hypothetical metabolic pathways that could be exploited by life in these environments.
5. Conclusion
Here, we have developed a technique to distinguish biological and abiotic oxidation of Fe(II) in situ, by quantifying RMS fluctuations of redox potential in chemical and biological systems and confirming that such fluctuation behavior is distinct between chemical and biological systems. Biological systems consistently exhibit statistically significant stronger correlation behavior than the chemical solutions measured here.
The key benefit of this approach is its utility in field settings and the facility of comparing between niches. This technique has the potential to be applied to a wide variety of environments as it requires only the possibility of placing an electrode in contact with the system to be measured. We present downsampled data from a system that was intentionally oversampled so as not to make any initial assumptions about the nature of the interactions that might give rise to scaling; however, the observed scaling range necessitated downsampling data to optimize realization length for the selected method. This can easily be modified to suit other chemical species of interest. While iron was the only metabolite tested, this study presents a compelling case for testing additional metabolites.
Footnotes
Acknowledgments
This work was generously supported by a Natural Sciences and Engineering Research Council of Canada (NSERC) Discovery Grant to F.G.F. The Ogilvies are thanked for access to the field site.
Author Disclosure Statement
No competing financial interests exist.