
Abstract
In 2020, the ESA ExoMars and NASA Mars 2020 missions will be launched to Mars to search for evidence of past and present life. In preparation for these missions, terrestrial analog samples of rock formations on Mars are studied in detail in order to optimize the scientific information that the analytical instrumentation will return. Desert varnishes are thin mineral coatings found on rocks in arid and semi-arid environments on Earth that are recognized as analog samples. During the formation of desert varnishes (which takes many hundreds of years), organic matter is incorporated, and microorganisms may also play an active role in the formation process. During this study, four complementary analytical techniques proposed for Mars missions (X-ray diffraction [XRD], Raman spectroscopy, elemental analysis, and pyrolysis–gas chromatography–mass spectrometry [Py-GC-MS]) were used to interrogate samples of desert varnish and describe their capacity to sustain life under extreme scenarios. For the first time, both the geochemistry and the organic compounds associated with desert varnish are described with the use of identical sets of samples. XRD and Raman spectroscopy measurements were used to nondestructively interrogate the mineralogy of the samples. In addition, the use of Raman spectroscopy instruments enabled the detection of β-carotene, a highly Raman-active biomarker. The content and the nature of the organic material in the samples were further investigated with elemental analysis and methylated Py-GC-MS, and a bacterial origin was determined to be likely. In the context of planetary exploration, we describe the habitable nature of desert varnish based on the biogeochemical composition of the samples. Possible interference of the geological substrate on the detectability of pyrolysis products is also suggested. Key Words: Desert varnish—Habitability—Raman spectroscopy—Py-GC-MS—XRD—ExoMars—Planetary science. Astrobiology 17, 1123–1137.
1. Introduction
I
Among the variety of samples identified as potential Mars analogues, specimens of desert varnish represent ideal candidates with which to document the habitable character of biogeological samples. Indeed, desert varnish samples primarily comprise clays, iron (III), and manganese (IV) oxides (Potter and Rossman, 1979), three minerals that are understood to potentially support life on Earth (Grotzinger et al., 2014). Desert varnish is only several microns in thickness and can be found on the outer part of rocks in dry, stable, cold, or hot environments on Earth (Dorn, 2008). Although the suggested microbial origin of desert varnish is still controversial (Perry et al., 2006; Dorn, 2007), desert varnishes are associated with extremophilic biological colonization (Perry et al., 2003; Schelble et al., 2005; Dorn, 2008). Hard desert varnish skins may also preserve organic matter in hostile environments for considerable periods of time (Mancinelli and White, 1996; DiGregorio, 2002). Furthermore, manganese-rich coatings (similar to terrestrial desert varnish) have been identified on martian rocks by the ChemCam instrument on the Curiosity rover (Lanza et al., 2014).
For planetary exploration, assessing the habitability of a geological sample involves verification of the presence of the minimum set of components necessary for life. For example, astrobiologists who investigate the evolution and limits of known life have identified the following requirements for life (Rothery et al., 2011):
(a) Liquid water should be available, since water is the universal solvent that allows chemical reactions necessary to sustain life. The presence of solid water, frozen at the poles of Mars, has been confirmed, and seasonal flows of gaseous water are suggested (Mellon et al., 2009). Recently, NASA confirmed that liquid water could still flow at the surface of Mars at present (NASA Water on Mars, 2015; Ojha et al., 2015). However, although liquid water may be present on Mars, the surface of Mars remains quite dry. On Earth, some microorganisms are known to survive dry periods by using the water trapped in hydrous minerals that are capable of storing water such as gypsum, feldspar, hematite, or clays (Sadooni et al., 2010). Seasonal flows of liquid and gaseous water on Mars could possibly maintain a sufficient degree of rock hydration and sustain microorganism activities. The hydration state of the minerals within a rock substrate is therefore an important measure of its habitability.
(b) Life also requires a source of energy to power microorganism metabolisms (Grotzinger et al., 2014). On Earth, most of the energy supplied to living organisms comes from the Sun (via photosynthesis), although many autotrophic microorganisms have also been found to have the capability to draw energy from redox reactions in their immediate environment (chemosynthesis) (Fisk and Giovannoni, 1999; Ehrlich and Newman, 2009). In that respect, the presence of iron- or manganese-rich minerals is of interest as the redox couple Fe3+/Fe2+ has been reported to drive the metabolism processes of microbes on Earth (Roden and Zachara, 1996). Equally, a mineral source of manganese is relevant to the habitability of a rock, since some terrestrial microorganisms are also known to draw energy from the redox reactions of manganese (Marnocha and Dixon, 2013).
(c) Finally, life needs nutriments such as sources of carbon, hydrogen, nitrogen, oxygen, phosphorus, sulfur, and iron (Rothery et al., 2011). These atoms are sourced from the environment and constitute the building blocks of life as we know it. Lipids, carbohydrates, amino acids, and nucleic acids are the building blocks of the living cells and are mainly carbon-based molecules (Schulze-Makuch and Irwin, 2008). Some of these building blocks, however, which are nothing more than small organic molecules, can be produced abiotically as well (Chyba and Sagan, 1992; Johnson et al., 2008). Indeed, there are a good number of organic molecules that occur in space (Ehrenfreund and Charnley, 2000), but evidence of alien life is yet to be discovered. Extraterrestrial organic molecules and carbon deposits can potentially be used as nutrients for forms of life and, therefore, are an indicator of habitability. These building blocks are actually quite important in the context of the search for evidence of life (past or present). When combined, polymerized or generated by biological processes, organic molecules constitute molecular proof of life and are known as biomarkers (Edwards, 2007). However, it must be stressed that the notion of biomarker, in the context of astrobiology, often includes not only the carbon remains of life (extinct or extant) but also indirect fingerprints of life such as textural patterns in geological records (preserving the structure of biological communities) or minerals whose deposition was affected by microorganisms (Konhauser and Riding, 2012).
To assess the habitability of Mars, the ExoMars and NASA 2020 rovers will interrogate the surface and subsurface of the planet to search for biomarkers that might be contained within a geological host. Many analytical techniques have been proposed to document the composition of the surface and subsurface of Mars, in terms of both geo- and biomarkers. These include X-ray diffraction (XRD), Raman spectroscopy, and pyrolysis–gas chromatography–mass spectrometry (Py-GC-MS).
X-ray diffraction is a standard technique used to identify minerals and characterize their respective atomic structure, and is a powerful tool for identifying well-crystallized materials (geomarkers). This technique, however, suffers from a lack of sensitivity to amorphous phases and biomarkers that are not naturally crystallized. XRD was initially proposed to be part of the ExoMars rover (MARS-XRD instrument) (Marinangeli et al., 2007) but was ultimately descoped (in 2012) following a reduction in the payload mass.
Raman spectroscopy is a nondestructive technique that requires no mechanical or chemical preparation of the samples and is sensitive to both geo- and biomarkers (Jorge Villar et al., 2006; Miralles et al., 2012; Jehlička and Oren, 2013). During the ExoMars mission, a Raman instrument (the Raman Laser Spectrometer; RLS) will provide analytical interrogation of crushed rock specimens acquired from the surface and subsurface of Mars (Rull et al., 2011). Miniaturized Raman spectrometers have been developed and used for many different analytical applications including the analysis of Mars analog samples (Jehlička et al., 2010, 2011; Vandenabeele et al., 2014; Vitek et al., 2014). In a previous publication (Malherbe et al., 2015), we reported a study of seven desert varnish samples recovered from the Mojave Desert that involved, for the first time, the use of miniaturized Raman spectrometers in the green visible (i.e., 532 nm, as is currently baselined for both ExoMars and Mars 2020) and in the near-IR (785 nm). The miniaturized spectrometers were operated in acquisition modes representative of those to be adopted by the rover instruments. Successful characterization of the samples was achieved with miniaturized instruments for both the 532 and 785 nm excitation sources. The detection of β-carotene in some of the samples with a 532 nm excitation laser was reported. Spectral analysis complications caused by the presence of rare earth element photoluminescence when using a 785 nm excitation laser were also discussed.
Pyrolysis–gas chromatography–mass spectrometry, elemental analysis to determine total organic carbon (TOC), and stable carbon isotope analysis (δ13CTOC) are standard methods that have been employed to interrogate the nature of organic matter in soils and sediments (e.g., Saiz-Jimenez, and De Leeuw, 1986; Vidal et al., 2016). Fragmentation of macromolecular organic matter via rapid heating in an inert atmosphere results in the product of GC-amenable pyrolysis products, from which the original macromolecular structures may be inferred. To assist the reliable identification of precursor structures, samples can also be pretreated with the online methylating agent tetramethyl ammonium hydroxide (TMAH). Py-GC-MS has been proposed for a number of exploratory missions on Mars (see also Navarro-Gonzálezet al., 2003) and will be the principal operating mode of the Mars Organic Molecule Analyzer (MOMA) instrument on the ExoMars mission (Brinckerhoff et al., 2013). Several studies of Mars analog material have previously employed pyrolysis methods (e.g., Navarro-González et al., 2003, 2009; Geffroy-Rodier et al., 2009), although none, to our knowledge, applied this method to desert varnish material and/or combined this method with Raman spectroscopy in terrestrial analog studies.
In preparation for future missions to Mars, we present a study of powdered specimens of desert varnish from the Mojave Desert that involved the use of a suite of four analytical techniques: XRD, Raman spectroscopy, TOC, and Py-GC-MS. These techniques were used to investigate the samples and assess the complementarity of these four methods in characterizing the analog samples with laboratory instrument analysis. The results are reported in the context of characterization of the habitable nature of a biogeological sample with spectroscopic and spectrometric information. The data reported here will also support further optimization and characterization of prototype instruments.
2. Materials and Methods
2.1. Samples
Several specimens of rock exhibiting an apparently varnished surface were obtained from two separate locations in the Mojave Desert, USA. The samples were described in detail elsewhere (Malherbe et al., 2015). Three samples (DV1, DV2, and DV3) were retrieved from a stabilized alluvial fan surface from the Funeral Mountains east of Death Valley. They are covered with a black varnish. Four other samples (CV1, CV2, CV3, and CV4) were retrieved from a desert pavement surface overlying a stabilized eolian deposit in the Cady Mountains, east of Barstow, California. They are coated with a brownish varnish.
Following the in situ RLS analyses with portable instrumentation, as reported by Malherbe et al. (2015), the desert varnish coatings were removed from the rock substrata with sterilized stainless steel tools. A flat spatula was used to remove the desert varnish from outer surfaces, while a small hook was used to remove the desert varnish in small asperities. Images of the obtained desert varnish samples are presented in Fig. 1. These were obtained with a Brunel SP60P microscope (through a × 10 objective, 0.25 NA) equipped with a Canon EOS 1100D camera. Clearly, the average particle size was smaller for the samples from Death Valley (average of 100 μm in diameter) than for the samples from the Cady Valley (ranging from 100 up to 600 μm in diameter). These grain size values are in agreement with the grain size delivered by the ExoMars Sample Preparation and Delivery System (SPDS) (Schulte et al., 2010). For both sets of samples, the majority of the grains appeared to be orange to red or transparent. Silvery dark grains were observed for the samples DV1, DV2, and DV3, but not for the samples CV1, CV2, CV3, and CV4 (although for these samples darker features are observed on some selected grains).
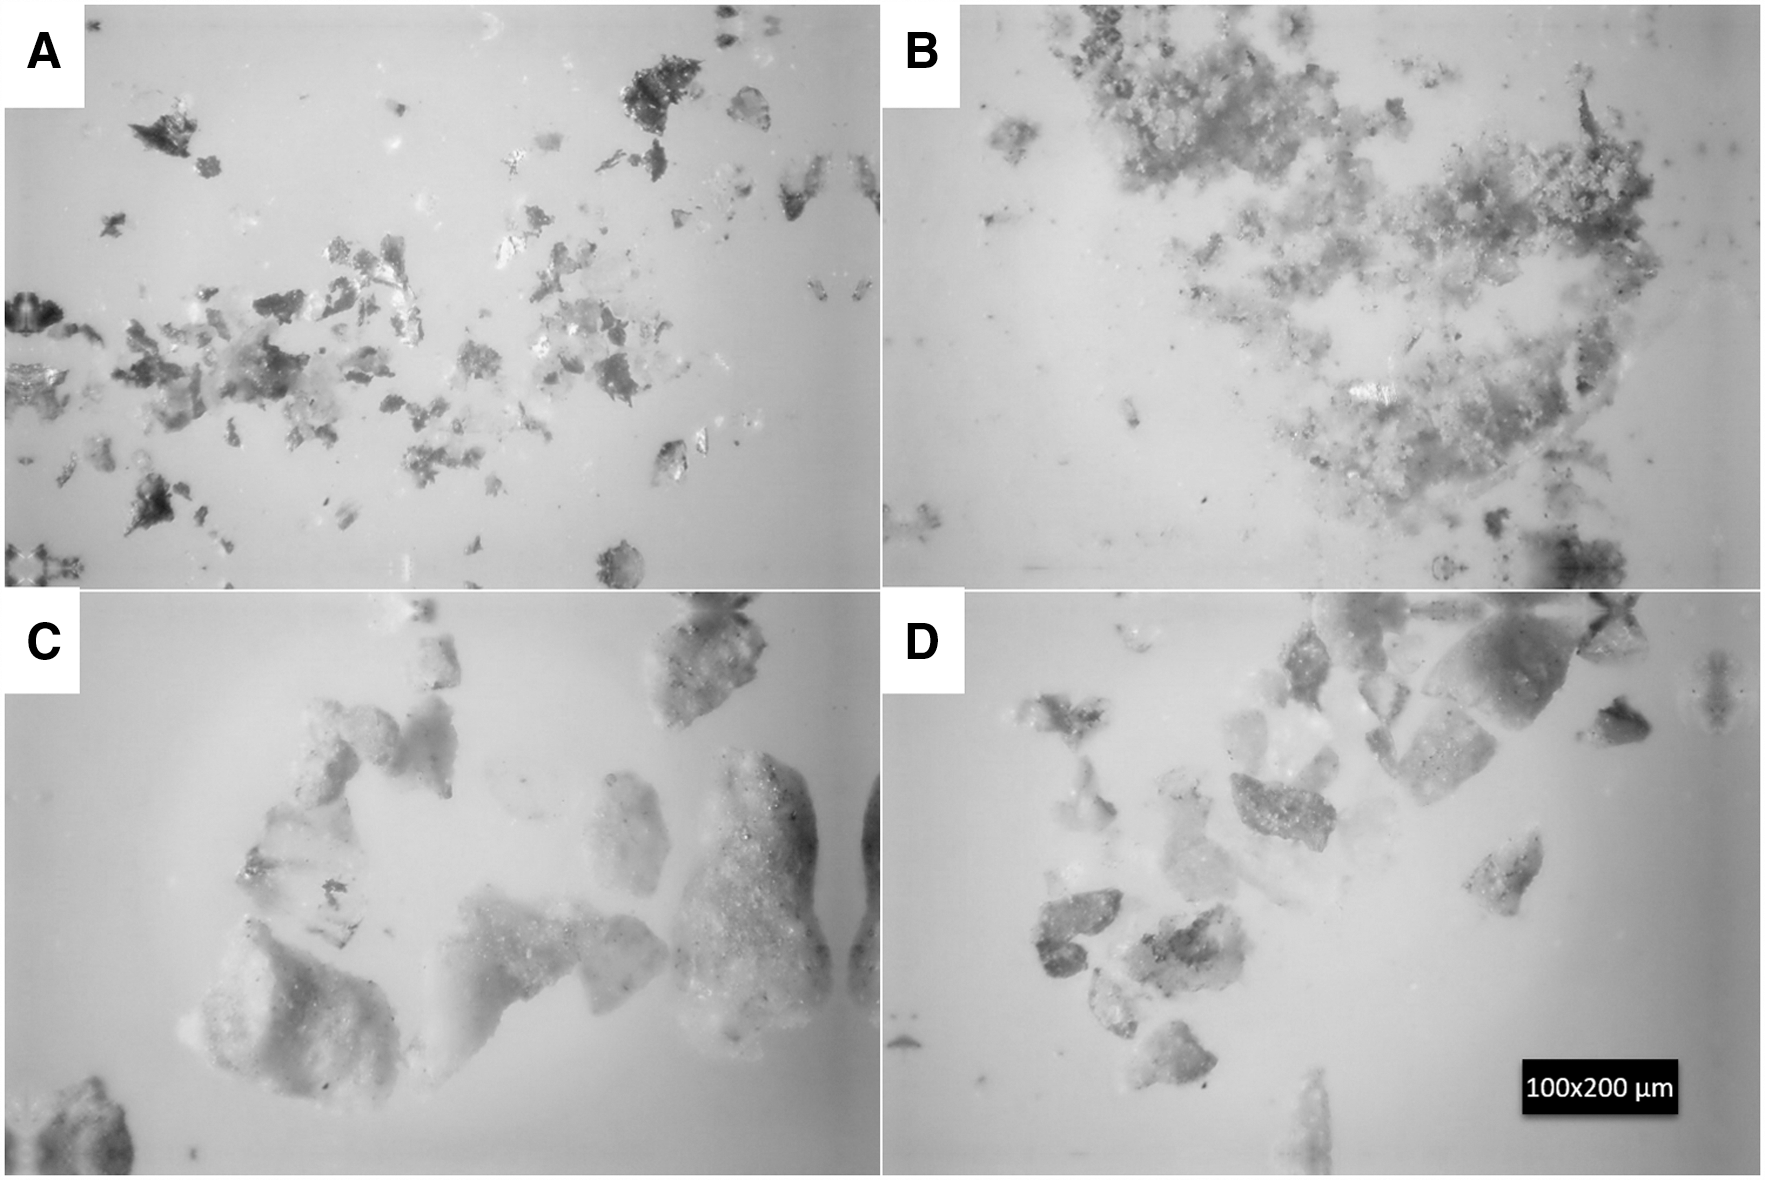
Representative images of the desert varnish grains torn off the sample (
2.2. X-ray diffraction
X-ray diffractograms of all samples of desert varnish were recorded with a parallel beam diffractometer (Bruker D8, Cu Kα radiation). Only a small amount of each sample was available. Therefore, the sample powder was deposited on flat zero-background substrate covered with a very thin film of Apiezon M grease. This sample preparation also helps prevent preferential orientation. The diffractograms were measured in the 2 theta range between 3° and 60° with a step size of 0.04° and a step time of 16 s/step. The qualitative analysis of the crystalline phases in the diffractograms was performed with the search/match tool of the DIFFRAC.EVA software (Bruker) using the PDF4+ database from the International Center for Diffraction Data.
2.3. Raman spectrometer
Each powdered sample was analyzed with a Horiba Jobin-Yvon LabRAM 300 confocal Raman spectrometer provided with an Olympus microscope. The spectrometer was interfaced to two lasers: the 514 nm line of a Spectra Physics model 164 argon ion laser and the 632.8 nm line of a Melles Griot He-Ne laser. Several spectra were recorded (between 4 and 10) for each of the samples. Since the samples could be damaged (combustion or phase transition) by local heating from the high laser energy focused on the sample, the laser power was varied between 0.4 and 40 mW with the green lasers (514 nm) and between 0.07 and 7 mW with the red laser, depending on the nature (sensitivity) of the particular sample under investigation. The recording time was varied between 10 and 150 s, depending on the input power selected. All spectra were obtained as an average of two spectra for each area analyzed.
The spectral baseline was corrected (where necessary) by fitting a polynomial function to the spectra. To do so, the spectral data were sampled (every 10 wave-number bins), and a polynomial function fit was performed for the first set of data. The polynomial background was iteratively evaluated. The very first polynomial background was estimated from a reduced selection of data points (one out of 10). Then, for each iterative step, a new polynomial was calculated to fit a new selection of data points (selected if the corresponding intensity was lower than the previous calculated background plus a 1% threshold of the maximum spectrum intensity). The iteration continued until a minimum was reached for the average deviation between the polynomial background and the selected data points.
2.4. Total organic carbon and δ13C measurements
Total organic carbon and δ13CTOC were determined with a SerCon ANCA GSL elemental analyzer interfaced to a SerCon Hydra 20–20 continuous flow isotope ratio mass spectrometer.
2.5. Methylated pyrolysis–gas chromatography–mass spectrometry
The seven powdered desert varnish samples were analyzed with Py-GC-MS using a CDS 1000 pyroprobe interfaced to a Perkin Elmer Clarus 500 GC/MS system (lower cutoff set at m/z = 50). Approximately 10–20 mg of sample was encapsulated in a clean quartz tube (previously heated until it was red in an oxidizing flame) and held in place with quartz wool plugs (formerly washed with a mixture of MeOH/DCM 1:1 v/v). A total of 10 μL of a solution of TMAH (10% w/v) was added to the samples just before the pyrolysis to prevent the complete thermal degradation of some compounds. The samples were inserted into the pyrolysis chamber for 15 s under helium flux prior to the analyses. The samples were then pyrolyzed at 610°C for 15 s. The pyrolysates (fragments formed during the pyrolysis) were then transferred (through a heated transfer line maintained at 310°C) to a CP-Sil 5CB MS column (30 m × 0.25 mm × 0.32 μm) maintained at 40°C for 1.8 min. The GC temperature ramped to a final temperature of 310°C (at the rate of 4°C per minute) for 20 min.
The different fragments generated during the pyrolysis process were identified based on their mass spectra and their retention indices. The Amdis 2.71 software (developed by the National Institute of Standards and Technology, NIST) was used to further identify and integrate the peaks on the total ion current (TIC) chromatogram. The relative abundance of each identified compound was then determined from the ratio of the individual compound integrations to the summed integrations of all identified compounds, following the work of Vancampenhout et al. (2008).
3. Results
Four analytical techniques previously proposed and included in planetary exploration missions were used to characterize seven samples of desert varnish recovered from the Mojave Desert, USA. The results of the various analyses are presented as follows: XRD, Raman spectroscopy, carbon content and stable carbon isotopes analysis, and finally the Py-GC-MS.
3.1. X-ray diffraction
X-ray diffractograms were collected for all samples, and the results are shown in Fig. 2. However, the identification of mineral patterns was not straightforward. Indeed, suitable samples for powder diffraction should contain tens of thousands of randomly oriented crystallites to obtain a pattern representative of all minerals present in the sample (Pecharsky and Zavalij, 2009). This was not the case for the samples studied here, which were generally composed of a few big grains (consistent with the grain size delivered by the ExoMars SPDS). This sampling statistics problem can lead to strongly biased relative intensity ratios or even to missing reflections, making it very difficult for the search algorithms to identify the minerals in the powder. Even when directing the search with filters or switching to an interactive approach to select possible candidates directly from the database, it was not possible to index completely the experimental patterns of the desert varnish samples. Partial (and in some cases tentative) identifications are proposed below.
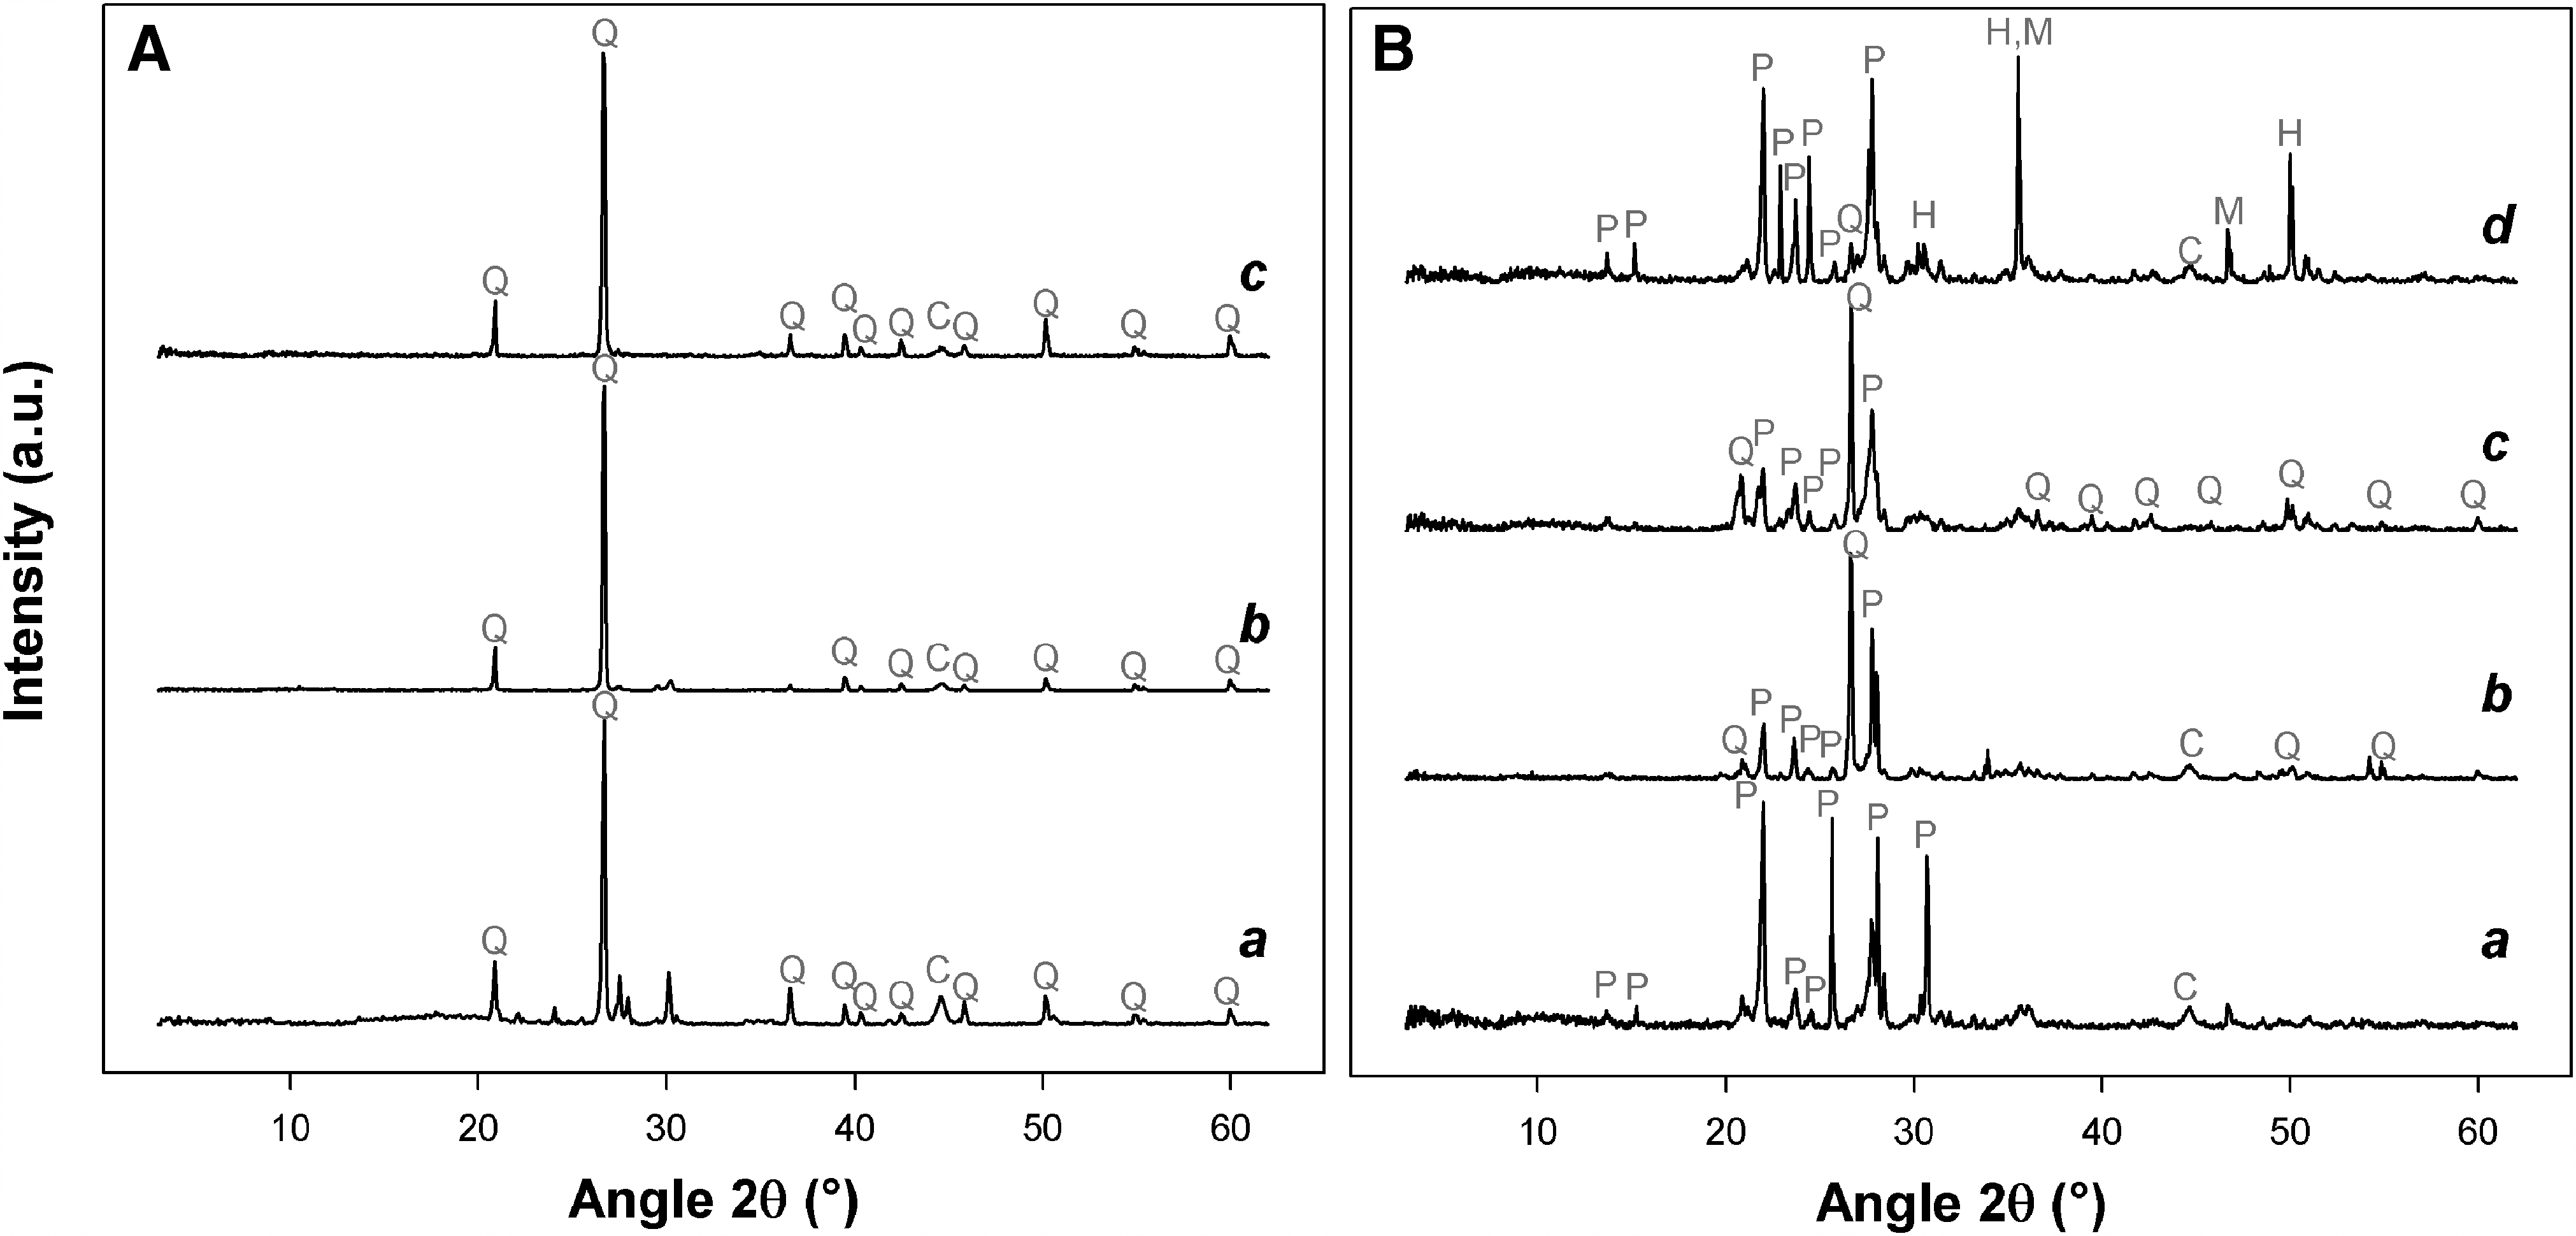
Powder X-ray diffractograms for the samples. Panel
For the samples DV1, DV2, and DV3, only quartz was readily identified as shown in Fig. 2 (panel A, diffractograms a, b, and c, respectively). A weak peak at 44.5° could be due to graphitic carbon, with the main reflection masked by the main reflection of quartz. The carbon peak is relatively broad, indicating a certain degree of amorphization, which is consistent with the results obtained by Raman spectroscopy as shown below.
For the samples CV1, CV2, CV3, and CV4, the diffractograms were more complex, as shown in panel B of Fig. 2 (diffractograms a, b, c, and d, respectively). Quartz was identified in samples CV2, CV3, and CV4 (weakly) but not CV1. The small and broader peak at 44.5° was also interpreted as a sign for the presence of carbon in samples CV1, CV2, and CV4. The other peaks in the range 20–35 of the 2 theta values were attributed to plagioclase feldspars. However, it was hard to tell which plagioclase feldspars were present according to the data collected here. Albite (the sodium plagioclase feldspar) and anorthite (the calcium plagioclase feldspar) form a continuous solid solution (meaning that a continuous composition between albite and anorthite is allowed). Therefore, the XRD pattern (position and intensity) will also vary with the degree of cation substitution (Goodyear, 1954). As an example, some of the peaks in the CV1 and CV4 patterns suggest an albite-like phase. On the pattern for sample CV4, the intense peaks located at 35.5° and 49.9° were attributed to hematite, while the presence of magnetite was suggested by the peak at 46.6°.
3.2. Raman spectroscopy
The Raman spectra obtained from several grains of both sets of samples are presented in Figs. 3 and 4. Many different grains (varying in shape, size, and color) could be distinguished for each of the samples considered (see Fig. 1), so a representative selection is reported here. A list of minerals detected and the positions of the associated Raman bands are presented in Table 1.
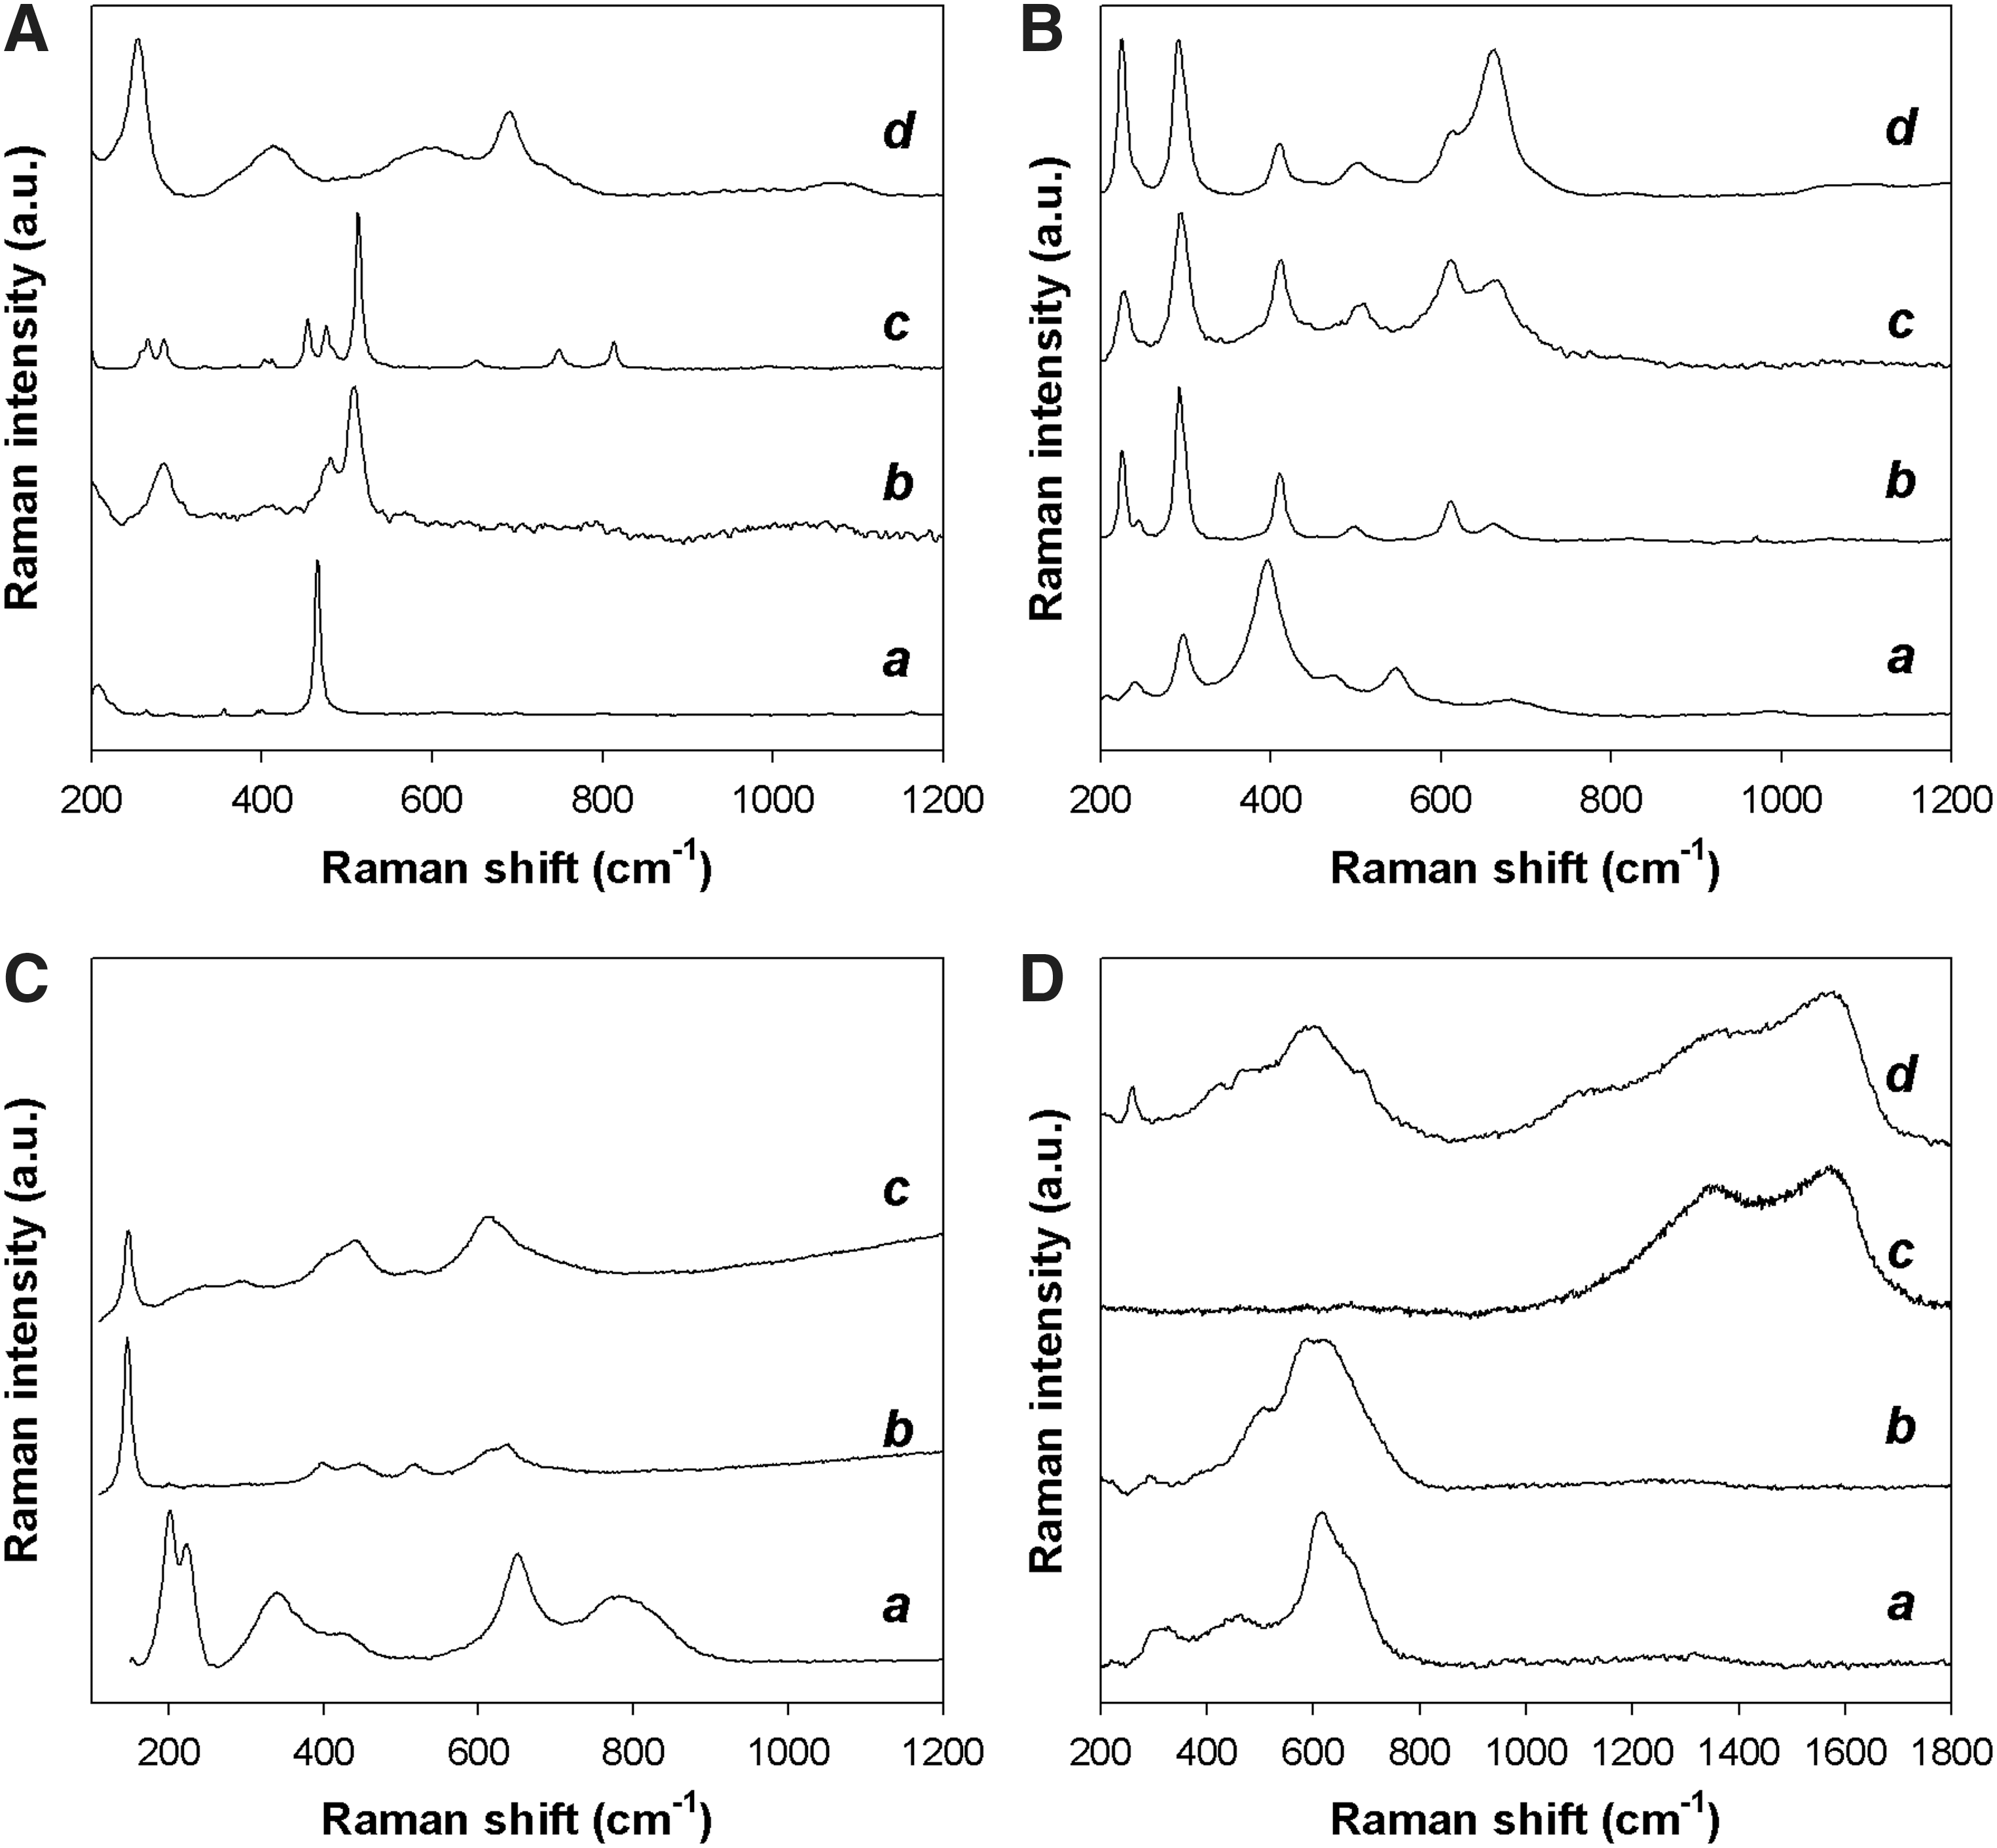
Selection of Raman spectra of different minerals observed for the desert varnish samples using a 633 nm excitation wavelength. Panel
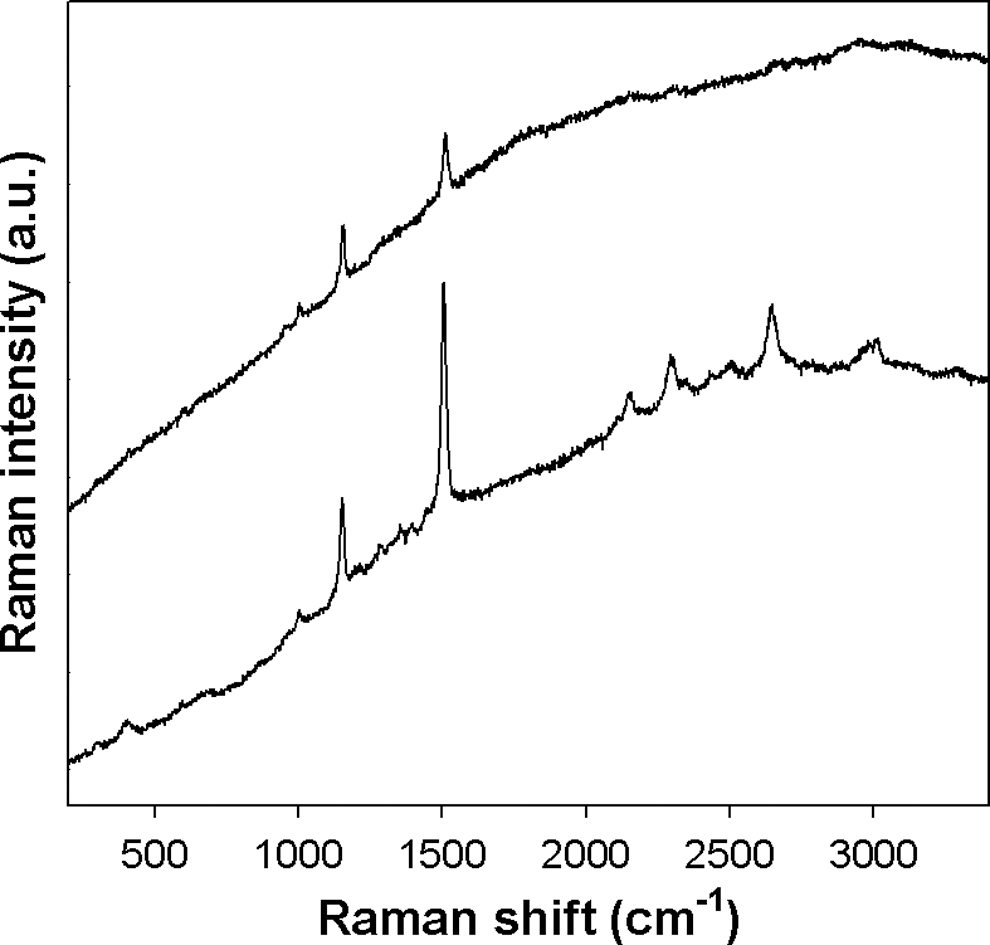
Raman spectra of carotenoid recoded on desert varnish using a 514 nm excitation wavelength.
In terms of intensity, the significant bands are indicated in bold (intense) or in bold underline (very intense).
The white/light grains were associated with the Raman signatures of tectosilicates such as quartz, plagioclase, and microcline for which the spectra are presented in Fig. 3, panel A. Quartz (silicon dioxide) was mainly found to be present in the DV samples and on occasion in the CV set (supposedly due to the eolian inclusion of sand grains in the desert varnish coating). Plagioclase (calcium-sodium feldspar) was found to be present in the samples from the Cady Valley site. This was consistent with our previous analyses of these samples using portable spectrometers, where quartz and plagioclase were found to be the main constituents of the rock substrata of both sets, respectively (Malherbe et al., 2015). In addition, and using a confocal microspectrometer, microcline (the potassium feldspar) was found in the DV samples. This potassic feldspar can be distinguished from the sodico-calcic feldspars by confirming the presence of two bands at 475 and 453 cm−1. These were not observed; instead only a shoulder to the 508 cm−1 band (located at 480 cm−1) was recorded for the sodico-calcic feldspars. Three extra bands located at 813, 749, and 266 cm−1 were also found to be present in the microcline spectrum compared to the plagioclase one as indicated in Fig. 3A. Finally, for the samples from the Death Valley site, when the white grains appear shiny under the microscope, the Raman signal of muscovite (a phyllosilicate from the group of mica) was frequently observed.
The orange to reddish grains were found to be associated with the Raman signatures of iron minerals (Fig. 3B) or carotenoids (Fig. 4). For light orange grains, goethite, the iron oxyhydroxide, was detected (see Fig. 3Ba). The darker red area on the samples was found to be comprised of hematite, the common iron oxide, often associated with orange-red grains. Several spectra of hematite obtained from the desert varnish are presented in Fig. 3B (spectra b, c, and d). It is clear that several different structures of iron oxide were present. Some spectra corresponded to hematite (α-Fe2O3), exhibiting a Raman band at 224, 291, 408, 499, and 611 cm−1 and the second-order band at 1317 cm−1 (not shown on Fig. 3). Besides, some spectra corresponded to a mixture of hematite and magnetite (Fe3O4) with a supplementary Raman band at 661 cm−1 and a loss in intensity of the hematite band at 1317 cm−1, which was sometimes not observed (de Faria et al., 1997).
The light orange grains are associated with inorganic compounds as well as carotenoids, which can be detected through their resonance Raman signal. Carotenoids were only detected when using the 514 nm laser (which promotes the resonance effect). The carotenoid signal was always associated with a higher fluorescence background, resulting in a reduction in the quality of the spectra obtained (as illustrated in Fig. 4), and it was the only organic signal detected with the Raman microscope. Carotenoids, which comprise a long conjugated carbon chain (a sequence of alternative single and double carbon-carbon bonds), lead to a resonance Raman signal enhanced by a factor 104 to 105 compared with a classical Raman signal. The resonance signal was detected at 1003, 1155, and 1512 cm−1 and was attributed to β-carotene (according to the position of the 1512 cm−1, which is dispersive as a function of the length of the conjugated carbon chain [Withnall et al., 2003]). As shown in Fig. 4, when the signal of β-carotene was intense, the second-order resonance Raman signal was also detected at 2647, 2292, and 2148 cm−1; and the weak feature around 2900 cm−1, which belongs to the stretching of the C-H bonds that are abundant in organic molecules, was also apparent.
Darker grains were associated with the Raman signatures of carbon and various metallic oxides as shown in Fig. 3. Anatase and rutile (see Fig. 3C), two allotropic forms of titanium oxide, were found to be present in desert varnish (which is not surprising, since they are common minerals on Earth). In the iron-rich samples (from the Cady Valley), pseudobrookite was present, which indicates that eolian titanium (from the oxide) could have been incorporated during the coating formation. Pyrolusite, an oxide of manganese (IV), was often found in dark varnish grains. The spectrum of pyrolusite appears as a broad band centered on 650 cm−1 with a shoulder at around 550 cm−1 (see Fig. 3D). The Raman signature of jacobsite, a mixed oxide of iron and manganese, was also recorded. Finally, the Raman signature of disordered carbonaceous material was recorded on several dark grains as well, sometimes in association with other minerals, as shown in Fig. 3Dd where it appeared along with pyrolusite. The Raman spectrum of disordered carbonaceous material was composed of two broad bands: one localized at around 1580 cm−1 (the so called G band, which is the only present band in the spectra recorded for the basal plane of graphite), the other at 1350 cm−1 (the so called D band, which is only active when defects are present in the graphite lattice).
3.3. Elemental analyses
The TOC data and the stable carbon isotope composition (expressed as the depletion relative to PDB standard, δ13C) are given in Table 2. The TOC content of the sample varies between 0.10 and 0.41 percent in mass. According to a two-tailed t test of the difference of the means between the two sets of desert varnish (at a 95% confidence interval, α = 0.05), the samples are part of the same population regarding the TOC content. The stable isotopic carbon ratios were found to be -24.0 ± 0.2 ‰ for most of the desert varnish studied, except for the sample CV2, for which δ13C was found to be -14.2‰.
3.4. Methylated pyrolysis–gas chromatography–mass spectrometry
Consistent with the low level of organic carbon materials in the desert varnish determined via elemental analysis (see Table 2), the TIC measured for each desert varnish sample with pyrolysis was relatively low, as shown in Fig. 5. Nonetheless, workable chromatograms were obtained and further analyzed. A total of 128 major compounds (contributing to 88% of the TIC) were putatively identified based on retention indices and NIST mass spectra library.
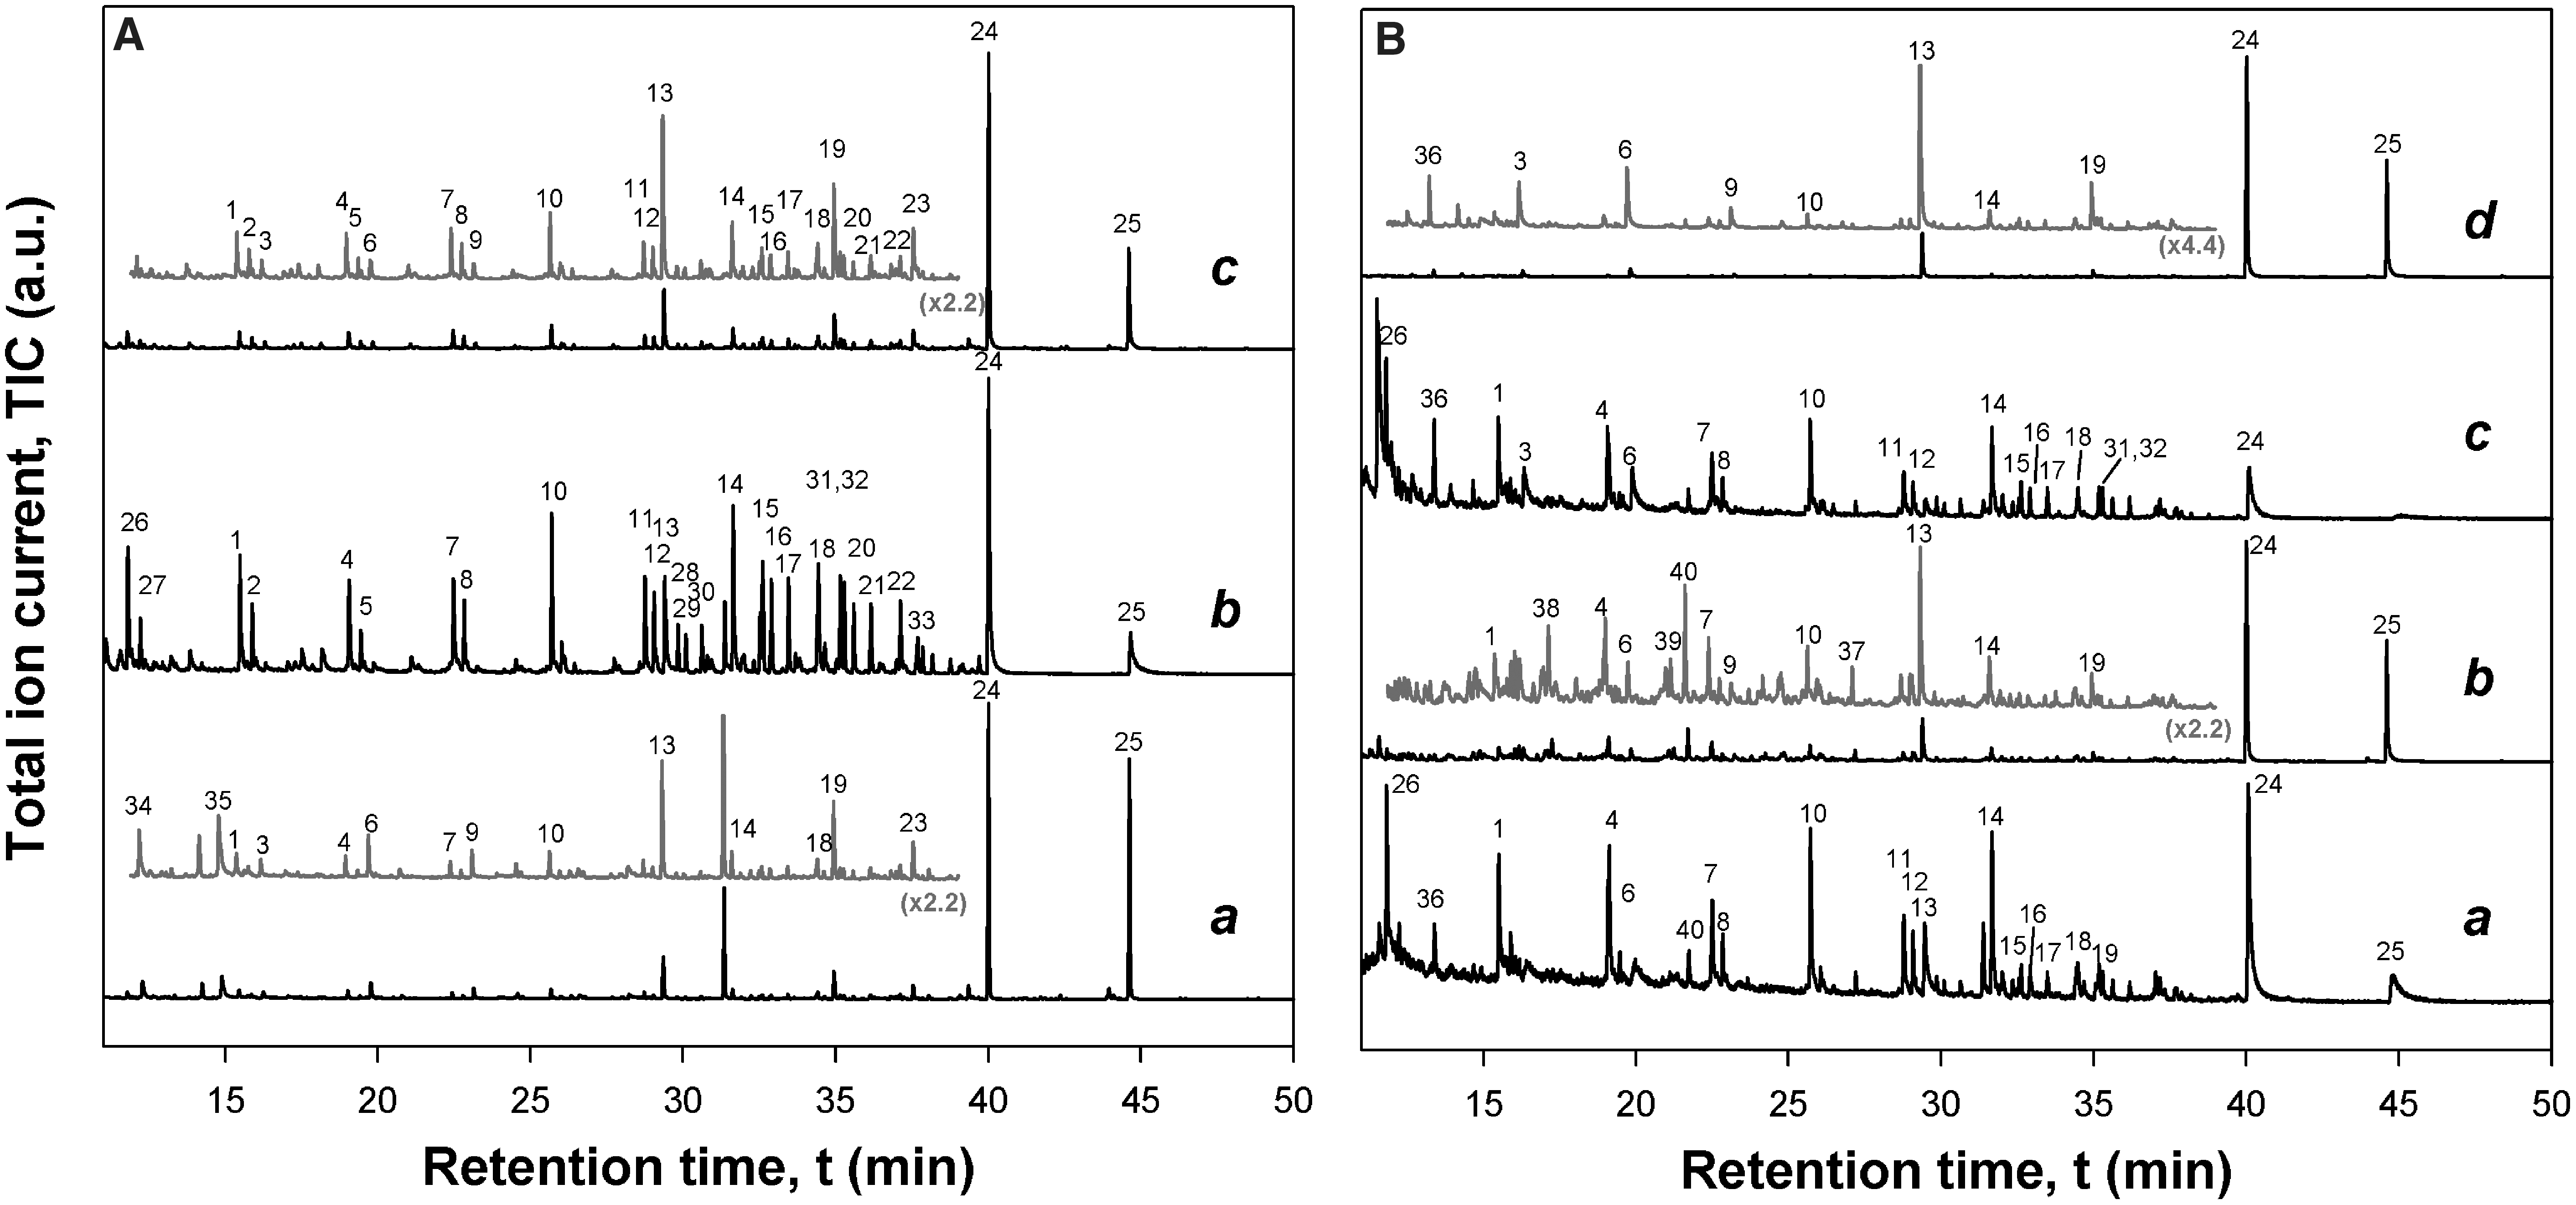
Chromatograms for the desert varnish samples. Panel
Visualizing and interpreting so many components within a system is challenging, so to simplify the description of the samples, the organic compounds were classified into five groups according to their chemical function/structure: alkanes (AlkA), alkenes (AlkE), fatty acid methyl esters (FAMEs), monocyclic aromatic hydrocarbons (Ar), and polycyclic aromatic hydrocarbons (PAHs). The relative amount of each group for the seven samples is summarized in Fig. 6, where the error bars represent the standard deviation of the TIC percentage obtained for the seven samples. The compositions determined for each sample are given in Table 3.
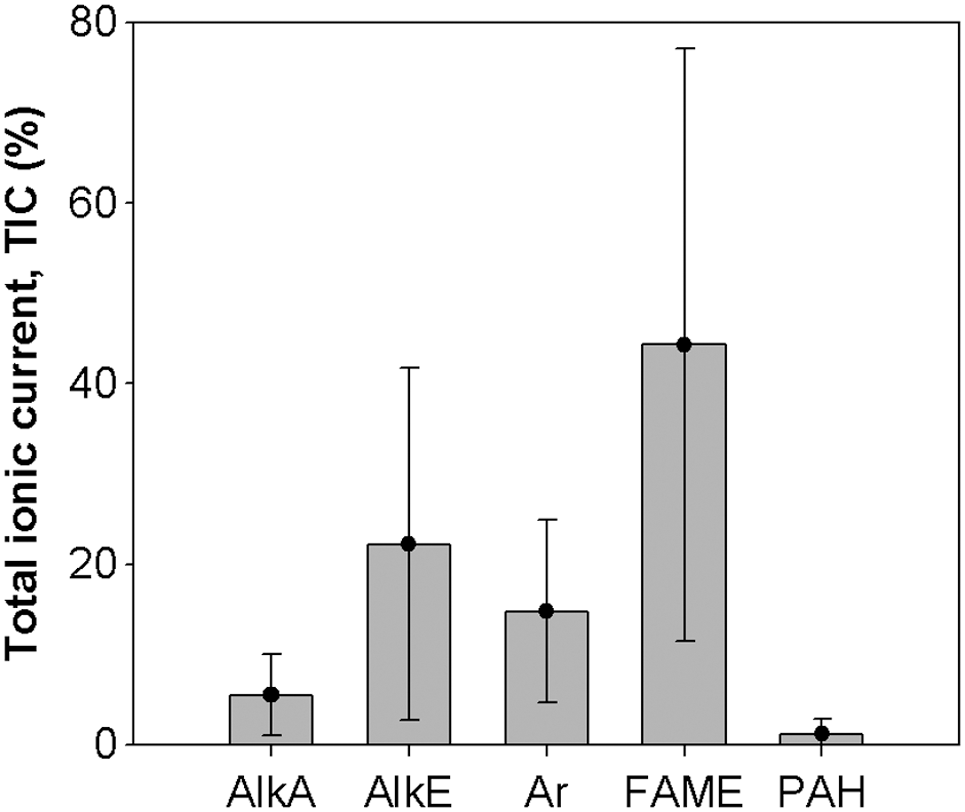
Relative amount of compounds classified in five groups according to their structure and chemical functions: alkane (AlkA), alkene (AlkE), fatty acid methyl ester (FAME), aryl (Ar), and polycyclic aromatic hydrocarbon (PAH).
Fatty acid methyl esters (derived from fatty acids methylated during pyrolysis in the presence of TMAH) were the main contributors to the TIC for all the samples interrogated. Typically, the ion chromatogram at m/z = 74 (characteristic of FAMEs) is dominated by the peaks belonging to short-chain FAMEs with an even number of carbon atoms (in the range C8–C18), especially C16 (palmitic acid). Short-chain FAMEs with an odd number of carbon atoms (in the range C7–C17) were also observed for samples containing more FAMEs overall, notably samples DV1, DV3, CV2, and CV4. In addition, unsaturated palmitoleic acid methyl ester (C16:1) was detected for DV1, DV3, CV2, and CV4, and unsaturated oleic acid methyl ester (C18:1) was detected for DV1, DV3, and CV2. For these compounds, the position of the double C = C bond was difficult to determine based only on the retention index (1886 and 2086, respectively). Finally, iso and anteiso FAMEs were detected. In particular, anteiso-C15 FAME was detected in DV1, DV3, CV2, and CV4, but anteiso-C17 FAME was only detected in DV1 and DV3.
The second most common chemical group observed in the samples was the alkenes (AlkE). A total of 97% of the alkenes detected were n-alkenes unsaturated in position C1. They were found in the range between C10 and C18, often dominated by the members in the range C10 and C16. This trend was followed by the n-alkanes (AlkA), which represent the fourth contributive group to the TIC. Alkanes were detected in the range C7–C17 and dominated by the n-pentadecane (C15H32).
The third and fourth most frequently observed chemical groups encompass the aromatic molecules: the Ar and PAHs, respectively. The PAHs were detected weakly only in DV2, DV3, CV2, CV3, and CV4. They were 1H-indene derivatives (mainly) and methylated naphthalene. The monoaromatics members can be further divided into three subgroups: polymethylated benzenes (Ar1), linear alkyl benzenes (LAB), and branched alkyl benzenes (BAB). The BAB were the dominant aromatic compounds (∼66% of the aromatic compounds detected), comprising a complete series of 1-dialkyl benzene with a number of alkyl carbon between 10 and 13 in total (distributed on two carbon chains). LAB represented only ∼12% of the aromatic compounds and comprised the series between the propyl-benzene and the dodecyl-benzene. Finally, polymethylated benzene contributed to ∼23% of the aromatics.
4. Discussion
Here, we have presented a thorough characterization of some desert varnish specimens, which are considered to be potential Mars analog samples. As such, their analysis can inform the development (and operation) of instrumentation for future exploration missions on Mars. In particular, the potential habitability of these samples (i.e., the capability to host life) was investigated by using three analytical techniques that have been proposed for future space missions (or are implemented on current missions). The geological components of the desert varnish samples were identified with XRD and micro-Raman spectroscopy, while the nature of the organic matter associated with the samples was assessed with TMAH Py-GC-MS.
The XRD technique was found to be sensitive only to the main mineral components of the desert varnish powders (compromised by the limited material available). Indeed, only well-defined crystalline phases such as quartz and feldspar were readily detected when using this technique. The use of micro-Raman spectroscopy enabled confirmation of a broad range of mineral constituents within the desert varnish coatings interrogated in this study. According to the Raman data, the desert varnish coatings of both sets of samples (from the Death Valley or the Cady Valley sites) comprise quartz, plagioclase, hematite, goethite, and TiO2, which is in agreement with our previous study of these samples using flight-representative miniaturized spectrometers (Malherbe et al., 2015). In addition, by using the confocal micro-spectrometer, some additional minerals were detected. Pyrolusite (and to a lesser extent jacobsite), a manganese oxide, was detected, confirming that the samples were actually covered with a desert varnish formation, which is typically considered to comprise manganese oxide together with iron oxide and clay (Dorn, 2008). The detection of such minerals was, however, only feasible when using confocal spectrometers. This reflects the fact that the confocal instruments reduce the fluorescence background of the spectra (the confocal pinhole rejecting the light that is out of focus). In addition, the microscope coupled to the spectrometer reduced the laser spot diameter to a few microns (∼2 μm in the present study), and thereby the volume of sample analyzed was reduced (∼4 μm3). As a direct consequence, the back absorption of the Raman signal by darker samples was also decreased, which enabled the ready detection of hematite with a green laser (that was less straightforward when using a miniaturized instrument; Malherbe et al., 2015).
The main constituents of the varnish detected with Raman spectroscopy were quartz and plagioclase, which were identified for the DV and CV sets of samples, respectively. This was expected, as they represent the main constituents of the rock substrata of the samples (Malherbe et al., 2015). In addition to plagioclase, quartz grains were also found in the varnish coating for the samples from the Cady Valley (most probably, those grains were incorporated in the varnish following eolian supply). This would be logical because the samples were retrieved next to a sand deposit originating from a former sea basin in a location swept by wind. For the samples obtained from Death Valley, microcline (potassic feldspar) was also found, as was muscovite (a mica from the group of phyllosilicate). These two minerals, together with the plagioclase (also a feldspar), are particularly relevant to the potential habitability of the desert varnish. Indeed many feldspar rocks have been reported to be colonized by various microorganisms on Earth (Edwards et al., 2011). Muscovite (a phyllosilicate such as montmorillonite) presents a lamellar structure where each aluminosilicate layer (negatively charged) is separated by potassium cations (positively charged). They provide a possible source of water in arid environments since molecules of water can be accommodated inside the layers (Hatch et al., 2012). All the Raman spectra indicate well-crystallized silicate phases, and no evidence of amorphous glassy phases or newly formed silicates was observed. This seems to indicate that the abiotic formation process, as suggested by Perry et al. (2006), involving baking of silicic acid on the substrata, does not apply for the samples considered here. However, the insertion of quartz grains in the coatings of the Cady Valley samples does suggest some eolian mineral input (Dorn, 2008).
The detection of goethite indicates that the desert varnish coatings were formed relatively recently on the rock substrata. Indeed, goethite tends to evolve to hematite with time via dehydration (the transformation of goethite into hematite does not necessitate significant reorganization of the anionic sublattice and therefore can occur even at low temperature by topotactic transformation [Cudennec and Lecerf, 2005]). Small amounts of water can then be released during the transformation, enabling microorganisms to survive in arid locations such as the Mojave Desert. Detection of hematite was also important since it was recognized for potential long-term preserving microfossils (Allen et al., 2001) and therefore possible biomarkers. The hematite spectra reported here often exhibit an extra band at 660 cm−1 that is attributed to magnetite (Edwards et al., 2001). This band is also present in the spectra of disordered hematite that could result from heated goethite (de Faria and Lopes, 2007). However, great care was taken to avoid any laser-induced phase transition. Indeed, spectra were discarded if any change in the relative intensities was noticed during the recording process (and analyses repeated by using a fresh nonburned area, after decreasing the laser power). In addition, after recording the spectrum of goethite several times, it was apparent that there was no evidence of spectral evolution in the data. Consequently, it is clear that the band at 660 cm−1 (in the spectra of hematite) is not an experimental artifact and that it does, in fact, indicate the presence of magnetite or disordered hematite. In the context of planetary exploration, this can indicate weak crystallization, a weathering process, or a biodegradation of the former hematite present (de Faria and Lopes, 2007). Finally, the presence of magnetite (confirmed by XRD) in such samples could be linked to a possible reduction of some iron cations of hematite by organic molecules (Konhauser and Riding, 2012). The identification of magnetite with hematite on Mars was seen as a proof that redox coupling can take place, highlighting a possible route for energy processing by chemoautotrophic microorganisms (Grotzinger et al., 2014).
Besides mineral substances, Raman data also reveal the presence of carbon materials such as disordered carbonaceous material (detected with the 514 and 633 nm lasers) and β-carotene (only detected with the 514 nm laser). The latter is a compound excreted by a range of microorganisms, such as cyanobacteria, particularly when they adapt to extreme environments. Its detection implies that living organisms were possibly associated with the desert varnish samples analyzed here. Either β-carotene was part of the molecular protective pigments excreted by living bacteria present on the desert varnish samples, or β-carotene was preserved within the geological matrix constituting the desert varnish (and therefore indicative of recent past bacterial activities). Both hypotheses are in agreement with the identification by Py-GC-MS of fatty acids specific of bacteria. In either case, the detection of β-carotene by Raman spectroscopy can only indicate quite recent bacterial activity. Indeed, under typical atmospheric conditions, β-carotene is not likely to be preserved over an extended period of time, as the polyene will diagenetically transform into β-carotane or isoprenoid fragments (Marshall and Olcott Marshall, 2010; French et al., 2015). Nevertheless, β-carotene was reported as a preserved bacterial biomarker in sediments 600 years old (Lepot et al., 2014). It should be noted that a highly reduced laser power on the sample was required to detect β-carotene in the desert varnish powders. Under the microscope, the spectrum of β-carotene evolved to the spectrum of disordered carbonaceous material if the irradiance was higher than 10 kW cm−2 (which is 10 times the irradiance of the ExoMars RLS instrument [Lopez-Reyes et al., 2013]). However, no organic compound other than β-carotene was detected by Raman spectroscopy with the samples of desert varnish. This is not surprising since the cross section of organic molecules is lower than that for inorganic compounds, and only a small amount of organic compounds were revealed by the Py-GC-MS. Disordered carbonaceous material was often detected on the samples by Raman spectroscopy and could have resulted from either a direct eolian deposition of carbon dusts onto the desert varnish during its formation (in which case it is not a biomarker) or the degradation of organic compounds from decaying dead microorganisms that colonized the desert varnish in the past (in which case it is sometimes viewed as a possible biomarker in the context of searching for extraterrestrial forms of life). However, Raman spectroscopy is not a suitable technique for differentiating between biogenic and abiogenic disordered carbonaceous material (Pasteris and Wopenka, 2003). Other analytical methods should be considered to describe the structure and the origin of the carbonaceous material in more detail.
The reference method for analysis of carbon is mass spectrometry coupled to gas chromatography, and we applied that technique to characterize the nature and content of the organic compounds in the samples. The carbon contents (assimilated to the TOC since no carbonate was detected in the samples) were actually very low, lower than the typical average TOC content for lacustrine sediments in deep oceans (∼0.5%) (Seiter et al., 2004) and lower than the TOC values measured for soils in arid locations in South Africa (∼0.8%) (Carr et al., 2013). Such low values of carbon content suggest that little organic material was present in or on the desert varnish coatings interrogated during this study. The stable carbon isotope ratios measured for the seven samples of desert varnish were in agreement with previous data reported for other similar samples (Dorn and DeNiro, 1985; Dorn et al., 1987; Perry and Kolb, 2004). Most of the δ13C values were consistent with organic matter derived from C3 photosynthetic plants, which could have been processed by microorganisms that were present on the desert varnish. The desert varnish samples studied here could then enclose some old organic matter. It must be stressed, however, that the values reported here were obtained for the entire varnish coating and some influence of the underlying rock materials cannot be ruled out. In addition, a δ13C value of −24.8‰ from Mojave Desert soil has been reported before (Navarro-González et al., 2006), which is quite close to the values obtained here.
The Py-GC-MS measurements reveal no clear variation between the two sets of samples. The samples were all dominated by FAMEs, n-alkanes, and n-alkanes and BAB. This suite of pyrolysis products was consistent with a bacterial origin of the organic matter found in the samples of desert varnish. The major compounds were the FAMEs. Although FAMEs could have been present in the samples before the pyrolysis, they were most likely mainly formed during the pyrolysis because of the tetramethylammonium hydroxide (Challinor, 1996). Only short-chain FAMEs were observed (<C18), which suggests that the organic matter originated from bacterial activities. Indeed, the saturated fatty acids (constituting the lipids of the cell membranes) are typically found in the range of C14–C18 for bacteria, in the range of C16–C26 for algae, and in the range of C28–C36 for plants (Jetter et al., 2006). The absence of the long-chain FAMEs is a good sign that leaf waxes of local vegetation did not make a substantial contribution to the Py-GC-MS data. Iso, anteiso, and some unsaturated fatty acid derivatives were also proposed as specific biomarkers for bacteria (Schelble, et al., 2005; Jia and Peng, 2005; Geffroy-Rodier et al., 2009). Iso and anteiso isomers of C15 and C17 FAMEs were identified in the chromatograms of several samples (sometimes with an intensity below the quantification limit but still readily identified on the m/z = 74 chromatogram). The presence of these isomers again suggests a bacterial processing/origin for the organic matter in the samples. Additionally, short-chain-length n-alkanes and n-alkenes were also detected in the samples. Again they could have been present in the samples before the pyrolysis but are likely to have been produced by decarboxylation during the pyrolysis (Hartgers et al., 1995). The anticorrelation observed between the FAMEs and the AlkA and AlkE (data not shown) suggests that alkanes and alkenes detected during Py-GC-MS mainly originated from fatty acids that were present in the samples before the pyrolysis.
The detection of aromatic compounds is harder to interpret, especially the LAB and the BAB. Short LAB (up to n-C4) are found in kerogen, but the chromatograms obtained for the samples of desert varnish are not consistent with the ion current intensity profile obtained for kerogens (Gonzalez-Vila et al., 2001; Jia and Peng, 2005). Alkylbenzenes may also derive from a linear precursor, such as long fatty acids undergoing cyclization and a subsequent aromatization during the pyrolysis process, especially from salts of fatty acids (Saiz-Jimenez, 1994). Observation of LAB and BAB series could be the result of a derivatization of primary organic molecules during the pyrolysis. β-carotene, which was detected by Raman spectroscopy, was not detected during the Py-GC-MS analyses, indicating that it was not preserved during the pyrolysis. The polyene could very well have undergone cyclization during the pyrolysis process to lead to LAB or BAB.
The products of Py-GC-MS can be quite different from the organic compounds that were originally in the sample. Indeed, the nature of the mineral substrate can substantially influence the nature of the organic compounds that are produced during a flash pyrolysis process (Stalport et al., 2012). Iron oxide, which was often detected on the desert varnish samples, could act as a catalyst for the decarboxylation of fatty acids during pyrolysis as suggested by Yoshioka et al. (2005). Iñiguez et al. (2009) reported that oxygen atoms and hydroxyl radicals (two strong oxidative species) are released during a thermal reduction of iron (III) oxide and a thermal dehydration of silicates, respectively, at temperatures below 600°C. These active chemicals can lead to decarboxylation and oxidation of the organic matter present in the sample. Degradation of organic compounds into CO2 and H2O can even lead to a lack of detection of any organic molecule (Navarro-González et al., 2006). In addition, clays, which are also present in desert varnish, have been reported to induce aromatization of organic matter during pyrolysis (Faure et al., 2006). In the context of searching for evidence of life in a potential biogeological sample, describing the geological matrix of the sample together with the associated organic matter is therefore considered to be critical when using Py-GC-MS or analogous methods to characterize the organic material in a sample. Here, we affirm an analytical strategy combining Raman spectroscopy (a nondestructive technique that enables the mineral characterization of the samples and the detection of highly Raman active biomarkers such as β-carotene) and Py-GC-MS (a destructive technique that may enable unique insights into the nature of the organic compounds, despite potential limitations of the techniques when applied in isolation [Marshall et al., 2007]).
5. Conclusion
The habitable nature of desert varnish samples (recovered from the Mojave Desert) has been described by using data obtained with a combination of four different analytical methods that have been proposed (or, in some cases, already used) for planetary exploration missions. XRD and Raman spectroscopy were effective in nondestructively determining the mineralogical constituents of the desert varnish comprising silicates, muscovite clay, iron, manganese, and titanium oxides and iron hydroxide. Raman spectroscopy was found to be more efficient than XRD in the description of the desert varnish samples. Raman spectroscopy also enabled the detection of β-carotene. The nature and content of organic matter in the samples were further interrogated by methylated Py-GC-MS, which gave unique insight into the composition of the samples. This organic matter was for the most part dominated by fatty acids, and it was concluded that it is likely to have originated from bacterial activity. The absence of β-carotene in the pyrolysates (at least with the present measurement conditions) highlights a potential limitation of the pyrolysis extraction method leading to the fragmentation of thermo-sensitive molecules. Possible interference of the geological substrate on the resulting pyrolysis products was discussed and requires further assessment. Ongoing work focuses on the complementarity of Raman spectroscopy and Py-GC-MS, especially in terms of detectability of specific biomarkers such as β-carotene, and extraction and concentration of organic compounds would be envisaged.
Footnotes
Acknowledgments
C.M., I.B.H., R.I., and H.G.M.E acknowledge support from the UK Space Agency in the UK, and C.M. acknowledges the support of the Department of Chemistry at the University of Liège. A.S.C. and A.B. acknowledge support from the Department of Geology at the University of Leicester.
Author Disclosure Statement
No competing financial interests exist.