
Abstract
In the last few years, water ice and salts capable of melting this ice and producing liquid saline water (brine) have been detected on Mars. Moreover, indirect evidence for brine has been found in multiple areas of the planet. Here, we simulate full diurnal cycles of temperature and atmospheric water vapor content at the Phoenix landing site for the first time and show experimentally that, in spite of the low Mars-like chamber temperature, brine forms minutes after the ground temperature exceeds the eutectic temperature of salts in contact with water ice. Moreover, we show that the brine stays liquid for most of the diurnal cycle when enough water ice is available to compensate for evaporation. This is predicted to occur seasonally in areas of the polar region where the temperature exceeds the eutectic value and frost or snow is deposited on saline soils, or where water ice and salts coexist in the shallow subsurface. This is important because the existence of liquid water is a key requirement for habitability. Key Words: Mars—Ice—Perchlorates—Brine—Water—Raman spectroscopy. Astrobiology 16, 937–948.
1. Introduction
T
We studied experimentally the formation and the persistence of brine throughout the diurnal cycle at the Phoenix landing site using Raman scattering spectroscopy and imaging. A previous study suggests that brine formation from water ice is the most likely mechanism to produce liquid water within the diurnal cycle (Fischer et al., 2014). We focus on the formation of brine by the contact of either surface or subsurface water ice with Ca(ClO4)2 because this salt is likely present at the Phoenix landing site (Hecht et al., 2009; Kounaves et al., 2014) and at Gale Crater (Glavin et al., 2013), suggesting that it is ubiquitous on Mars (Kounaves et al., 2014). Furthermore, the eutectic temperature of Ca(ClO4)2 is extremely low (T E ∼ 199 K) (Marion et al., 2010), and it changes phases at similar environmental conditions as a salt mixture closely matching the individual cation/anion concentrations found in the regolith of the Phoenix landing site on Mars' polar region (Nuding et al., 2015). Finally, we focus on Ca(ClO4)2 because liquid solutions of other perchlorate salts have already been studied in detail (Chevrier et al., 2009). It is likely that perchlorates have been deposited at the Phoenix landing site by atmospheric processes and concentrated into patches at the surface and in the shallow subsurface by freeze-thaw cycles (Rennó et al., 2009; Cull et al., 2014). Our study focuses on the simplest process, the interaction of salts with water ice. This is the first step for the full understanding of brine formation on Mars. In the future, we plan to study the formation of brine by the interaction of saline soils with water ice.
Results of four comprehensive laboratory experiments are discussed in this article. The first three experiments were designed to investigate the formation of bulk brine on the surface of Mars' polar region, such as in the material exposed in a shallow trench (Dodo-Goldilocks) excavated by the Phoenix robotic arm on Sols 18–19 of the mission (Smith et al., 2009). The fourth experiment investigates the evolution of Ca(ClO4)2 salt subjected to a lower-amplitude diurnal temperature cycle like that expected on the struts of the Phoenix lander where surface/shallow-subsurface material was splashed and formed spheroids (Rennó et al., 2009).
The Michigan Mars Environmental Chamber (MMEC) (Fischer et al., 2014) is used to simulate the environmental conditions throughout the full diurnal cycle of each experiment reported in this article. Sol 19 of the Phoenix mission is chosen as the baseline because ice was unveiled at a depth of ∼5 cm and removed with little effort around this sol (Smith et al., 2009), suggesting that it was likely frozen brine (Rennó et al., 2009; Cull et al., 2010a), which is much softer than freshwater ice.
2. Experimental Setup
All experiments reported in this study were conducted in the MMEC, a cylindrical chamber with internal diameter of 64 cm and length of 160 cm. The MMEC is capable of simulating temperatures ranging from 145 to 500 K, CO2 pressures ranging from 10 to 105 Pa, and the entire range of relative humidity at the Phoenix landing site (Fischer et al., 2014).
The first experiment was designed to study the formation of brine when salt is placed in contact with water ice, as it occurs when frost or snow are deposited on salty soil crusts. Distilled water was placed in a 0.3 cm3 cylindrical sample holder at laboratory ambient conditions, and the temperature of the sample holder was lowered to ∼190 K, about 9 K below the eutectic temperature of Ca(ClO4)2, to freeze the sample. Then, a thin (<2 mm) layer of salt crystals with typical particle diameters <300 μm was placed on the top of the ice. Particles of this size can move easily, accumulate in low topographical features, and then be buried because they are the most easily transported by saltation (Kok and Rennó, 2009). In addition, layers of salt this thin were used because this thickness is within the penetration depth of the laser; thus the onset of the formation of brine anywhere in the sample can be detected. Our results are not sensitive to particle size because melting starts in the interface between salt crystals and ice, and Raman spectroscopy is capable of detecting its onset on the surfaces of the salt crystals. Next, the chamber pressure was reduced to 800 Pa, the chamber's Earth air atmosphere was replaced by dry CO2, and then the sample temperature and the frost point temperature (of the MMEC's atmosphere) were continuously adjusted to follow those of the martian diurnal cycle starting at midnight.
The ground temperature and frost point temperature at the Phoenix landing site on Sol 19 (Fig. 1) were obtained by a combination of numerical modeling and measurements (see the Supplementary Material for details, available online at
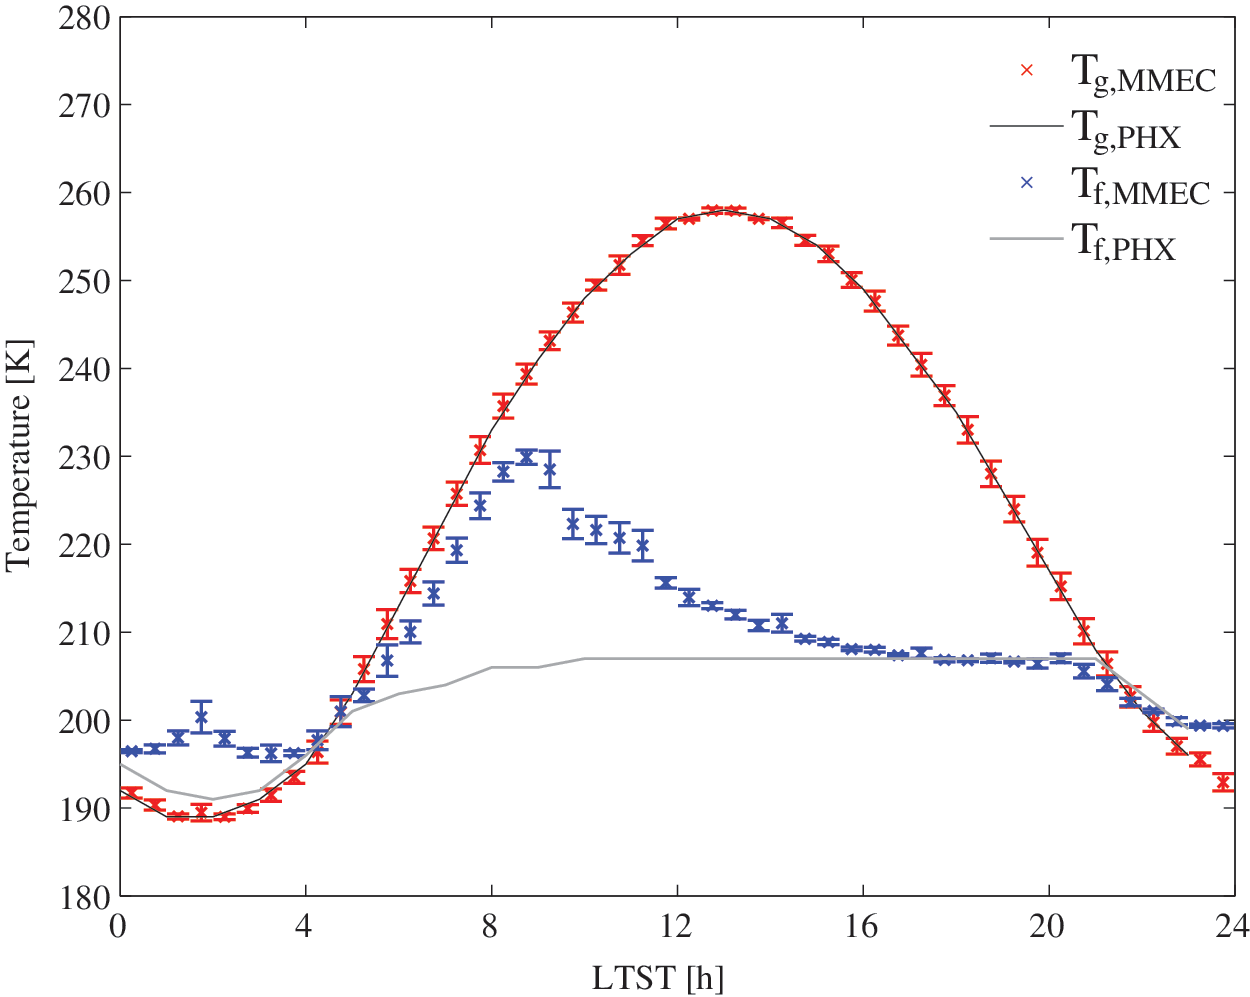
Environmental conditions on Sol 19, when “soft ice” was unveiled by the Phoenix robotic arm in the Dodo-Goldilocks trench. The black and gray lines represent values from numerical simulations of the ground temperature and frost point of the surrounding air at the Phoenix landing site, while red and blue crosses represent the temperature and frost point measured inside the MMEC. The ground temperature first exceeds the Ca(ClO4)2 eutectic value (199 K) at 04:32, about 5 min before the first visual evidence for the formation of brine in the MMEC. Detailed calculations of the environmental conditions on this sol are provided in the Supplementary Material.
To investigate the sensitivity of the results of this first experiment to the initial conditions (e.g., sample state, local time), two additional experiments were conducted. In particular, the second experiment started with liquid brine, while the third experiment started with frozen brine. In the second experiment, Ca(ClO4)2 was mixed with distilled water at ambient conditions until the salt had been completely dissolved (the salt amount and sample characteristics were similar to those in the first experiment). The resulting solution was placed in the sample holder, the chamber pressure was adjusted to 800 Pa, and the chamber air was replaced by CO2. Then, the temperature of the sample holder and the MMEC frost point temperature were adjusted continuously to follow those of the martian diurnal cycle between 13:45 and 06:30 shown in Fig. 2.
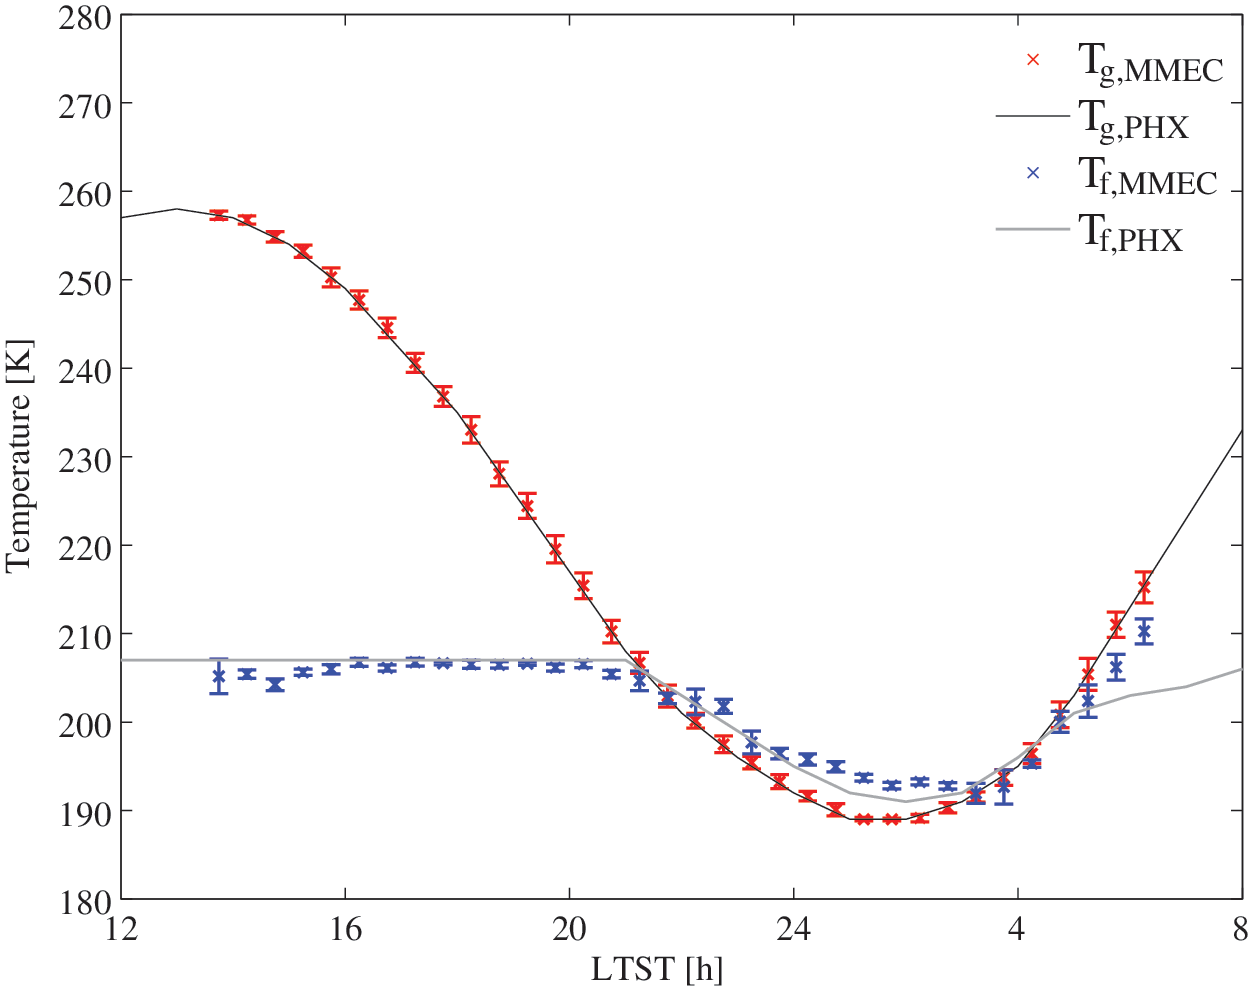
As in Fig. 1, but for the second experiment. To ensure similar sample conditions as in the first experiment, the second experiment started with brine at the beginning of crust formation at 13:45. The experiment ended at 06:30 of the next sol, about 2 h after the sample temperature exceeded the eutectic value.
The third and fourth experiments started with frozen brine as the initial condition. In the third experiment, brine was produced as in the second experiment. Then, the temperature of the solution was lowered rapidly to values <150 K to freeze the brine and mitigate evaporation. Then, the chamber pressure was adjusted to 800 Pa, and the chamber air was replaced by CO2. The temperature was kept below 150 K for at least 3.5 h to ensure freezing of the sample. Then, the simulation of the diurnal cycle started, following the temperature and frost point values shown in Fig. 3. In the fourth experiment, the MMEC atmosphere was kept saturated by the MMEC control system throughout the experiment to simulate the humidity above the ground ice exposed underneath the Phoenix lander. In this experiment, the temperature of the sample was forced to follow that corresponding to the diurnal cycle on the strut shown in Fig. 4.
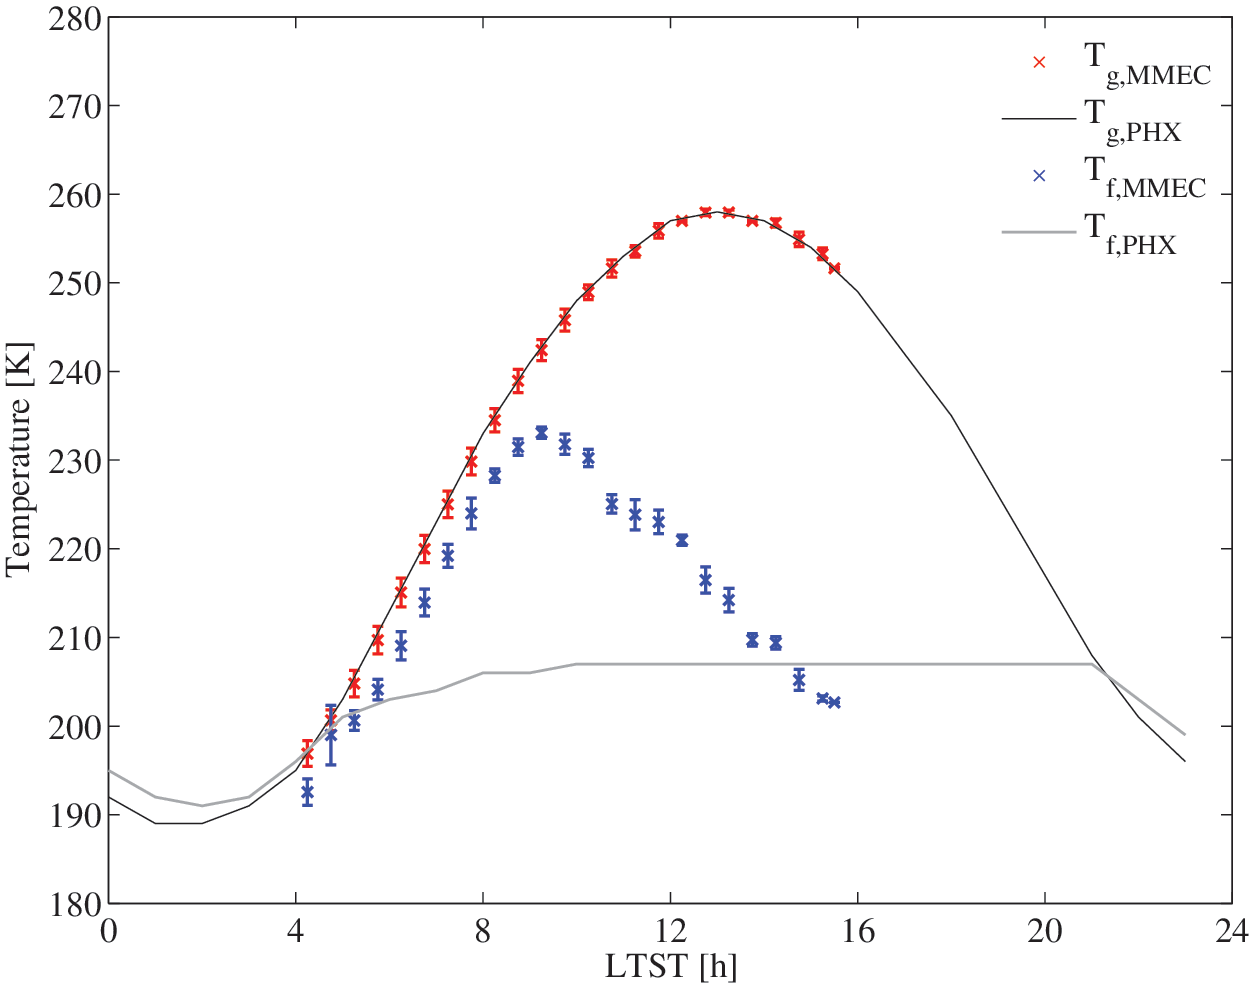
As in Fig. 1, but starting with a mix of water ice and calcium perchlorate at 04:00. Similar to the first experiment, the MMEC closely simulates the temperature in the trench (red crosses), but it overshoots the frost point temperature values inferred from the Phoenix measurements between 06:00 and 15:00 (blue crosses).

Sol 19 temperature at 0.5 m above the ground (the height of place on the Phoenix strut where spheroids were observed) at the Phoenix landing site. The black curve represents the diurnal evolution of the temperature (0.5 m above the surface), while red crosses represent the temperature experimentally simulated in the MMEC. The frost point temperature was not simulated in this experiment. The diurnal temperature cycle at 0.5 m height has lower amplitude than at the ground, with higher minimum and lower maximum temperatures. This causes the brine to stay liquid for most of the diurnal cycle.
In all experiments, the temperature of the sample holder was adjusted in 1 K increments to force it to follow the martian diurnal cycle. The sample temperature, the chamber pressure, and the chamber frost point temperature were recorded at 1 Hz. Raman spectra of the sample and color images were acquired every 10 min. Gaussian decomposition of each spectrum was conducted during the entire diurnal cycles to search for changes in the phase of the samples. The wavenumber and full width half maximum (FWHM) of various spectral peaks are used to determine the phase of the samples by comparing them with reference values for crystalline perchlorate (salt), water ice, and liquid water (Zhang and Chan, 2003; Fischer et al., 2014).
Since our study focuses on the formation of bulk quantities of brine, images in the visible range of the spectrum (color images) are used as supporting evidence for the detection of the liquid phase. This is necessary because when brine starts to form the sample is heterogeneous, containing brine, crystalline salt, and water ice. Thus, spectral features of one particular component of the mixture might dominate the Raman spectrum because the diameter of the sample holder (∼10 mm) is larger than that of the laser beam (∼3 mm) of the Raman spectrometer.
3. Results
3.1. First experiment: diurnal cycle of salt deposited on ice at martian polar surface conditions
In the first experiment, the Gaussian decomposition of the Raman spectra taken at 00:10 (Figs. 5 and 6), when the temperature is below the eutectic value (Fig. 1), contains spectral peaks that indicate the presence of crystalline Ca(ClO4)2 hydrates and water ice (Table 1). At 05:15, the spectral peaks of crystalline Ca(ClO4)2 hydrates are still present, but the signal from water ice is stronger than at 00:10, with the 3068 cm−1 spectral peak of ice appearing and the other spectral peaks of ice intensifying (Fig. 5 and Table 1). At this time, spectral peaks indicating the presence of liquid water are not observed, even though the first visual evidence (color image) for the formation of brine occurs at 04:37, about 5 min after the temperature exceeds the eutectic value for Ca(ClO4)2 (Fig. 1). This occurs because, when ice starts to melt, Ca(ClO4)2 hydrates absorb meltwater (Fig. 7b) and become more translucent, increasing the signal of the ice below the salt. The heterogeneity of the sample in combination with the fixed position of the Raman laser may also lead to slight variations in the time when the liquid water peaks start to appear. At 08:00, the decomposition of the spectrum indicates the presence of brine; in particular, the 3578 cm−1 spectral peak (Table 1) indicates the presence of brine unambiguously, which is consistent with the shift in the perchlorate peak from 954 to 936 cm−1 (Gough et al., 2011) (Fig. 6). The 3129 cm−1 peak at 08:00 indicates that ice (Table 1) is also present. No signal of crystalline Ca(ClO4)2 hydrates exists at this time, which is consistent with the lack of salt crystals in the image of the sample (Fig. 7c). By 11:00, all water ice peaks have disappeared, and the entire sample is liquid (Fig. 7d). As the temperature rises, water evaporation increases the concentration of the solution. At 13:45, a thin salt crust formed on the top of the sample, indicating that the brine solution became at least partially salt-saturated (Fig. 7e). The Gaussian decomposition of the spectrum taken at this time contains only the spectral peaks indicative of brine because the signal from the thin crust is insignificant. As the experiment progresses, evaporation continues and the salt crust thickens. The Gaussian decomposition of the spectrum taken at 23:55, when the temperature is already below the eutectic value (Fig. 1), indicates the presence of a salt crust and frozen brine below it (Table 1). At this time, the sample was composed almost entirely of crystalline salt hydrates because most of the bulk water originally in the sample had been lost by sublimation and evaporation (Fig. 7f). Any remaining solution below was saturated.
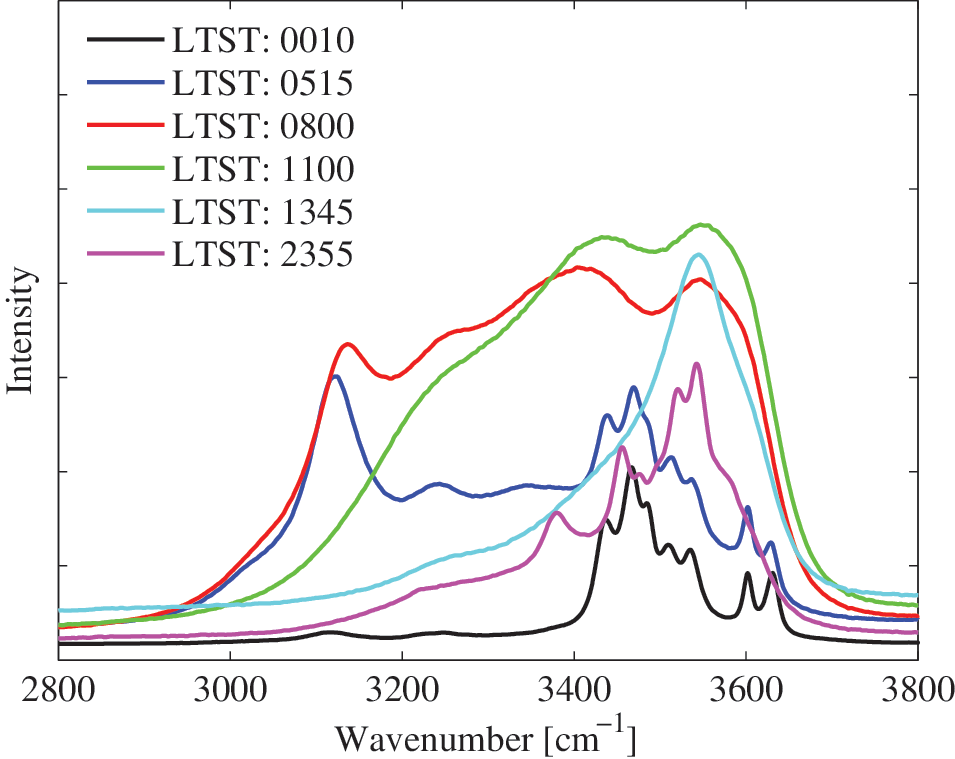
Raman spectra in the O-H stretching band throughout the full diurnal cycle shown in Fig. 1 (first experiment). The wavenumber and FWHM of the Gaussian components of each spectrum are shown in Table 1. The appearance of the broad peak at 3578 cm−1 in the spectrum taken at 08:00 clearly indicates the presence of liquid solution.
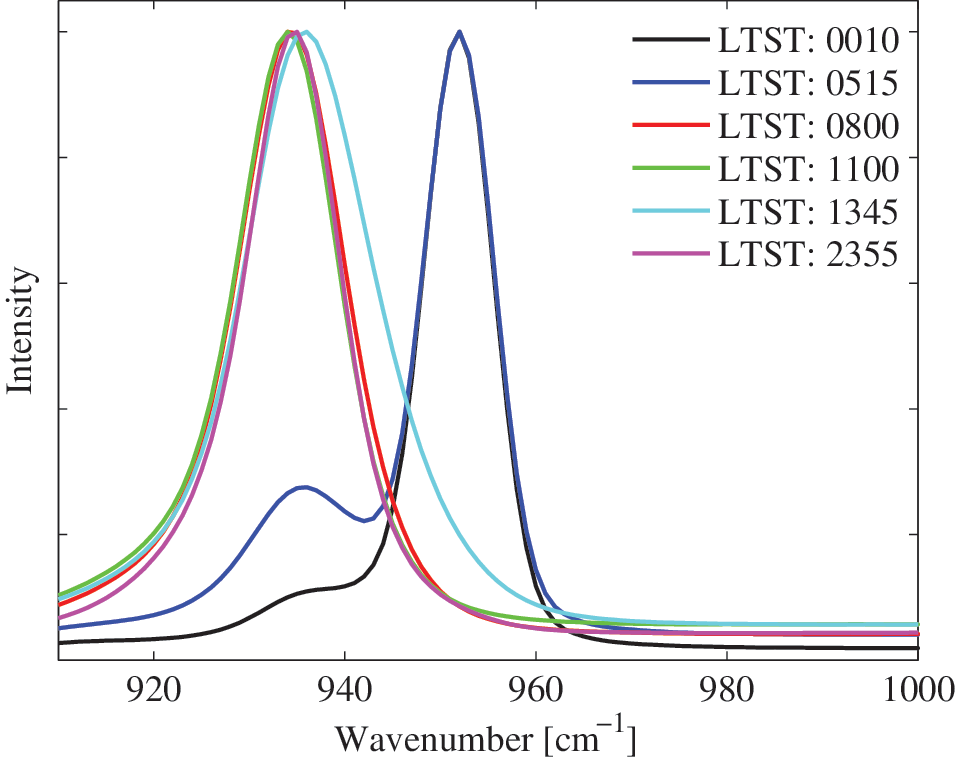
As in Fig. 5, but for the perchlorate vibration band. In the spectrum taken at 08:00, the ∼954 cm−1 peak of crystalline Ca(ClO4)2·4H2O shifted toward ∼936 cm−1, consistent with the presence of liquid solution. After the sample dries out at the end of the experiment, this peak does not shift back, indicating that it is not an unambiguous indicator for the presence of liquid brine.

Images of the sample color-coded according to the spectra shown in Figs. 5 and 6. (
Each column contains the wavenumber and FWHM of each spectral peak. The values of the spectral peaks and their FWHM are color-coded to indicate the presence of salt (black), water ice (blue), either water ice or liquid water (gray), and liquid water (red). The Gaussian components of the spectrum taken at 00:10, when the temperature is below the eutectic value, contain spectral peaks of hydrated perchlorate salt and water ice. In spite of the temperature being above the eutectic value and the image of the sample indicating that the ice starts to melt at 04:37, spectral peaks corresponding to liquid water are not observed at 05:15. The fact that the signal of the ice at the bottom of the sample is stronger at this time (the appearance of a shoulder caused by the 3068 cm−1 ice spectral peak and a general increase in intensity of all spectral peaks of ice, as shown in Fig. 5) provides indirect evidence that the ice has started to melt. The ice signal likely increases because the salt becomes more translucent when it absorbs liquid water. At 08:00 the Raman spectrum indicates the presence of liquid water unambiguously. The spectral peak at ∼3129 cm−1 indicates that water ice is still present, but by 11:00 this peak has disappeared. Evaporation of water causes the salt concentration of the solution to increase continuously until a salt crust forms at 13:45 (Fig. 7e). At this time, the Gaussian components still contain spectral peaks corresponding to brine because the signal from the thin crust is weak. Evaporation thickens the salt crust until crystalline calcium perchlorate hydrates dominate the spectrum at 23:55. The brine freezes below the salt crust when the temperature decreases below the eutectic value. The Gaussian components fit the full measured spectrum with accuracy
3.2. Second experiment: effect of a subsequent diurnal cycle
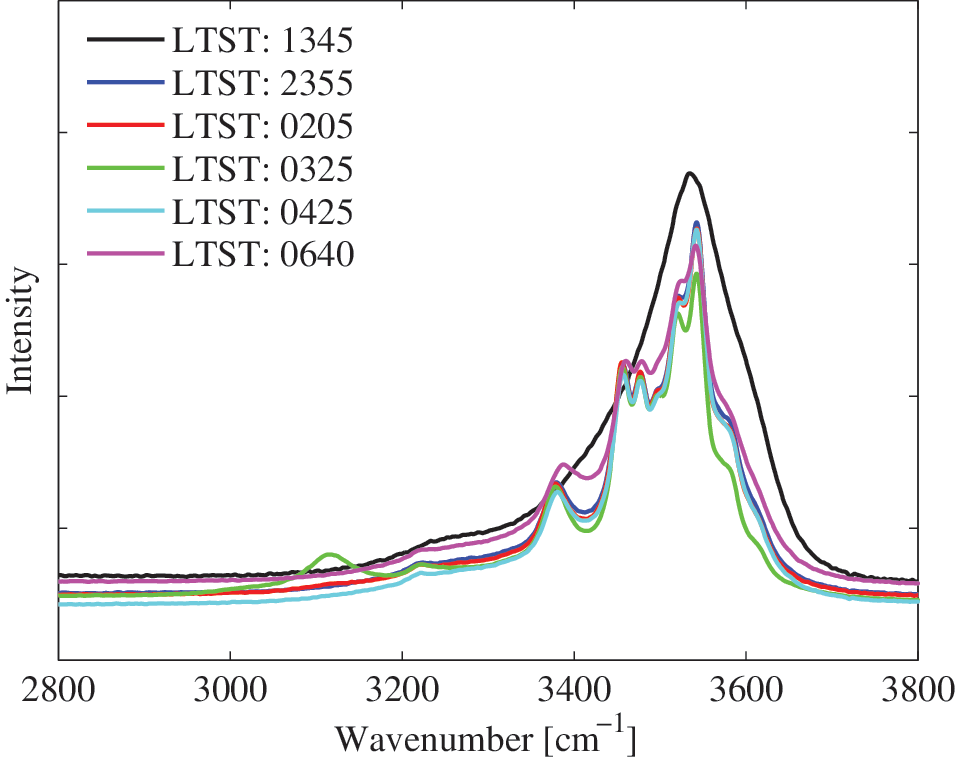
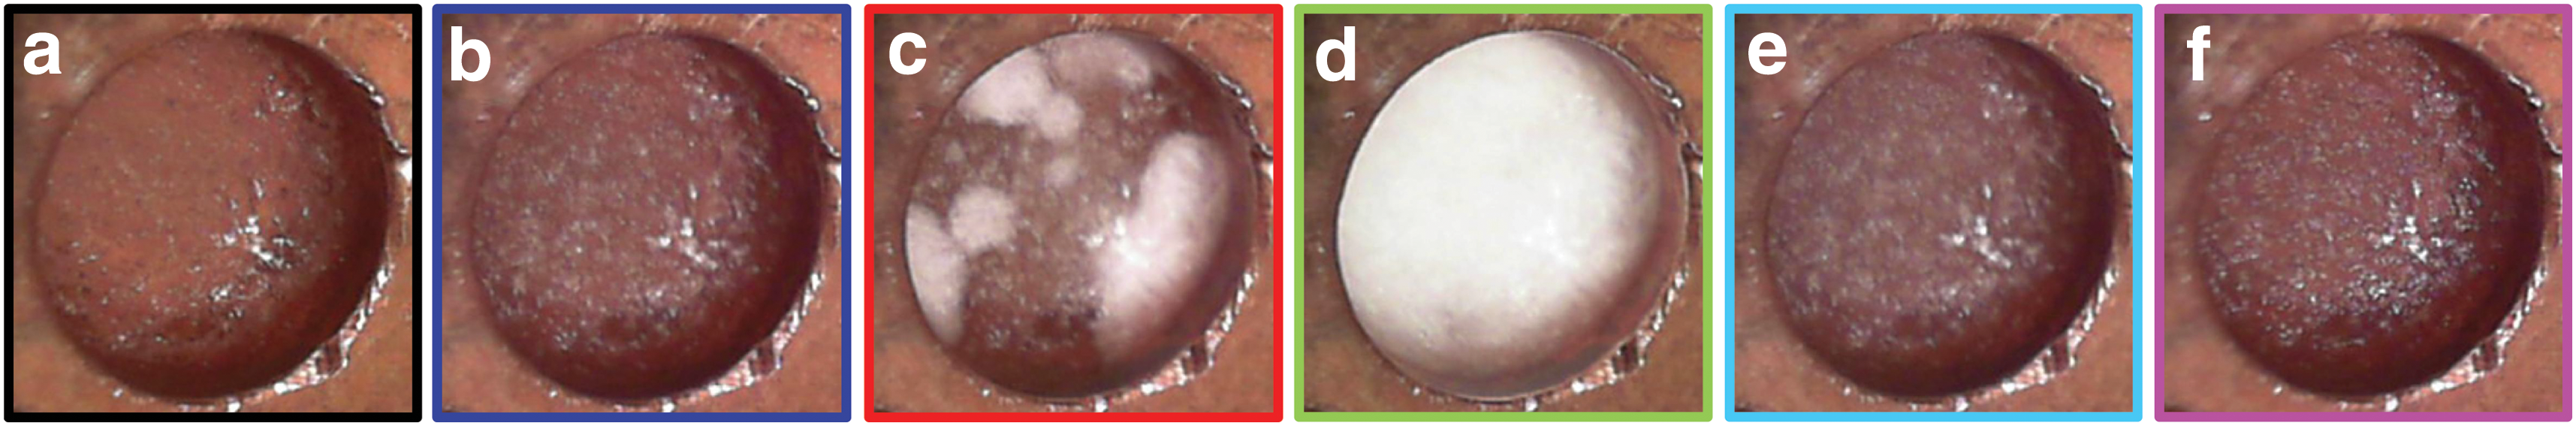
To investigate the sensitivity of the results of the experiments to initial conditions (sample state) and to investigate what happens in successive diurnal cycles, a second experiment was performed starting with brine at 13:45 (Fig. 2), the time that the salt crust started to form in the first experiment, and ending on the next sol at 06:30. As explained next, evaporation of the initial brine during the afternoon hours caused the sample to dry substantially and to become mostly crystalline salt hydrates by midnight. The Raman spectrum of the O-H region (Fig. 8) shows this change by the transformation of the smooth curve representing salt-saturated brine at 13:45 to the narrow peaks indicating the presence of crystalline salt by midnight (Table 2). The perchlorate peak of the spectrum does not change considerably throughout this transformation (Fig. 9), indicating that the O-H spectrum is a better indicator for phase changes of the sample. Continued cooling of the sample below the eutectic temperature in this second experiment resulted in whitish solid material (Figs. 10b–10d), similar to the material found by the Phoenix lander in a shallow trench (Rennó et al., 2009; Cull et al., 2010a). Brine was not detected when the temperature exceeded the eutectic value on the next sol (Table 2; Figs. 10e–10f), indicating that the sample had extremely low water content.
Raman spectra in the O-H stretching band throughout the partial diurnal cycle shown in Fig. 2 (second experiment). Gaussian components of each spectrum are shown in Table 2. A change from the smooth curve representing salt-saturated brine (black) to the narrow peaks indicating crystalline salt is observed.

As in Fig. 8, but for the perchlorate vibration band. This experiment starts with brine and ends with hydrated calcium perchlorate. The perchlorate peak remains at 936 cm−1 during the entire experiment.
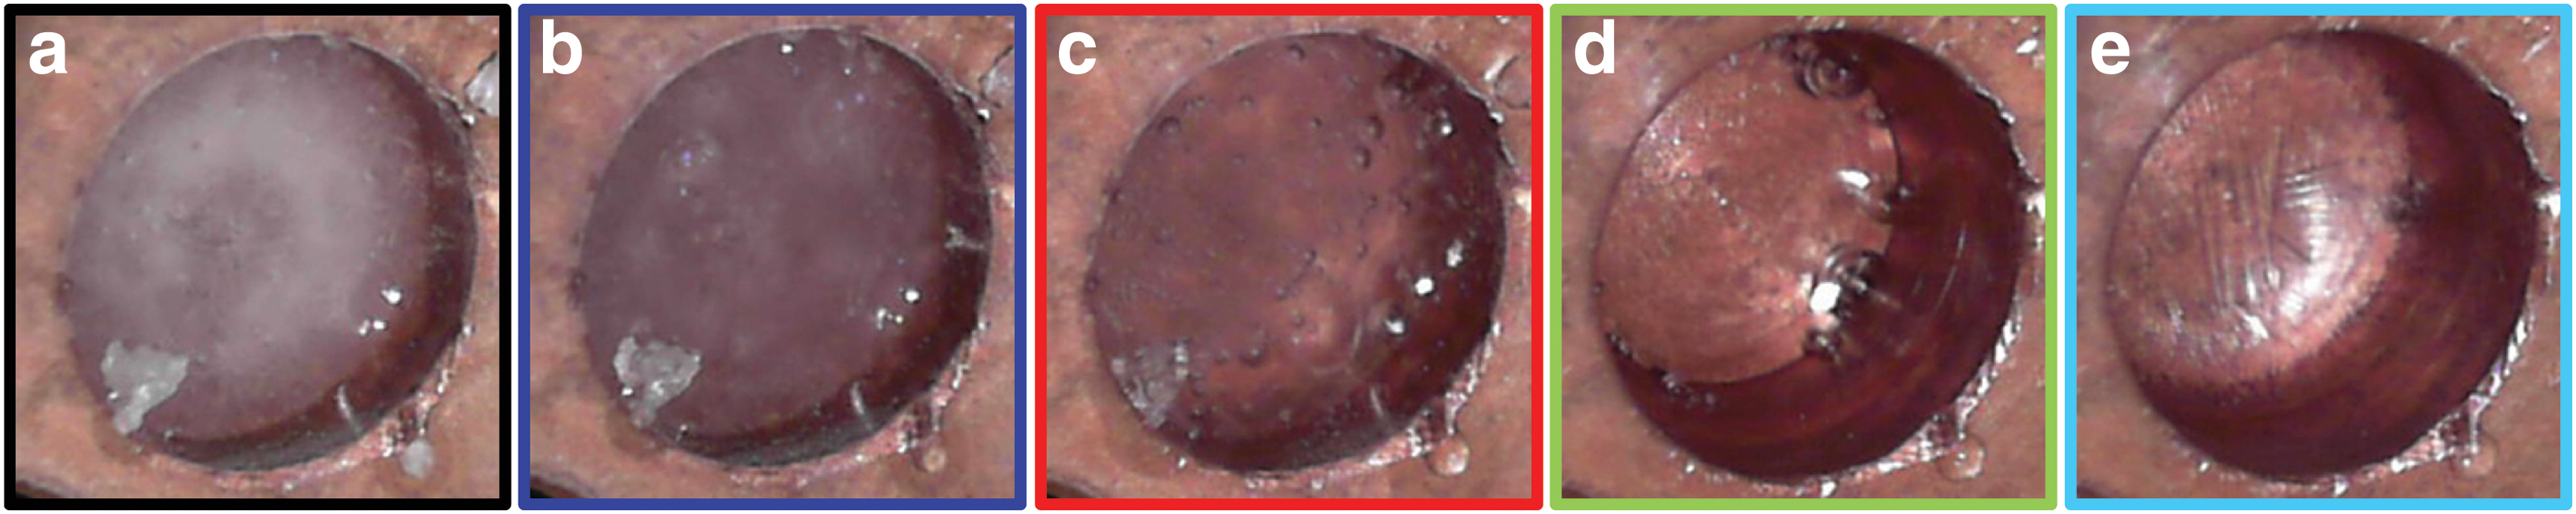
Images of the sample color-coded according to spectra shown in Figs. 8 and 9. (
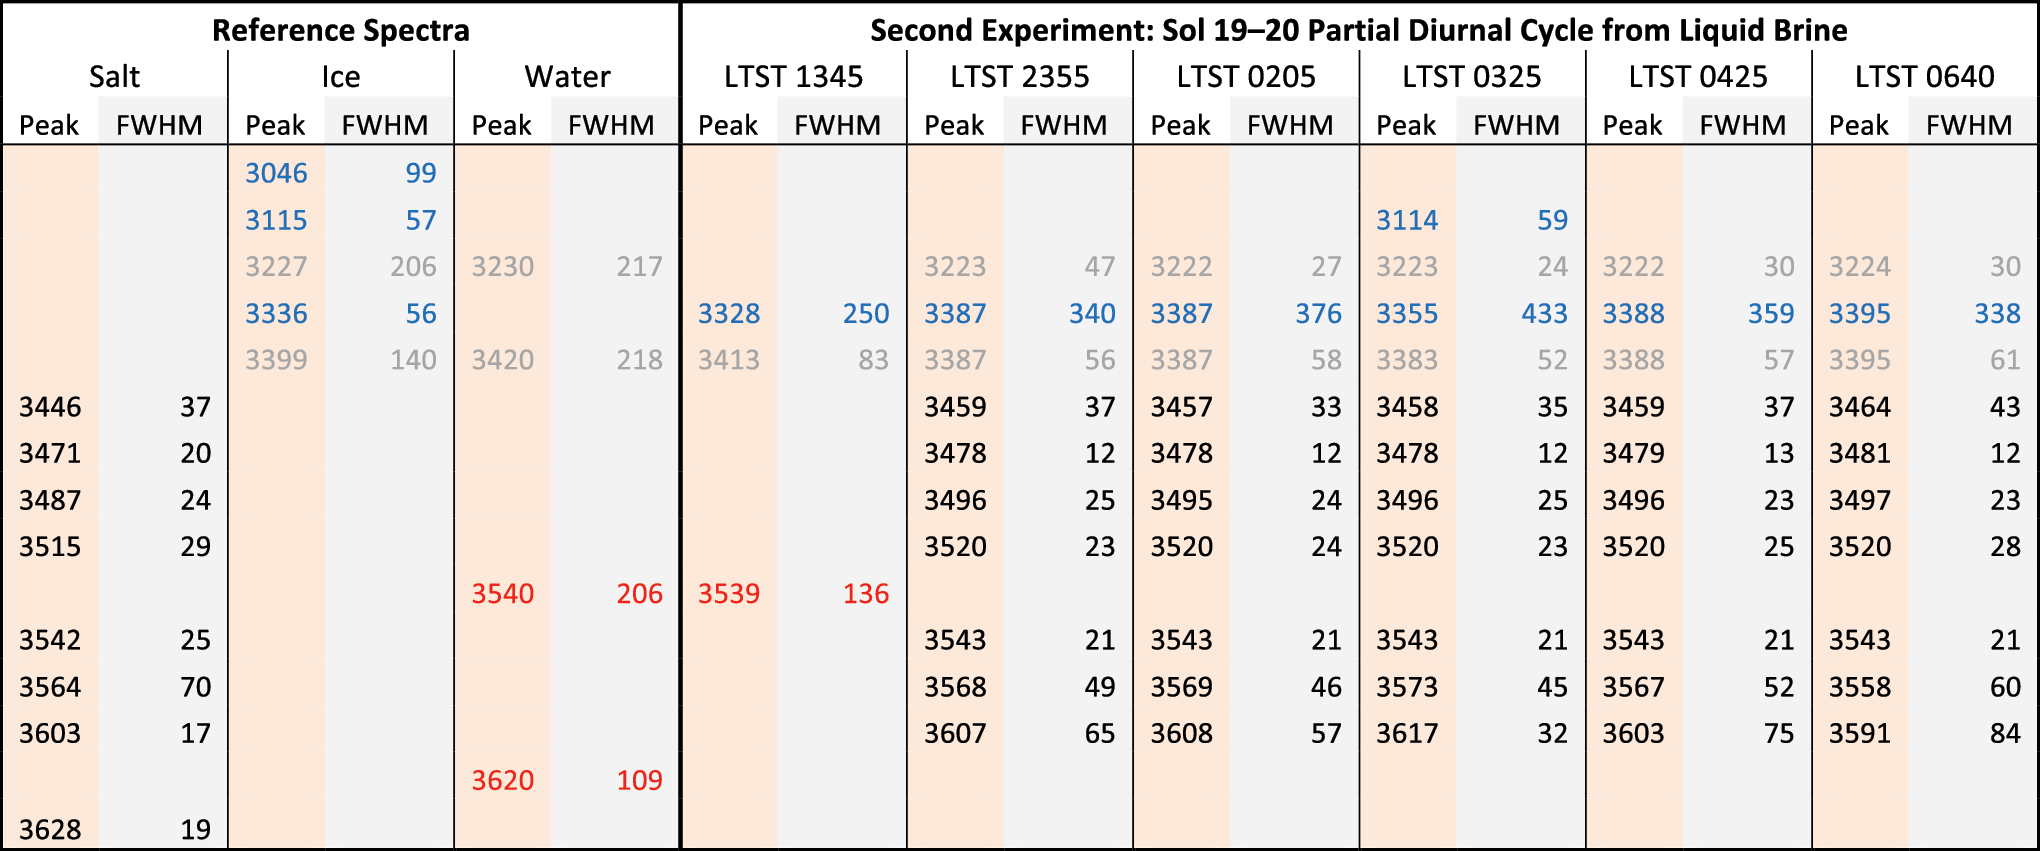
The Gaussian decomposition of the spectrum at 13:45 shows a liquid water peak at 3539 cm−1, indicating that the sample is brine when the salt crust forms (see Fig. 10a). Another peak at 3328 cm−1 seems to indicate the presence of ice, but this is unlikely because the temperature at 13:45 is the warmest of Sol 19, about 60 K above the eutectic point, and the sample was initially prepared as a saturated solution. A peak at a lower wavenumber (closer to the 3230 cm−1 peak in the water reference) with a slightly different FWHM leads to a similar accuracy for the complete decomposition. We believe that this is caused by inaccuracies in peak positions when wide FWHM values occur in the Gaussian decomposition, as it is the case for the 3328 cm−1 peak in this decomposition. Ambiguities in the detection of phase changes using Gaussian decomposition will be described in more detail in a future study. Only salt and ice peaks are present at 23:55 because most of the water in the sample has evaporated and the remaining solution is frozen (see Fig. 10b). The Gaussian decomposition does not change until 03:25, when an additional ice peak at 3114 cm−1 appears (see Fig. 8). At this time the frozen solution in the sample is whitish and opaque, similar to the material found in the Dodo-Goldilocks trench by the Phoenix lander (Fig. S2). At 04:25 the peak at 3114 cm−1 and the white color disappear (Fig. 10e). This happens when the temperature exceeds the eutectic value. At 06:40, about 2 h after exceeding the eutectic temperature, no peak indicating brine is detected, suggesting that the frozen solution is whitish because it is nearly salt-saturated. Most of the water substance has either evaporated or sublimated, and not enough water is available to form brine in a subsequent diurnal cycle.
3.3. Third experiment: diurnal cycle of initially frozen brine at martian polar surface conditions
To further analyze the impact of the initial state of the sample on the results, a third experiment starting with frozen brine instead of salt on top of ice (first experiment) or brine (second experiment) was conducted. This experiment covered the portion of the Sol 19 diurnal cycle between 04:00 and 15:30 (Fig. 3). This third experiment with frozen brine as the initial sample might be indicative of the evolution of the material unveiled at the Dodo-Goldilocks trench, while the first experiment with salt on top of ice as the initial sample represents the evolution of a soil salt crust covered by snow (Whiteway et al., 2009) or frost (Smith et al., 2009). The evolution of the sample throughout diurnal cycles is similar in the first and third experiments (Fig. 11 and Table 3). However, a significant difference between them is that, at the beginning of the third experiment, when the temperature was still below the eutectic value and brine (liquid) was not present in the sample, the perchlorate peak is now located at 936 cm−1, suggesting a different hydration state (Fig. 12). Consequently, in this case, the perchlorate peak in the Raman spectrum at 936 cm−1 is the result of the presence of only crystalline salt hydrates, indicating that this peak is an ambiguous indicator of the presence of brine. Throughout the diurnal cycle, the sample underwent similar changes as those observed in the first experiment: the frozen brine melted when the eutectic temperature was exceeded, and evaporation of water from the brine produced a salt crust on the top of the sample (Fig. 13). However, both brine and the salt crust formed about 45 min later in the third experiment than in the first.


As in Fig. 11, but for the perchlorate vibration band. The perchlorate peak at 936 cm−1 is at a similar location for both, the mix of water ice and salt (frozen brine) (black curve) and brine (green and cyan curves), indicating that it is not an unambiguous indicator of brine.
Images of the sample color-coded according to the spectra shown in Figs. 11 and 12. (
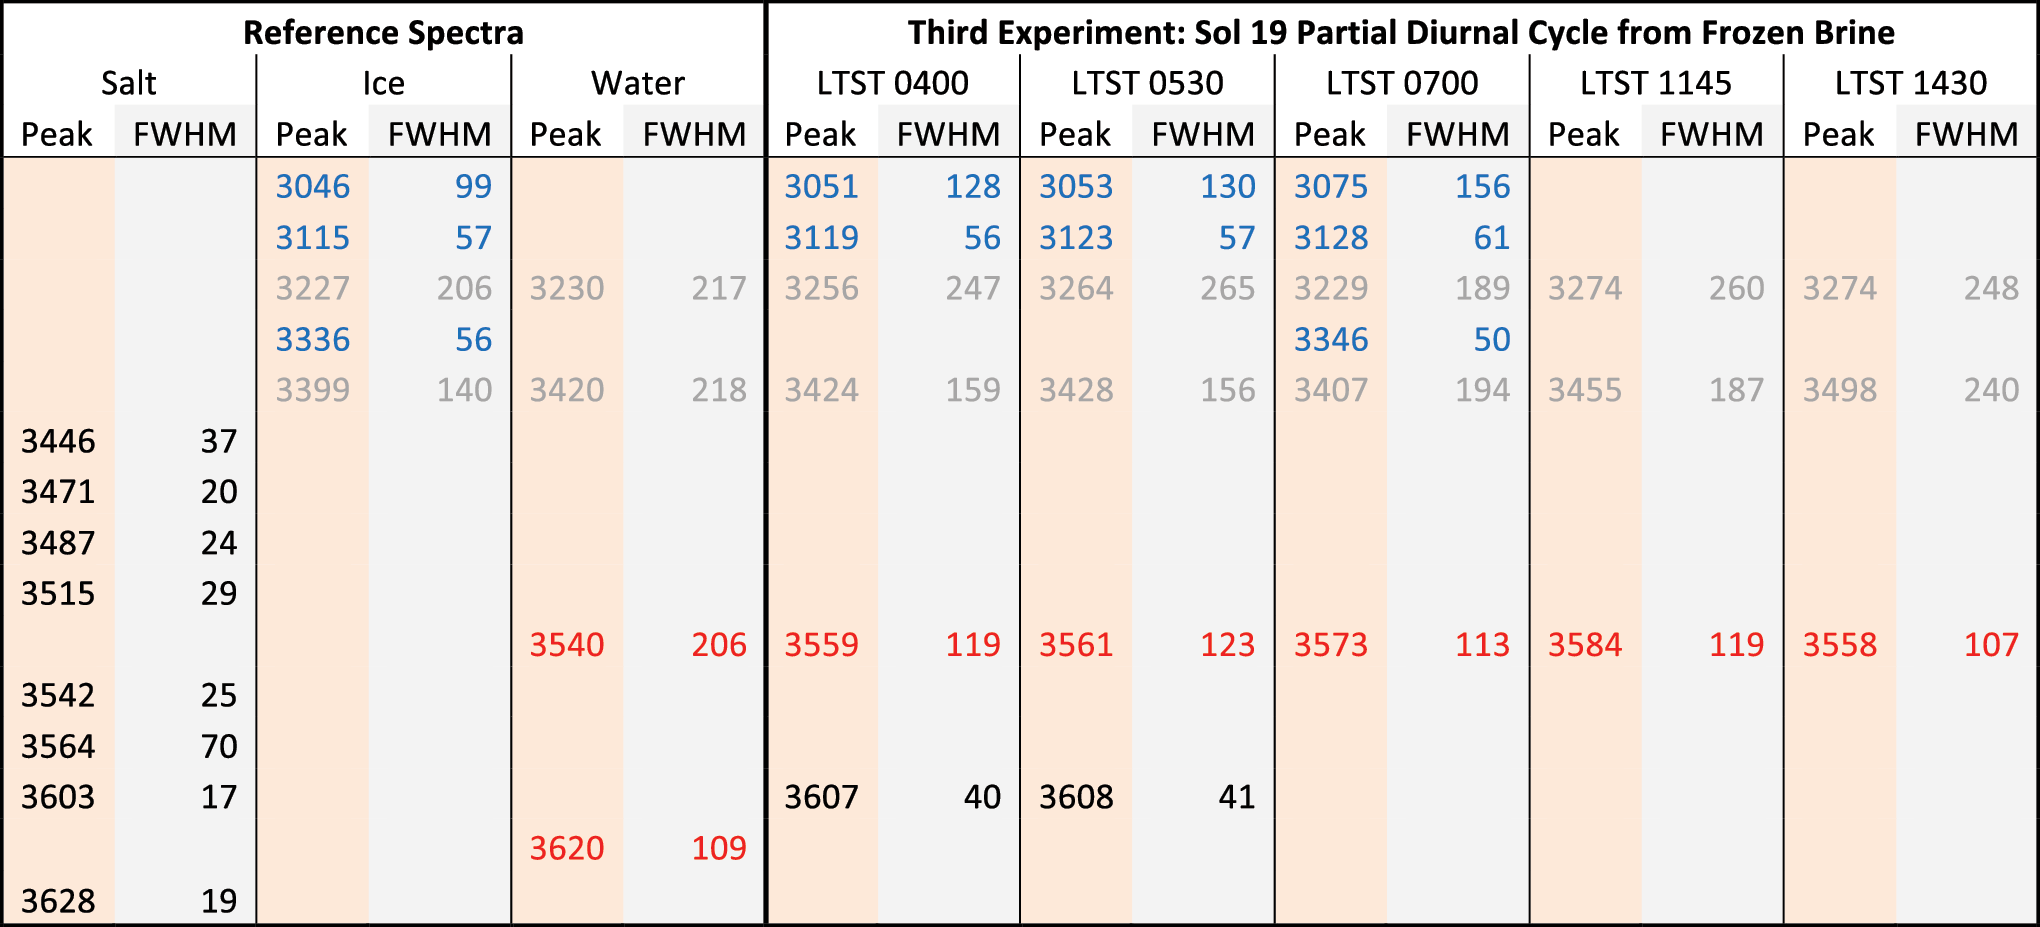
At 04:00 the spectrum contains ice and salt peaks, as well as a single water peak at 3559 cm−1. The presence of the water peak might be caused by small amounts of brine in the ice even at temperatures far below the eutectic value. This behavior was also observed at the end of the fourth experiment, when brine remained liquid even after the sample was kept below the eutectic temperature for at least 30 min (Table 4). The spectral decomposition has barely changed by 05:30, when the eutectic temperature has been exceeded and brine starts to become visible in the image (Fig. 13b). At 07:00 the salt peak disappears, and only water and ice peaks are left, consistent with Fig. 13c. At 11:45 the ice has melted completely, and the ice peaks have disappeared from the spectrum. Only liquid water peaks remain until the onset of a crust formation at 14:30. The onset of brine and crust formation occurs 45 min later than in the first experiment.
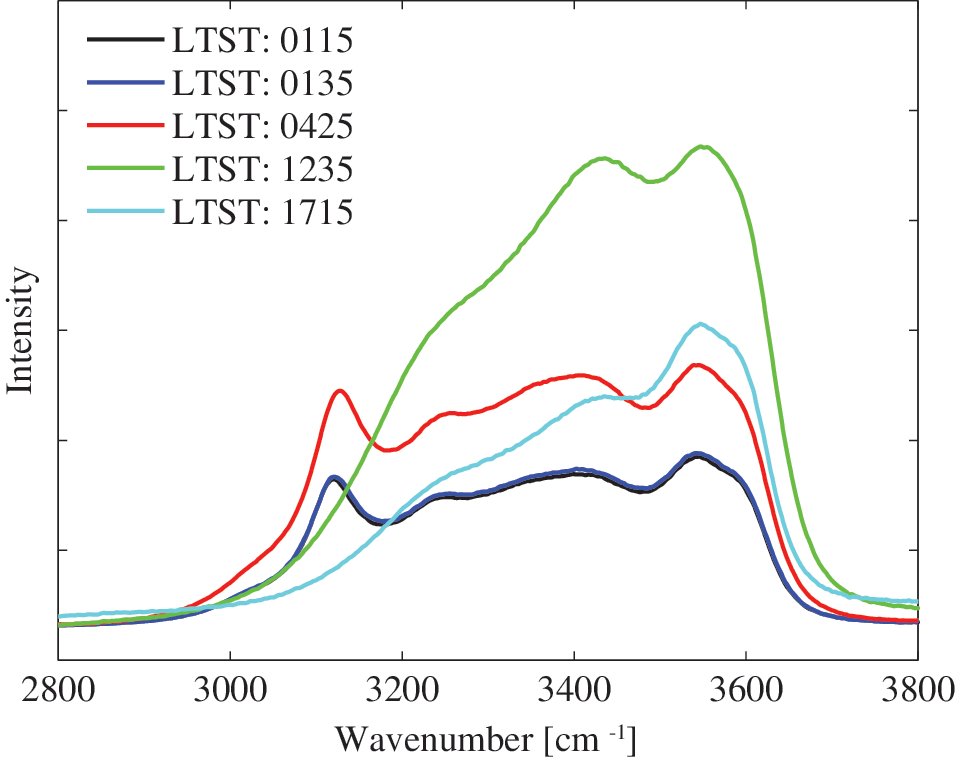
3.4. Fourth experiment: diurnal cycle of initially frozen brine at the environmental conditions of the Phoenix strut
A fourth experiment was conducted to simulate the full Sol 19 diurnal cycle on the Phoenix strut at about 0.5 m above the ground (Figs. 14 –16 and Table 4), where spheroids were observed. This fourth experiment started at midnight (Fig. 4) with frozen brine that we hypothesize to be representative of the material splashed on the Phoenix lander strut during landing. The decomposition of the Raman spectrum of frozen brine at 12:15 (Fig. 14), when the temperature was still below the eutectic point, indicates the presence of ice and salt peaks (Table 4). Similar to the peak observed in the third experiment and shown in Fig. 12, the perchlorate peak for the frozen brine is at 936 cm−1 (Fig. 15). The first visual evidence of melting occurs at 01:35 (Fig. 16b), 5 min after the eutectic temperature is exceeded. However, changes in the Raman spectrum appear only after ∼04:30, when the ice peak at ∼3120 cm−1 starts to disappear as shown in Fig. 14. This might be the result of a lower rate of temperature increase (Fig. 4) in this experiment than in the previous experiments (Fig. 2). The ice peaks are completely gone by 12:35, with only the liquid water peaks remaining. The spectrum does not change from 17:15 until the end of the experiment (Table 4), with the sample remaining liquid until midnight, despite the sample temperature being below the eutectic value during the last ∼30 min of the experiment (Fig. 4). Brine persisted longer than in the previous experiments because the temperature at the strut at 0.5 m above the surface was below the eutectic value for only ∼3 h, compared to ∼7 h at the ground (Fig. 1). In addition, the lower maximum temperature reduced loss of water by evaporation.


Images of the sample (a–e) and of a spheroid of the same composition (f–j), similar to those observed on the Phoenix strut, color-coded to represent the times when the Raman spectra were taken (Figs. 14 and 15). (
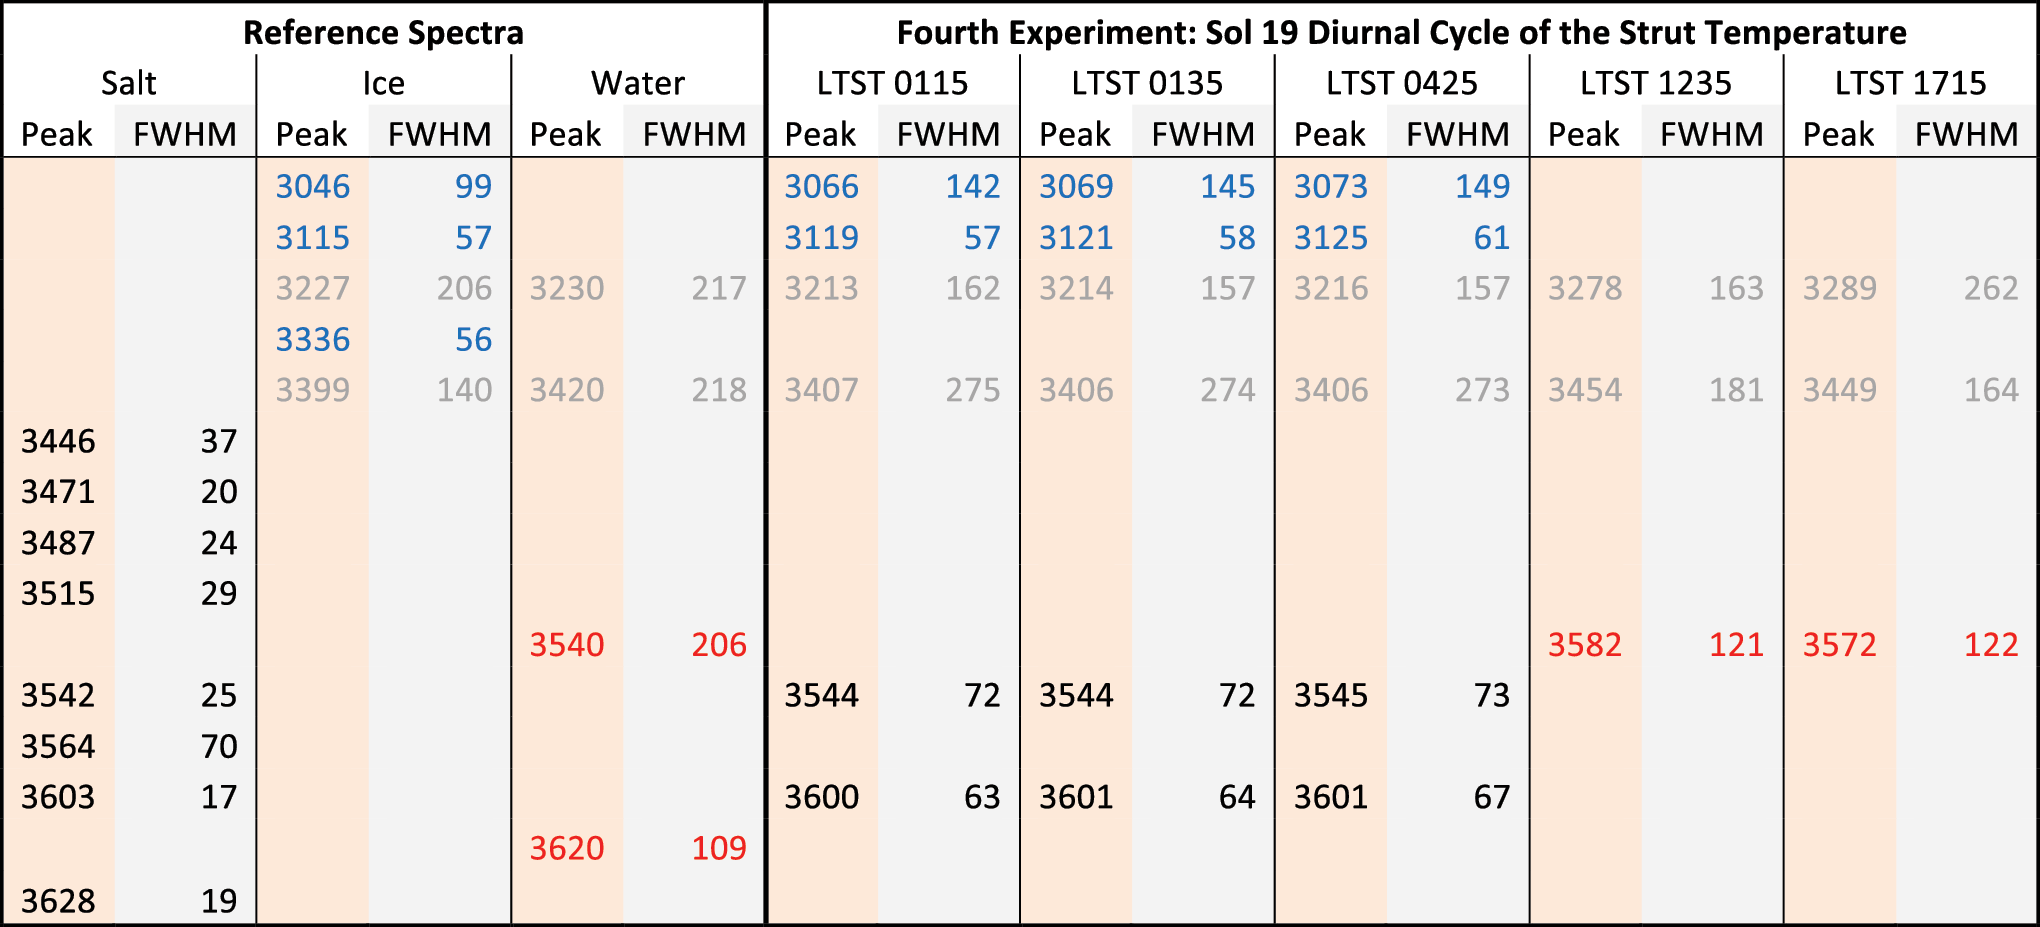
The decomposition of the frozen mix at 01:15 contains ice and salt peaks. Despite exceeding the eutectic temperature at 01:30, spectral changes have not occurred by 04:25. This might be explained by a lower rate of temperature increase after crossing the eutectic temperature (Fig. 4) than that occurring on the ground (Fig. 2). The ice peaks start to disappear after ∼04:30 and are completely gone by 12:35, with only the liquid water peaks remaining. This change is also visible in Fig. 16d, showing the remaining ice melting. The spectrum does not change from 17:15 until the end of the experiment, with the sample staying liquid even during the last 30 min of the experiment when the temperature decreases below the eutectic value. In this experiment, a salt crust does not form on the sample because the lower maximum temperature and near-saturated air mitigate evaporation.
4. Discussion
Our results show that, when water ice is in contact with Ca(ClO4)2 salt, either unmixed or as in a frozen brine, (liquid) brine forms within a few minutes in the unmixed case and within ∼45 min in the case of frozen brine of the eutectic temperature being exceeded. Then, as the temperature increases during the diurnal cycle, evaporation increases the concentration of the solution, causing a salt crust to form on the top of the sample. Due to the limited penetration depth of the Raman laser, the exact time when a liquid phase ceases to exist in the sample cannot be measured unambiguously. Taking the first experiment as an example, this occurs because the position of the liquid water peak at 3555 cm−1 does not change abruptly between 13:45 and the end of the experiment (Fig. 5; Table 1). Electrical conductivity or permittivity measurements may be able to determine the exact time that brine forms (Zandonadi et al., 2015; Heinz et al., 2016). As evaporation thickens the salt crust, the 3555 cm−1 spectral peak indicating the presence of liquid water transitions smoothly into nearby peaks at 3543 and 3546 cm−1 indicating the presence of crystalline Ca(ClO4)2 hydrates. However, our results suggest that, while the temperature was above the eutectic value for about 17 h on Sol 19 (Fig. 1), brine could have formed and persisted in the Dodo-Goldilocks trench as long as enough water ice was present to compensate for evaporation. Our analysis also indicated that brine formed at about 04:37 (i.e., minutes after the ground temperature exceeded the eutectic value) and froze at about 22:20 (when the ground temperature decreased below the eutectic value).
Results of experiments with a soil-salt-ice mixture indicate that the presence of a soil causes a delay in brine formation. Results of these experiments will be the subject of a future article because of the added complexity to the observed Raman spectra.
Brine formation could also occur between polar and midlatitude regions, where frost and snow are seasonally deposited on saline soils (Whiteway et al., 2009; Martínez et al., 2012); water ice is seasonally present in the shallow subsurface (Cull et al., 2010b); and temperatures exceed the eutectic value during a significant fraction of the sol (from minutes to hours depending on the location and time of the year) (Möhlmann, 2011; Fischer et al., 2014; Nuding et al., 2014). Therefore, our results suggest that brine could form in the martian polar region on seasonal timescales and persist for as long as the temperature remains above the eutectic value during diurnal cycles because the melting of water ice could compensate for evaporation.
Water ice is unlikely to be present in the shallow subsurface of midlatitudes and equatorial regions because it is not thermodynamically stable in these places (Mitrofanov et al., 2002; Schorghofer and Aharonson, 2005). However, frozen brine could be stable in the shallow subsurface of midlatitude regions, and brine could form temporally if the temperature exceeds the eutectic value. In addition, thin layers of frost are possible on polar-facing slopes of those regions throughout the day (Vincendon et al., 2010), as well as on flat terrains at night (Wall, 1981; Möhlmann, 2008). Under these conditions, frost in contact with Ca(ClO4)2 salt could produce brine, but only in the short time interval during which the ground temperature is above the eutectic value and the frost has not completely sublimated away.
Ca(ClO4)2 salt was detected at the Mars Science Laboratory landing site at Gale Crater (Glavin et al., 2013), where evidence for nighttime formation of frost a few tenths of a micrometer thick (Martínez et al., 2015; Savijärvi et al., 2015) has been reported. However, frost can form at Gale only between 04:00 and 06:00, when the ground temperature is below the eutectic point. This thin layer of frost would have likely sublimated away by ∼07:00, when the ground temperature first exceeds the eutectic value on the sols when frost is predicted (Martínez et al., 2015). In addition, the solubility of Ca(ClO4)2 salts in ice of a thickness of a few tenths of a micrometer is not known. This indicates that brine is unlikely to form at the surface of Gale Crater.
5. Conclusion
The Phoenix lander discovered water ice (Smith et al., 2009) and salts such as Ca(ClO4)2 with a eutectic temperature lower than the maximum diurnal ground temperature at its landing site (Hecht et al., 2009). In addition, Phoenix found indirect evidence for frozen brine in a shallow trench excavated by the Phoenix robotic arm on Sols 18–19 (Rennó et al., 2009; Cull et al., 2010a). Here, we show that, at Phoenix landing site environmental conditions, brine forms minutes after the eutectic temperature is exceeded and stays liquid for ∼18 h while the temperature is above the eutectic value if enough water ice is present to compensate for some of the water loss by evaporation. Furthermore, our experiments' results indicate that the spheroids observed on a strut of the Phoenix lander early in the mission might have remained liquid for most of the diurnal cycle (∼22 h) if the melting of frozen brine splashed during the landing formed them. Thus, the martian polar region may temporarily have one of the essential ingredients to be a habitat for microorganisms that thrive in brine (Boetius and Joye, 2009).
Footnotes
Acknowledgments
Funding for this project was provided by the NASA Astrobiology Program: Exobiology and Evolutionary Biology Award #09-EXOB09-0050. Our experimental data are available upon request.
Disclosure Statement
No competing financial interests exist.
Abbreviations Used
References
Supplementary Material
Please find the following supplemental material available below.
For Open Access articles published under a Creative Commons License, all supplemental material carries the same license as the article it is associated with.
For non-Open Access articles published, all supplemental material carries a non-exclusive license, and permission requests for re-use of supplemental material or any part of supplemental material shall be sent directly to the copyright owner as specified in the copyright notice associated with the article.