
Abstract
Scientific access to spaceflight and especially the International Space Station has revealed that physiological adaptation to spaceflight is accompanied or enabled by changes in gene expression that significantly alter the transcriptome of cells in spaceflight. A wide range of experiments have shown that plant physiological adaptation to spaceflight involves gene expression changes that alter cell wall and other metabolisms. However, while transcriptome profiling aptly illuminates changes in gene expression that accompany spaceflight adaptation, mutation analysis is required to illuminate key elements required for that adaptation.
Here we report how transcriptome profiling was used to gain insight into the spaceflight adaptation role of Altered response to gravity 1 (Arg1), a gene known to affect gravity responses in plants on Earth. The study compared expression profiles of cultured lines of Arabidopsis thaliana derived from wild-type (WT) cultivar Col-0 to profiles from a knock-out line deficient in the gene encoding ARG1 (ARG1 KO), both on the ground and in space. The cell lines were launched on SpaceX CRS-2 as part of the Cellular Expression Logic (CEL) experiment of the BRIC-17 spaceflight mission. The cultured cell lines were grown within 60 mm Petri plates in Petri Dish Fixation Units (PDFUs) that were housed within the Biological Research In Canisters (BRIC) hardware. Spaceflight samples were fixed on orbit. Differentially expressed genes were identified between the two environments (spaceflight and comparable ground controls) and the two genotypes (WT and ARG1 KO). Each genotype engaged unique genes during physiological adaptation to the spaceflight environment, with little overlap. Most of the genes altered in expression in spaceflight in WT cells were found to be Arg1-dependent, suggesting a major role for that gene in the physiological adaptation of undifferentiated cells to spaceflight. Key Words: ARG1—Spaceflight—Gene expression—Physiological adaptation—BRIC. Astrobiology 17, 1077–1111.
1. Introduction
M
Even though undifferentiated cells and single-celled organisms lack specialized organs for gravity sensing, they are indeed able to detect changes in gravity and are affected by the spaceflight environment. In the microgravity of spaceflight, cells adapt by making changes to their metabolism that are guided by, and reflected in, differential gene expression when compared to living on the ground (Salmi and Roux, 2008; Paul et al., 2012; Fengler et al., 2015). Further, undifferentiated cells survive and multiply in space, implying that cells manage to reestablish a favorable physiological equilibrium in microgravity (Paul et al., 2012; Fengler et al., 2015). Individual cells can sense and respond to changes in their gravity environment, but the mechanism by which these signals are received and then transduced is poorly understood. Our work with the response of plants and undifferentiated cell cultures to spaceflight revealed a number of potential molecular constituents that may be involved in gravisensing and adaptation to spaceflight environments. The approach in the present study was to examine patterns of gene expression in undifferentiated cell lines of Arabidopsis thaliana (Arabidopsis) developed from wild-type Columbia-0 (Col-0) and from Col-0 plants deficient in a known gravity-sensing gene: Altered response to gravity 1 (Arg1).
Several reasons contributed to the selection of Arg1 for closer study. Central to the decision was the evidence that Arg1 functions in the early events in gravitropic signal transduction in plant roots (Sedbrook et al., 1998; Blancaflor, 2013). During root gravistimulation, ARG1 helps guide the relocalization of membrane-bound auxin efflux carrier proteins—such as PIN2 and PIN3—to the basal side of the statocytes, which contributes to the establishment of a lateral gradient of auxin across the root cap (Abas et al., 2006; Harrison and Masson, 2008b; Kleine-Vehn et al., 2010). Although this process has not been demonstrated in non-statocyte cells, ARG1 seems to be well positioned for a role in response to gravity in undifferentiated cells as well. Several additional characteristics made Arg1 a particularly interesting subject with regard to undifferentiated cells. Arg1 is expressed throughout the entire plant; it is not a root-specific gene. Further, ARG1 is not localized to plastids and does not appear to be dependent on mechanisms related to amyloplast movement in specialized cells, such as is typified by PGM, another protein linked to gravitropism (Guan et al., 2003; Stanga et al., 2009; Morita and Nakamura, 2012). Since specialized cells are absent in the cell cultures, the apparent ability of ARG1 to contribute to gravity sensing without these specializations reinforced its candidacy. In addition, ARG1 is localized throughout the endosomal/secretory pathway, enabling it to interact with both vesicular trafficking and integral membrane proteins (Boonsirichai et al., 2003). ARG1 localization cycles along the endomembrane system between the plasma membrane and intracellular compartments (Boonsirichai et al., 2003; Stanga et al., 2009); thus ARG1 could play a role in gravisensing based on its association with internal cellular structures in the undifferentiated cells. The highly conserved
Cell lines from wild-type (WT) Col-0 and an ARG1 knock-out (ARG1 KO) in the same Col-0 background were launched to the ISS for the CEL experiment, which was a component of the Biological Research In Canisters-17 (BRIC-17) payload. The experiments described here compare samples fixed in orbit after growth in space to comparable samples grown in precisely the same hardware on the ground. The focus of the experiment was to evaluate the overall effect of the spaceflight environment on these cells.
The objective of these experiments was to develop a better understanding of the sensitivity of undifferentiated cells to the spaceflight environment and, in particular, test the effect of removing Arg1, a gene we hypothesized would be a gene of importance to the adaptive process. The utilization of this mutant also revealed genes important to spaceflight adaptation that would not normally be recognized, as they are not differentially regulated by spaceflight in WT cells. In the case of these genes, the level at which they are expressed on the ground in WT cells is the level that is also required in the physiological adaptation to spaceflight, so no differential expression is seen between ground and spaceflight in WT cells. However, if the expression levels on the ground are altered for these genes, as can be found in a mutant cell line such as ARG1 KO, then the expression levels must be adjusted to the normal WT levels to enable spaceflight adaptation. Thus the altered expression level of these genes is irrelevant for the ground adaptation but is important for the spaceflight adaptation.
The results of the spaceflight experiment presented here have enhanced our understanding of ARG1's role in adjusting to this novel environment and have also enabled us to look further into the adaptive process engaged by cells lacking specific, differentiated cells and organs for environmental sensing.
2. Materials and Methods
2.1. Concept of operations and comparison approach
When a cell transitions from Earth to orbit, it responds and begins to adjust its metabolism to the stimuli offered by the new environment. In this experiment, the patterns of gene expression established after 10 days of growth in the BRIC hardware were used to illuminate the strategies undifferentiated cells used to physiologically adapt to the spaceflight environment. Microarray gene expression data were analyzed using a two-part approach. First, differentially expressed genes were identified between cells grown in the two environments: spaceflight and the comparable ground controls. The genes identified in this “vertical” comparison reflected physiological adaptation to the spaceflight environment within each genotype. Second, differentially expressed genes were identified between wild-type (WT) and arg1 mutant (ARG1 KO) genotypes. The genes identified in this “horizontal” genotype comparison showed the impact of removing ARG1 from metabolic processes in both the normal ground control environment as well as in the spaceflight environment. Comparing gene expression patterns revealed potential roles for ARG1 in both environments. An overview is shown in Fig. 1 and details of the approach provided below.

Graphical presentation of the two approaches used in the microarray data analysis. (
This first analytical approach involves the typical comparison of the gene expression profiles of spaceflight-grown cells to the ground controls for each of the two cell lines, thereby characterizing the physiological adaptation of each genotype to spaceflight (red box in Fig. 1A and red arrows in 1B). Genes identified in WT cells contribute to understanding which cellular processes were sensitive to microgravity and spaceflight. If physiological adaptation to spaceflight depends entirely on functional Arg1, then the ARG1 KO cell line would be in severe decline, and the spaceflight-to-ground gene expression profiles would reflect that stress. If ARG1 is not involved in physiological adaptation to spaceflight, then the spaceflight-to-ground gene expression profiles from ARG1 KO cells would be largely the same as WT. However if ARG1 functions simply as part of the pathways engaged by spaceflight, then the pattern of genes differentially expressed to adapt to spaceflight will differ between WT and the knock-out cell line but retain some degree of overlap.
The second analytical approach involves the comparison of gene expression profiles between WT and ARG1 KO cells both on the ground and during spaceflight (green and blue box of Fig. 1A and green and blue arrows of 1B). This approach reveals gene expression differences in the cells adapted to either environment with a disabled Arg1 gene. Since ARG1 has a role in typical cell maintenance, it was likely that the gene expression profiles of ARG1 KO cell culture would differ from WT in the ground environment, as a knock-out cell line would adapt its metabolism to compensate for the absence of the important gene. Since the gene expression patterns on the ground will likely affect the nature of adaptation to spaceflight, it is important to compare the gene expression profiles between the two genotypes of the ground controls (green box of Fig. 1A and green arrows of 1B).
Finally, every individual gene engaged in the WT physiological adaptation to spaceflight experiment was examined in the ARG1 KO cells to determine whether the gene was similarly expressed or changed in the knock-out line. If a gene was changed in the same way in both genotypes, then we concluded it was Arg1 independent. However, if a gene was not engaged in the ARG1 KO cells, or was engaged in a different manner than in the WT cells, then the expression of that gene in the WT adaptation to spaceflight was determined to be dependent upon ARG1 function.
2.1.1. The CEL experiment of BRIC-17
The CEL experiment setup and organization was a modification of a previous Arabidopsis cell culture experiment in BRIC-16 (Paul et al., 2012). The CEL BRIC-17 experiment was launched on board the Dragon capsule of the SpaceX-2 Commercial Resupply Service (CRS) mission to the ISS on 1 March 2013. The cultured cell lines (both the ground control and the spaceflight samples) were grown within 60 mm Petri plates in Petri Dish Fixation Units (PDFUs) that were housed within the BRIC hardware. The BRIC hardware remains stationary after it is de-stowed from the Dragon Capsule and deployed to the ISS. The BRIC hardware does not have a centrifuge component, nor is it compatible with the limited centrifuge facilities on the ISS, such as the European Modular Cultivation System (EMCS) centrifuge. Additional hardware details and BRIC illustrations can be found in Paul et al. (2012). The experiment made a direct comparison of spaceflight-grown cells to those grown as controls on the ground for the purpose of exploring the complete range of effects that spaceflight presents to plant cells, which includes but is not limited to the effects of microgravity.
Two BRIC containers (A and B) were assigned to CEL within the BRIC-17 payload. Each chamber housed five PDFUs, each PDFU holding one 60 mm Petri plate. In each BRIC container there were two plates with WT cells and three plates with knock-out cells of two genotypes. The exact same PDFU composition was recapitulated in BRIC containers on the ground in the International Space Station Environmental Simulator (ISSES) chamber at Kennedy Space Center (KSC) as ground controls. The ground controls were initiated with a 48 h delay so that the precise temperature environment of the ISS could be recreated for the ground controls in the ISSES chamber. Cells were fixed on the ISS with RNAlater™ (Ambion) on the 10th day on orbit, and the ground controls were fixed 48 h later. RNAlater fixation was initiated by the crew using an activation tool that moves RNAlater from a storage container in the PDFU into the Petri plate. Twenty four hours after fixation, the entire BRIC was moved to the Minus Eighty-degree Laboratory Freezer for ISS (MELFI), where it resided until cold stowage transport back to Earth within the Dragon capsule. After returning to Earth, the samples were reclaimed at KSC and then transported to the University of Florida laboratories. As described below, the total RNA was extracted from spaceflight samples and corresponding ground control samples and subjected to microarrays. Although the BRIC hardware has virtually no air circulation, no gas exchange, and no light, that hardware configuration is not substantially different from the normal growing conditions of the undifferentiated tissue culture cells, which are typically grown in sealed Petri plates in the dark (Johnson et al., 2015).
2.2. Tissue culture cell lines
Arabidopsis callus cultures were established de novo from well-established plant lines available through The Arabidopsis Information Resource (TAIR,
2.3. Preparation of BRIC-17 CEL cell culture plates
Liquid suspension cells growing in log phase were transferred to solid media two and a half days prior to turning over the payload in preparation for launch. The liquid media was decanted, the material washed once with fresh liquid media, and then the sample was decanted again. A sterile scoop was used to place about 1 g of cells on the surface of a 60 mm Petri plate (Falcon, Becton Dickinson Labware, Franklin Lakes, USA) that contained 6.5 mL nutrient agar media [MS salts (4.33 g/L), 3% sucrose (30 g/L), MS vitamins, 2,4-D MES buffer (0.5 g/L), 0.8% agar (8 g/L)]. The cells were then dispersed evenly across the surface. All plate manipulations were conducted under sterile conditions in a laminar flow hood to ensure sterility of both the interior and exterior of the plates. Plates were put into a sterile Nalgene™ BioTransport Carrier (Thermo Scientific), each layer of plates separated with a sterile non-skid plastic insert. The BioTransporter was then sealed with gas-permeable tape (3M), wrapped in Steri-Wrap™ autoclave wraps (Fisher), and then driven to KSC. The BRIC-17 CEL experiment was turned over to payload engineers in the SSPF (Space Station Processing Facility) at KSC 48 h before the scheduled launch time.
2.4. RNA extractions
Total RNA was extracted using Qiashredder and RNAeasy™ kits from QIAGEN (QIAGEN Sciences, MD, USA) according to the manufacturer's instructions. Residual DNA was removed by performing an on-column digestion using an RNase Free DNase (QIAGEN GmbH, Hilden, Germany). Integrity of the RNA was evaluated using the Agilent 2100 BioAnalyzer (Agilent Technologies, Santa Clara, CA, USA).
2.5. Microarrays
cDNA was synthesized using Ovation Pico WTA System (NuGEN Technologies, Inc.), and cDNA was labeled using Encore Biotin Module (NuGEN Technologies, Inc.). Amplified and labeled cDNA (5 μg/sample) was fragmented and hybridized with rotation onto Affymetrix GeneChip Arabidopsis ATH1 Genome Arrays for 16 h at 45°C. Arrays were washed on a Fluidics Station 450 (Affymetrix) with the Hybridization Wash and Stain Kit (Affymetrix) and the Washing Procedure FS450_0004. Scanning was performed using Affymetrix GeneChip Scanner 3000 7G. For both spaceflight and ground control, five plates of WT and four plates of ARG1 KO were analyzed as biological replicates.
2.5.1. Microarrays data analysis
Affymetrix Expression Console Software (Version 1.3) was used to generate .CEL files for each RNA hybridization. All analysis was performed in R 3.0.0 and Bioconductor version 2.12 (R Development Core Team, 2012). Background adjustment, summarization, and quantile normalization were performed using Limma package (Smyth, 2004). Normalization was made using the Affymetrix MAS 5.0 normalization algorithm (Hubbell et al., 2002). Data quality was assessed using the arrayQualityMetrics package and various QC charts (Density & Intensity plot, NUSE, RLE, and RNA Degradation Plot). Probes that had absent signals in all samples were removed. For each replicate array, each probe-set signal value from spaceflight samples was compared to the probe-set signal value of ground control samples to give gene expression ratios. Differentially expressed genes were identified using the Limma package with a Benjamini and Hochberg false discovery rate multiple testing correction. Genes were considered as differentially expressed with stringent criteria at p value <0.01, abs Fold Change >2 (−1 < FC log2 > +1; labeled as log2 Fold Change) unless stated otherwise.
The microarray data are publicly available from Gene Expression Omnibus (GEO) of the National Center for Biotechnology Information (NCBI) data repository under accession number GSE81442.
2.5.2. Comparison groups
The groups outlined in the concept of operations and comparisons were established and abbreviated with combination of two capital letters and a short version of the cell line name in superscript (Fig. 1B). Letters are as follows: G for ground control, F for spaceflight; superscripts are Wt for WT cells, Arg for ARG1 KO cells.
2.6. Functional gene categorization, Gene Ontology annotations
Gene function was annotated by associations of controlled vocabularies or keywords to data objects (Gene Ontology, GO). Multiple GO toolkits of this controlled vocabulary system were used to collect annotations of gene function. Various lists of gene names were created, and enrichment GO terms were searched after statistical tests from precalculated backgrounds. All three aspects of gene products (molecular function, biological process, and subcellular location) described by GO-controlled vocabularies were considered. A significance level of 0.05 and five genes as minimum number of mapping entries were implemented for the analysis parameters in the following tools.
2.7. Real quantitative reverse transcription–polymerase chain reaction, RT-qPCR
The total RNA (850 ng) was reverse transcribed into cDNA using High Capacity RNA to cDNA Master Mix (Applied Biosystems, Foster City, CA, USA). One-tenth of total cDNA was used as a template for a single RT-qPCR run. RT-qPCR was carried out using TaqMan™ technology on the ABI 7500 Fast instrument (Applied Biosystems, Foster City, CA, USA). The TaqMan™ Fast Advanced Master Mix (Applied Biosystems, Foster City, CA, USA) reagent was used for the duplex RT-qPCR reaction with 6FAM and VIC-dye labeled, TAMRA-quenched probes. In all reactions the Ubq11 (At4g05050) served as an internal control. Each duplex PCR mixture contained 900 nM target gene-specific forward and reverse primers each, 150 nM Ubq11 forward and reverse primers each, 250 nM 6FAM labeled target gene-specific probe, and 250 nM VIC-labeled Ubq11 probe. Primers and probes were designed with Primer Express software and supplied by Applied Biosystems. The primers/probes sequences shown as 5′→3′ were as follows: Ubq11 (At4g05050) forward: AACTTGAGGA CGGCAGAACTTT, reverse: GTGATGGTCTTTCCGGTC AAA3, probe: VIC-CAGAAGGAGTCTACGCTTCATTT GGTCTTGC-TAMRA; Agp12 (At3g13520) forward: TCT CCGCCGTAGGAAACGT, reverse: AGCATCGGAAGT AGGACTTGGA, probe: 6FAM-CTGCGCAGACAGAG GCTCCGG-TAMRA; Skb1 (At4g31120) forward: TGATACCTCAGAGGGACTGAATGAT, reverse: GCTTAC TGTCATGCTCACAAAGAAG, probe: 6FAM-CCTGGGA GCTGTGGAATTCGTTTCG-TAMRA; HsfA2 (At2g26150) forward: GGTGTGCTTGTAGCTGAGGTAGTTAG, reverse: TGCTCCATAGCTGCAACTTGA, probe: 6FAM-TTGAGGCAACAGCAACACAGCTCCA-TAMRA.
Real quantitative reverse transcription–polymerase chain reaction was performed as reported previously. Briefly, the thermal cycling program consisted of 20 s at 95°C, followed by 40 cycles of 3 s at 95°C, and 30 s at 59°C. Reactions were quantified by threshold cycle, Ct. Primers and probe sets were first subjected to validation experiments to test the efficiency of the target and reference amplifications. The Ct values for respective number of biological replicas of each experimental group (treated, control) were analyzed using 7500 Software v2.0.5 along with Microsoft Excel and the comparative CT(ΔΔCT) method. The ΔCt was calculated as the difference between the threshold cycle value of a target gene and that of Ubq11 (endogenous control) in the same sample, while ΔΔCt was calculated as the difference between the ΔCt value of a treated sample and that of the control (calibrator). The fold difference of the target gene expression in treated samples relative to control samples (calibrator) was calculated as 2^(–ΔΔCt) and then log2-transformed.
3. Results
Microarray gene expression data were analyzed using a two-part comparative approach. First, differentially expressed genes were identified between the two environments: spaceflight cells and comparable ground controls, which reflected the physiological adaptation to the spaceflight environment. Second, differentially expressed genes were identified between the two genotypes: WT and ARG1 KO cells, which provide a comparison of cell responses in spaceflight and on the ground. Figure 1A and 1B illustrates the matrix that was used to compare the two genotypes and two environmental conditions of this experiment: Ground Control WT (
3.1. The Arg1 expression across samples
The Arg1 transcript level in the ARG1 KO cells is substantially lower (6.4-fold) than in WT cells; however, this difference did not register as statistically significant. The average raw transcript of the Arg1 gene in the four biological replicates of the WT ground control cells is 307, whereas the average raw Arg1 transcript in the three biological replicas of the ARG1 KO ground control cells is 48. The value from the ARG1 KO cells was derived from three replicate values that were sufficiently dissimilar (80, 11, 53) as to be scored as not statistically valid.
There was virtually no difference in Arg1 transcript levels between the ground and the spaceflight samples in either WT cells or ARG1 KO cells. The average raw transcript level of Arg1 in the four biological replicas of the WT spaceflight cells was 313 compared to that expression in WT cells on the ground, 307 (Supplementary Fig. S1; Supplementary Data are available at
Although Arg1 transcription itself does not appear to be influenced by the spaceflight environment, the impact of removing a functional Arg1 gene has a dramatic effect on the expression patterns of many other genes (see following sections).
3.2. Differentially expressed genes in all four comparison groups
3.2.1. Alterations in the expression of 78 genes characterize the physiological adaptation of WT cells to spaceflight—FWt : GWt
The genes involved in physiological adaptation to the spaceflight environment were identified for WT cells by comparing the gene expression profiles in WT spaceflight cells (FWt) to WT ground control cells (GWt) in the FWt : GWt group comparison (Fig. 1B). In that comparison 78 genes were significantly differentially expressed between the two cell treatments at p value <0.01 and log2 Fold Change >1; 46 genes were upregulated, and 32 genes were downregulated (Fig. 2; Table S1 Gene list 78).

The number of the significantly differentially expressed genes identified in all comparison groups. The color code corresponds to the color of arrows in Fig.1: red represents the significantly differentially expressed genes of the physiological adaptation to the spaceflight environment, green represents significantly differentially expressed genes of the ground transcriptome, and blue represents significantly differentially expressed genes of the spaceflight transcriptome.
The functional annotation of the genes of the FWt : GWt group comparison indicated that genes of the endomembrane system, Golgi apparatus, and plant-type cell wall were highly represented in the WT adaptation to spaceflight. For instance, genes localized to Golgi apparatus were all upregulated in the WT spaceflight cells compared to the ground counterparts (e.g., At3g18260 Reticulon family protein; At1g77510 PDIL1-2 PDI-like 1-2 protein disulfide isomerase-like 1-2 localized to the endomembrane system; At4g07960 CSLC12 cellulose-synthase-like C12 and At2g03760 ST1 sulphotransferase 12; Table 1 GO 78; Table S1 Gene list 78). The defense response group was also highly represented among the Biological Process ontology (gProfiler, TAIR, AgriGO), with pathogen/cell wall–associated genes At3g43250, At2g44490 (PEN2), and At2g03760 (ST1) being upregulated.
The significant GO terms assigned with AgriGO and gProfiler to 78 genes of the physiological adaptation to the spaceflight environment in WT cells. Gene duplicates within oncology were removed and assigned to the most specific available GO term class.
3.2.2. Cells lacking functional Arg1 changed the expression of 130 genes to adapt to spaceflight, and those genes were fundamentally different than those of WT cells—FArg : GArg
The genes involved in physiological adaptation to the spaceflight environment were identified for ARG1 KO cells by comparing the gene expression profiles in ARG1 KO spaceflight cells (FArg) to ARG1 KO ground control cells (GArg) in the FArg : GArg group comparison of (Fig. 1B). There were 130 genes significantly differentially expressed between spaceflight and ground control at p value <0.01 and log2 Fold Change >1; 68 genes were upregulated, and 62 genes were downregulated (Fig. 2; Table S2 Gene list 130).
The functional annotation of the genes of the FArg : GArg group comparison indicated that physiological adaptation of the ARG1 KO cells relied on metabolic processes distinct from those used in WT cells. Genes of the cell periphery from the GO Cellular Components category, response to hormone and response to lipid, and xyloglucan metabolic process of the GO Biological Processes, and transporter activity from the GO Molecular Function categories, were highly represented among the genes ARG1 KO cells differentially expressed to adapt to spaceflight. For example, three genes of the cell wall–related xyloglucan metabolic processes (At1g68560 XYL1 alpha-xylosidase 1; At4g03210 XTH9 xyloglucan endotransglucosylase/hydrolase 9 and At2g06850 XTH4 xyloglucan endotransglucosylase/hydrolase 4) were substantially downregulated in spaceflight ARG1 KO cells (Table S2 Gene list 130; Table 2 GO 130), whereas cell wall–associated genes were upregulated in WT cells. Genes encoding cellular transporters were generally upregulated in ARG KO as compared to their ground counterparts' cells; examples include At1g80510 Transmembrane amino acid transporter family protein, At2g38330 MATE efflux family protein, At2g36830 TIP1;1 gamma tonoplast intrinsic protein, At1g63440 HMA5 heavy metal ATPase 5, At3g14770 SWEET2 Nodulin MtN3 family protein, At3g05030 NHX2 sodium hydrogen exchanger 2, and At1g72700, a E1-E2 type ATPase family.
The significant GO terms assigned with AgriGO and gProfiler to 130 genes of the physiological adaptation to the spaceflight environment in ARG1 KO cells. Gene duplicates within oncology were removed and assigned to the most specific available GO term class.
3.2.3 Comparison of the gene expression profiles between the ARG1 KO and WT cells shows unique genotype-specific expression patterns—GArg : GWt
Comparisons between ARG1 KO and WT transcriptomes within each environment show unique genotype-specific expression patterns. The genes differentially expressed in the ground transcriptomes between ARG1 KO cells and WT cells were identified by comparing the gene expression profiles in ARG1 KO ground cells (GArg) to WT ground control cells (GWt) in the GArg : GWt group comparison of Fig. 1B. The 90 genes were differentially expressed due to the Arg1 mutation on the ground with approximately as many genes upregulated (39) as downregulated (51) (Fig. 2; Table S3 Gene list 90).
Many genes with adjusted expression to the Arg1 mutation on the ground classified as plasma membrane, membrane, and cell periphery Cellular Component ontology (gProfiler). For instance, genes At2g44490 PEN2 Glycosyl hydrolase superfamily protein localized to the membrane and participating in the defense response and At4g40070 RING/U-box superfamily protein localized to the extracellular region were upregulated. On the other hand, genes At4g30660 Low temperature and salt responsive, At2g36830 TIP1;1 gamma tonoplast intrinsic protein, At3g26830 PAD3 PHYTOALEXIN DEFICIENT 3 had substantially diminished expression level in ARG1 KO cells on the ground than WT cells (Table 3 GO 90; Table S3 Gene list 90). The heterocycle metabolic process and organelle organization were among the Biological Process ontology terms represented by genes affected by Arg1 mutation on the ground. For instance, genes At5g39500 GNL1 GNOM-like 1 participating in the ER body organization, endocytosis and the retrograde vesicle-mediated transport, Golgi to ER, chromosome maintenance genes At4g02060 PRL Minichromosome maintenance (MCM2/3/5) family protein, and At5g48600 SMC3 structural maintenance of chromosome 3 had diminished expression on the ground in ARG1 KO cells relative to WT cells.
The significant GO terms assigned with AgriGO and gProfiler to 90 genes differentially expressed in the ground transcriptome between WT and ARG1 KO cells. Gene duplicates within oncology were removed and assigned to the most specific available GO term class.
3.2.4. Comparison of the gene expression profiles between ARG1 KO and WT genotypes during spaceflight shows unique genotype-specific expression patterns—FArg : FWt
The genes differentially expressed between ARG1 KO cells and WT cells in the spaceflight environment were identified by comparing the gene expression profiles in ARG1 KO spaceflight cells (FArg) to WT spaceflight cells (FWt) in the FArg : FWt group comparison (Fig. 1B). There were 107 genes significantly differentially expressed between ARG1 KO and WT cell samples in spaceflight (Fig. 2). Nearly half the genes were upregulated in ARG1 KO cells in spaceflight and half downregulated as compared to WT cells in spaceflight (Table S4 Gene list 107).
Many genes differentially expressed between the WT and ARG1 KO cells in spaceflight were classified in GO Biological Processes ontology (gProfiler, AgriGO) as transport and establishment of localization, developmental, and xyloglucan metabolic processes (Table 4 GO 107; Table S4 Gene list 107). Interestingly, the genes related to transport processes (At4g37640 ACA2 calcium ATPase 2, At2g01980 SOS1 sodium proton exchanger, At5g49500 SRP54 Signal recognition particle, At5g03280 PIR2 NRAMP metal ion transporter, At4g35410 Clathrin adaptor complex, At2g26900 BASS2 Sodium Bile acid symporter, and At1g22710 SUT1 sucrose-proton symporter 2) all showed much reduced expression in spaceflight in ARG1 KO cells as compared to WT cells. Similarly, all four genes associated with the xyloglucan metabolic process (At1g68560 XYL1 alpha-xylosidase 1, At4g03210 XTH9 xyloglucan endotransglucosylase/hydrolase 9, At1g11545 XTH8, and At2g06850 XTH4) were also significantly diminished in the spaceflight ARG1 KO cells compared to the spaceflight WT cells. Finally, 14 genes out of 15 representing the transporter activity term of the Molecular Function ontology were also under-expressed in ARG1 KO spaceflight cells as compared to WT spaceflight cells (Table S4 Gene list 107).
The significant GO terms assigned with AgriGO and gProfiler to 107 genes differentially expressed in the spaceflight transcriptome between WT and ARG1 KO cells. Gene duplicates within oncology were removed and assigned to the most specific available GO term class.
3.3. Physiological adaptation to spaceflight of ARG1 KO cells is fundamentally different from WT cells—comparing FWt : GWt to FArg : GArg
Most of the genes engaged in the physiological adaptation to spaceflight in ARG1 KO cells were fundamentally different than those engaged in WT cells. When the 130 genes differentially expressed in the FArg : GArg group comparison were compared to the 78 genes differentially expressed in the FWt : GWt group comparison, only three genes changed in the exact same way: At3g08590 putative 2,3-bisphosphoglycerate-independent phosphoglycerate mutase, At3g30843 hypothetical protein, and At5g56270 transcription factor WRKY2 (Fig. 2, Table S1 Gene list 78 and Table S2 Gene list 130). These three genes, therefore, constitute the only genes of the WT response that are totally independent of ARG1 function. The remaining 127 genes of the ARG1 adaptation to the spaceflight environment constitute an adaptation unique to the ARG1 KO genotype.
3.4. The gene expression patterns on the ground play a fundamental role in the gene expression patterns of spaceflight—comparing GArg : GWt
The information about the expression pattern of the 90 genes differentially expressed on the ground between the WT and ARG1 KO cells, GArg : GWt, was assessed in all other comparison groups: the physiological adaptation to spaceflight in WT cells, FWt : GWt, the physiological adaptation to spaceflight in ARG1 KO cells, FArg : GArg, and between genotypes in spaceflight, FArg : FWt (Fig. 3).
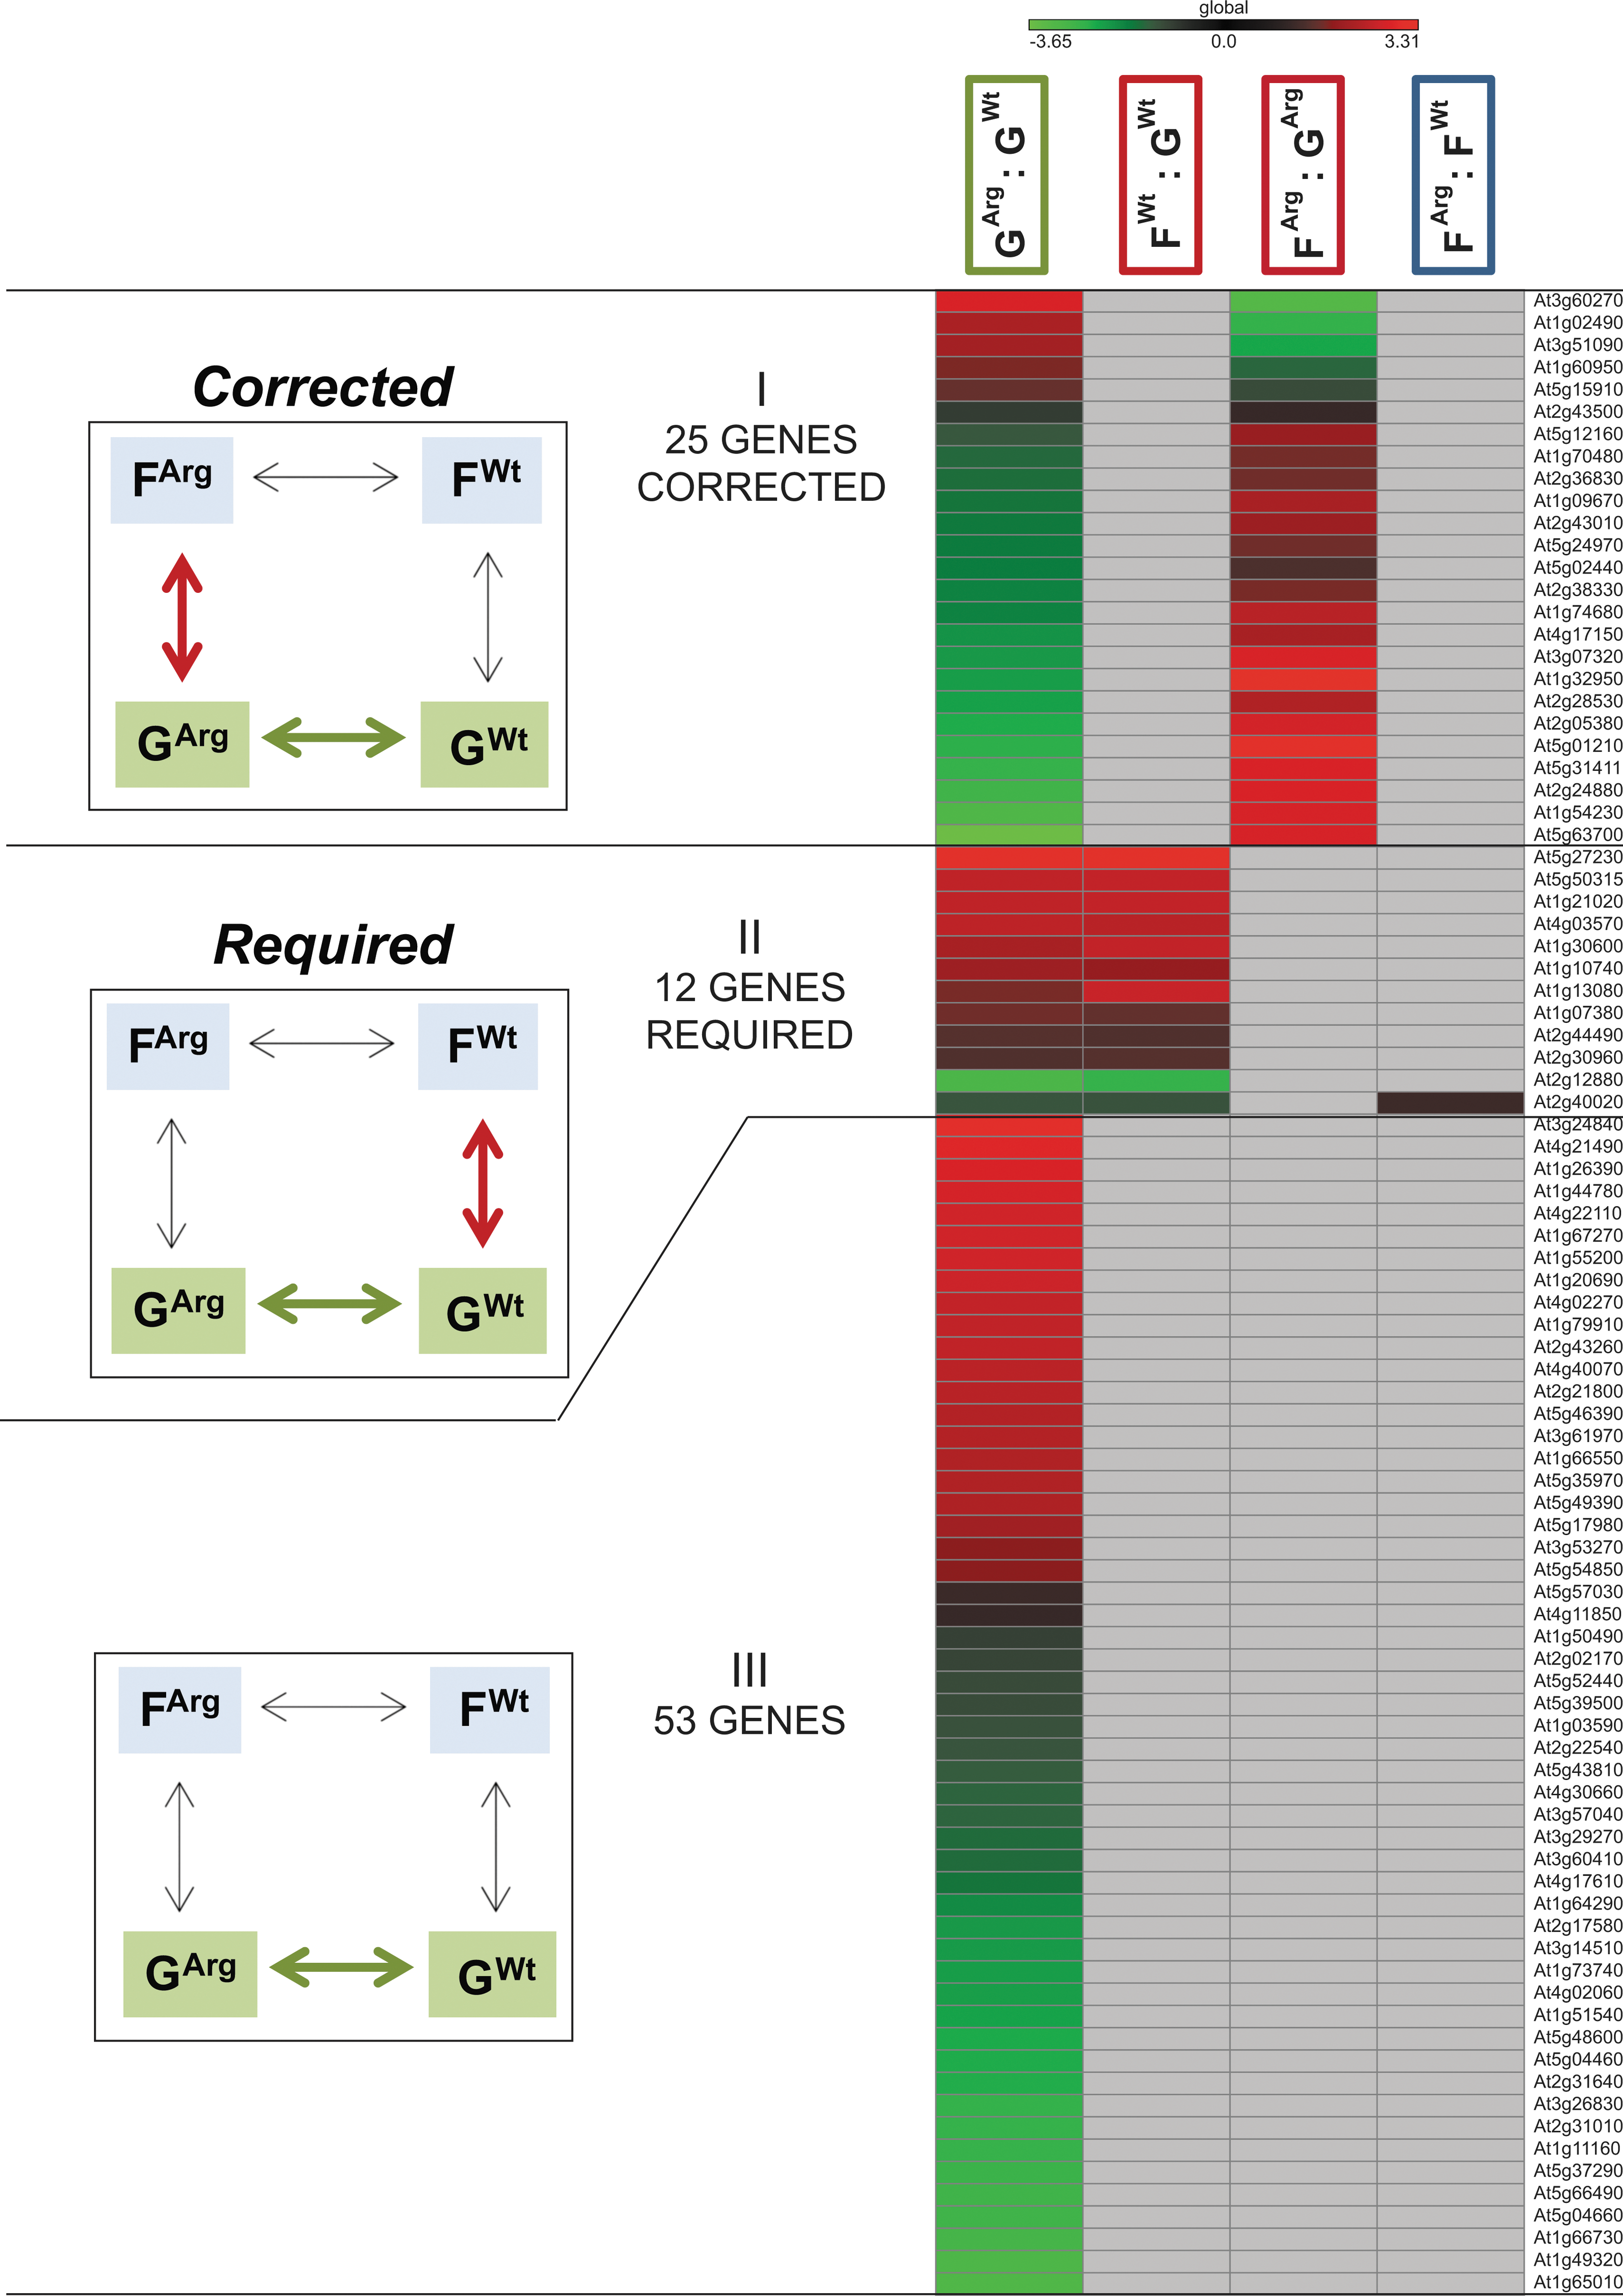
Heat map visualizing the expression patterns of the 90 differentially expressed genes in the ground transcriptome between the WT and ARG1 KO cells (GArg : GWt) as arranged into Categories I–III by the expression profiles in four comparison groups (GArg : GWt, FWt : GWt, FArg : GArg, FArg : FWt).
The 25 genes of the 90 (GArg : GWt) showed significantly differential expression in the physiological adaptation to spaceflight in ARG1 KO cells, FArg : GArg, but no significant differential expression in WT cells, FWt : GWt (Fig. 3, Category I). Thus the ARG1 KO cells corrected the expression of those genes as they adapted to spaceflight, apparently to reestablish the WT level of expression that is needed in that environment. These genes included, for example, At1g32950 (Subtilase genes commonly associated with plant defense and cell wall metabolism) and At2g36830 (TIP1;1 gamma tonoplast intrinsic protein) (Table 5 GO Fig. 3; Table S5 Gene list Fig. 3).
The significant GO terms assigned with AgriGO and gProfiler to
The 12 genes out of 90 (GArg : GWt) showed significant differential expression in the physiological adaptation to spaceflight in WT cells (FWt : GWt) but no significant expression in the physiological adaptation to spaceflight in ARG1 KO cells (FArg : GArg) (Fig. 3, Category II). This genotype-based change in the ARG1 KO ground control cells resulted in the expression levels of these genes on the ground matching the WT expression levels in spaceflight. There was a single gene (At2g40020, hypothetical histone-lysine N-methyltransferase protein) among these 12 with an unusual behavior, as it was also differentially expressed in spaceflight between the two genotypes. However all 12 genes were considered to be expressed in the ARG1 KO on the ground at the level required for the WT physiological adaptation to spaceflight.
These genes included genes associated with the extracellular region (e.g., At1g30600 Subtilase family protein; At1g10740 lipase; At1g13080 CYP71B2 cytochrome P450; At1g07380 ceramidase activity; At2g44490 PEN2 Glycosyl hydrolase superfamily protein associated with plant defense and cell wall metabolism; Table 5 GO Fig. 3; Table S5 Gene list Fig. 3).
The 53 genes out of 90 (GArg : GWt) showed no differential expression in any other comparison group (Fig. 3, Category III). Thus, although the gene expression patterns between genotypes on the ground were different, both cell lines likely made only small adjustments to gene expression, which resulted in no change in expression levels when the two genotypes from spaceflight were compared. Some of these genes represented plasma membrane and membrane related processes: At4g11850 PLDGAMMA1 phospholipase D gamma, At2g02170 Remorin family protein, At5g52440 HCF106 Bacterial sec-independent translocation protein mttA/Hcf1061 importing protein into chloroplast thylakoid membrane, At5g39500 GNL1 GNOM-like 1 participating in the ER body organization, endocytosis and the retrograde vesicle-mediated transport, Golgi to ER (Table 5 GO Fig. 3; Table S5 Gene list Fig. 3).
With the exception of At2g40020, none of the 90 genes that were differentially expressed between genotypes on the ground (GArg : GWt) showed differential expression between genotypes in the spaceflight environment (FArg : FWt).
3.5. Corrected and compensated expression
3.5.1. Corrected expression: the patterns of the genes associated with spaceflight physiological adaptation affected by Arg1 mutation—comparing FArg : GArg, FWt : GWt, and FArg : FWt
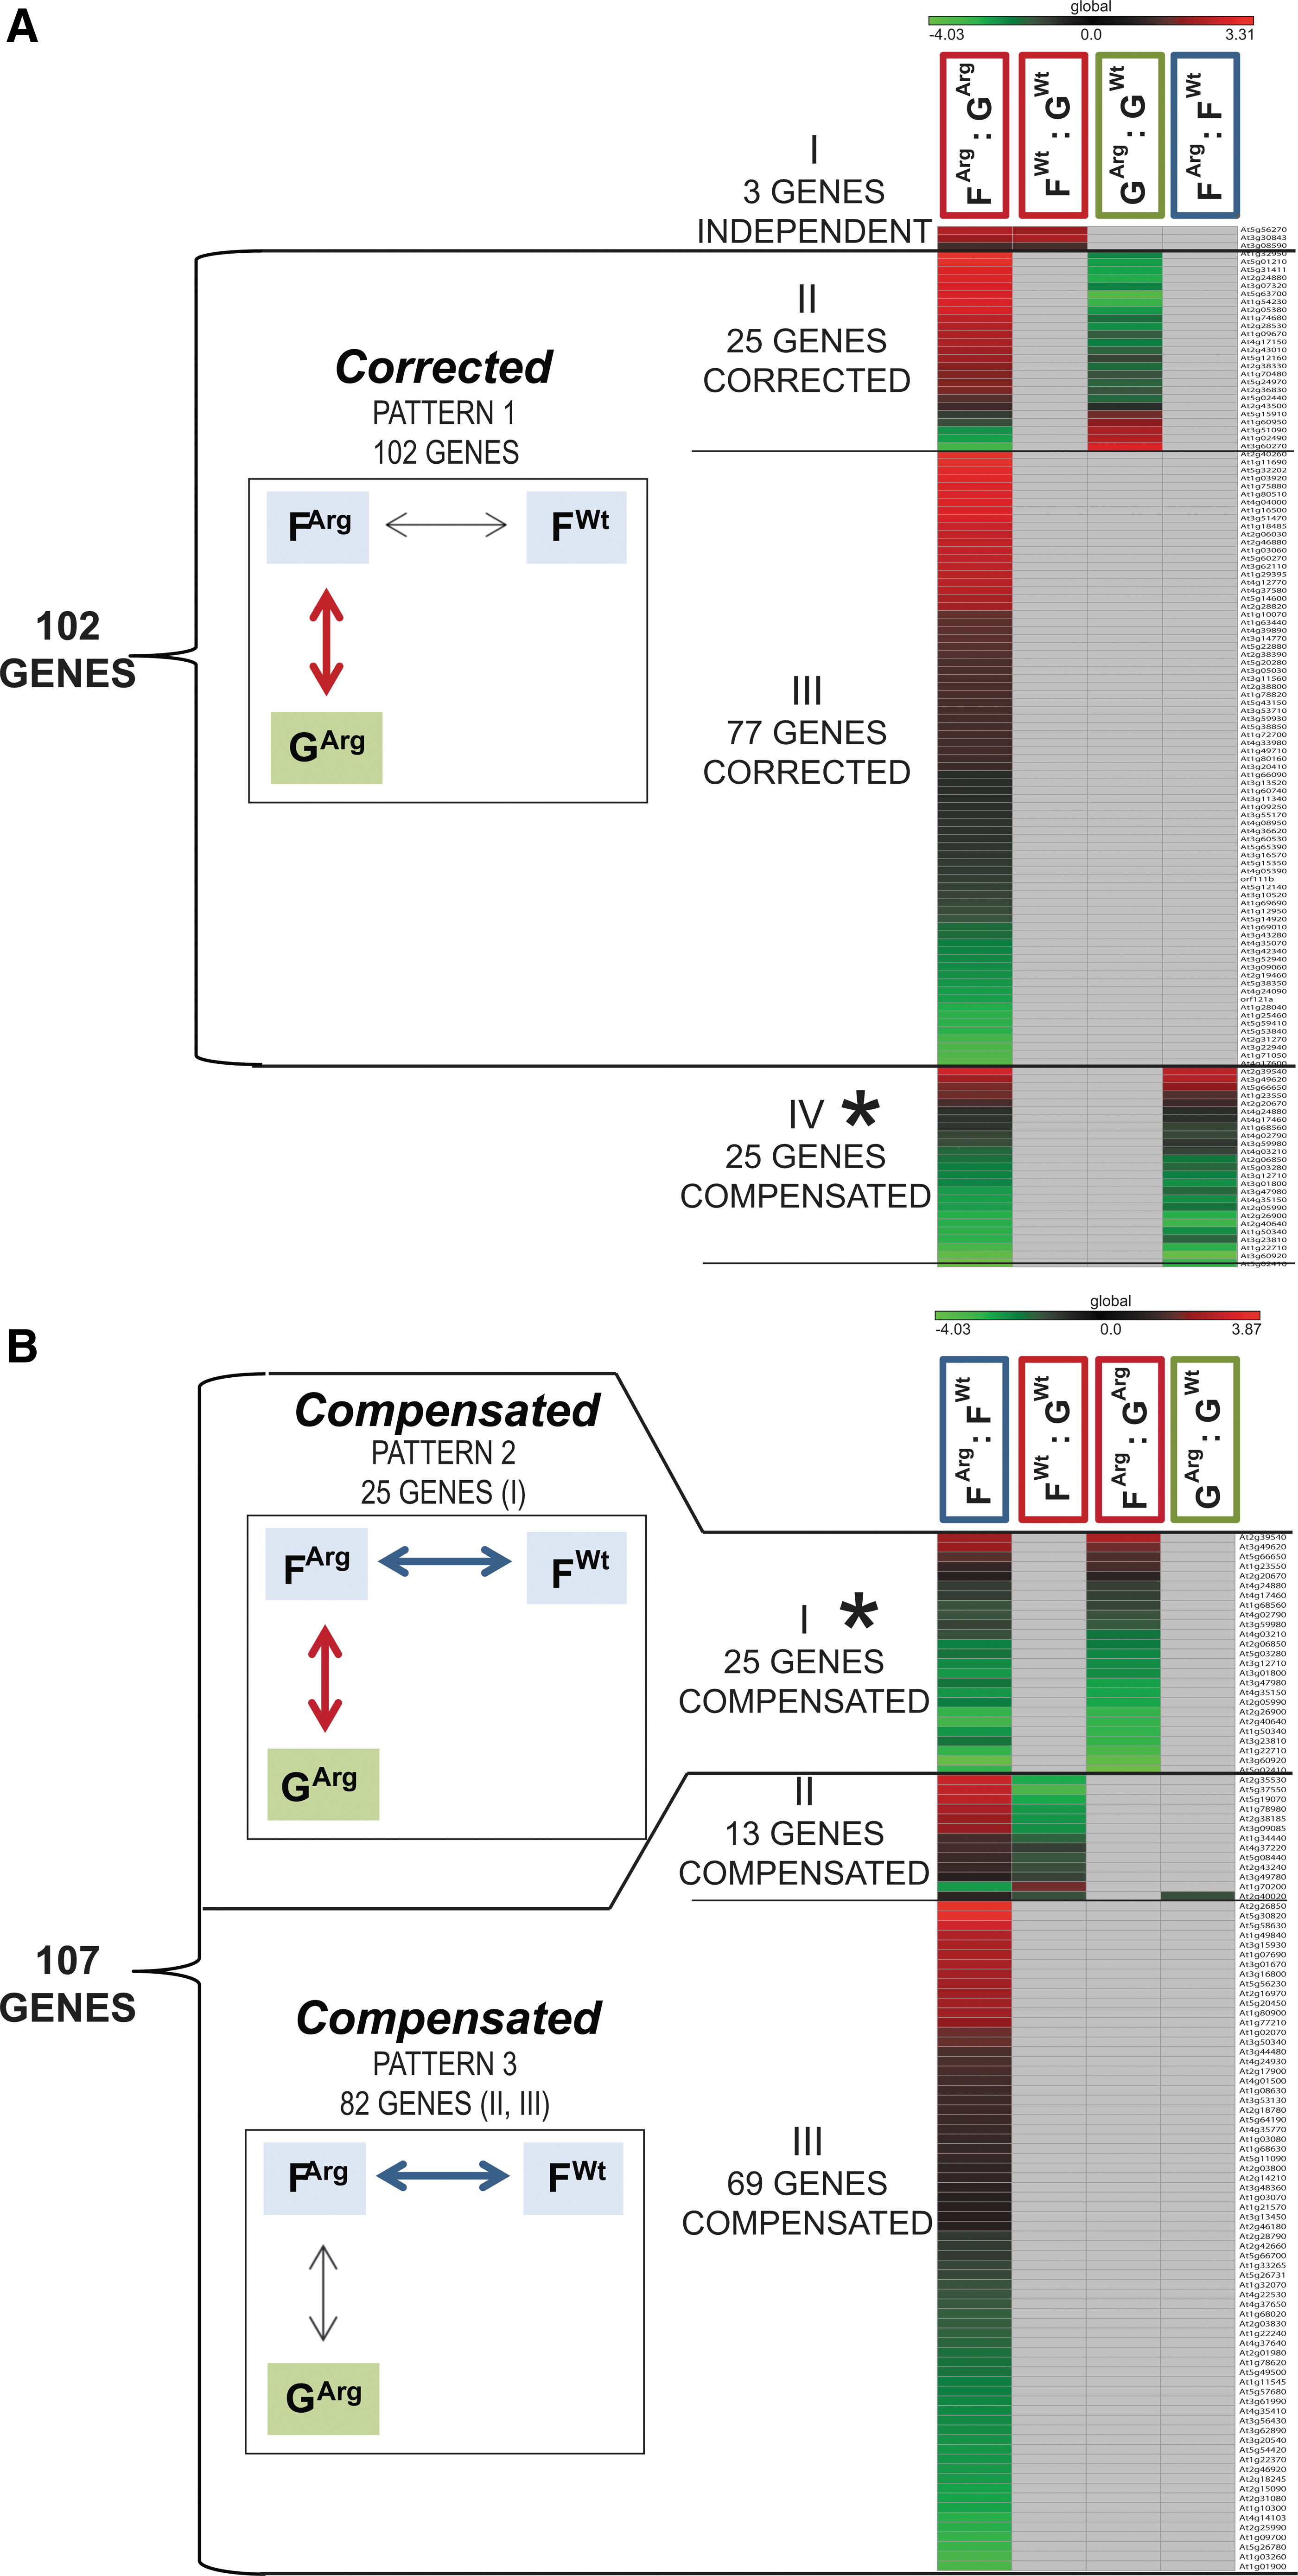
Information about the differential expression of the 130 genes differentially expressed in the physiological adaptation to spaceflight in ARG1 KO cells (FArg : GArg) was assessed in the physiological adaptation to spaceflight of WT cells (FWt : GWt) group comparison and in the spaceflight genotype comparison group (FArg : FWt; Table S6 Gene list 102 CORRECTED Fig. 4A). Each of the 130 genes was significantly differentially expressed in the physiological adaptation to spaceflight in ARG1 KO cells, FArg : GArg and could be also significantly differentially expressed in other comparison groups.
There were three genes out of 130 (FArg : GArg) that showed significant differential expression in the physiological adaptation to spaceflight of WT cells (FWt : GWt) group comparison and no differential expression in the spaceflight genotype comparison group (FArg : FWt; Fig. 4, Category I).
(
There were 102 genes out of 130 (FArg : GArg) that showed no significantly differential expression in the physiological adaptation to spaceflight of WT cells, FWt : GWt group comparison and no differential expression in the spaceflight genotype comparison group FArg : FWt (Fig. 4, Category II). Thus, these 102 genes are potentially genes whose expression needs correction from the ground genotype of ARG1 KO so as to be returned to a necessary expression level for spaceflight adaptation.
These 102 genes represented genes typically associated with the cell periphery, endomembrane system and Golgi apparatus, plastid and chloroplast of the Cellular Component as well as the single-organism localization and transport and signaling of the Biological Process ontology terms. Particularly genes of the transmembrane transport of various moieties were highly represented (e.g., AT1G80510 Transmembrane amino acid transporter family protein, AT2G38330 MATE efflux family protein, AT2G36830 TIP1;1 gamma tonoplast intrinsic protein, AT5G20280 SPSA1 sucrose phosphate synthase 1F, AT3G05030 NHX2 sodium hydrogen exchanger 2, and AT1G71050 HIPP20 Heavy metal transport/detoxification superfamily protein) (Table 6 GO Fig. 4A; Table S6 Gene list 102 CORRECTED Fig. 4A). Genes associated with cell signaling were also found among these 102 genes (AT1G03060 SPI Beige/BEACH domain; WD domain, G-beta repeat protein, AT2G43010 SRL2 phytochrome interacting factor 4, AT3G20410 CPK9 calmodulin-domain protein kinase 9, AT3G16570 RALF23 rapid alkalinization factor 23).
The significant GO terms assigned with AgriGO and gProfiler to 102
There were 25 genes out of 130 (FArg : GArg) that showed no significant differential expression in the physiological adaptation to spaceflight of WT cells (FWt : GWt) group comparison and significant differential expression in the spaceflight genotype comparison group (FArg : FWt) (Fig. 4 Category III). Thus, these 25 genes are potentially genes of the genotype-specific strategy to adapt to the spaceflight. Some of these genes encoded genes represented in the xyloglucan metabolic processes related to the cell wall remodeling: AT1G68560 XYL1 alpha-xylosidase 1, AT4G03210 XTH9 xyloglucan endotransglucosylase/hydrolase 9, AT2G06850 XTH4 xyloglucan endotransglucosylase/hydrolase 4 (Table 7 GO Fig. 4B; Table S6 Gene list 102 CORRECTED Fig. 4A).
The significant GO terms assigned with AgriGO and gProfiler to 107
3.5.2. Compensated adaptation, revealing adaptive strategies to spaceflight—comparing FArg : FWt, FWt : GWt, and FArg : GArg
The information about the differential expression of the 107 genes differentially expressed in the spaceflight genotype comparison group (FArg : FWt) was assessed in the physiological adaptation to spaceflight of WT cells (FWt : GWt) group comparison and in the physiological adaptation to spaceflight in ARG1 KO cells FArg : GArg (Fig. 4B; Table S7 Gene list 107 COMPENSATED Fig. 4B). Each of the 107 genes was significantly differentially expressed in the spaceflight genotype comparison group FArg : FWt and could be also significantly differentially expressed in other comparison group, but this was not a required feature of the categorical response.
There were 25 genes of 107 (FArg : FWt) that showed significant differential expression in physiological adaptation to spaceflight in the ARG1 KO cells FArg : GArg group comparison (Fig. 4A Category IV and Fig. 4B Category I).
There were 82 genes of 107 (FArg : FWt) that showed no significantly differential expression in the physiological adaptation to spaceflight in the ARG1 KO cells FArg : GArg (Fig. 4B Category II and III).
Some of these 82 genes were associated with components of the extracellular region, cell wall, external encapsulating structure, cell periphery, plasma membrane, endomembrane system, endoplasmic reticulum, Golgi apparatus of the Cellular Compartment ontology terms (gProfiler). Also, cellular aromatic compound metabolic process, localization, and transmembrane transport were represented among the Biological Process ontology terms. Two genes represented the cellular aromatic compound metabolic process (At4g37650 SHR GRAS family transcription factor and At3g20540 PolIB polymerase gamma 1). Genes involved in sugar transport (e.g., At1g77210 STP14 sugar transporter 14 and At2g43240 Nucleotide-sugar transporter family protein) and genes involved in vesicle-mediated transport (e.g., At5g56230 PRA1.G2 prenylated RAB acceptor 1.G2 and At4g35410 Clathrin adaptor complex small-chain family protein) were representative of other transport processes (Table 7 GO Fig. 4B; Table S7 Gene list 107 COMPENSATED Fig. 4B).
With the exception of At2g40020 mentioned above, none of the 107 genes that were significantly differentially expressed in the spaceflight genotype comparison group FArg : FWt showed significant differential expression in the ground genotype comparison group GArg : GWt (Fig. 4B).
3.5.3. The Arg1-dependent genes in the WT adaptive strategy—comparing FWt : GWt and FArg : GArg
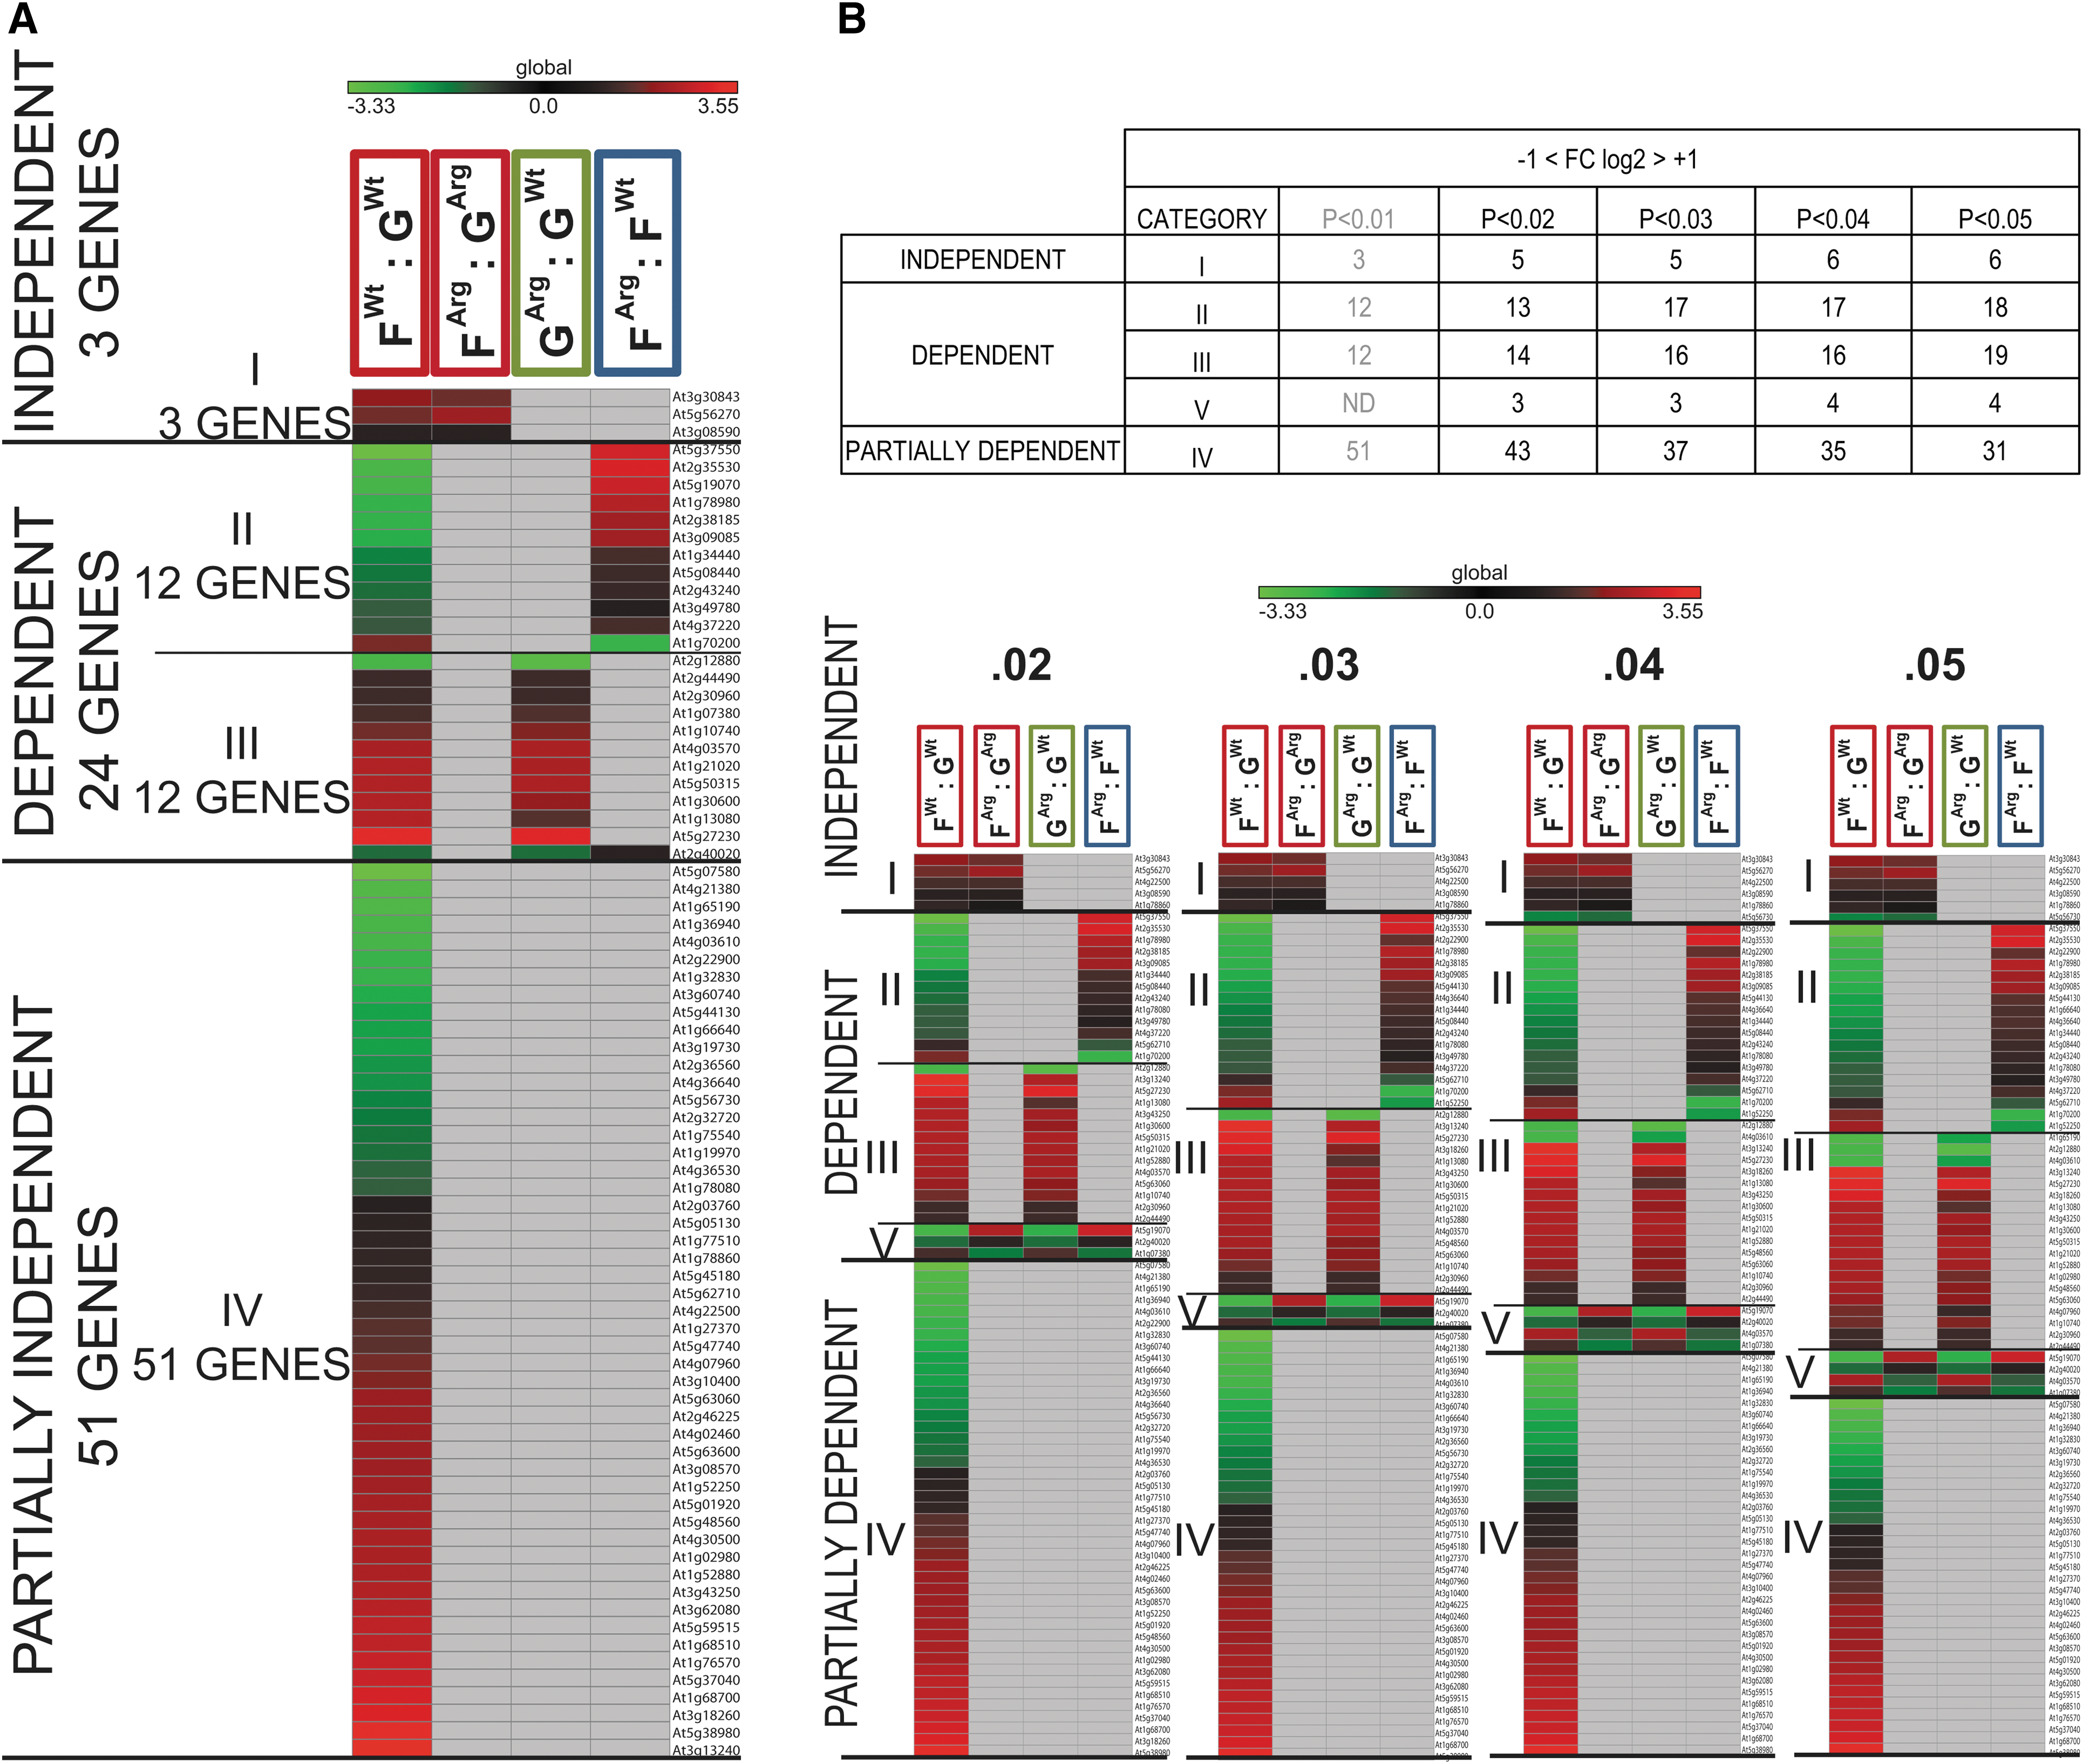
The 78 genes significantly differentially expressed between the ground and spaceflight in WT cells established the base of genes needed to adapt to spaceflight. Each gene of 78 FWt : GWt was categorized into Arg1-independent, Arg1-dependent, or partially Arg1-dependent.
A gene was considered Arg1 independent if it showed the same expression behavior during the physiological adaptation to the spaceflight environment in both WT and ARG1 KO cells; thus the same change in gene expression was observed in FWt : GWt and FArg : GArg (Fig. 5A). The expression of such a gene was adapted to the spaceflight environment in the same fashion regardless of the Arg1 mutation. There were three genes where Arg1 seemed to have no role in the physiological adaptation (Fig. 5A Category I; Table S8 Gene list 78 DEPENDENCE Fig. 5).
(
A gene was considered Arg1 dependent if it did not show the same expression behavior during the physiological adaptation to the spaceflight environment in ARG1 KO cells, FArg : GArg, as it did in WT cells FWt : GWt (Fig. 5A). There were 24 genes exhibiting the Arg1 dependence (Fig. 5A Categories II, III, Table S8 Gene list 78 DEPENDENCE Fig. 5).
These 24 Arg1-dependent genes could be divided into two categories based on the source of the Arg1 dependency: Category II or III of Fig. 5A. Category II genes of Fig. 5A were not differentially expressed in either the physiological adaptation to spaceflight in ARG1 KO cells (FArg : GArg) or ground genotype comparison (GArg : GWt), but showed differential expression in the spaceflight genotype comparison (FArg : FWt). Thus, the absence of a functional Arg1 gene had the impact of rendering the adaptive-to-spaceflight genes unresponsive (Fig. 5A, Category II). The majority of those genes were associated with the endomembrane system and Golgi apparatus or the intracellular membrane-bounded organelle and cell periphery and plasma membrane GO terms of the Cellular Component ontology (e.g., At3g49780, PSK4 phytosulfokine 4 precursor and At2g43240, Nucleotide-sugar transporter family protein) (Table 8 GO DEPENDENCE Fig. 5A; Table S8 Gene list 78 DEPENDENCE Fig. 5). Category III genes of Fig. 5A were not differentially expressed in the physiological adaptation to spaceflight in ARG1 KO cells (FArg : GArg), were differentially expressed in ground genotype comparison (GArg: GWt), but showed no differential expression in spaceflight genotype comparison (FArg : FWt). These genes were already altered on the ground in ARG1 KO cells to match the spaceflight expression levels in WT (Fig. 5A, Category III). There were 12 genes showing such an expression pattern, some of which were associated with plant defense and cell wall metabolism (e.g., At1g30600, Subtilase family protein; At1g10740 alpha/beta-Hydrolases superfamily protein and At2g44490, PEN2 Glycosyl hydrolase superfamily protein) (Table 8 GO DEPENDENCE Fig. 5A; Table S8 Gene list 78 DEPENDENCE Fig. 5).

The significant GO terms assigned to the genes in
There were 51 differentially expressed genes in FWt : GWt that were not significantly differentially expressed in any other comparison group (Fig. 5A, Category IV). These genes were considered Arg1 Partially Dependent as there was not enough statistical support to assign them to either the independent or dependent group. These 51 genes were primarily associated with the GO Biological Process of response to stimulus, with few related to the response to light (e.g., At3g08570 Phototropic-responsive NPH3 family protein, At5g63600 FLS5 flavonol synthase 5, At1g76570 Chlorophyll A-B binding family protein or to high light stimulus At1g77510 PDIL1-2 PDI-like 1-2) (Table 8 GO DEPENDENCE Fig. 5A; Table S8 Gene list 78 DEPENDENCE Fig. 5).
The distribution of 78 genes significantly differentially expressed between the ground and spaceflight in WT cells (FWt : GWt) among the Independent, Dependent, and Partially Dependent was established with increasingly relaxed p value stringency criteria from p value <0.01 through p value <0.05 without changing the stringency of the Fold Change criteria (−1< FC log2 >+1) (Fig. 5B). The number of Independent genes increased from three through five up to six genes. The Dependent genes not only increased in total numbers, but a new group of Dependent genes emerged. The three to four genes showed the new expression pattern such that they were coordinately differentially expressed in WT spaceflight adaptation (FWt : GWt) and in the ground genotype comparison between WT and ARG1 KO cells (GArg : GWt) yet the opposite in the ARG1 KO spaceflight adaptation (FArg : GArg) and in the spaceflight genotype comparison between the WT and ARG1 KO cells (FArg : FWt) (Fig. 5B Category V). The biggest depletion of gene total number was in the Partially Dependent gene pool, from 51 genes at the p value <0.01, through 43, 37, 35, and 31 at the p value <0.05 (Fig. 5B Category IV).
3.6. The microarray data validation
To validate the correctness of the significance criteria applied in the microarray data analysis, the RT-qPCR was performed. For objectiveness, the target genes were selected from among the significantly differentially expressed genes in the WT spaceflight cells of the BRIC-16 experiment (Paul et al., 2012). The RT-qPCR results aligned with those of the microarray (Supplementary Fig. S2). Only one gene, the Agp12, showed significant under-expression in the spaceflight ARG1 KO cells relative to their ground control counterparts as identified in the microarray data analysis and as measured by the RT-qPCR method. The Agp12 gene target in all other comparison groups as well as the remaining targets across all comparison groups showed no differential expression levels as measured by the means of microarrays or RT-qPCR. The significance stringency criteria applied throughout the microarray analysis seemingly prevent the false-positive or false-negative inclusion.
4. Discussion
The gene Arg1 was found to have a dramatic influence on the gene expression profiles that define physiological adaptation of cell cultures to spaceflight. Like WT cells, the ARG1 KO cells thrived in the spaceflight environment, suggesting that the presence of ARG1 is not absolutely required for physiological adaptation to spaceflight. However, the ARG1 has an essential role in defining the WT adaptation to spaceflight. ARG1 KO cells adapted to spaceflight by expressing different genes, providing unique insight into the alternative pathways for physiological adaptation of undifferentiated cells to the spaceflight.
4.1. WT adaptation to spaceflight is highly dependent upon Arg1
There were 78 genes differentially expressed in WT when comparing spaceflight to ground control. Those 78 genes comprise the obvious primary set of genes involved in spaceflight physiological adaptation of WT cells. Only three of these 78 genes were similarly changed in ARG1 KO cells, suggesting that only these three were completely independent of Arg1 (See
4.2 Without functional Arg1, cells engage a unique gene expression strategy that further illuminates required elements of the WT spaceflight adaptation
ARG1 KO cells engaged vastly different genes to adapt to spaceflight than did WT cells, suggesting that not only is Arg1 function required for much of the WT adaptation to spaceflight, but also that cells without Arg1 can compensate for the lack of Arg1 by changing the expression of a different set of genes. This suggests that the genotype, and likely then physiological state, of the cell line on the ground profoundly affects the genes engaged in the physiological adaptation to the spaceflight environment.
The gene expression profiles seen in the ground genotype comparisons suggested that WT and ARG1 KO cells have different gene expression requirements for the maintenance of a healthy physiology in a normal terrestrial environment.
The basis for engaging very different genes in the physiological adaptation to spaceflight in the ARG1 KO can be explained along two lines of reasoning. First, some genes involved in WT adaptation to spaceflight were already changed to a spaceflight-adapted level in ARG1 KO on the ground and were therefore not needed to be differentially expressed as the ARG1 KO adapted to spaceflight (Fig. 3 Category II, 12 genes). These genes are
An additional set of
Some of the genes that showed differential expression in ARG1 KO cells in spaceflight adaptation were also differentially expressed between ARG1 KO and WT cells in spaceflight. These 25 genes apparently
4.3. The landscape of genes required for physiological adaptation to spaceflight
The landscape of the genetic requirements for spaceflight adaptation is much more complex than is revealed by the genes that are changed in expression in WT cells adapted to spaceflight. The complexity of the physiological adaptive processes related to genotype is represented in the Venn diagram of Fig. 6. In the WT response 78 genes are changed in expression, leading to the conclusion that these are the genes necessary for adaptation. ARG1 KO data suggest that this is an overly simple view of the adaptation requirements of WT cells. ARG1-mutant cells show that many genes whose expression is altered on the ground by that genotype must be corrected to WT levels to adapt to spaceflight.

The gene landscape for physiological adaptation to spaceflight. At least
These observations suggest that adaptation of a cell line to spaceflight is highly dependent on its physiological state, which is in turn guided by its genotype. The two cell lines in this study arrived at a different gene expression profile on orbit and changed expression of a different set of genes to get to that profile. Therefore, it is likely that there is no single gene expression profile that defines the spaceflight-adapted state for Arabidopsis cells. Rather each cell type and genotype will have a largely unique-appearing change in gene expression profiles in adapting to spaceflight.
4.4. Biological implications of the gene expression profiles
The agriGO PAGE tool (
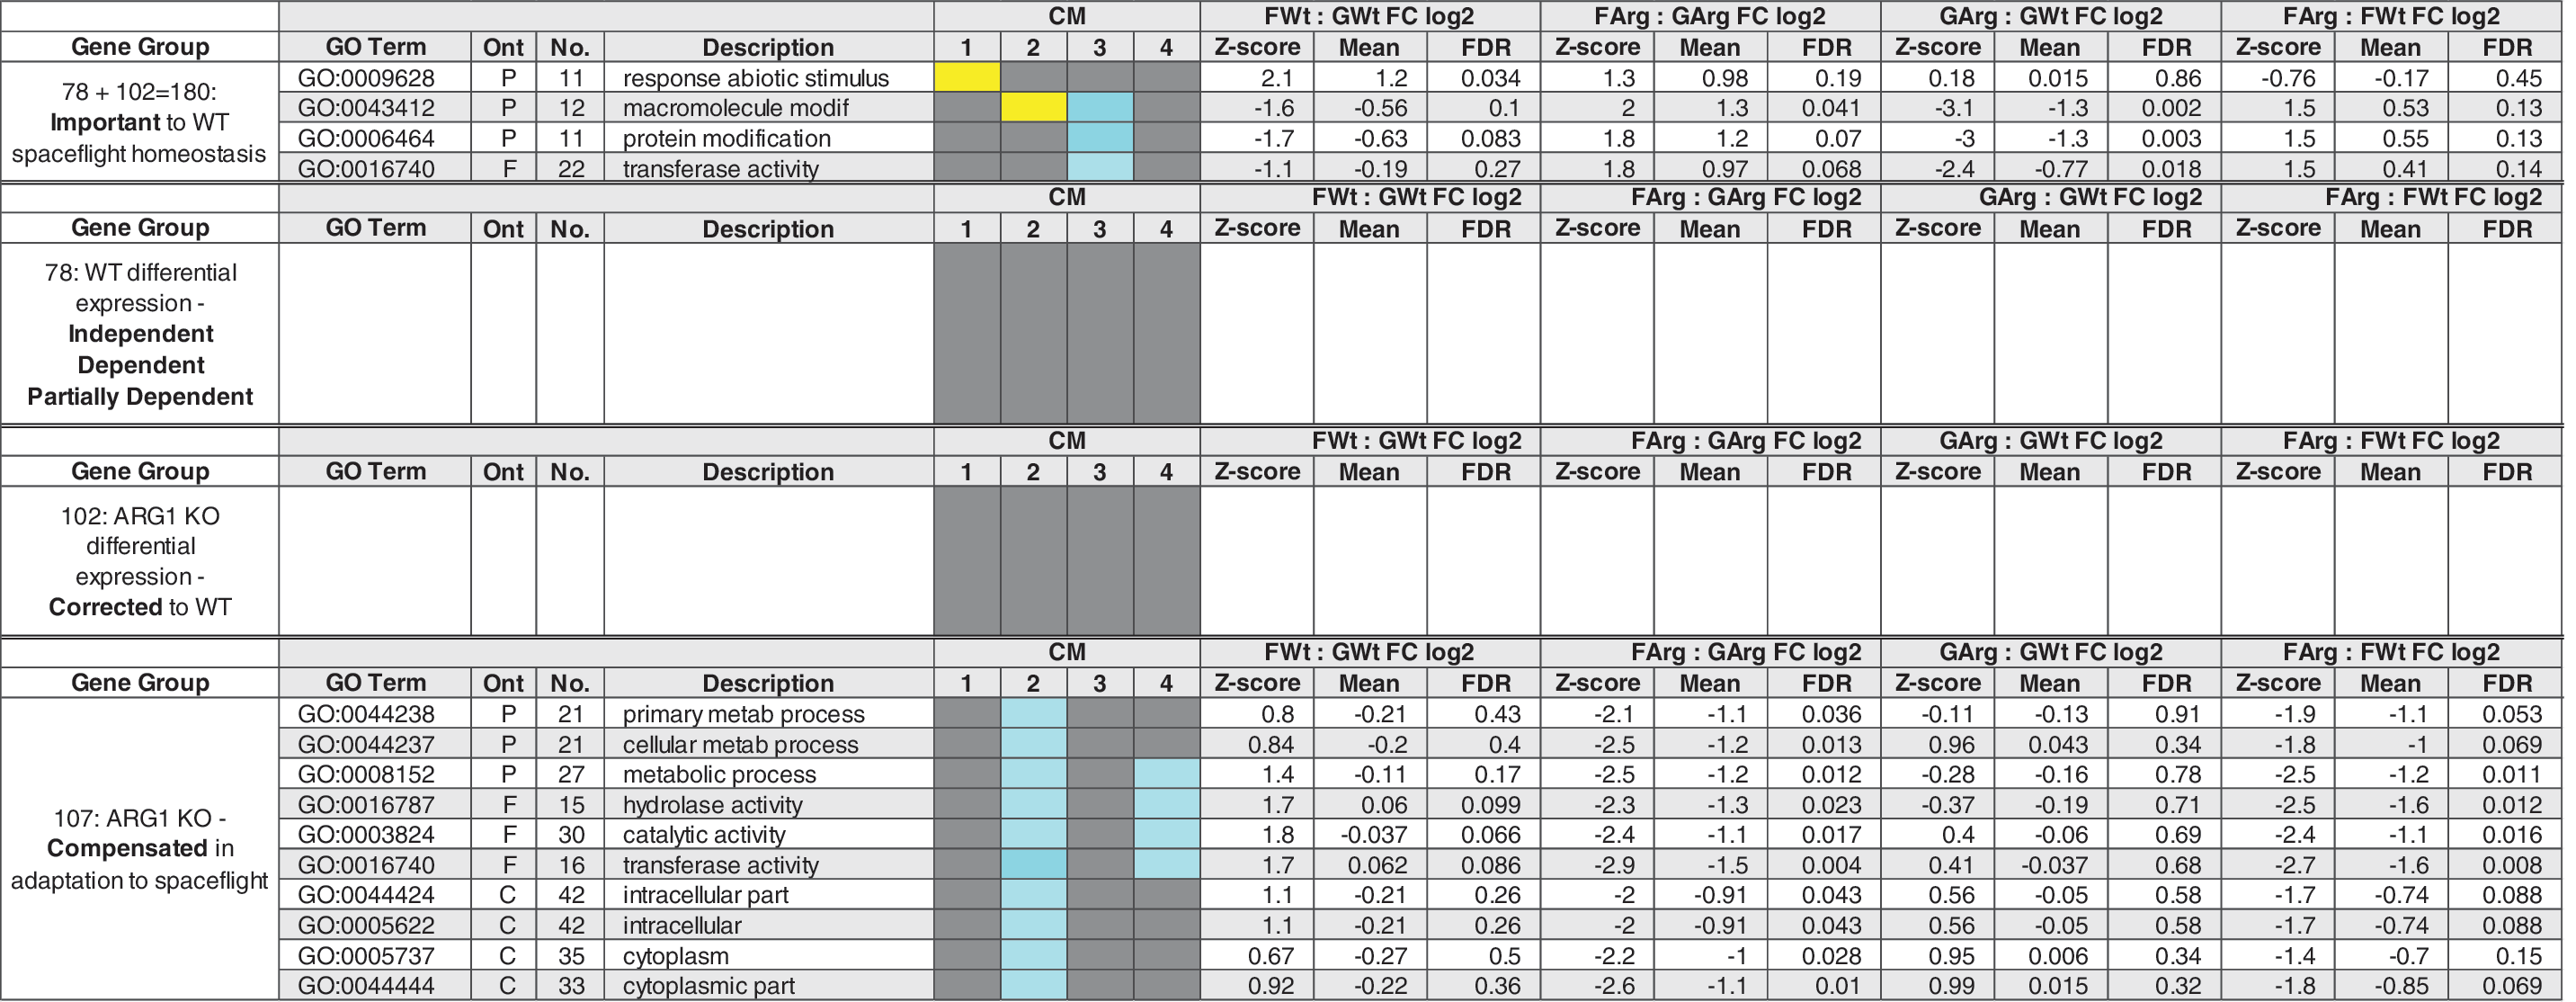
Functional category comparisons among the differentially regulated genes in the four transcriptome comparisons using Parametric Analysis of Gene Expression.
The PAGE analysis revealed that although individual genes may differ in each expression set, those genes are largely representative of the same biological processes, suggesting different paths can be taken to arrive at the same destination. For instance, processing all 180
4.4.1. Independent genes
The genes of this small category are tied together by potential roles in the detection and maintenance of cell polarity. The most highly induced of the Independent genes is a WRKY2 (At5g56270) transcription factor known to play a major role in the establishment of cell polarity by regulating apical/basal cell fate by activating WOX8 (Jeong et al., 2016). Cell polarity is also tied to auxin transport (Gao et al., 2008), and if the p value is relaxed to a value <0.05 (see Fig. 5B), two of the three additional genes that become included are associated with auxin/brassinosteroid signaling pathways: At1g78860, a curculin-like family protein, and At4g22500, an auxin-induced gene of unknown function (GEO GDS744) (Huang et al., 2013). Curculin-like genes have also been implicated in the regulatory network that establishes the adaxial/abaxial surfaces in Arabidopsis (Reinhart et al., 2013), which also connects to the regulatory pathways that guide polarity in plant cells.
4.4.2. Dependent genes
There were 75 genes that were at least somewhat dependent on a functional Arg1, many of which were transcription factors associated with the regulation of hormone signaling and cell proliferation. The two most highly induced genes were transcription factors bZIP16 and APD1. Factor bZIP16 primarily functions as a transcriptional repressor of genes responsive to light, gibberellic acid (GA) and abscisic acid (ABA) (Hsieh et al., 2012), while RING-finger protein APD1 (ABERRANT POLLEN DEVELOPMENT1) is associated with pollen development and with signaling in the 9-Lipoxygenase pathway central to root development and pathogen defense (Qin et al., 2014; Walper et al., 2016). This latter role could connect it to another highly induced gene in this category: PSK4, which encodes a precursor to Phytosulfokine 4, one of a family of cell wall receptors that function in cell proliferation, expansion, and wound repair (Tameshige et al., 2015). Interestingly, PSK4 has been shown to promote callus growth in root explants and, further, is proteolytically cleaved from its precursor by subtilase SBT1, a gene which is also induced in spaceflight in ARG1 KO cells (Chevalier et al., 2005). The gene SRF5 appears to be a member of the STRUBBELIG family of transmembrane receptor-like kinases that contribute to the regulation of cell morphogenesis and proliferation (Chevalier et al., 2005).
4.4.3. Required genes
Among the
4.4.4. Corrected genes
The 102 genes in the
Genes associated with hormone-mediated signaling are also well represented among the genes that are corrected to WT levels in the ARG1 KO spaceflight transcriptome. Examples include WD domain, G-beta repeat protein gene, SRL2 phytochrome interacting factor 4, and UNS2 Acyl-CoA N-acyltransferases (NAT) These genes are associated primarily with plant growth, cell expansion and architecture, and morphogenesis (Lehman et al., 1996; Schwab et al., 2003; Saedler et al., 2009; Nomoto et al., 2012), suggesting that the cell growth may need to be adjusted in spaceflight and that a certain level expression of development-related genes may be required.
4.4.5. Compensated genes
There were 107 genes that appear to help compensate for the lack of Arg1 in cells (Fig. 4A Category IV; Fig. 4B). Together, these 107 genes define the genotype-specific strategy employed by cells lacking an active Arg1 gene to physiologically adapt to the spaceflight environment, and provide a link to the role of Arg1 in adapting to spaceflight (Fig. 6).
Genes associated with cell-wall metabolism figure prominently in this category. For example, genes participating primarily in molecular grafting of xyloglucan chains such as At1g68560, alpha-xylosidase 1, and the two xyloglucan endotransglucosylase/hydrolases, XTH9 (At4g03210) and XTH4 (At2g06850), were significantly downregulated in ARG1 KO in spaceflight transcriptome compared to WT cells. This activity suggests that the process of splitting and/or reconnection of the xyloglucan cross-links in the cell wall occurred in the spaceflight in cells lacking Arg1 in a manner different from WT cells. Further, the repression of these cell-wall remodeling genes indicates that cell-wall loosening processes and cell expansion were diminished in spaceflight when Arg1 gene is absent. It is well documented that cell wall remodeling is a component of both spaceflight adaptation and as a response to hypergravity (Nedukha, 1997; Soga et al., 1999, 2002; Paul et al., 2013; Kwon et al., 2015). The synthesis and assembly of many cell wall components are dependent on the Golgi apparatus and transport vesicles to the plasma membrane. Genes involved in intracellular transport were also highly represented in those differentially expressed in spaceflight transcriptomes when Arg1 function was disabled. For instance, the genes associated with vesicle-mediated transport such as Prenylated RAB acceptor 1.G2 (At5g56230), SRP54 signal recognition particle (At5g49500) of the signal recognition in the endoplasmic reticulum, SOS1 sodium proton exchanger (At2g01980) of the intra-Golgi vesicle-mediated transport, and a Clathrin adaptor complex protein (At4g35410) were all differentially expressed in the spaceflight samples between ARG1 KO and WT cells. The endomembrane system, intracellular transport, and vesicle trafficking genes were also a large part of the WT physiological adaptation to the spaceflight environment, although the individual representative genes differed from those engaged in the ARG1 KO cells. This finding reinforces the conclusion that these processes are sensitive to the reduced-gravity environment and that cells handle them differently depending on ARG1 availability. The importance of vesicle trafficking and intracellular transport has also been identified in ground studies that demonstrated mutants of a vacuolar membrane system genes exhibited agravitropic phenotypes (Kato et al., 2002; Surpin, 2014). In addition, ground studies have shown that chemical treatments that disrupt gravitropism cause aberrant endomembrane morphologies, particularly of vacuoles, which underscores the link between the endomembrane system and gravitropism in plants (Surpin et al., 2005). If indeed ARG1 executes its role in the adaptation to spaceflight microgravity through the endomembrane system, then the link of the endomembrane system to gravity sensing in the specialized cells of the plant root could be extended to include undifferentiated cells as well. Connecting ARG1 to gravity perception in undifferentiated cells would imply a universal, cell-type independent tool for gravity sensing in plants.
Another group of genes in this category associate with gravitropism on the ground through auxin signaling and cell polarity. POL, a Protein phosphatase 2C family protein (At2g46920) and the GRAS family transcription factor SGR7 (SHOOT GRAVITROPISM 7-At4g37650) showed substantially diminished expression level in the ARG1 KO spaceflight transcriptome compared to WT cells. POL plays a role in establishing and maintaining the stem cell polarity and localization of auxin signaling (Gagne et al., 2008), and SRG7 is involved in radial organization of the root and shoot axial organs that are responsible for directing asymmetric cell division (Koizumi et al., 2012). The most prominent example of ARG1 engagement in establishing cell polarity occurs in root statocytes upon gravistimulation and is a basis for root gravitropism. In ground studies, ARG1 KO plants exhibit increased auxin accumulation in root tips, which then results in a strong defect in root gravitropism (Sedbrook et al., 1998). Although ARG1 protein is likely to play a role in enabling auxin redistribution in statocytes, ARG1's wide association with the endomembrane system and cytoskeleton suggests a more diverse role in gravity sensing in plants, which is actually well aligned with the concept that ARG1 might be important to undifferentiated cells. ARG1 might mediate gravity signal transduction in undifferentiated cells by promoting the folding, targeting, or degradation of gravitropic regulators in the vicinity of the cytoskeletal network. The observation that the genes related to the gravity sensing and signaling were compensated in the ARG1 KO cells suggests that alternative systems to the ARG1 exist and were required for successful spaceflight adaptation.
4.5. BRIC-16
This experiment is the second time that Arabidopsis cell cultures were sent into space. The first cell culture experiment was launched to the ISS in 2010 on STS131 (BRIC-16) (Paul et al., 2012). These two BRIC cell culture experiments were substantially different in many aspects. First, the cells used in BRIC-16 and BRIC-17 were of different “ages” before launch, as defined by the amount of time grown on solid media after being transferred from liquid culture. The BRIC-16 cells spent an additional week on solid media compared to the BRIC-17 cells. Second, the BRIC-17 cultures were freshly established, while the BRIC-16 culture had been established as a culture line for years. When the new mutant (ARG1 KO) cell line was created, we simultaneously created the comparable WT line to minimize physiological differences in the two BRIC-17 lines. And finally, besides the differences in the biological material, there were differences in the experimental profile of BRIC-17 as compared to BRIC-16: the space vehicle used to launch to the ISS, the mission profile, and the days spent in microgravity (Table S9).
The spaceflight transcriptomes of the WT cells of BRIC-16 and BRIC-17 CEL had only one differentially expressed gene in common (At5g62710, a protein kinase). However, the general patterns of gene expression in both experiments suggest they held many of the same strategies of physiological adaptation in common. In BRIC-16, although the largest category of genes induced were heat-shock genes, among the next most highly differentially expressed genes were those associated with pathogen response, wounding, and cell wall remodeling; a pattern that is closely aligned with the current study (Paul et al., 2012). The WT cells used in both experiments were of identical genotype; thus the most likely explanation for the paucity of coordinately expressed genes between the two spaceflight experiments is that each cell line began their respective flights with a ground transcriptome profile that reflected environmental and developmental parameters unique to each experiment. The BRIC-16 cells may have already engaged a series of adaptive strategies that were not necessary in the WT cells of BRIC-17; it is likely that the abundance of heat-shock and stress-response genes in the BRIC-16 spaceflight transcriptome pattern was related to a more stressful ground state before launch. Thus, the age and “stress level” of the cell lines before launch make a substantial difference in how the cells respond to the spaceflight environment. However, the very fact that they are different has provided valuable insight into the response that these cells—any cells—have to the novel environment of space. And yet, on this background, these cells also expressed and repressed the genes necessary to engage in cell-wall remodeling processes that now seem to be a hallmark of spaceflight physiological adaptation.
5. Conclusions
The results presented here suggest that there is more to understanding spaceflight adaptation than identifying genes that are changed in expression as WT cells adjust to spaceflight. There are also genes whose activity at certain levels is required for spaceflight adaptation but whose expression levels need not be changed from that which occurs on the ground. Those important but nonchanging genes are revealed by comparing expression patterns between WT and mutant lines. In a very real sense, limiting the list of genes required for spaceflight adaptation to those that need to be changed only in WT cells can restrict insight into the full scope of the spaceflight physiological adaptation process.
The Arg1 gene appears to have a major role in spaceflight adaptation of cultured cells, perhaps through gravity sensing, in these nonspecialized, undifferentiated cells. The major ARG1 role seems to relate to its association with the endomembrane system, mediation of the proper localization/targeting or activity of proteins at the plasma membrane or at organelles of the secretory pathway. These data imply that Arg1 also has a function in spaceflight adaptation in differentiated cells within intact plants. Moreover, these data suggest that the genotype, and therefore the physiological state of a cell, can have a dramatic effect on the expression profile of genes needed for spaceflight adaptation.
These data also further reinforce the conclusions drawn from a growing body of plant spaceflight literature that suggest that at least one underlying theme of the physiological adaptation of plants to the spaceflight environment is cell-wall remodeling.
Footnotes
Acknowledgments
This work was supported by grants NNX12AK80G and NNX12AN69G to R.J. Ferl and A.-L. Paul from NASA Space Life and Physical Sciences managed through Kennedy Space Center. We would like to acknowledge Lisa David for technical assistance and Lawrence Rasmussen for preflight technical help with the tissue culture cell lines that were used in the BRIC-17 CEL experiment.
The authors also wish to acknowledge the large and various inputs from the community of scientists pushing the molecular biology frontiers of spaceflight science. That community includes the reviewers of this manuscript, who helped the authors clarify complex issues of presentation and interpretation. In particular the authors appreciate the need and desire of the community (and this paper) to remain diligent in the description of experimental results as comparing spaceflight samples to ground control samples. Isolating the effects of microgravity from the general and combined effects of spaceflight would require the utilization of high-quality long-arm centrifuges on orbit. Therefore, the authors strive to specifically use the terms “spaceflight” and “ground” as the terms for the major experimental contrasts in this study.
Author Disclosure Statement
No competing financial interests exist.
Abbreviations Used
References
Supplementary Material
Please find the following supplemental material available below.
For Open Access articles published under a Creative Commons License, all supplemental material carries the same license as the article it is associated with.
For non-Open Access articles published, all supplemental material carries a non-exclusive license, and permission requests for re-use of supplemental material or any part of supplemental material shall be sent directly to the copyright owner as specified in the copyright notice associated with the article.