
Abstract
The Ma_MISS (Mars Multispectral Imager for Subsurface Studies) experiment is the visible and near infrared (VNIR) miniaturized spectrometer hosted by the drill system of the ExoMars 2020 rover. Ma_MISS will perform IR spectral reflectance investigations in the 0.4–2.2 μm range to characterize the mineralogy of excavated borehole walls at different depths (between 0 and 2 m). The spectral sampling is about 20 nm, whereas the spatial resolution over the target is 120 μm. Making use of the drill's movement, the instrument slit can scan a ring and build up hyperspectral images of a borehole. The main goal of the Ma_MISS instrument is to study the martian subsurface environment. Access to the martian subsurface is crucial to our ability to constrain the nature, timing, and duration of alteration and sedimentation processes on Mars, as well as habitability conditions. Subsurface deposits likely host and preserve H2O ice and hydrated materials that will contribute to our understanding of the H2O geochemical environment (both in the liquid and in the solid state) at the ExoMars 2020 landing site. The Ma_MISS spectral range and sampling capabilities have been carefully selected to allow the study of minerals and ices in situ before the collection of samples. Ma_MISS will be implemented to accomplish the following scientific objectives: (1) determine the composition of subsurface materials, (2) map the distribution of subsurface H2O and volatiles, (3) characterize important optical and physical properties of materials (e.g., grain size), and (4) produce a stratigraphic column that will inform with regard to subsurface geological processes. The Ma_MISS findings will help to refine essential criteria that will aid in our selection of the most interesting subsurface formations from which to collect samples. Key Words: Mars—Subsurface—Spectroscopy—Mineralogy. Astrobiology 17, 612–620.
1. Introduction
T
Ma_MISS will be operated periodically during pauses in drilling activity and produce hyperspectral images of the drill's borehole. Ma_MISS is the only instrument in the rover's Pasteur payload with the capability to analyze subsurface material in its natural setting (in situ) before extracting samples for further analysis. The Ma_MISS hyperspectral data will be essential for documenting the environment of collected samples at the time they are acquired and compare these results with those obtained by other instruments in the analytical laboratory.
Recent results from the MEX and MRO orbiters and the MER and MSL rovers have clearly shown that H2O played a crucial role in the early history of Mars and provided conditions that would have been favorable to life. Owing to the very tenuous martian atmosphere, potential chemical biosignatures at, or in, the vicinity of the martian surface would have been susceptable to degradation or eradication by (1) ultraviolet (UV) radiation (e.g., Horneck and Rettberg, 2007 and references therein; Billi et al., 2008; Fajardo-Cavazos et al., 2010), (2) UV-induced photochemistry (Stalport et al., 2010) that produced reactive oxidant species, and (3) ionizing radiation (Kminek and Bada, 2006). The long-term effects of radiation decrease, however, with burial depth, and hence organic molecules, and potential biomarkers could be better preserved in the martian subsurface.
Subsurface investigations, therefore, are needed to improve our understanding of the depositional history of Mars and our ability to search for possible indicators of past life. These results will also help to constrain estimates of H2O reserves on the planet and evaluate the martian environment with regard to human survival.
2. Ma_MISS Scientific Objectives
Investigating the upper few meters of the martian subsurface will provide important constraints on the geological history of Mars and contribute to a better understanding of the evolution of surface sediments (erosion, transport, and deposition), the relationship between sediments and bedrock, the relationship between environmental conditions and surface processes, and the possible occurrence of life.
Ma_MISS scientific objectives include the following:
2.1. Characterization of composition of subsurface materials
The OMEGA and CRISM imaging spectrometers on board the MEX and MRO space missions, respectively, have demonstrated that the visible and near infrared (VNIR) spectral range is suitable to identify and map a large variety of minerals on Mars. These instruments made the first detections of phyllosilicates, sulfates (e.g., Bibring et al., 2005; Gendrin et al., 2005; Poulet et al., 2005; Murchie et al., 2009), and carbonates (e.g., Murchie et al., 2009; Carter et al., 2013; Niles et al., 2013; Ehlmann and Edwards, 2014) and confirmed that in the past the planet was wetter and possibly warmer. In particular, CRISM's spatial resolution (∼20 m/pixel) revealed that the surface composition can be very rich at the local scale in specific areas where dust does not mask the IR signature of rock mineralogy.
The Ma_MISS instrument will explore the martian subsurface in the 0.4–2.2 μm spectral range with a spatial resolution of 120 μm over the target. This high spatial resolution capability will be very important for exploring mineralogical composition variability at the scale of rock grains directly on borehole walls. The study of reflectance spectra of subsurface materials will allow the identification of differences in lithologies, for example, distinguishing between volcanic and sedimentary rocks. The analysis of position and shape of absorption bands will discriminate between different types of mineralogical phases among silicates, sulfates, oxides/hydroxides, hydrated phases, and opaque minerals (e.g., sulfides, iron oxides, and silica). In particular, the occurrence of crystal field absorption features because of Fe2+-Fe3+ (near 1 and 2 μm) and other transition elements in association with iron-bearing minerals can be used to identify many types of silicates, oxides, etc. (Burns, 1993). Ferric iron absorptions in the 0.8–0.9 μm region could indicate the presence of altered phases in the materials, providing information about oxidation conditions. The occurrence of OH−/H2O vibrational bands near 1.0, 1.4, and 1.9 μm (overtones and combinations) is indicative of the hydration state of materials (Hunt, 1977; Clark et al., 1990). Carbonates also display overtones and combinations of vibrational features that are observable in the 1.75–2.20 μm range (Hunt, 1977; Gaffey, 1986; Clark et al., 1990), even if these signatures are relatively faint.
2.2. Mapping the distribution of subsurface H2O and CO2
Recently, ice deposits in the martian shallow subsurface have been inferred from remote-sensing detection of hydrogen based on neutron and gamma ray spectroscopy (Boynton et al., 2002) and from geomorphological considerations related to permafrost (e.g., Carr and Schaber, 1977; Baker, 2001; Bibring, 2005). Detections of low latitude H2O frost on pole facing slopes are also consistent with a subsurface ice layer at those latitudes (Carrozzo et al., 2009; Vincendon et al., 2010). Although no morphological or spectroscopic evidence of H2O or CO2 ices has been observed at the ExoMars potential landing sites, ice inclusions cannot be ruled out.
Both H2O and CO2 ices show diagnostic features in the Ma_MISS instrument spectral range (Fig. 1). Although their bands at 1.5 and 2 μm fall at the same wavelengths of hydrated minerals absorptions, unambiguous identification of ice deposits or inclusions in the subsurface layers can be performed by way of minima positions and band shapes analysis. In particular, band shapes can be used also to constrain grain ice size.
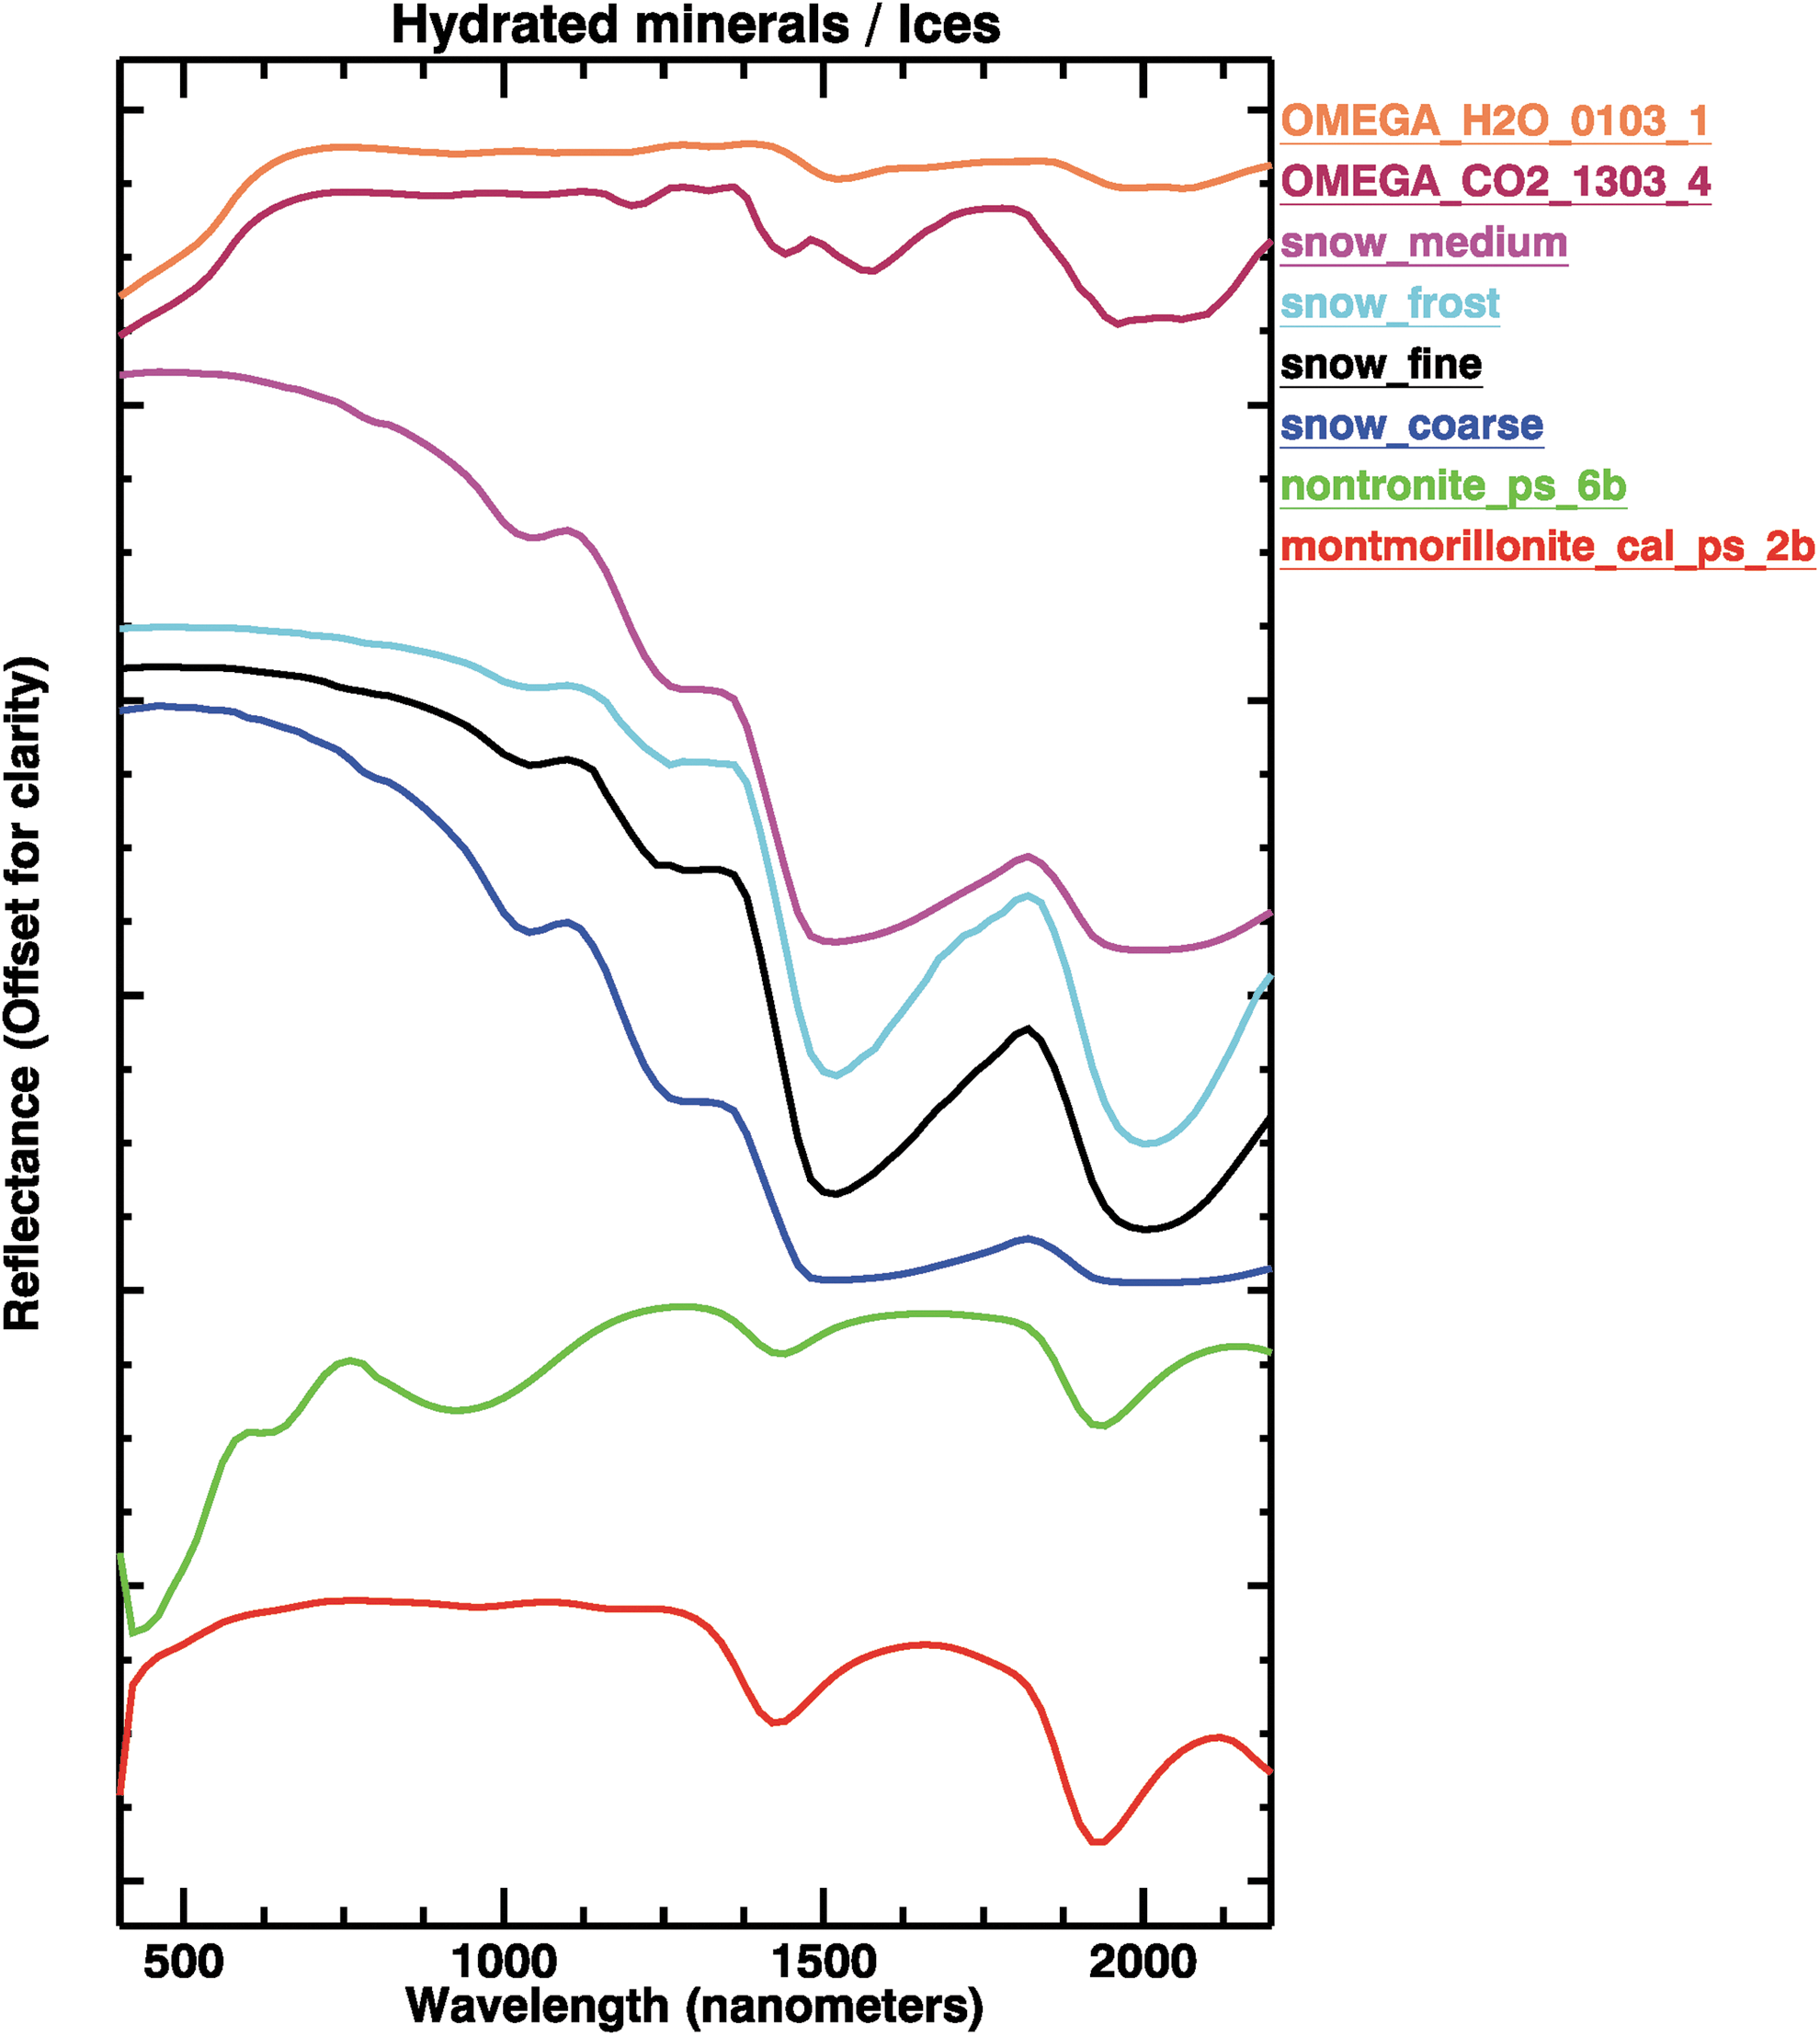
Reflectance spectra of hydrated minerals (nontronite and montmorillonite, USGS Library), terrestrial snow at different grain sizes (USGS Library), and martian H2O and CO2 ices (Mex/OMEGA, from orbit 103 and 1303, respectively). All spectra have been convolved at the spectral resolution and sampling (20 nm) of Ma_MISS, in the range 400–2200 nm. Ma_MISS, Mars Multispectral Imager for Subsurface Studies.
H2O ice and hydrated silicate spectra (Fig. 1) can be unambiguously discriminated based on several factors. These factors can be summarized as follows: (i) The different shape of 1.5 and 2 μm OH/H2O absorption bands. These features are generally narrower in hydrated silicates than in ices spectra. H2O and CO2 ice bands are generally U-shaped and very broad (Fig. 1), and their FWHMs are roughly 250–300 nm. The 1.5-μm band of CO2 ice also shows a doublet. Depending on the grain size, these absorption bands tend to saturate (see, for example, the spectrum of coarse snow, in Fig. 1). (ii) The slightly different positions and shapes of band minima. The OH/H2O bands appear at shorter wavelengths in hydrated silicates than in ice spectra, and are generally V-shaped and characterized by very narrow minima (Clark and Lucey, 1984; Clark et al., 1990). H2O and hydroxyl bands in hydrated silicates have typically FWHMs in the range between <50 and 150–200 nm. OH and H2O bands are located at 1.44 and 1.94 μm, respectively, in nontronite, and at 1.42 and 1.92 μm in montmorillonite. Concerning ices, H2O bands are located at 1.5 and 2.0 μm, respectively, in coarse snow, and at 1.52 and 2.02 μm in H2O ice (Fig. 1). (iii) Hydrated minerals typically also contain several cations that are responsible for absorption features because of electronic transitions in metals and vibrational transitions in M-OH bonds, where M is a metal (Fe, Al, or Mg) (Clark et al., 1990). For example, the spectrum of nontronite (Fig. 1) also contains two absorption bands, located at 0.7 and 0.9 μm, that are attributable to electronic transitions in Fe3+ (Clark et al., 1990).
2.3. Discrimination of the optical and physical properties of materials
The study of spectral parameters, such as continuum reflectance level and slope, can help to determine important physical parameters such as the different dimensions of grains in materials that can help us to better assess the type and state of sediments in the subsurface.
A different behavior of the continuum slope as a function of particle grain size could provide clues about optical properties, discriminating between optically thin and thick materials. Moreover, optical constants (refraction index) of the materials can be retrieved from spectra by means of the Hapke reflectance theory (Hapke, 1981).
Different slopes and spectral shapes can also help to distinguish volcanic glass from crystalline materials, thus providing clues about geological processes such as impacts or types of volcanic eruptions. The different atomic arrangement and structure of glassy and crystalline materials generally results in very different spectroscopic properties. Spectra of glassy materials are generally flat and featureless, with a very low spectral contrast and typically a low value of reflectance. Crystalline materials show very broad and definite absorption bands.
2.4. Reconstruction of a stratigraphic column: clues about subsurface geological processes
Mars' surface is rich in sedimentary outcrops that exhibit stratigraphic features at a range of spatial scales (e.g., Malin and Edgett, 2000, 2003; Grotzinger et al., 2006; Dromart et al., 2007; Lewis et al., 2008; Milliken et al., 2010). On Earth, our understanding of the evolution of very ancient climate and life development derives from the study of mineralogical, textural, and geochemical signatures preserved in the sedimentary rock record in stratigraphic sections. It is reasonable to assume that these insights could also have been preserved in martian subsurface stratigraphy. Hence, having access to the martian subsurface record will be fundamental to our ability to constrain the nature, timing, and duration of alteration and sedimentation processes at locations the ExoMars rover will visit. The Ma_MISS data will also help us to understand the complex interactions between the surface and the atmosphere. Alteration processes can dominate the mineralogy of the martian surface. Therefore, by investigating the mineralogy of deeper layers, where a more limited alteration took place, it is possible to better infer the history of erosion, transport, and deposition of loose material.
The layer thickness and scale within the stratigraphic column, combined with the composition of each layer, will provide us with important information about the sedimentary/geological processes that took place at the landing site. Clues about autochthon sedimentation or regolith homogenization could be inferred by grain sorting/unsorting as a function of depth.
3. Ma_MISS Synergy with Other Rover Instruments
The thermal excursions at the equatorial and mid-latitudes that the ExoMars mission can target for landing oscillate between a few degrees more than 0°C and −120°C. This diurnal temperature oscillation is damped at depths of a few tens of cm into the subsurface (Grott et al., 2007). This means that deep samples collected by the ExoMars rover drill will have been at approximately −60°C for many millions of years. This is a very different thermal environment than that which the samples will encounter after extraction and processing.
Ma_MISS is the only instrument in the rover's Pasteur payload with the capability to analyze subsurface material in situ, that is, before collection. The Ma_MISS objective is to acquire information about the context from which samples are taken. In this regard, the instrument has the capability to investigate and characterize the stratigraphic column and the lateral anisotropies; other instruments on the rover will likely not be able to detect such differences.
Although it is true that the drilling process will not alter a sample to a great degree (although perhaps it will somewhat alter a sample's outer surface), this may not be the case during sample crushing (Vago et al., this issue) in the Analytical Laboratory Drawer (ALD). Even though the science plans are such that samples will be crushed early in the morning when the temperature in the ALD is at its lowest, the action of crushing could liberate a fraction of the volatile content and perhaps result in some sintering of mineral grains. At the Phoenix landing site, sublimation rates for loss of the icy component were relatively rapid, which complicated the sampling and delivery of icy soils to lander instruments (Arvidson et al., 2009). It is, therefore, very important to compare the visual and spectroscopic observations conducted by MicrOmega (VIS+IR) and RLS (green Raman) with those obtained by Ma_MISS. This will help the science team to discern to what extent sample material to be investigated in the ALD has changed with regard to its original state in the borehole. The larger spectral range of MicrOmega could give more details on the overall mineralogy of the collected sample. Such information can be useful in extending the results of Ma_MISS, whereas the context of the borehole, given by the Ma_MISS observations, is crucial to understanding whether the sample has changed during delivery to the ALD. Eventual modifications in the analyzed subsurface materials, between the preliminary in situ observations by Ma_MISS instrument and the postcrushing measurements by MicrOmega and RLS, could in principle be addressed by the appearance or variation of hydration bands, oxidation features, and carbonaceous materials' Raman peaks.
The rover team will use the WISDOM ground penetrating radar and the ADRON neutron detector to establish the stratigraphy and degree of hydration of any layers under the rover before commencing drilling operations. Thus, Ma_MISS findings with regard to subsurface composition are fundamental to our ability to validate predictions based on WISDOM and ADRON data and should match what will be found in the borehole's stratigraphic column. As the mission progresses, repeated use of the instrument triad that comprises WISDOM, ADRON, and Ma_MISS will help to improve the science team's ability to predict what will be found in the subsurface.
Finally, the close-up imager CLUPI will be utilized to image the fines produced while drilling. Potential color changes in the CLUPI images of the ejected fines, as well as visual inspection of the texture and physical properties of the particles, can be indicative of geological variation with depth. This information can also be useful when compared with the data obtained by Ma_MISS in the visible range. This comparison can be used to constrain the composition of the fines excavated by the drill from different depths.
An example of combined experiment and synergy between instruments, called BLIND TEST, was performed in 2013, and involved the Ma_MISS, RLS, CLUPI, and MicrOmega instruments coordinated by CNRS-ISAR institution (Bost et al., 2015). The main findings are reported hereunder (Table 1).
Ma_MISS, Mars Multispectral Imager for Subsurface Studies.
4. Ma_MISS Instrument Description
Ma_MISS is a miniaturized VNIR spectrometer entirely integrated within the drill system of the ExoMars rover (Fig. 2). The spectrometer, including VIS/NIR detector and proximity electronics, is accommodated in a box on the external wall of the drill box. The spectral range is 0.4–2.2 μm, with a spectral resolution of 20 nm and an expected signal-to-noise ratio of about 100. The light from an integrated 5 W lamp is collected and carried to the miniaturized optical head (OH) by an optical fiber bundle. The OH is accommodated on the drill tip and has the double task of focusing light onto the target and collecting the reflected signal. The OH consists of an illumination relay system and a signal relay system. The illumination spot on the target is about 1 mm in diameter at a focal distance of 0.6 mm. The reflected light is collected through a 120 μm spot (defining the spatial resolution). A single optical fiber transports the collected light from the OH up to the spectrometer on top. An antireflective coated sapphire window (SW) with high hardness and transparency on the drill tip tool protects the MA_MISS OH and permits the observation of the borehole wall.
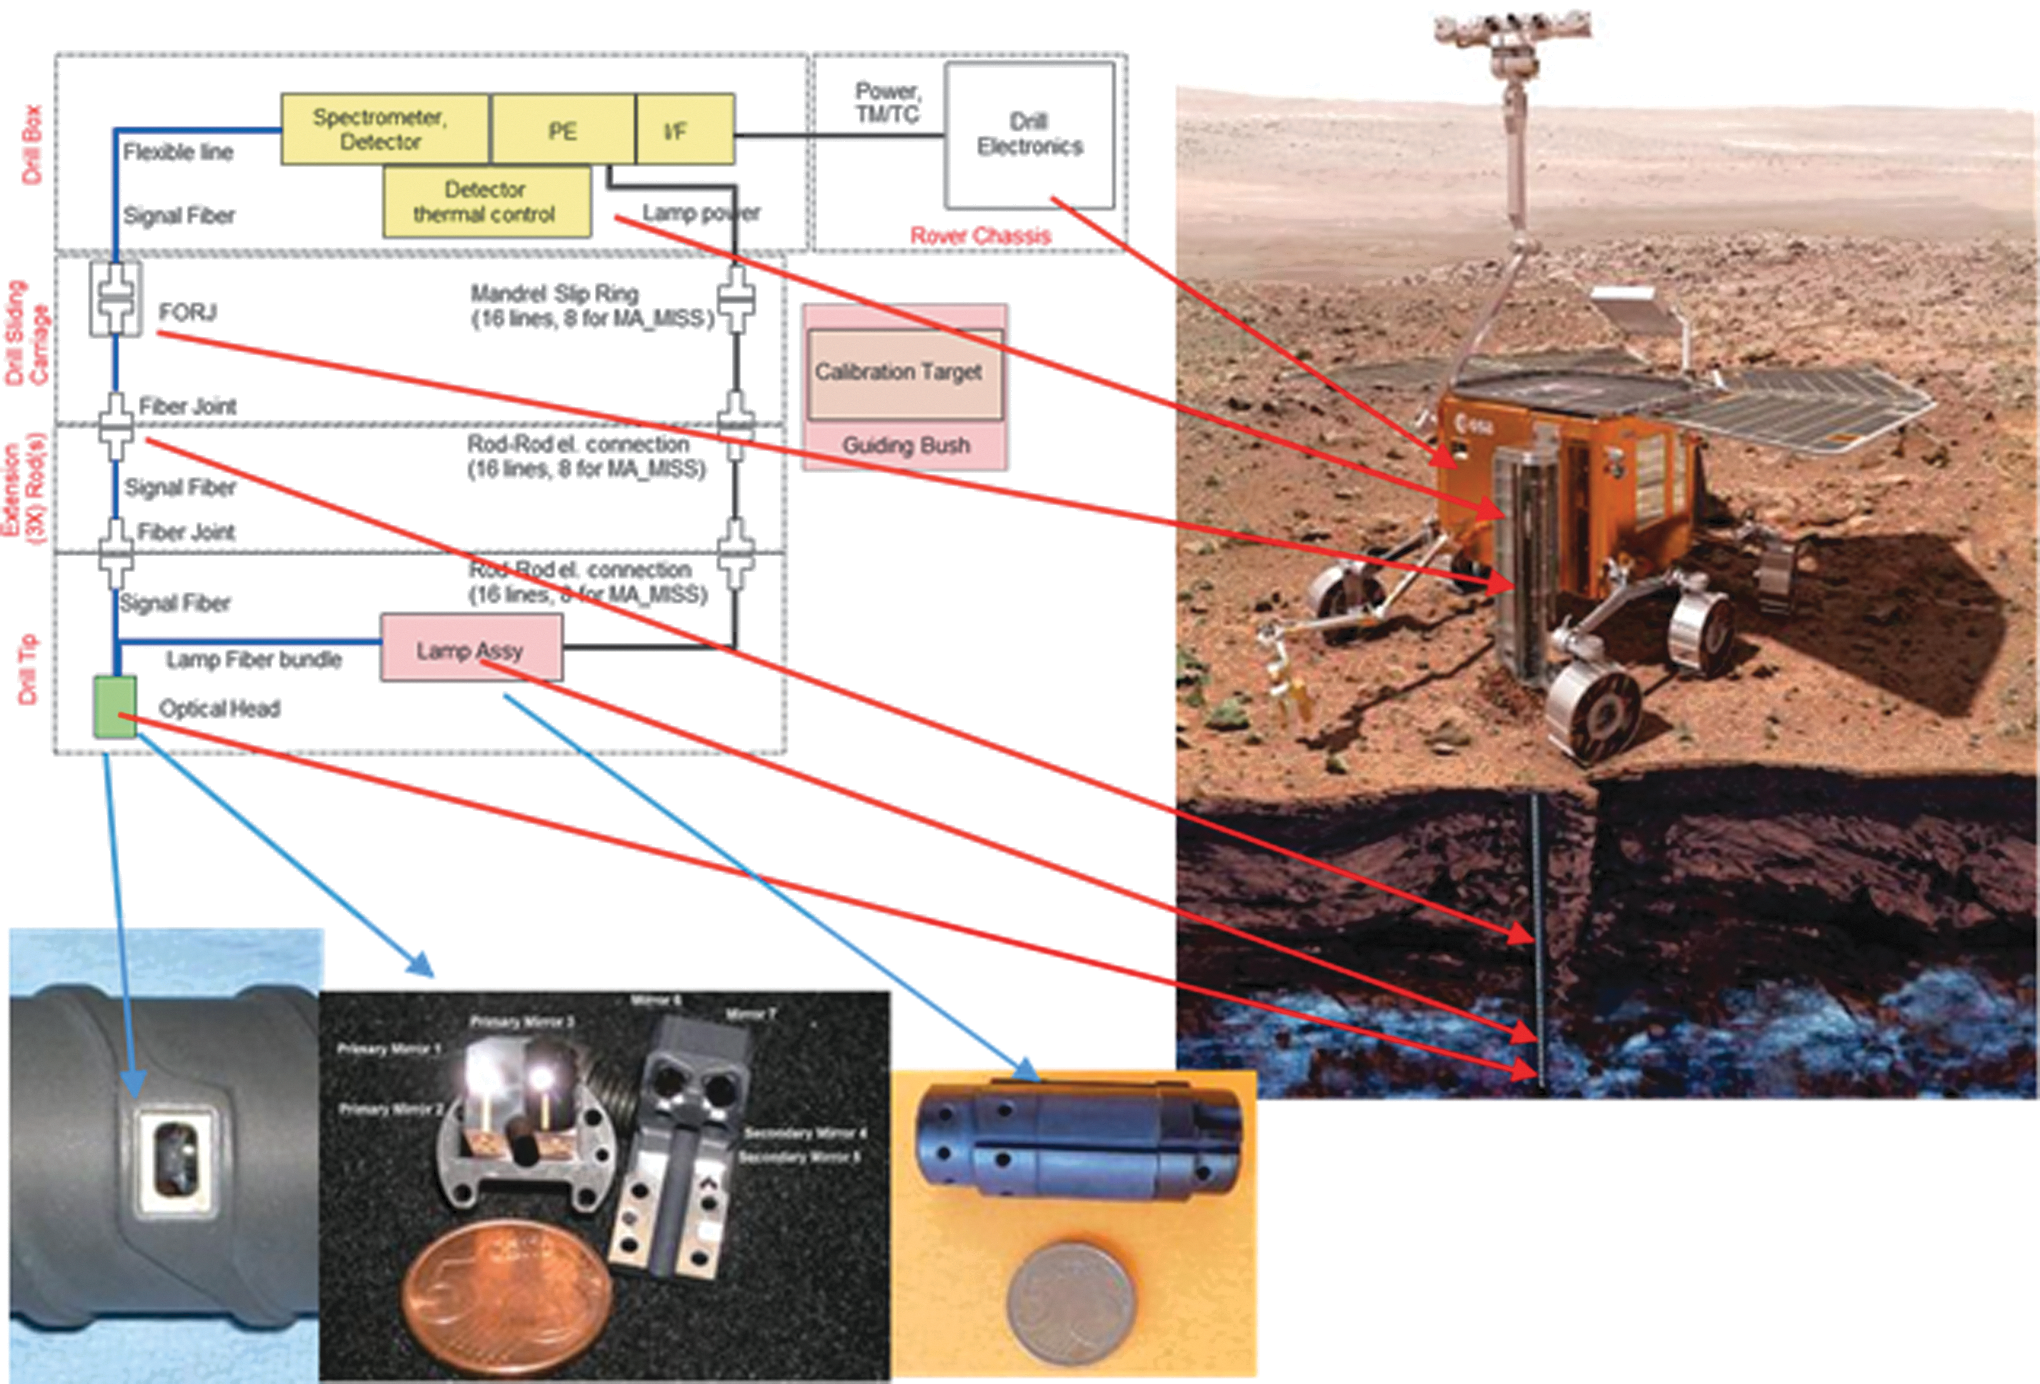
Ma_MISS functional diagram (left side) and accommodation inside drill parts (right side). PE is the Proximity Electronics. I/F is the electrical/mechanical interface between Ma_MISS and drill.
Different depths can be reached by using three extension rods, each 50 cm long. Each contains optical fibers and an optical collimator. The first extension rod is connected to the nonrotating part of the drilling system—which is hosted on the rover—by way of a fiber optical rotating joint that allows the continuity of the signal link between the rotating part of the drill and the spectrometer subsystem.
The signal from the OH to the spectrometer is transferred through the different elements in the drill by the following: – Fiber optics and optical collimator (two for each mechanical interconnection) on each extension rod. – An optical rotary joint implemented in the rototranslation group of the drill.
The Ma_MISS instrument's main requirement is miniaturization because it is embedded (and distributed) within several drill parts. Figure 3 shows the relative size of several Ma_MISS components.
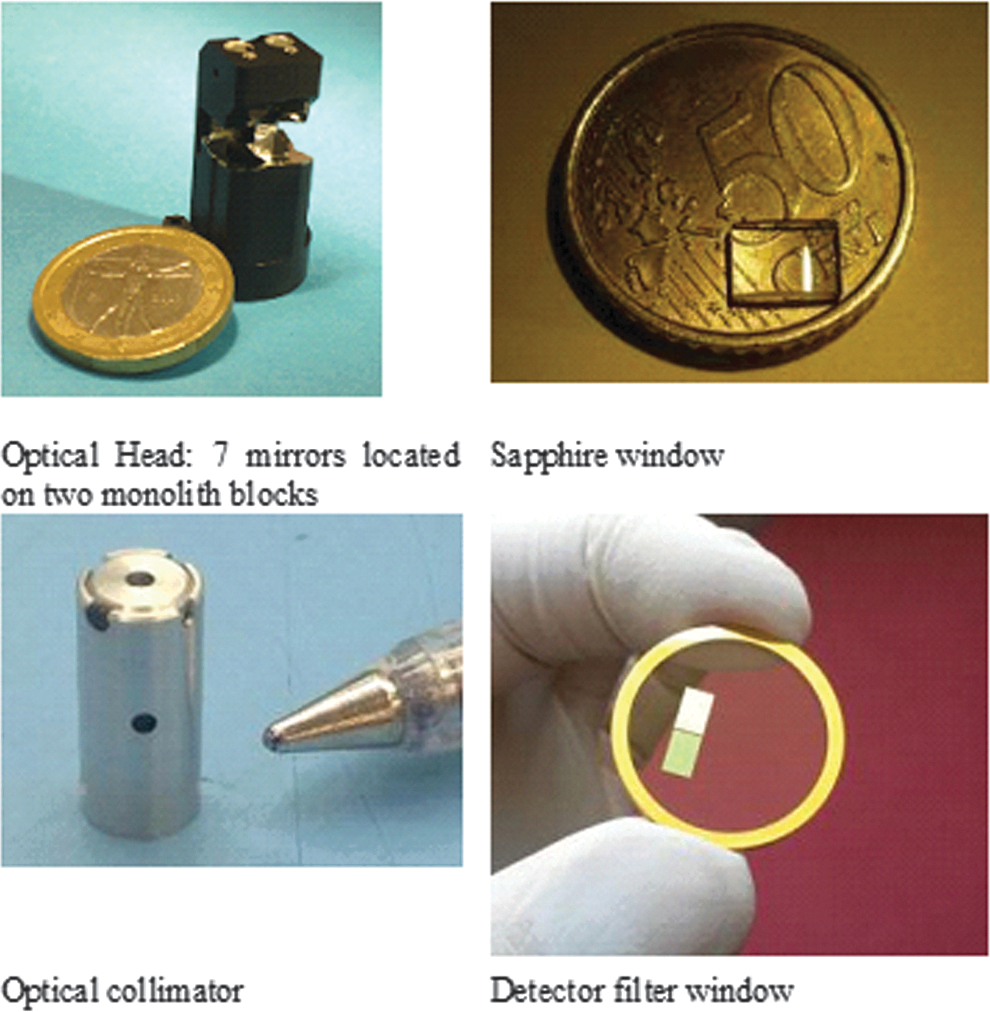
Ma_MISS parts dimensions with reference to common items.
5. Ma_MISS Operational Modes
Ma_MISS provides high flexibility for the acquisition of borehole wall spectra exploiting the translational and rotational dexterity of the drill tool. The spectrometer observes a single point target on the borehole wall subsurface. Depending on the surface features of interest, the observation window can scan the subsurface by means of drill tip rotation or translation and thus provide ring or column hyperspectral images (Fig. 4). Ma_MISS's flexibility also results in tunable exposure times in the range 1–10 ms. Nominally, a ring profile is collected during a rotation of the drill tip at a fixed depth. A smaller sector of a ring can also be acquired or different spot spacing can be used, depending on the scientific objective of the measurement and available resources in terms of time and data volume. A column profile is performed during a vertical translation of the drill tip tool—typically while extracting the drill. By combining a number of column and ring observations, Ma_MISS allows for construction of a fairly complete image of the wall.
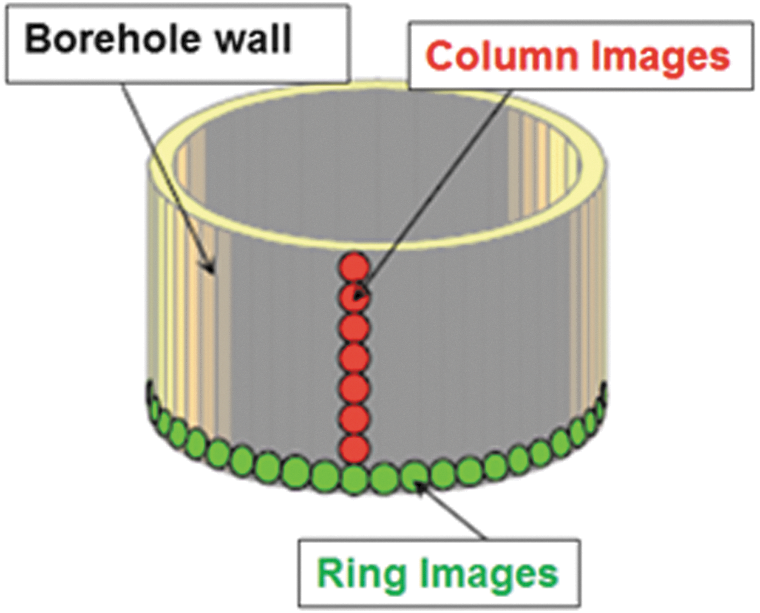
Ma_MISS operational modes.
6. Ma_MISS Breadboard
A series of spectroscopic campaigns have been performed to characterize the spectral performances of the laboratory model of the Ma_MISS instrument (breadboard). The breadboard setup consists of the main optical subsystems: (1) the illumination system (integrated 5 W lamp and optical fiber bundle), (2) the OH (seven mirrors that constitute the illumination channel and the signal channel), (3) the SW, and (4) the signal link (output optical fiber). This breadboard is coupled with a laboratory commercial spectrometer, the FieldSpec Pro. To validate the breadboard, a second instrument was used, the Spectro-Goniometer setup, which consists of the FieldSpec Pro and a settable goniometer (for varying illumination and emission angles) and its light source, a quartz–tungsten–halogen 84 W lamp. Both setups are in use at INAF-IAPS. Measurements were carried out on both particulate samples (De Angelis et al., 2014, 2015) and slab rocks (De Angelis et al., 2017) by using both instrument setups.
The Ma_MISS spectrometer covers the 0.4–2.2 μm range with a single detector, whereas FieldSpec uses three different detectors to operate in the 0.35–2.5 μm range. FieldSpec Pro has a better spectral resolution with respect to the Ma_MISS spectrometer's (3–10 nm vs. 20 nm) lower spatial resolution (6 mm vs. 0.12 mm). We expect a noise level comparable at room temperature. In the case of the Ma_MISS spectrometer, the entrance slit is the fiber optic aperture. More details on the differences between the breadboard spectrometer and the Ma_MISS spectrometer were described by De Angelis et al. (2014, 2015). Nevertheless, the Ma_Miss breadboard setup has demonstrated that Ma_ Miss has the capability to descriminate sample mineralogy variations as discussed hereunder (see also Bost et al., 2015).
Concerning particulates, six samples were analyzed. Each sample (four volcanic rocks, a micritic limestone, and a calcite) was reduced to powder form, ground, sieved, and divided into nine different grain sizes in the 0.02 < d < 0.8 mm range. Spectral parameters such as the continuum slope and the reflectance level of the spectra were analyzed and discussed (De Angelis et al., 2014), along with position, depth, area, band slope, and asymmetry of the absorption bands (De Angelis et al., 2015). Ma_MISS reflectance spectra and derived spectral parameters were found to be consistent with those of the Spectro-Goniometer setup (Figs. 5 –7). Combining the information obtained from analyses of the continuum slope, the reflectance level, and band parameters (position, etc.), it is possible to establish the composition and grain size of the observed material.
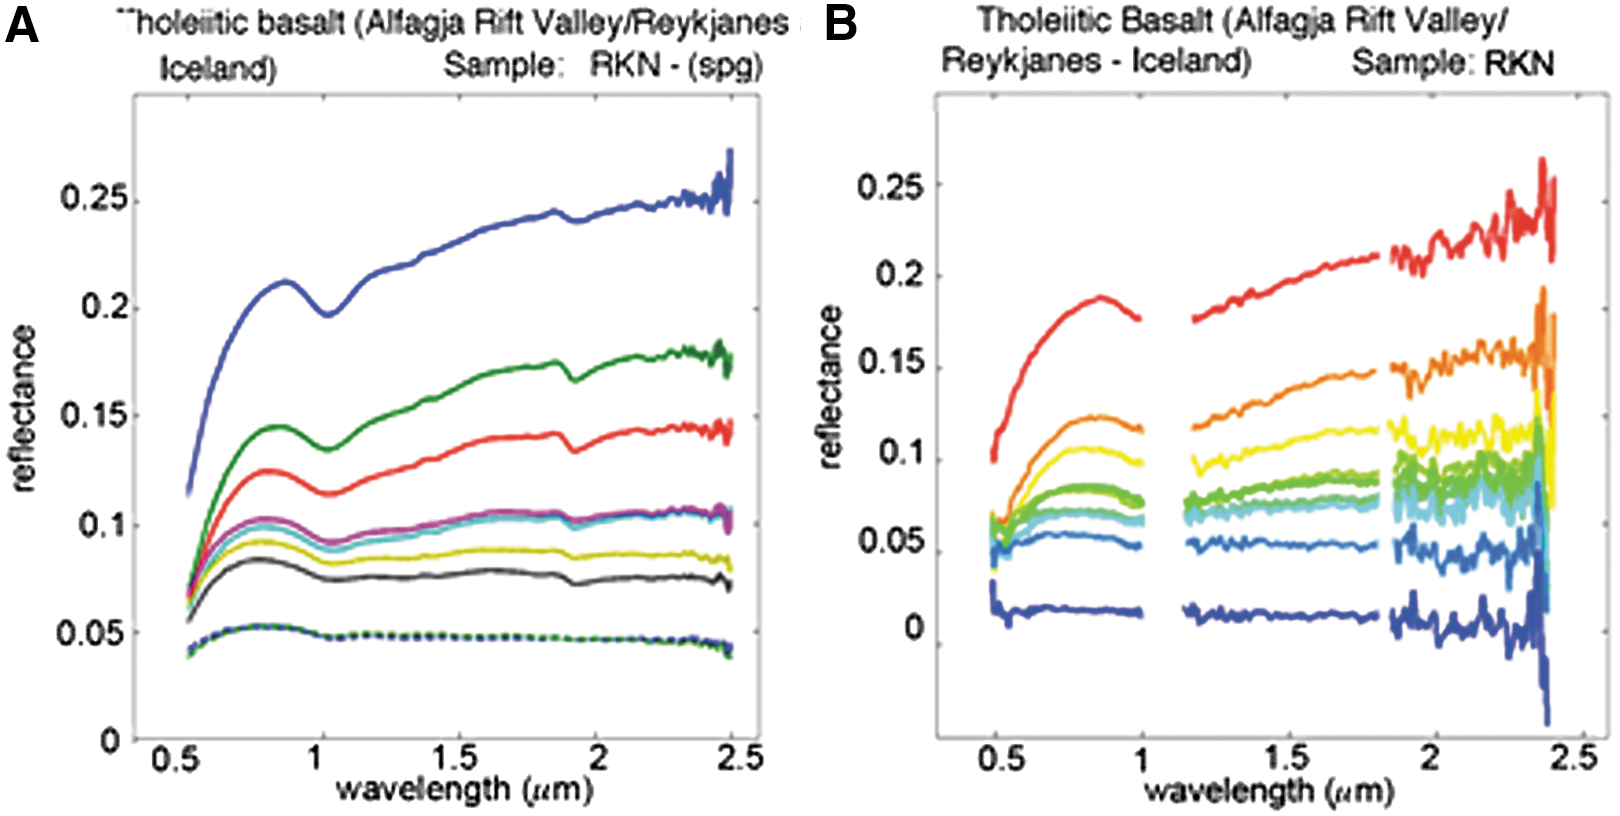
Spectra acquired on a basaltic sample (from Iceland), in powder form and in nine grain sizes between 0.020 and 0.8 mm.
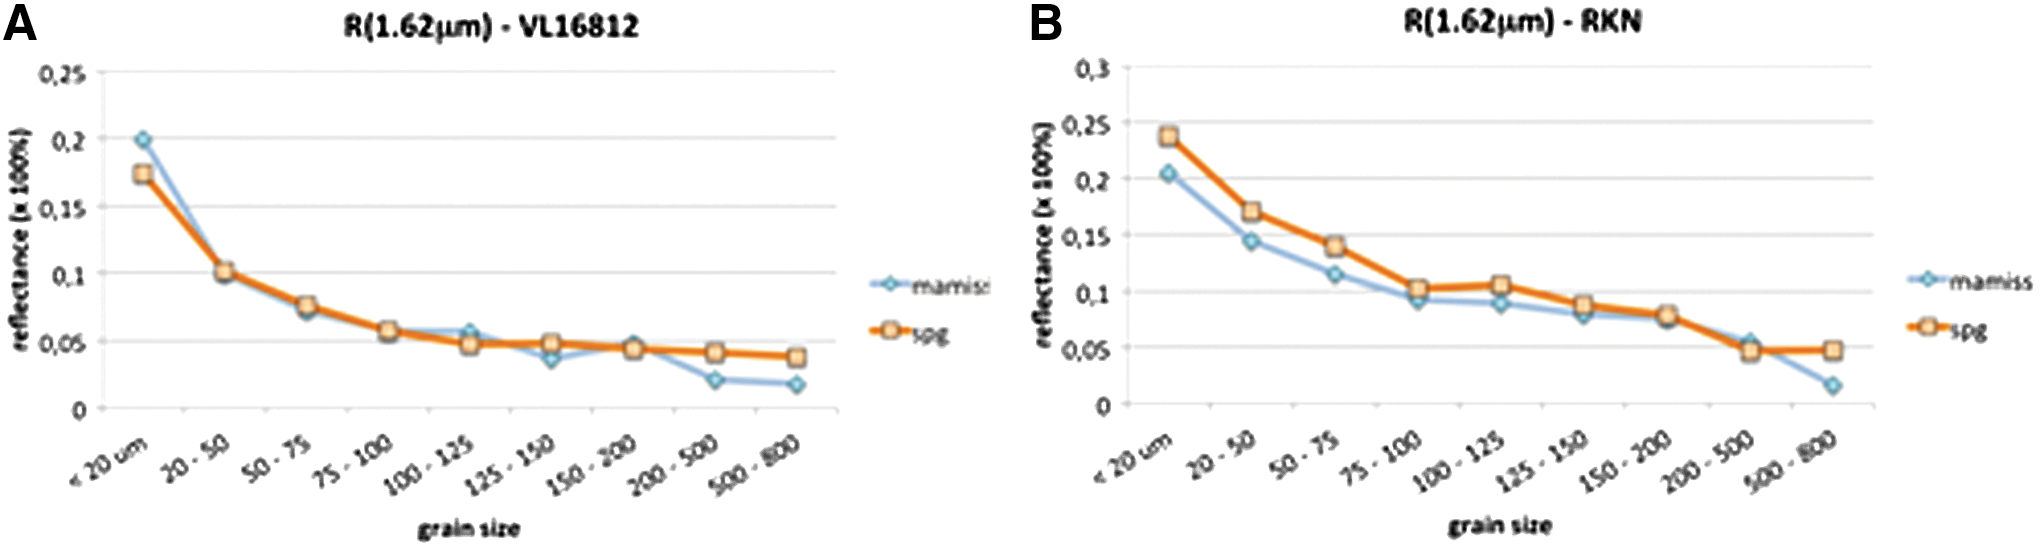
Spectral parameters (reflectance value at 1.62 μm) derived with Ma_MISS breadboard (diamonds) and Spectro-Goniometer (squares) as a function of the powder grain size (in micrometers).
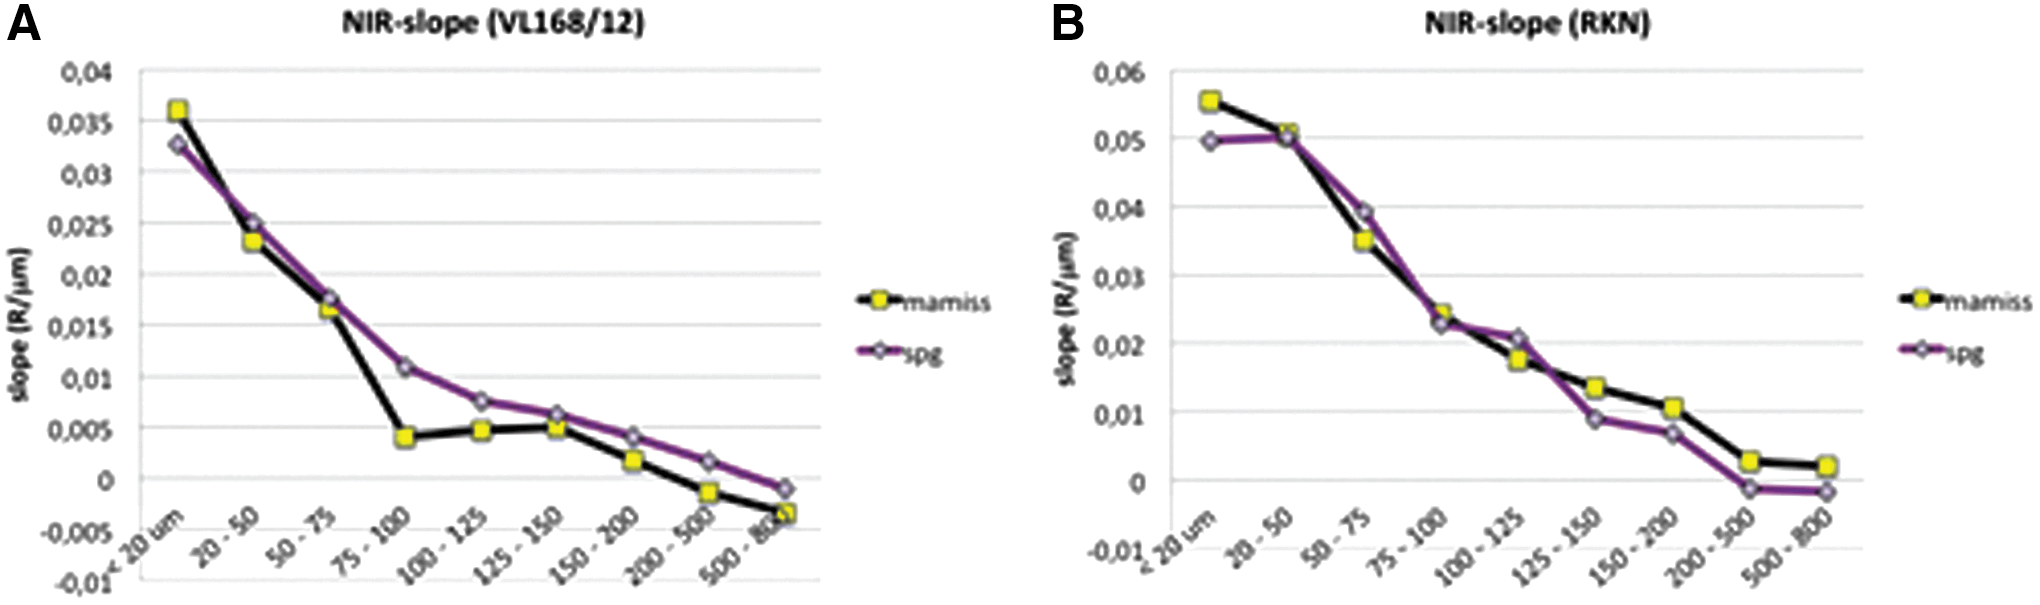
Spectral parameters (continuum slope in the NIR [0.7–1 μm]) derived with Ma_MISS breadboard (squares) and Spectro-Goniometer (diamonds) as a function of the powder grain size (in micrometers).
Concerning measurements on rock slabs, five samples were analyzed (three volcanic rocks and two limestones) using both instruments (Fig. 8). Several spectra were acquired on each rock surface using the Spectro-Goniometer (each spot is 6 mm in diameter). Within each area, 10 spectra were acquired using the Ma_MISS setup (spatial resolution 0.12 mm). Although the Spectro-Goniometer provided the average spectrum of each area, the higher resolution analysis possible with Ma_MISS allowed the identification and discrimination between different mineralogical phases within each area, confirming the potentiality of this instrument to study heterogeneous materials with great detail at submillimeter scale.

Spectra acquired on a rock slab (volcanic sample from Montiferru/Sardinia/Italy).
7. Conclusions
The Ma_MISS instrument has been designed to provide hyperspectral images of boreholes excavated by the ExoMars rover drill. Its spectral range, resolution, and imaging capabilities are suitable for the characterization of subsurface environments and candidate samples that will be delivered to the rover's analytical laboratory, and provide criteria for their selection. An excellent understanding of the composition and distribution of subsurface materials at the rover landing site will be crucial in our efforts to establish whether life might have occurred on Mars and whether the planet subsurface may have preserved biosignatures of any such life.
Footnotes
Acknowledgments
We thank the European Space Agency for the ExoMars Project, ROSCOSMOS and Thales Alenia Space for rover development, and Italian Space Agency (ASI) for funding and fully supporting the Ma_MISS experiment (ASI/INAF grant I/060/10/0).
Author Disclosure Statement
No competing financial interests exist.