
Abstract
ISEM (Infrared Spectrometer for ExoMars) is a pencil-beam infrared spectrometer that will measure reflected solar radiation in the near infrared range for context assessment of the surface mineralogy in the vicinity of the ExoMars rover. The instrument will be accommodated on the mast of the rover and will be operated together with the panoramic camera (PanCam), high-resolution camera (HRC). ISEM will study the mineralogical and petrographic composition of the martian surface in the vicinity of the rover, and in combination with the other remote sensing instruments, it will aid in the selection of potential targets for close-up investigations and drilling sites. Of particular scientific interest are water-bearing minerals, such as phyllosilicates, sulfates, carbonates, and minerals indicative of astrobiological potential, such as borates, nitrates, and ammonium-bearing minerals. The instrument has an ∼1° field of view and covers the spectral range between 1.15 and 3.30 μm with a spectral resolution varying from 3.3 nm at 1.15 μm to 28 nm at 3.30 μm. The ISEM optical head is mounted on the mast, and its electronics box is located inside the rover's body. The spectrometer uses an acousto-optic tunable filter and a Peltier-cooled InAs detector. The mass of ISEM is 1.74 kg, including the electronics and harness. The science objectives of the experiment, the instrument design, and operational scenarios are described. Key Words: ExoMars—ISEM—Mars—Surface—Mineralogy—Spectroscopy—AOTF—Infrared. Astrobiology 17, 542–564.
Table of Contents
1. Introduction
T
ISEM (Infrared Spectrometer for ExoMars) is a derivative of the lunar infrared spectrometer (LIS) (Korablev et al., 2015) being developed at the Space Research Institute (IKI) in Moscow for the Luna-25 and Luna-27 Russian landers planned for flight in 2019 and 2021, respectively (Zelenyi et al., 2014). Both the ISEM and LIS instruments have been conceived with similar spectral capabilities. The ISEM design is improved with respect to that of LIS, and modifications were also necessary to comply with the more stringent environmental conditions on the ExoMars rover. A fully operational model of ISEM is not ready at the moment of article submission, and the assessment of its measurement performance has been made with the available LIS prototype.
ISEM is one of two Roscosmos-provided instruments for the ExoMars rover. It is being predominantly developed at the IKI, but includes contributions from the National Research Institute for Physicotechnical and Radio Engineering Measurements (VNIIFTRI) in Russia, Moscow State University, also in Russia, and the Main Astrophysical Observatory, National Academy of Sciences in Ukraine. A calibration target to be used jointly by PanCam and ISEM is being contributed by Aberystwyth University, United Kingdom. Key components, such as the acousto-optic tunable filter (AOTF) and the detector, are purchased from NII Micropribor (Russia) and Teledyne (USA). The science team includes researchers from Russia (IKI and Vernadsky Institute), France, Italy, Sweden, Germany, the United Kingdom, and Canada. The team shares science team members with the PanCam and MicrOmega rover instrument teams. A full list of the ISEM Science and Technical teams is given at the end of the article.
After a brief summary of the major objectives of the ExoMars mission, we describe the scientific goals of the ISEM instrument. The technical design is then detailed. Measured performances of LIS prototype and expected performances of ISEM are presented subsequently. We conclude the article by addressing the operational scenarios and related environmental constraints.
2. Science Objectives
2.1. Contribution to overall rover mission science
The scientific objectives of the ExoMars program are defined as follows (Vago et al., 2017): 1. To search for signs of past and present life on Mars; 2. To investigate the water/geochemical environment as a function of depth in the shallow subsurface; 3. To study martian atmospheric trace gases and their sources; 4. To characterize the surface environment.
The first two objectives are the most relevant to the ExoMars rover. The ISEM experiment will contribute to achieving each of these objectives in the following ways: 1. Many of the minerals and rocks detectable by ISEM are good indicators of past habitable conditions and of biological processes [e.g., carbonates, oxalates, borates, nitrates, NH4-bearing minerals (Applin et al., 2015; Berg et al., 2016; Cloutis et al., 2016)] and may even contain biomolecules in detectable concentrations. These include a class of biogenic minerals that are further known to provide a substrate for, and catalyze, prebiotic reactions. Organic compounds, including polycyclic aromatic hydrocarbons (PAHs) and those containing aliphatic C-H molecules, can also be distinguished by ISEM (e.g., Clark et al., 2009; Izawa et al., 2014). 2. The ISEM instrument is capable of recognizing minerals and rocks that are indicative of the presence of water as well as geochemical environmental indicators. ISEM can also be used to analyze the drill cuttings excavated by the ExoMars drill system. The operating drill obscures the ISEM view, and observing the cuttings is only possible after the rover moves off and revisits the drilling site. 3. ISEM could detect, if present, organic-bearing materials, possibly evolving trace gases, such as hydrocarbons. 4. ISEM can carry out atmosphere observations, providing information on dust and clouds and contributing to characterization of atmospheric humidity. ISEM is capable of identifying and monitoring surface frost and may assess the diversity and stability of various minerals on the martian surface, for example, by monitoring changes in the spectral properties of drill cuttings over time.
In terms of where the rover will land, ESA has issued the following scientific criteria for landing site selection (Vago et al., 2015):
For the ExoMars rover to achieve results regarding the possible existence of biosignatures, the mission has to land in a scientifically appropriate setting: 1. The site must be ancient (older than 3.6 Ga)—from Mars' early, more life-friendly period: the Noachian to the Noachian/Hesperian boundary; 2. The site must show abundant morphological and mineral evidence for long-term, or frequently reoccurring, aqueous activity; 3. The site must include numerous sedimentary outcrops; 4. The outcrops must be distributed over the landing ellipse to ensure the rover can get to some of them (typical rover traverse range is a few km); 5. The site must have little dust coverage.
ISEM addresses these criteria in the following ways: 1. The suite of samples that we have used to characterize ISEM in laboratory tests includes materials similar to those found in Noachian terrains (e.g., phyllosilicates and carbonates). 2. ISEM will be able to identify minerals that are indicative of aqueous activity, such as phyllosilicates and hydrated sulfates. 3. Rocks and minerals presumed to have formed in sedimentary environments are the main focus of our investigation, and ISEM is particularly well suited to detect and characterize them. 4. As a remote instrument, ISEM is well adapted to characterize the stratification at the outcrop scale. 5. Our investigation will assess the obscuring effects of dust, first of all on the target areas, but also observing dust accumulation on the calibration target, excavated drill cuttings (e.g., Rice et al., 2011).
2.2. Synergies with other instruments
The main goal of ISEM is to establish the mineral composition of Mars' surface materials remotely. ISEM, together with PanCam (Fig. 1), offers high potential for the remote identification and characterization of any scientifically high-value target in the vicinity of the rover, including proximal and distant rocks, outcrops, and other geological formations. ISEM will help to establish the geological context of each site along the rover traverse, discriminating between various classes of minerals and rocks. ISEM will also be important in the selection of promising sites for subsurface sampling.
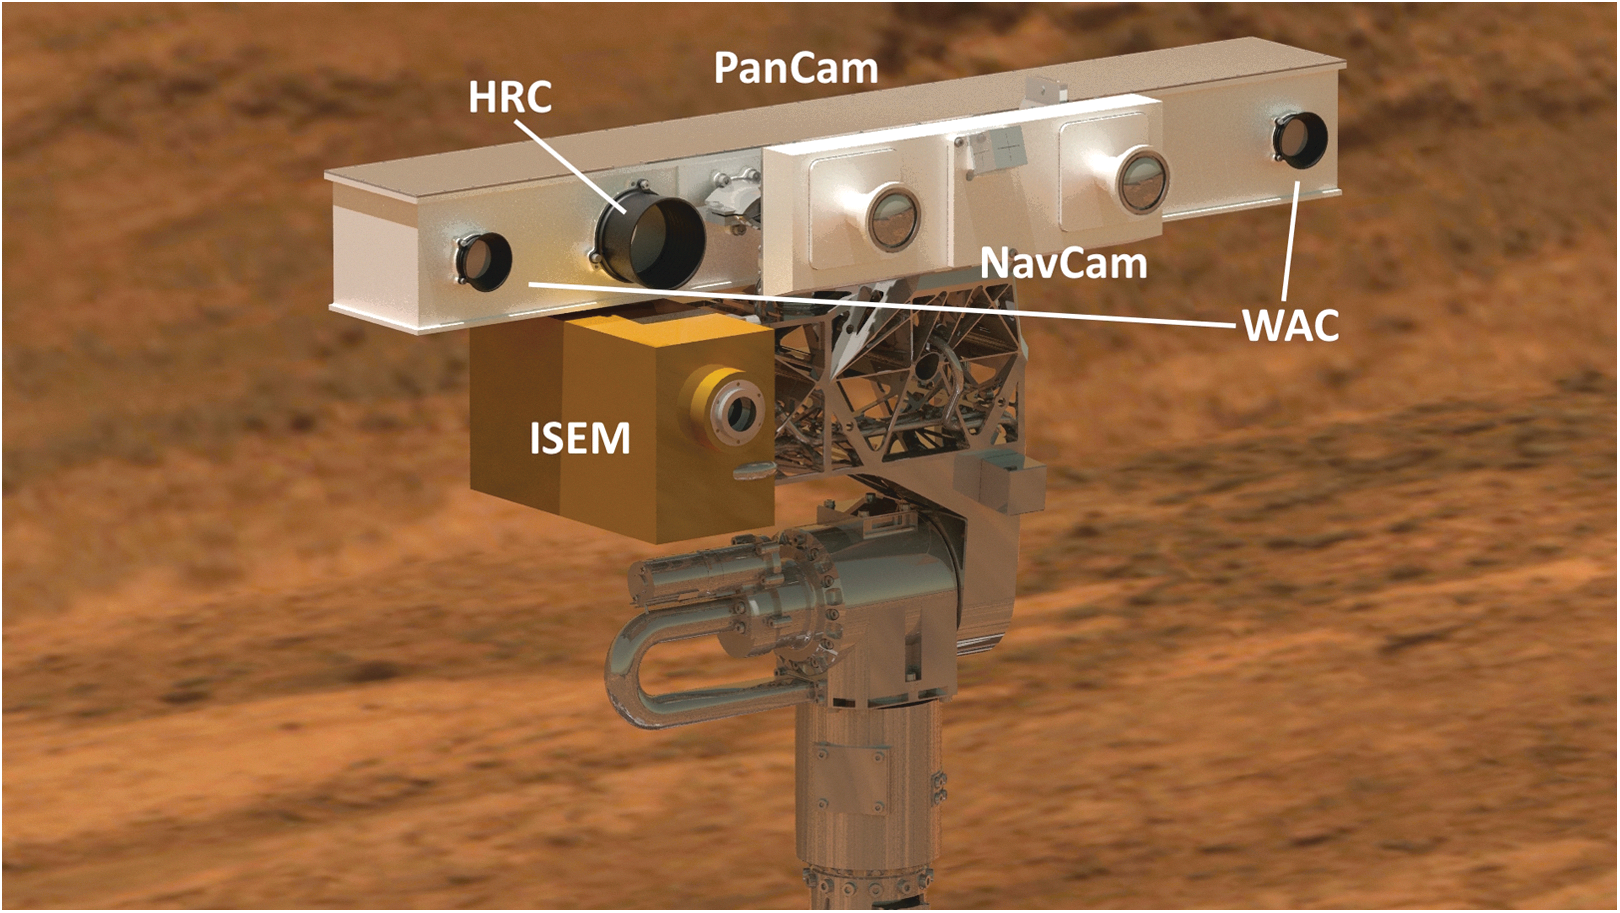
Schematic view of the ExoMars rover mast instruments: PanCam, navigation cameras, and ISEM. ISEM, Infrared Spectrometer for ExoMars; PanCam, panoramic camera.
Infrared reflectance spectroscopy allows the study of the composition in the uppermost few millimeters of a rock's surface. It allows discriminating between various classes of silicates (hydr-) oxides, hydrated/hydroxylated salts, and carbonates. As shown in Figure 2, the 1.3° field of view (FOV) of ISEM lies within the 5° FOV of the color PanCam HRC, and they both are within a much wider FOV (38.6°) of the WACs with multispectral capabilities (Coates et al., 2017). The multispectral data are produced using a filter wheel with 11 filter positions for each of the two WACs. Out of the 22 filters, six are devoted to red, green, and blue broadband color and are duplicated in both cameras. Twelve are optimized for mineralogy in the 400–1000 nm range, and four “solar” filters are dedicated to atmospheric studies. By extending the wavelength range beyond PanCam, ISEM will enable many more spectral features diagnostic of specific mineralogy to be detected. Together, PanCam and ISEM provide spectrally resolved information from 0.4 to 3.3 μm.
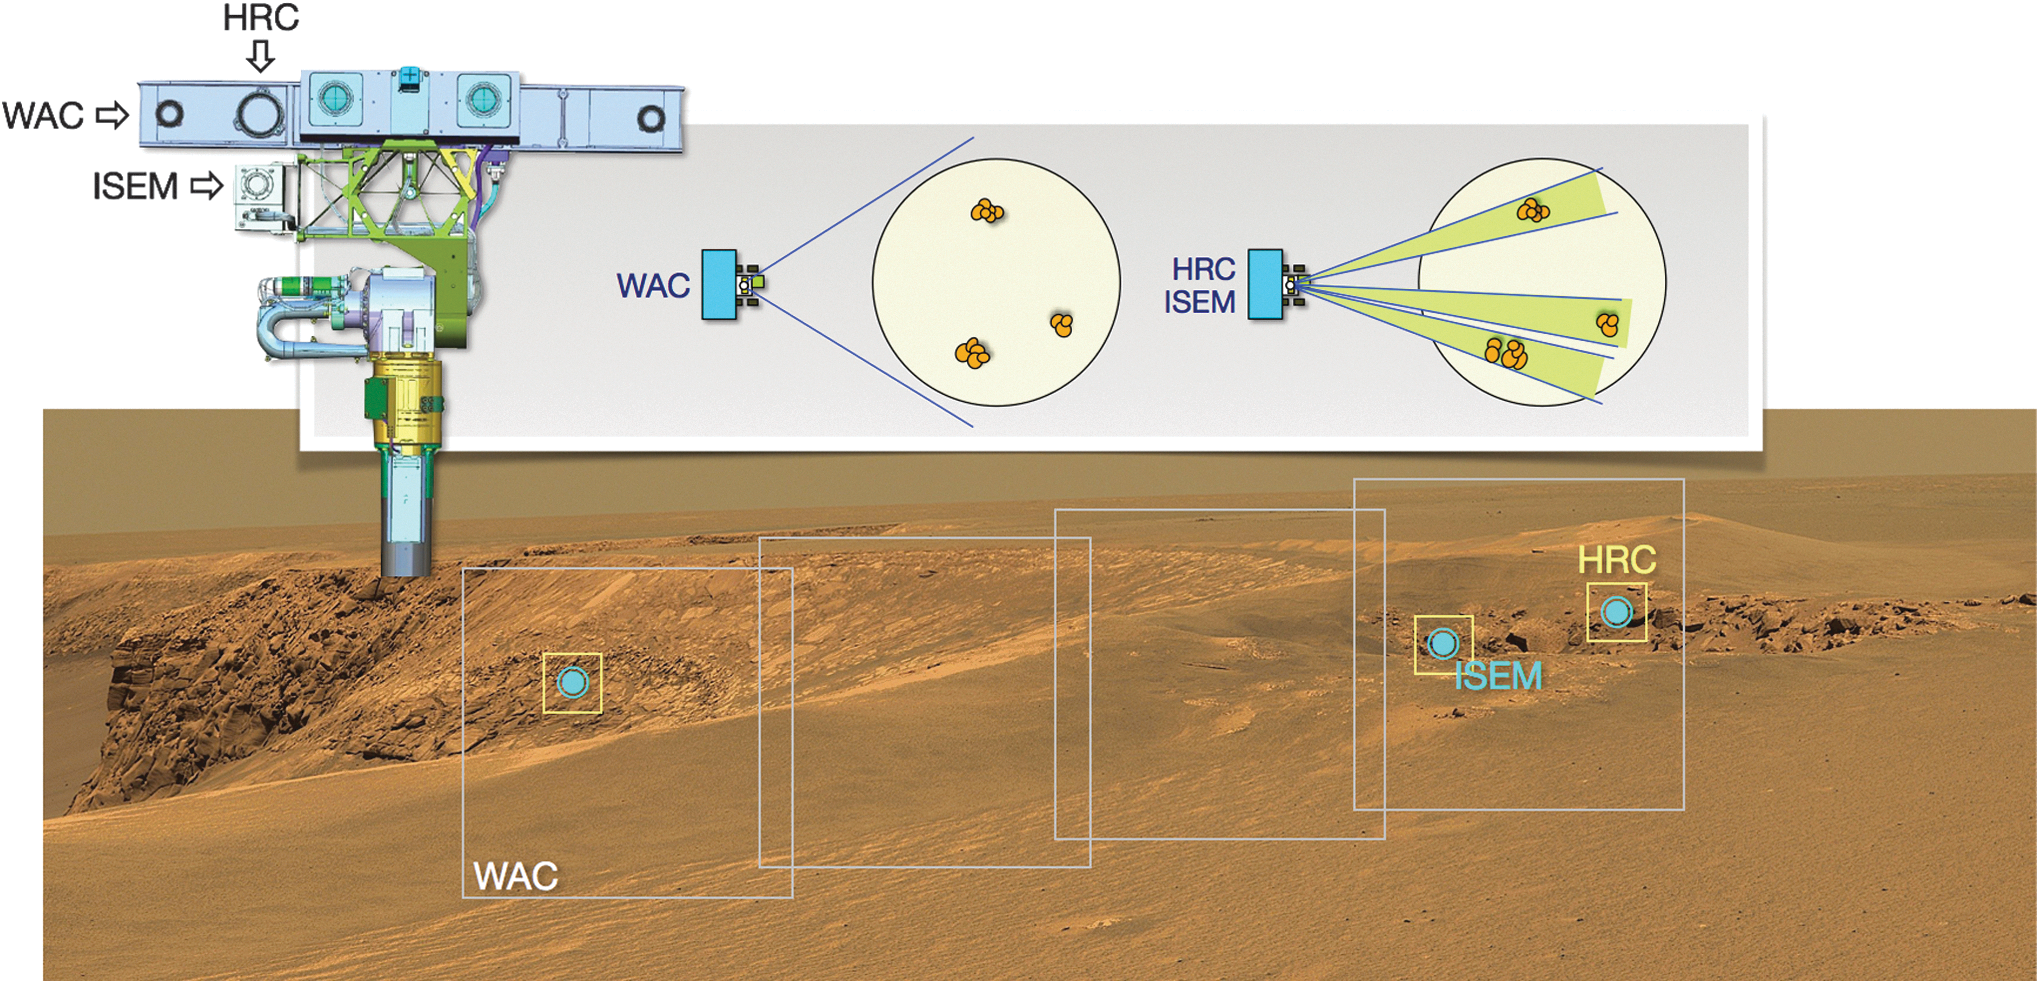
Schematic representation of possible ISEM and PanCam joint observation scenario showing a sequence of ISEM measurements acquired together with WAC and HRC PanCam frames. HRC, high-resolution camera; WAC, wide-angle camera.
The identification and mapping of the distribution of aqueous alteration products in the upper surface layer, combined with subsurface data from the neutron detector ADRON and the ground-penetrating radar WISDOM, will help to understand the subsurface structure and the exobiology potential at each prospective drilling site.
The collected drill samples will be analyzed in the rover's Analytical Laboratory Drawer by several instruments. The first is an infrared hyperspectral microscope MicrOmega (Bibring et al., 2017). The principle of MicrOmega is very similar to that of ISEM. The reflectance spectroscopy is performed in the near-IR, but the analysis is done at the microscopic scale. The sample is illuminated by a monochromatic light source. In contrast to MicrOmega, ISEM has a much wider FOV and range of detection. The distance to a target is not significantly limited, and practically may reach hundreds of meters. Thus, ISEM is better suited for accommodation on the rover mast, where it can be used for target identification of far away objects and also for investigating outcrop, rock, and soil mineralogy at close range.
There is no specific instrument dedicated to environmental characterization on the rover. Although hampered by the limited number of observation cycles, ISEM, jointly with PanCam, will deliver information regarding atmospheric aerosol opacity and the atmospheric gaseous composition. The data on water vapor content and aerosol will be retrieved as a by-product of reflectance spectra, from in-flight calibration, from the direct Sun imaging by PanCam, and from sky observations by PanCam and ISEM.
2.3. The method
Near-IR spectroscopic observations of the Mars surface have not been performed from any surface platform to date. Spectroscopy was used on the Mars Exploration Rovers (MER) in the thermal IR range (the radiation emitted by the surface, 5–29 μm) with the Mini-TES instrument (Christensen et al., 2003, 2004a, b). These remote observations proved very useful for selecting targets for in situ analyses by the alpha proton X-ray spectrometer (APXS) and Mossbauer instruments on Spirit and Opportunity (e.g., Squyres et al., 2004). They also allowed the identification of carbonates in Gusev Crater (Morris et al., 2010) and undertook a number of atmospheric investigations (Smith et al., 2006).
Conversely, the near-IR spectral range (i.e., the infrared solar reflected radiation) is being widely used in orbital observations, as it allows for significantly better characterization of aqueous minerals than does the thermal infrared. To illustrate this point, the TES instrument on Mars Global Surveyor in the wavelength range from 6 to 50 μm has mapped the distribution of both mafic and anhydrous high-silica minerals (Bandfield et al., 2000; Christensen et al., 2001), but could not unambiguously detect clay/clay-like minerals and salts, including carbonates. In the near-IR, the OMEGA hyperspectral instrument on Mars Express (MEx) measured the martian surface reflectance from 0.5 to 5.2 μm and was able to recognize a number of different phyllosilicates and sulfates (Bibring et al., 2006). Building on OMEGA's success, the higher spatial resolution of the CRISM instrument on Mars Reconnaissance Orbiter (MRO), which measures reflectance from 0.362 to 3.92 μm, permitted the first detections of carbonates and serpentine (Ehlmann et al., 2008, 2010). One shortcoming of the orbital observations is the limited surface resolution (300–500 m per pixel for OMEGA/MEx and ∼20 m for CRISM/MRO), which hinders the detection of small-scale exposures. In addition, such instruments suffer from limited detection sensitivity owing to the combination of the subtle nature of aqueous mineral spectroscopic features and to the short dwell time of orbiting spacecraft. The wide variety of minerals on Mars detected by the higher spatial resolution CRISM instrument compared to the lower resolution OMEGA instrument demonstrates the greater mineralogical diversity that can be identified as spatial resolution improves. Therefore, the close-up near-IR capability of ISEM on the ExoMars rover offers a very high diagnostic potential.
The small size and low mass of the ISEM instrument allow it to be accommodated more easily on a rover platform. A similar AOTF-based near-IR spectrometer has been selected to enhance the capabilities of the successor to the ChemCam instrument on the Curiosity rover (Fouchet et al., 2015). The new SuperCam instrument planned for the NASA 2020 rover utilizes a combination of the laser-induced breakdown spectrometer, Raman, and near-IR reflectance spectroscopy, offering complementary elemental and mineralogical analysis techniques.
2.3.1. Spectral range
An optimal spectral range for a near-IR mineralogical characterization is 0.9–4.0 μm to encompass a broad absorption centered in the 0.95–1.1 μm region characteristic for pyroxene or olivine, and 3.4–3.9 μm for carbonate overtones. The spectral range of the prototype LIS is a compromise of science requirements and technical limitations. Its longwave bound of 3.3 μm allows for detection of hydration features in the 3 μm region that can be used to discriminate different types of phyllosilicates and other water/hydroxyl-bearing materials (e.g., Clark et al., 1990). The broad absorption in the 3 μm region has contributions from the long wavelength wing of a hydroxyl (OH) fundamental stretch usually centered near 2.7–2.8 μm, H2O fundamental stretches, and the first overtone of the H2O bending fundamental (Clark et al., 1990). On Mars, hydration is strong enough that it can be detected at shorter wavelengths. Clays and other hydrated minerals can be detected and discriminated from overtones and combination absorption features at ∼1.4, ∼1.9, and 2.2–2.3 μm. Detection of carbonates by ISEM will be possible by using correlated 2.3 and 2.5 μm region bands, similar to CRISM/MRO (Ehlmann et al., 2008). Beyond 3.3–3.4 μm, the signal is complicated by the thermal radiation of the surface (and from the instrument itself, detectors with longer wavelength bound are much less sensitive because of thermal background). On the short wavelength bound, the sensitivity of detectors optimized for 3 μm range falls abruptly below 1 μm, hampering mafic silicate identification and characterization. However, mafic silicates can be recognized and discriminated by the shape of the long wavelength wing of the 1 μm ferrous iron absorption band and the wavelength position of the 2 μm ferrous iron absorption (see the following section for the details).
Taking into account the advantages of the heritage design, we have opted to use the same 1.15–3.3 μm range for ISEM on ExoMars as for the lunar instrument.
2.3.2. Spectral resolution
The spectral features of Mars' surface materials will generally include a mixture of several minerals and are usually broad (>20 nm full width at half maximum), so that there is no stringent requirement on the spectral resolution for orbital instruments (Table 1). With increasing spatial resolution, individual minerals may become more apparent, with deeper characteristic absorption features. Pure minerals can likely be observed only at the scale of individual grains, for example, with the microscope-spectrometer MicrOmega. Given that the ISEM FOV will typically encompass an area of few cm2, a mixture of minerals will likely be present, and therefore, a spectral resolution requirement of 25 cm−1 was chosen that corresponds to 3.3 nm at 1.15 μm, 16 nm at 2.5 μm, and 28 nm at 3.3 μm.
MEx, Mars Express; MRO, Mars Reconnaissance Orbiter.
In mineralogical studies, the best approach is the acquisition of the full available spectral range. Nyquist sampling (two measured points per spectral resolution) of the full 1.15–3.30 μm (3030–8696 cm−1) range with a spectral resolution of 25 cm−1 results in 453 (512 with margin) spectral points. With a 1-s exposure for each spectral point, a complete spectrum is therefore measured in 8.5 min. Customable or random wavelength access by the AOTF (see Section 4.1) allows oversampling, selecting different portions of the spectrum and focusing on the most interesting or diagnostic spectral intervals.
The color and IR reflectance of the Mars surface are what would be expected of iron-bearing mineral species that are either primary or formed by hydrous or anhydrous chemical weathering. The infrared reflectance varies from 5% to 35%, with typical values being 15–20% for low-albedo regions and 25–30% for high-albedo regions (Erard, 2001). A characteristic feature of Mars spectra is a deep absorption feature starting beyond the 2.7 μm CO2 saturated atmospheric band. Its depth reflects the degree of hydration of the martian surface. An increase in measured reflectance toward longer wavelengths signifies an increasing contribution from emitted thermal radiation. Observations from the ExoMars rover mast will be carried out using a broad range of phase angles, preferably at high Sun. There is no Sun avoidance requirement for ISEM.
2.4. Potentially detectable mineral groups
The greatest share of what we know about martian mineralogy has been gleaned from orbital near- and thermal-infrared spectroscopy measurements. The infrared instruments have been successful in identifying igneous minerals, while the near-IR instruments were more important for detecting ancient hydrated minerals, such as phyllosilicates, as well as carbonates and sulfates, which could be used to develop a timeline of changing environmental conditions on Mars and evidence of previous more clement epochs on Mars. The capabilities of ISEM can be gauged against these detections to assess its expected science return, as well as expectations for detecting other mineral species of high scientific value, all in the context of the proposed ExoMars landing sites.
2.4.1. Phyllosilicates
The identification of hydrated phyllosilicates on the martian surface is one of the discoveries driving in situ exploration of Mars. Phyllosilicates are commonly detected in ancient, Noachian-aged martian terrains (Poulet et al., 2005). Various types of phyllosilicates have been observed, including Fe/Mg and Al-rich smectites, micas, vermiculites, kaolinite, chlorite, and serpentine (Ehlmann et al., 2009; Murchie et al., 2009; Carter et al., 2013). The presence of these minerals likely indicates that conditions in the past were favorable for the presence of liquid water at or near the surface. They are considered good reaction templates for organic molecules and excellent for biosignature preservation (Bishop et al., 2013, and references therein). Phyllosilicates have been detected from orbit within the ellipse of two of the three candidate landing sites for the ExoMars rover, Oxia Planum, and Mawrth Vallis (Vago et al., 2017). They have not been detected in Aram Dorsum yet; even if they are there, it may be difficult to see them from orbit. ISEM will have the capabilities to detect sharp features between 1.35 and 2.6 μm in phyllosilicate reflectance spectra, which are related to combinations and overtones of OH-M stretching and bending bound to various cations (M) as well as the H-O-H stretch and bend from water bound in interlayer regions or adsorbed on mineral surfaces (Clark et al., 1990) (Fig. 3a–c).
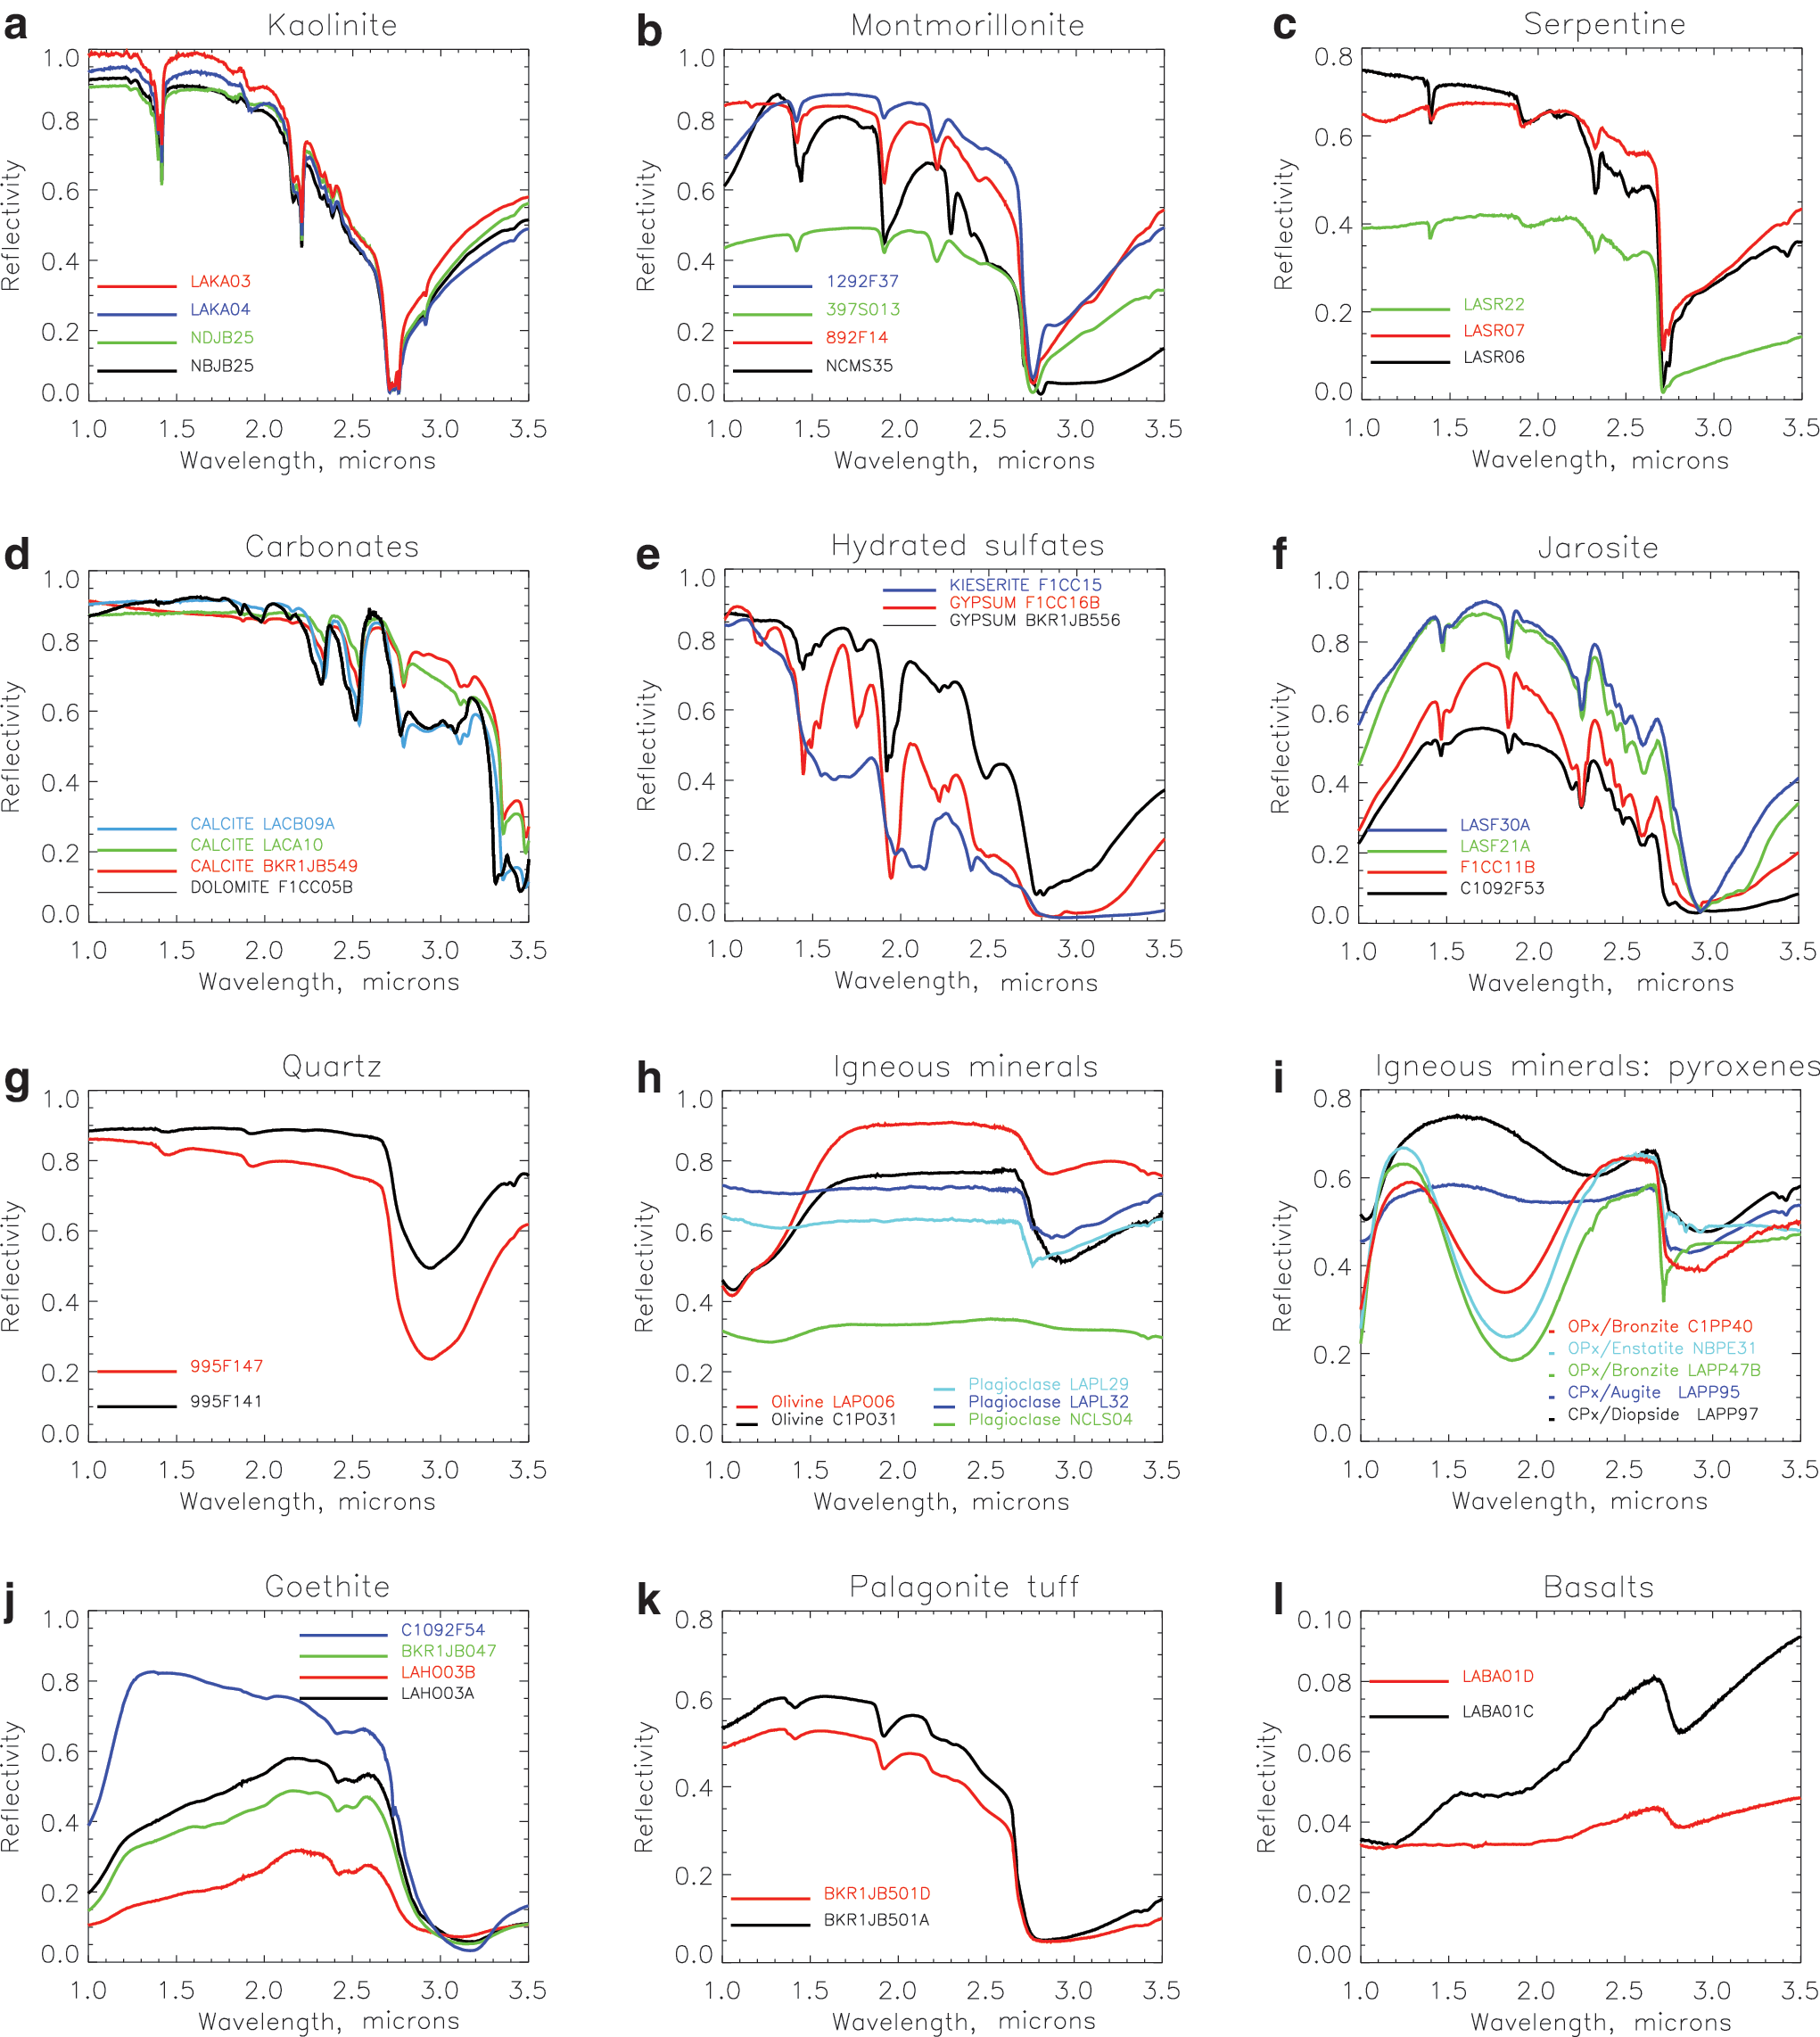
Example spectra of minerals and rocks in the ISEM spectral range, which may be expected at the ExoMars landing sites (from CRISM spectral library,
2.4.2. Carbonates
Carbonates have been discovered on Mars at a number of locations from orbit (Ehlmann et al., 2008; Wray et al., 2016), by surface rovers (Morris et al., 2010), and in martian meteorites (e.g., McKay et al., 1996). The precise species are not always known, but various Mg-Fe-Ca carbonates provide the best match for observed spectral features. Carbonates are important minerals for identification as they often indicate the presence of habitable (circumneutral) environments. They are also widely implicated in explaining the loss of a substantial fraction of the presumed early dense martian carbon dioxide atmosphere. Carbonate detection and characterization are possible in a number of wavelength regions. The 2.2–2.6 μm region is one of the best because it is not affected by thermal emission, and absorption bands in this region vary in their positions for different carbonate species (Fig. 3d). ISEM may also be able to identify Fe-bearing from Fe-free carbonates on the basis of the presence or absence of a ferrous iron absorption band near 1.2 μm.
2.4.3. Sulfates
A number of sulfate minerals have been observed on Mars, both from orbit and in situ, including poorly (≤2 H2O) hydrated species (gypsum, kieserite, bassanite), polyhydrated varieties (Squyres et al., 2004; Gendrin et al., 2005; Wang et al., 2006; Flahaut et al., 2014; Nachon et al., 2014), and hydroxylated species [copiapite, jarosite, alunite, and the dehydrated form of amarantite FeSO4(OH)]. These sulfates are all water/hydroxyl bearing and several are also indicative of circumneutral, perhaps habitable, environments. Sulfates also have the potential to preserve microfossils (e.g., Allwood et al., 2013) and concentrate organic compounds (Noe Dobrea et al., 2016). Specific sulfates can be powerful indicators of environmental conditions on Mars, past and present (e.g., Leftwich et al., 2013). Sulfate discrimination is possible by using a number of wavelength intervals in the ISEM range. For example, gypsum is characterized by a uniquely shaped absorption band in the 1.4 μm region, jarosite and alunite by absorption bands in the 1.8 μm region, and other sulfates by S-O-associated absorption bands in the 2.0–2.5 μm region (Cloutis et al., 2006) (Fig. 3e, f).
2.4.4. Silica
Silica, in a variety of forms, is present in a number of terrains on Mars (Bandfield et al., 2004; Smith and Bandfield, 2012; Bandfield et al., 2013; Carter et al., 2013; Smith et al., 2013). Differences in reflectance spectra can be used to distinguish different forms of silica, some of which are associated with habitability (Rice et al., 2013). The region most useful for distinguishing different forms of silica is located near 2.2 μm and is due to Si-OH overtones. The nature and abundance of these bonds vary among different types of silica (Rice et al., 2013). This diagnostic feature can be clearly seen in the reflectance spectra of two different grain sizes of quartz (Fig. 3g).
2.4.5. Igneous minerals
Petrologic investigations of martian rocks have been accomplished by mineralogical, geochemical, and textural analyses, by remote sensing observations, in situ investigations, and laboratory analyses of martian meteorites. Igneous rocks are found in numerous settings; near-infrared (NIR) spectroscopy from orbiting spacecraft has been an effective mineralogic tool to identify and map at a global scale various rock-forming minerals such as olivines, pyroxenes, and iron-bearing plagioclases (Poulet et al., 2009; Carter and Poulet 2013; Ody et al., 2013) (Fig. 3h, i).
2.4.6. Ferrous oxides/hydroxides
These minerals are the widespread weathering products of primary iron-bearing materials (Ody et al., 2012). In the ISEM spectral range, they manifest themselves mainly in the shape of the continuum. Hydroxides exhibit shallow absorption features, including near 1.41 and 1.93 μm, and several species have been reported from NIR orbital investigations. Some iron-bearing species, such as goethite, exhibit Fe-OH absorption bands longward of the same band in Fe-free minerals (Beck et al., 2011) (Fig. 3j).
Several other potential candidates that are amenable to detection and analysis by ISEM, and are of high scientific value, are described below.
2.4.7. Organic compounds—PAHs
Infrared spectroscopy is potentially sensitive to the presence of organic compounds, which have already been identified in situ, although in trace quantities, within Mars samples (Freissinet et al., 2015). PAHs are generally a stable form of organic molecules, and if organic compounds are or were present on the surface of Mars, they have likely transformed to PAHs (Anders et al., 1996). PAHs are also the dominant form of organic material in Archean terrestrial rocks (Marshall et al., 2007; and references therein). Their reflectance spectra exhibit absorption features that are largely associated with a number of functional groups that may be present, particularly aliphatic C-H molecules (Izawa et al., 2014). They can exhibit absorption bands near 1.69 μm due to CH overtones, 1.50 μm due to N-H stretching overtones, and numerous other overtones and combination bands beyond 2.1 μm. A shoulder of the fundamental 3.2–3.35 μm aromatic band could also be detectable in the spectra, although complicated by a deep 3 μm absorption, which is characteristic for Mars reflectance in general (see discussion at the end of Section 2.4).
2.4.8. Perchlorates and chlorides
Perchlorates are strongly suspected to be present on Mars on the basis of analytical results from the Phoenix lander in the polar region (Hecht et al., 2009; Cull et al., 2010) and from the MSL Curiosity rover in the near-equatorial region (Farley et al., 2016). Perchlorates have been linked both to the destruction of organic compounds and to liquid water. They can absorb atmospheric water and allow for the existence of stable liquid water brines (Martin-Torres et al., 2015). Their spectral properties have been the focus of multiple studies (Bishop et al., 2014; Hanley et al., 2015) since the presence of perchlorates could have strong implications for the (non) preservation of biosignatures. Reflectance spectra are characterized by possible Cl-O-H2O-associated absorption bands near 1.35, 1.75, and 2.15 μm. The 3-micron signature of water is present in IR spectra of perchlorate samples in the form of hydrate, ice, or liquid brine (Zorzano et al., 2009). Spectral features in a more suitable NIR range have possibly been detected from orbit (Ojha et al., 2015); efforts to confirm this are under way. While anhydrous chloride salts are mostly featureless in the wavelength range of ISEM, chlorinated species have been detected in abundance at Mars (Osterloo et al., 2010), and their hydrated forms would be detectable in the NIR (Hanley et al., 2011).
2.4.9. Oxalates
Oxalates are carbon-bearing minerals that, new evidence suggests, may be present on Mars in addition to, or instead of, carbonates (Applin et al., 2015). Terrestrial oxalates are typically formed in biological processes (Applin et al., 2016, and references therein). Their presence on Mars would suggest past habitability and possibly biological processes. Oxalates have some similarities with carbonates in terms of multiple C-O-associated absorption bands, but their wavelength positions and shapes differ from carbonates and can be used to discriminate different oxalate species. Major oxalate absorption bands are present in the 2.2–2.5 and 3.2–3.3 μm regions.
2.4.10. Water ice
The presence of water ice at the landing site during daytime observations is unlikely, but cannot be excluded (Carrozzo et al., 2009). Seasonal frost, if present at the landing site, will be readily identifiable by ISEM, allowing study of its season deposition cycle and dependence on local conditions. Unambiguous signatures of water ice are present in the ISEM wavelength range with diagnostic absorption bands at 1.25, 1.5, 2.0, and 3.0 μm.
2.4.11. Nitrates
Nitrates may have been detected in situ on Mars (Navarro-González et al., 2013). They are important minerals because they may indicate the operation of biological processes and/or can serve as a bioavailable source of nitrogen. Their spectral reflectance properties have recently been studied (Cloutis et al., 2016). The NO3 molecule gives rise to multiple absorption bands that can be detected down to as low as 1.8 μm.
2.4.12. Phosphates
Phosphates are important as a potential indicator of biological processes. They are a likely possibility to explain phosphorus, which has been detected on Mars (Blake et al., 2013), but its form is not yet determined. Their spectral properties are only partially known (Lane et al., 2011). They share some similarities with some other mineral groups, including ferrous iron-associated absorption bands in the 1 μm region and weak P-O absorption bands in the 2–2.5 μm region. Robust phosphate detection by ISEM may not be feasible.
2.4.13. Borates
Borates are another important mineral group that can be associated with habitability and biological processes (Stephenson et al., 2013). Boron cannot be detected with an APXS instrument (Cloutis et al., 2016), but it has been detected and quantified in clays from martian meteorite MIL090030 (Stephenson et al., 2013). Borate deposits on Earth are often associated with enclosed evaporitic deposits and might be present in association with martian chlorides and sulfate salts. Borates exhibit B-O-associated absorption bands in the 1.55 and 2.15–2.25 μm regions, enabling their detection using multiple wavelength intervals and absorption features measurable by ISEM. Absorption band positions and shapes vary between different borates.
2.4.14. Ammonium-bearing minerals
The presence of the ammonium (NH4) molecule in various minerals leads to strong absorption bands in the 1.6, 2.0–2.2, and 3.1 μm regions. Band shapes and positions can be used to discriminate different ammonium-bearing minerals (Berg et al., 2016). Ammonium-bearing minerals are of astrobiological importance for a number of reasons. Ammonium is often of biological origin, has high thermal stability, and can withstand some level of metamorphism (Boyd, 2001). Ammonium-bearing minerals on Mars have possibly been detected from spectroscopic observations made from orbit (Sefton-Nash et al., 2012), and a nitrogen cycle on Mars has been suggested to operate (Manning et al., 2008). Low concentrations of ammonium in soil have been reported for the Phoenix landing site (Quinn et al., 2011).
One of the limitations of spectrally characterizing Mars-relevant minerals with ISEM under ambient terrestrial conditions is that these mineral spectra display a nearly ubiquitous, broad, and frequently deep absorption feature in the 3 μm region. This is normally attributable to water that may be present in various forms, including adsorbed, fluid inclusions, impurities or accessory phases, or due to incipient alteration. This feature is normally seen even in nominally anhydrous minerals, such as olivine and pyroxene (see Fig. 3h, i; more examples of Mars background material spectra are presented in Fig. 3j–l). When such minerals are exposed to Mars-like surface conditions, the 3 μm feature commonly shows a reduction in both depth and width, but rarely disappears completely (Cloutis et al., 2007, 2008). It may be possible to use characteristics of the 3 μm absorption feature to constrain or determine water content (Milliken and Mustard, 2005), but in multicomponent targets, such determinations will be more difficult. Small amounts of water in the near subsurface and on the surface of Mars also seem to be ubiquitous, displaying seasonal variations (Milliken et al., 2007). Collectively, these results suggest that the 3 μm region may not be best suited for mineralogical determinations using ISEM. However, as discussed above, other wavelength regions accessible to ISEM have significant diagnostic potential for a wide range of minerals, as demonstrated effusively from terrestrial and Mars orbital studies.
2.5. Atmospheric studies (aerosol, gaseous content)
There is no dedicated instrument, such as a meteorological station on the ExoMars rover, to characterize the environmental conditions. Therefore, any information available by other means is of particular value. Spectrally resolved data in the visible-NIR and in the thermal IR ranges have been used to assess the atmospheric state from Mars Pathfinder and MERs. In the spectral range of ISEM, there are absorption bands of atmospheric CO2 (at 1.43, 1.6, 2.0, and 2.7 μm) and H2O (at 1.38 and 2.56 μm), and it is well suited, in particular its short-wave subrange, to characterize the main mode of the martian dust (Fedorova et al., 2014). The condensation clouds in the equatorial region consist predominantly of water ice (Vincendon et al., 2011), with multiple absorption bands within the ISEM spectral range (Section 2.4). Carbon dioxide clouds, if present at high altitudes, may be detected by distinct features of solid CO2 near 1.2, 1.4, 1.5, 2.0, 2.7, and 3.0 μm.
The gaseous absorptions will be measured by ISEM as a by-product of every surface measurement. Depth of the CO2 absorptions can be used to determine the surface pressure, and the H2O absorptions quantify the total column water contents in the atmosphere above the site. To disentangle the possible overlapping atmospheric and mineral features in the reflected surface spectra, preferentially the observations of the in situ calibration target will be interpreted. The estimate of accuracy to retrieve the atmospheric pressure by ISEM is given by the OMEGA study of the 2 μm CO2 absorption from the orbit: 7–10 Pa (∼1%) 1-sigma (Forget et al., 2007). With the optical path being half of the OMEGA case, our retrieval accuracy will be comparable.
More precise measurements of surface pressure, minor gases, and better characterization of the atmospheric dust and cloud situation by ISEM will be possible using dedicated atmospheric observations. They will be coordinated with those by PanCam. The PanCam atmospheric study (Coates et al., 2017) will include direct solar observations just before sunset (to take advantage of the maximal atmospheric path lengths) and cross-sky brightness measurements. Such observations, for example, performed with Mars Pathfinder camera (Markiewicz et al., 1999; Titov et al., 1999) or MERs (Lemmon et al., 2004; Smith et al., 2006) can be significantly strengthened by extending the spectral range to the near-IR.
Direct solar observations by ISEM are not so far in the baseline. Their implementation would allow for high-accuracy pressure and water retrievals, better optical characterization of dust, direct and localized detection of H2O ice and, if present, the CO2 ice clouds. Observing the Sun at different zenith angles helps putting constraints on the vertical distribution of water vapor. However, ISEM is optimized for weak reflected light, and measuring the direct Sun signal may not be feasible. We successfully tested this possibility with the lunar prototype, but the ISEM aperture is larger, and a solar-blind filter within the foreoptics might become necessary. Such a filter would cause a several percent signal loss for the baseline ISEM observations. A final assessment of the direct Sun mode will be done during the characterization of the flight model.
The cross-sky brightness measurements by ISEM are the best suited for characterizing the aerosol component of the Mars atmosphere. Because of quasipermanent aerosol loading, the brightness of the martian sky at low zenith angles is not significantly lower than that from light scattered from the surface. Measurements at a range of phase angles will allow the science team to extract the size distribution and optical properties, and even assess the shape of aerosols suspended in the atmosphere. Water vapor absorption at 2.56 μm is much stronger than that at 0.94 μm to be observed by WAC in solar filters, and the ISEM data might put additional constraints on the vertical distribution of water in the boundary layer of atmosphere.
The variety of atmospheric measurements by ISEM calibrated by using an in situ calibration target will allow the refinement of atmospheric scattering models and therefore refinement of the calibration of orbital spectral measurements of the martian surface.
3. Instrument Description
3.1. Instrument concept
The measurement principle of ISEM is based on the use of an AOTF. The core element of an AOTF is a birefringent crystal (typically of paratellurite, TeO2, due to the combination of acoustic and optical properties) with a welded piezotransducer. The radio frequency (RF) applied to the transducer generates an acoustic field in the crystal, implementing acousto-optic interactions in Bragg's regime. The spectral selectivity of the acousto-optic diffraction allows the filtering of light. The diffraction occurs for a single wavelength, and there are no diffraction orders. The applied RF controls the tuning of the AOTF. AOTFs are technologically mature and widely used for spectral analysis. The robust design, small dimensions, and mass, coupled to the absence of moving parts in an AOTF-based spectrometer, make them popular for space applications. So far, AOTF-based spectrometers have been used in space science in the following ways: (1) to study the atmospheric composition of Mars and Venus (Korablev et al., 2006, 2012); (2) on the Moon within the Chang'e-3 VNIS spectrometer (0.45–2.4 μm) mounted on the Yutu rover (He et al., 2014); (3) for isolation of Echelle-spectrometer diffraction orders in high-resolution instruments (Nevejans et al., 2006; Korablev et al., 2011, 2014; Neefs et al., 2015); and (4) to illuminate the sample of an IR microscope with monochromatic light (Pilorget and Bibring, 2013; Bibring et al., 2017).
Wider application of the AOTFs in remote sensing is hampered by the inherent requirement to sequentially scan the spectrum. On an orbital mission with a short dwell time, this scanning interferes with the spacecraft or line of sight motion, complicating the analysis. Even for a pencil-beam device, different parts of the acquired spectrum would correspond to different observed areas. Conversely, observations from a static point, such as a planetary lander, or a rover, which remains immobile during the measurement, are well suited for AOTF-based instruments.
As described in Section 1, ISEM is a close equivalent of LIS, which is being developed for two Russian lunar landers. The LIS development is more advanced with respect to that of ISEM—by about 2 years. LIS benefited from the experience gained from the pencil-beam spectrometer design of the Mars Express and Venus Express instruments, and from the early developments of MicrOmega. The SPICAM-IR AOTF spectrometer with the spectral range of 0.9–1.7 μm (Korablev et al., 2006) has been operating in Mars orbit since 2004. A similar SPICAV-IR instrument using a double-range AOTF operated in Venus orbit from 2006 to 2014 (Korablev et al., 2012). A double-range AOTF for the spectral range of 0.7–4.1 μm serving as a prototype to the LIS and ISEM AOTFs was developed for the Phobos-Grunt mission (Leroi et al., 2009).
To reduce the influence of the extreme temperature conditions at the rover's mast on the electronics, the instrument is implemented as two separate boxes, a mast-mounted optical box (OB) and the electronics box (EB) (Fig. 4). The thermally stabilized EB is mounted within the rover's body. The parameters of ISEM are summarized in Table 2.
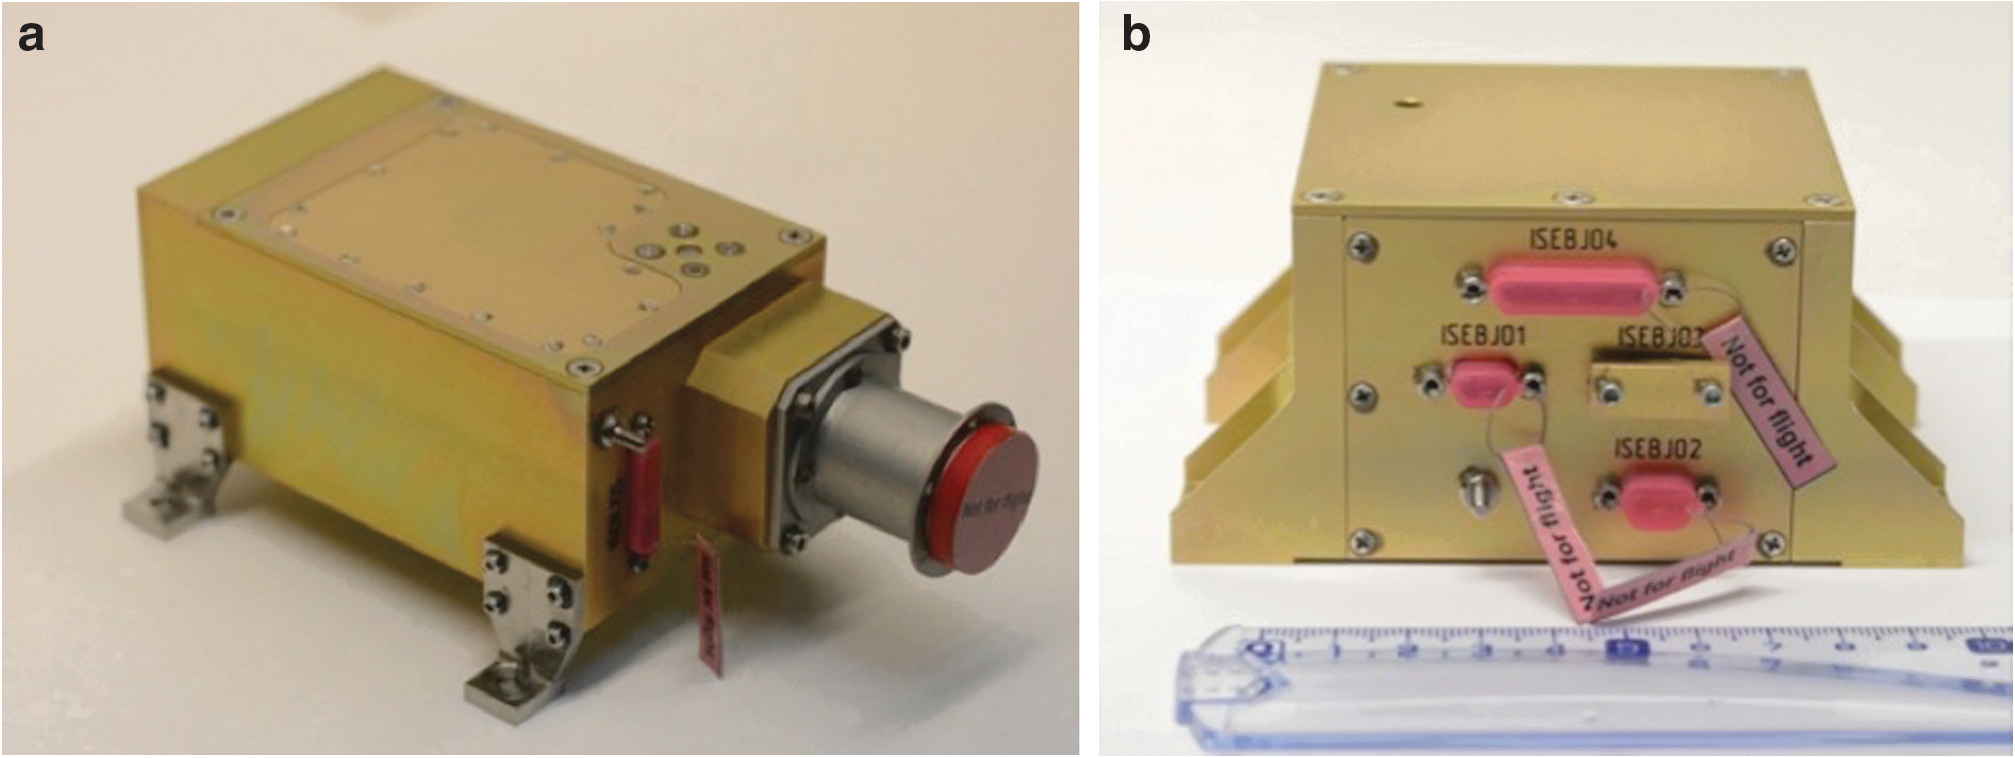
The ISEM instrument, the photographs of the optical
ADC, analog-to-digital converter; AOTF, acousto-optic tunable filter; EB, electronics box; OB, optical box; RF, radio frequency; TAS-I, Thales Alenia Space-Italy.
3.2. The optical box
Although most of the electronics are in the EB, some electronics such as the detector's preamplifier and the RF conditioning electronics remain in the OB. Neither the weak photodiode current nor the power RF can be transmitted via the 5-m harness. The block diagram of ISEM is presented in Figure 5.
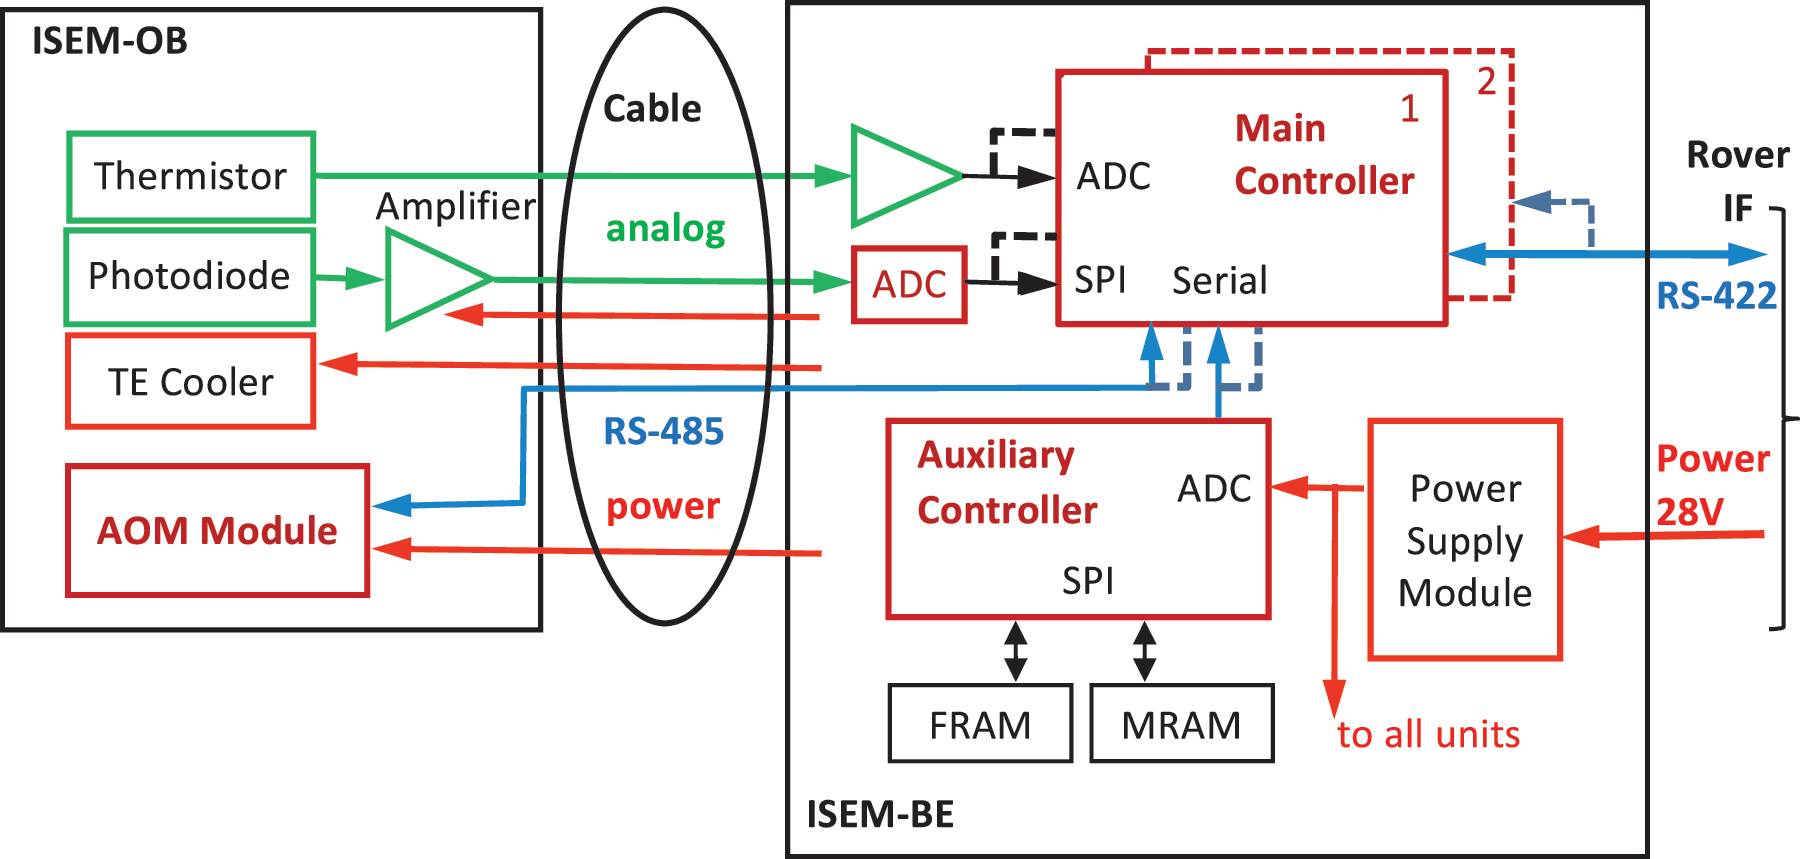
The block diagram of the ISEM control electronics.
The OB contains all the optical elements, the AOTF with associated electronics (ultrasound frequency synthesizer and amplifier boards), the photo detector, and the photo detector board (Fig. 6).

The three-dimensional model open view of the ISEM optical box. The main elements are visible: 1-baffle, 2-entry optics; 3, 7-AOTF collimating optics; 4, 6-polarizers; 5-AOTF crystal; 8-detector; 9-detector's preamplifier; 10-AOTF RF proximity electronics. AOTF, acousto-optic tunable filter; RF, radio frequency.
The spectrometer is built following a standard layout for an AOTF spectrometer, with the AOTF in the path of a quasiparallel beam. The optical scheme is based on a Galileo system with remote pupil built using CaF2 and ZnSe lenses, and it is presented in Figure 7. The image is transferred through the optical system, and the FOV of 1.3° is formed on the detector-sensitive area. The achromatic lens entry telescope (1) has the aperture of 25 mm. The AOTF crystal (5) is placed in a quasiparallel beam between collimating lenses (3, 7) and a pair of polarizers (4, 6); the output collimating lens (8) serves also as a focusing optic for the detector (8).

ISEM optical scheme. The numbering is the same as in Figure 6: 2-foreoptics; 3, 7-AOTF collimating optics; 4, 6-polarizers; 5-AOTF crystal; 8-sensitive area of the detector.
A wide-angle AOTF from NII Micropribor in Zelenograd, Russia, is manufactured on the base of a tellurium dioxide crystal. The ultrasound frequency range of 23–82 MHz provides a spectral range from 1.15 to 3.3 μm with two piezotransducers. The transducers operate in the subbands of 23–42 and 42–82 MHz. The crystal cutoff angle is 12.5° in the (110) crystallographic plane. The anisotropic Bragg diffraction regime is used. The incident optical radiation has ordinary polarization, and the diffracted optical beam has the extraordinary polarization. The angle between the passed and diffracted optical beams is 6° at the output of the AO crystal. A pair of polarizers with crossed polarizing planes is used to filter out the nondesired zero diffraction order.
The AOTF and its electronics are assembled in a single functional unit, which includes the acousto-optic cell, the polarizers, a proximity RF matching board, an RF synthesizer, the driver of the AO crystal (the RF power amplifier), and a dedicated internal microcontroller, which communicates with the main controller (MC) in the EB and controls all the functions of the acousto-optic module (AOM). Commands define magnitude and frequency of the RF signal applied, as well as the RF driver ON/OFF states. Within the RF range of 23–82 MHz, the minimum step of frequency sweeping is 10 kHz (5900 frequency points). The RF amplitude may be set at 1 of 16 even levels. The AOM transmits back to the MC a few housekeeping parameters, such as measured RF voltage and AO crystal temperature. The MC and the AOM are connected via an RS-485 interface running at a speed of 115.2 Kbit/s.
During the measurement, the RF level is being alternated between ON and OFF states, with the cadence being defined by integration time. The measured signal is then processed as the AC allowing to remove offsets caused by the detector's dark current and stray light, and improving the dynamic range of the instrument.
The detector is a single-pixel InAs thermoelectrically cooled photodiode. A detector module J12TE3-66D-R01M from Teledyne Judson Technologies is used. The built-in three-stage thermoelectric Peltier cooler maintains a detector temperature of about 90°C below that of the hot side. For the ISEM OB operating in the range from −10° to +30°C, it results in the detector's temperature ranging between −100° and −60°C, the corresponding detector's shunt resistance is therefore 60–400 kOhms. The temperature of the sensitive area is monitored by a built-in thermistor.
The detector's photocurrent is amplified with a two-stage circuit. The first stage is a transimpedance amplifier, AC coupled (1-s time constant) to the second stage. The second stage has a gain of 83 and a time constant of 80 μs and is based on an ADA4610 (Analog Devices) operational amplifier characterized by low current and voltage noise (50 fA Hz−1/2, 7.5 nV Hz−1/2). Its output signal is transmitted via the harness to the electronics box.
3.3. The electronics box
The EB is mounted inside the rover at the rear balcony, and it is thermally stabilized. It includes the ADC, the main and auxiliary controllers, power conditioning (power supply unit, PSU), and the interface and bridge boards, which support RS-422 communication between the ISEM and the rover data and command system.
The two ISEM blocks are connected via a 5-m harness running from the inside of the rover to the mast. It is fabricated by Thales Alenia Space-Italy (TAS-I). The cable includes the analog signals from the detector and the thermal sensor, the power supply lines, and a digital RS-485 connection to control the AOFT RF synthesizer and the power amplifier.
The MC located in the EB commands the operation of all modules of the instrument. It uses an MSP430FR5739 Texas Instruments circuit running at 19.68 MHz. The controller is equipped with 1 kB of RAM and 16 kB of ferroelectric memory (FRAM) used for program and data storage. Compared to commonly used FLASH memory, the FRAM has better radiation immunity. A 10-bit internal ADC of the MC is used to digitize the signal from the detector's thermistor.
The main ADC serves to digitize the signal from the detector, amplified in the OB. A 16-bit ADC (ADS8320; Texas Instruments) is used. The full-scale range of the ADC is 2.9 V and the peak-to-peak noise is 3 LSB (22 μV RMS). The MC receives the ADC output data via a serial interface operating at 2 Mbit/s. The preamplifier and the ADC contribute little to the total noise in the signal path, and thus, the Johnson noise of the detector controls the limit of signal detection.
The auxiliary controller, based on C8051F121 Silicon Laboratories circuit operating at 12.25 MHz, incorporates a 12-bit ADC and serves to monitor power supply voltages and dispatch the operation of different memory devices. In all, ISEM uses two built-in FLASH memories within the microcontroller and two external chips of FRAM and magneto-resistive memory (MRAM).
The two microcontrollers hold four identical copies of their firmware in program memories. At the start of operation, the controllers check the copies, repair damaged ones, and run a validation program. To increase its reliability, ISEM contains two redundant MC units. After turning on, first the MC1 is powered. Its sequence, if performed correctly, commands the PSU to keep power at MC1. If not commanded in 5 s, the PSU automatically powers on the MC2, and so on.
The rover onboard computer (OBC) controls ISEM operations via RS-422 interface. There are two (nominal and redundant) RS-422 links. Communication via only one of the links is available at a given time. The baud rate is 112.179% ± 1% Kbit/s.
3.4. The calibration target
To determine the incident solar illumination spectrum for deriving I/F data and to verify the in-flight performance and stability of the instrument, ISEM will observe the radiometric calibration target before each measurement. The target is used for the in-flight radiometric calibration of both PanCam and ISEM and will be located on the front deck of the rover as shown in Figure 8. At this location, it will be interrogated by ISEM from a distance of 1.1 m at an emittance angle of 24°. The calibration target occupies an area of 67 × 76 mm2 and has a mass of 40 g.

PanCam and ISEM calibration target and its location on the rover. Larger circles (Ø30 mm) are for both ISEM and PanCam. The smaller circles (Ø18 mm) and the shadow posts will be used by PanCam only.
The target includes eight stained glass diffuse reflectance calibration patches with different spectral reflectance properties. Two of these calibration patches will be used by ISEM—the “white,” which has a reflectance near 100% in the 0.4–3.0 μm spectral range, and the multiband patch, which has distinct spectral features. The white patch is manufactured from Pyroceram provided by the Vavilov State Optical Institute in St. Petersburg, and the multiband patch is manufactured from WCT-2065, a rare earth doped glass manufactured by Schott and supplied by Avian Technologies in the United States. The calibration patches will be calibrated for absolute total hemispherical reflectance and bidirectional reflectance distribution function, and all measurements will be traceable to photometric standards.
Dust deposition on the radiometric calibration target during the ExoMars mission will be accounted for in the data processing by developing a model of the calibration target and dust system, which will build on the results of previous missions, measurements of settling rates on the rover panels, solar arrays, and so on (Kinch et al., 2007, 2015), and from PanCam calibration results.
4. Measurement Scenario
4.1. The experiment cycle
The experiment cycle consists of one spectrum measurement by ISEM. It is explained in Figure 9.
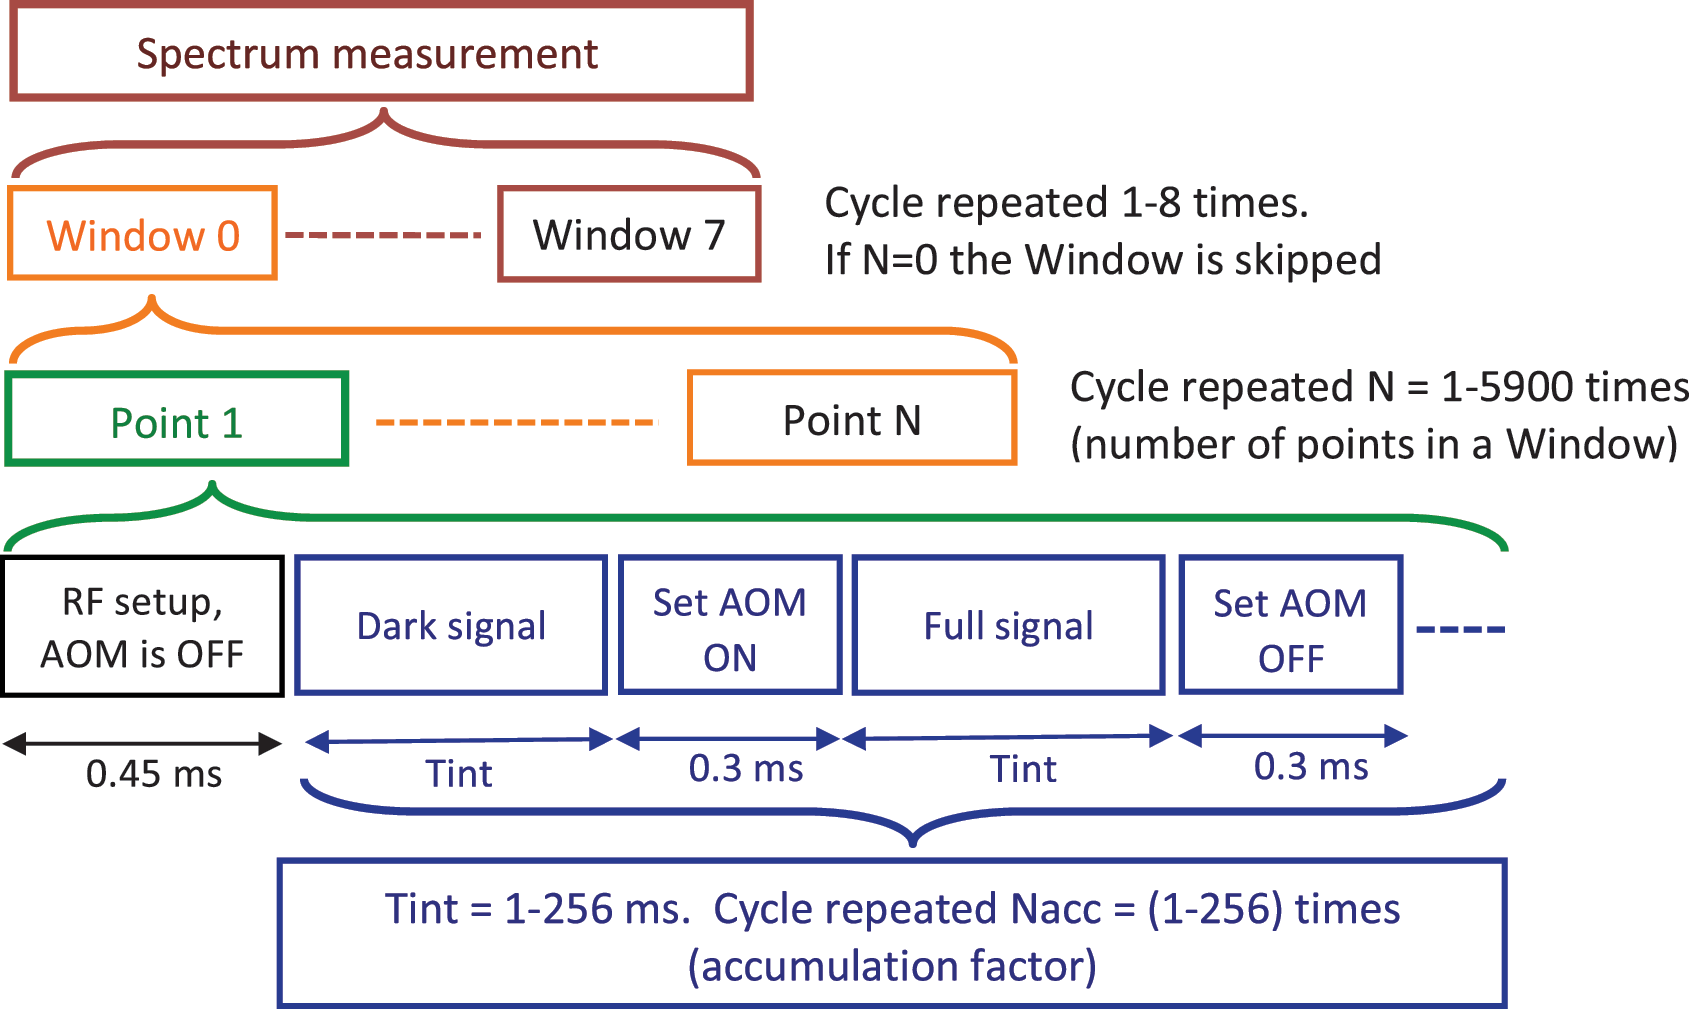
A diagram showing timing and breakdown of one spectrum measurement.
To eliminate the dark signal of the detector and any possible stray light signal, the instrument measures photocurrents when the AOTF RF is OFF (the dark signal) and when it is ON (the full signal). A subtraction of the two values gives the true signal corresponding to the spectrally filtered radiation on the detector.
During both the ON and OFF states, the main ADC continuously samples signals at a 20 kHz rate. The MC stacks all the measured values and makes the ON–OFF subtraction. This elementary measurement can be repeated up to 256 times (“accumulation factor” parameter), effectively increasing the integration time. All resulting values are stacked as well. Each elementary measurement includes a dead time of ∼0.6 ms needed to turn the AOTF ON or OFF. These overheads are mostly the result of remote commanding of the AOM in the OB, but also include two 0.12 ms transients in the AOTF. An additional dead time of 0.45 ms is needed to change the RF. The integration time, variable between 1 and 256 ms, and defining the ON/OFF timing, and the number of repeated ON/OFF cycles for a given RF value (the accumulation factor), are set by a command.
As discussed above, the measurement time is a critical factor. To achieve flexibility in spectral sampling, up to eight “windows” can be defined for one measurement of a spectrum. Every window can be placed anywhere in the AOM frequency range, and it has its own number of spectrum points, frequency steps, and accumulation factors.
During an elementary measurement, the 16-bit ADC readings add up to a 24-bit value, and further accumulation, up to 256 times, results in a 32-bit value for each spectrum point. Only 16 bits out of it are used such that three options are available as follows: (1) transfer merely the 16 LSBs, (2) transfer 16 bits starting from a certain bit to remove noise, or (3) normalize within one spectrum so that the maximum fits exactly within 16 bits. In the latter case, the risk is that an errant spike distorts the entire spectrum.
The exchange of commands between ISEM and the OBC proceeds as follows: The OBC transmits a command (TC) and rover elapsed time (RET). The TC defines ISEM operation parameters and triggers the spectrum measurement. The RET command synchronizes ISEM internal time. In the course of operation, the ISEM sends scientific and housekeeping packets to the OBC, and these data are stored into the OBC memory.
4.2. Operations on the surface
ISEM operations over the course of the Reference Surface Mission are intimately connected to those of the mast and PanCam. All operations are to be guided by the mast's pointing. Three basic operating regimes have been identified, which include the following:
(1) Operations to support sampling
ISEM will work in parallel with PanCam, as shown in Figure 2. First, the WAC observes an area panoramically, and then, the HRC is pointed to the most interesting spots. The spot must be illuminated by direct sunlight. At least one ISEM spectrum is planned to be acquired together with every HRC image, and ISEM measurements may also be conducted separately. The ISEM data will be used to characterize the mineral composition. Sometimes ISEM will be used together with the WAC “geology” filters; however, full analysis with the PanCam WAC geological filters is slower and produces much more data, so this capability cannot be used regularly.
(2) Operations to assess the geological value of targets
A number of geologically interesting scenes may be distant from the planned rover track or inaccessible for rover sampling, such as crater rims and outcrops. Remote characterization is the only possibility in this case. ISEM will be operated in the same manner as in the first case. There is no theoretical limit on the sounding range provided the illumination conditions (including the phase angle) are acceptable. For instance, illuminated hill slopes may be observed from dozens of km. This mode could be used for rover orbiter coordinated measurements and validations. For a favorable scene, ISEM may provide cross-validation over the area covering multiple CRISM pixels. A practical limit for scene observations is determined by the ISEM FOV, an ∼1-m spot is observed from a 44-m distance.
(3) Dedicated environmental operations
ISEM data may be used to characterize atmospheric humidity and aerosol loading. Some information will be obtained as a by-product of geological measurements intermitted with observations of the calibration target. The information about the gaseous atmospheric absorption will be assured by dense spectral sampling of the appropriate spectral intervals. Aerosols are best characterized by cross-sky observations. Plans for the PanCam WAC include direct Sun observations and cross-sky viewing atmospheric campaigns. As discussed in Section 2.5, the ISEM capability to observe the direct Sun is not confirmed. At the same time, following preliminary laboratory characterization, we do not expect any operational constraints placed by ISEM on PanCam solar imaging.
In the case of cross-sky imaging, the ISEM line of sight will be oriented above the horizon, and a special ISEM data acquisition sequence will be implemented. The HRC measurements are not needed, and ISEM will observe in parallel with WAC. The elevation and phase angle for these measurements need to be carefully planned, targeting as much as possible a range of phase angles for WAC and detectable scattered signal in the IR for ISEM.
4.3. Resources required
ISEM data volume is relatively small. One spectrum is only 2 kB in size (Table 2 and Section 3). The factor most affecting the rover operations is the measurement time. Fixed surface platforms are better suited for lengthy operations, generally allowing significant accumulation of measurements. However, sequential acquisition of spectra effectively increases the recording time, and as a result, required measurement times become an important factor for the rover operation cycle.
The allocated duration of measurements is from 2.5 min (minimum case) to 8.0 min (optimal case) for a single target. During the whole sequence, ISEM will consume ∼12 W, requiring an energy of 0.5–4.4 W per hour. As described in Section 3.4, the length of the spectrum, or the number of points in the spectrum, can be selected. For a “geology” target, we will always measure across the full spectral range of ISEM, which may be divided into 1–8 intervals with different sampling. The total number of points in one spectrum will vary between 256 and 1024. Within the spectral range, some portions of the spectrum will be measured more accurately, where, for example, a narrow mineral absorption feature or important atmospheric absorption is expected, while other portions of smooth continuous character can be undersampled.
4.4. Measurement performance, examples, comparison with state of the art
As the full working prototype of ISEM has not been built yet, the performance of the instrument was verified by using the closest prototype, the qualification model of LIS for the Luna 25 lander. The ISEM hardware involves some improvements with respect to LIS, including better optical throughput (and a more sensitive detector featuring the three-stage Peltier cooler). The spectral properties of the AOTF remain the same.
4.4.1. Spectral range and spectral resolution
The bounds of the spectral range were verified by using He-Ne 1.152 and 3.39 μm laser lines. The theoretical shape of an AOTF spectral instrument function is close to sinc2 x. Side lobes of this function modify the measured spectrum, but this could be readily accounted for once the bandpass is properly characterized. More dangerous are distant side lobes, which manifest themselves as a sort of stray light and may reduce the apparent depth of spectral features. More discussion on this aspect of AOTF characterization may be found in the work of Korablev et al. (2013). The measured bandpass transmission function of the ISEM prototype is shown in Figure 10a. The evolution of the resolving power λ/Δλ through the spectral range measured at multiple wavelengths when using light sources with sharp emission features (different He-Ne laser, single-mode laser diodes, and low-pressure gas-filled lamps) is shown in Figure 10b.

A simulation measurement of a mineral spectrum of a Mars analogue by LIS prototype is presented in Figure 11. Crystalline gypsum was manually ground and sieved to obtain ∼1-mm grains, and the resulting sample was illuminated with a 150-W halogen lamp from a distance of 18 cm. The full time to measure this spectrum was 30 min, and the effective exposure to measure one spectral point was 1 s in the long-wave AOTF subrange and 0.6 s in the short-wave subrange. The spectrum shown is normalized by a spectrum of a Lambertian screen (metal surface covered by special reflective coating). The differences between the library and measured spectra might be attributed to different origins of the samples; the difference between the laboratory Fourier-transform spectrometer (FTS) and ISEM spectra is likely due to different observation geometries.
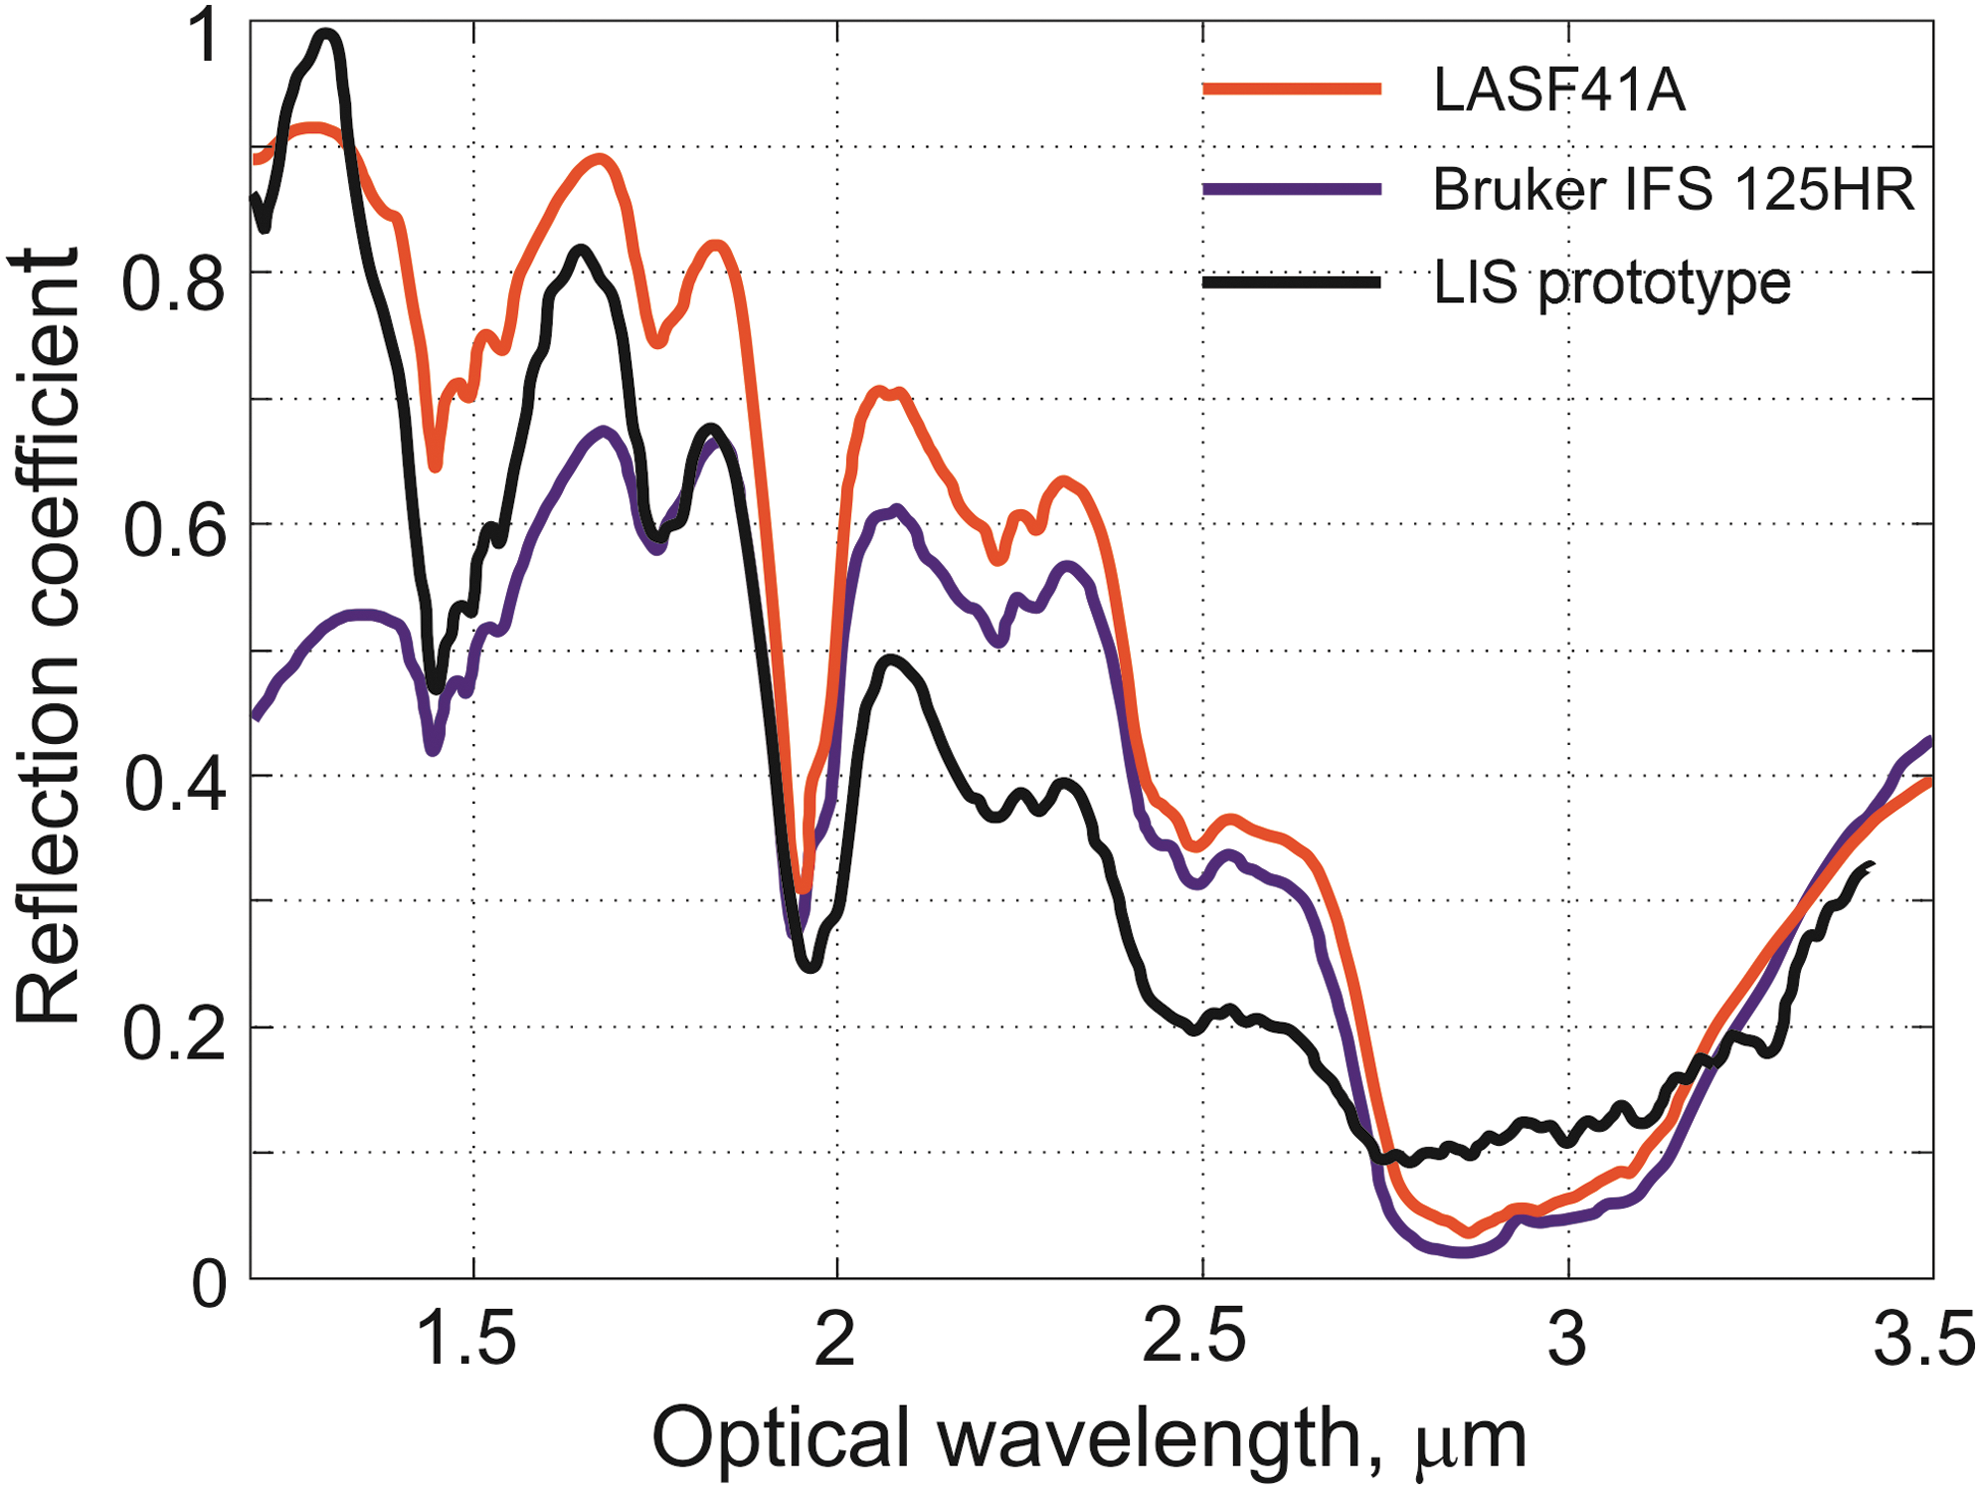
A reflectance spectrum of crystalline gypsum measured by the closest equivalent of ISEM: LIS qualification prototype and a laboratory FTS spectrometer (Bruker), compared to a CRISM library spectrum (LASF41A). FTS, Fourier-transform spectrometer; LIS, lunar infrared spectrometer.
4.4.2. Signal-to-noise ratio estimation
The signal-to-noise ratio (S/N) of ISEM and its LIS prototype is limited by the detector background noise (Section 3.2), so we may estimate the S/N for ISEM based on LIS prototype testing. With 3 ms integration time repeated six times per point, LIS provides the S/N of ∼10 in the center of the spectral range and 3–5 on the edges. This estimation attained while using the reflected sunlight and laboratory light sources involves many uncertainties, including transparency of the terrestrial atmosphere, scaling to the Sun intensity at Mars distance, and extrapolation. In turn, there remains a margin on the duration of the measurement. The real time to measure one spectral point is not 18 ms, but (3 · 2 + 0.6)·6 + 0.45 = 40.05 ms, because the light measurement is alternated with dark measurement, and there are some extra delays in the system (Section 4.1). With 3 ms integration time, the full spectrum is measured in 41 s, while the measurements at the surface of Mars may last 2.5–8 min (Section 4.3), which translates into a sensitivity gain of 2–3.
The improvements in ISEM with respect to LIS are (1) the deeply cooled detector with a peak sensitivity attaining a factor of 10 better than that of LIS and (2) the larger throughput of the entry optics and the AOTF. The LIS f-number is F:6; the improved ISEM throughput is ∼F:1.7, but vignetting in the AOTF results in effective throughput of ∼F:2. The resulting gain factor is therefore ∼90. The detector's peak sensitivity is at 3.3 μm in both cases, but the curve for the LIS detector is somewhat more flat. The AOTF characteristics may vary as well. By using a more conservative factor of 30, the resulting S/N of ISEM can be estimated as ∼300 in the center of the range and 100–150 at the edges.
4.4.3. Estimation of detection capabilities
Starting from the S/N estimation above, we may estimate minimum detectable abundance for minerals discussed in Section 2.4 (Fig. 1). Precaution factors in the measurement time (2–3) and in sensitivity (∼3) allow sufficient margin to account for, for example, an unfavorable phase angle or other factors. We used spectra of different minerals of interest (Fig. 1a–f) on the background spectra of “bright” and “dark” regions of Mars (Erard, 2001) to simulate the reflectance of an admixture to the bulk spectrum of the martian surface. The preliminary sensitivity estimates to detect the fraction of the selected mineral are presented in Table 3. Given the relatively high ISEM S/N ratio deduced above, these estimates based on the relative depth of individual spectral features are very conservative. A better sensitivity analysis is planned in the future, involving analysis of martian mineral analogues and multicomponent analysis.
Mineral features used to estimate the sensitivity are listed in the last column.
The issue of detection capabilities can be divided into two broad categories: (1) characterization of a target in the presence of windblown dust and (2) detection of a phase or phases of interest in multicomponent assemblages. There are a number of studies that have examined detection limits for various components that are relevant to this issue, and these are supplemented by ongoing studies by our team that are designed to specifically address this issue. The results of these studies are summarized in Table 4. Some selected examples are shown in Figures 12 –14.
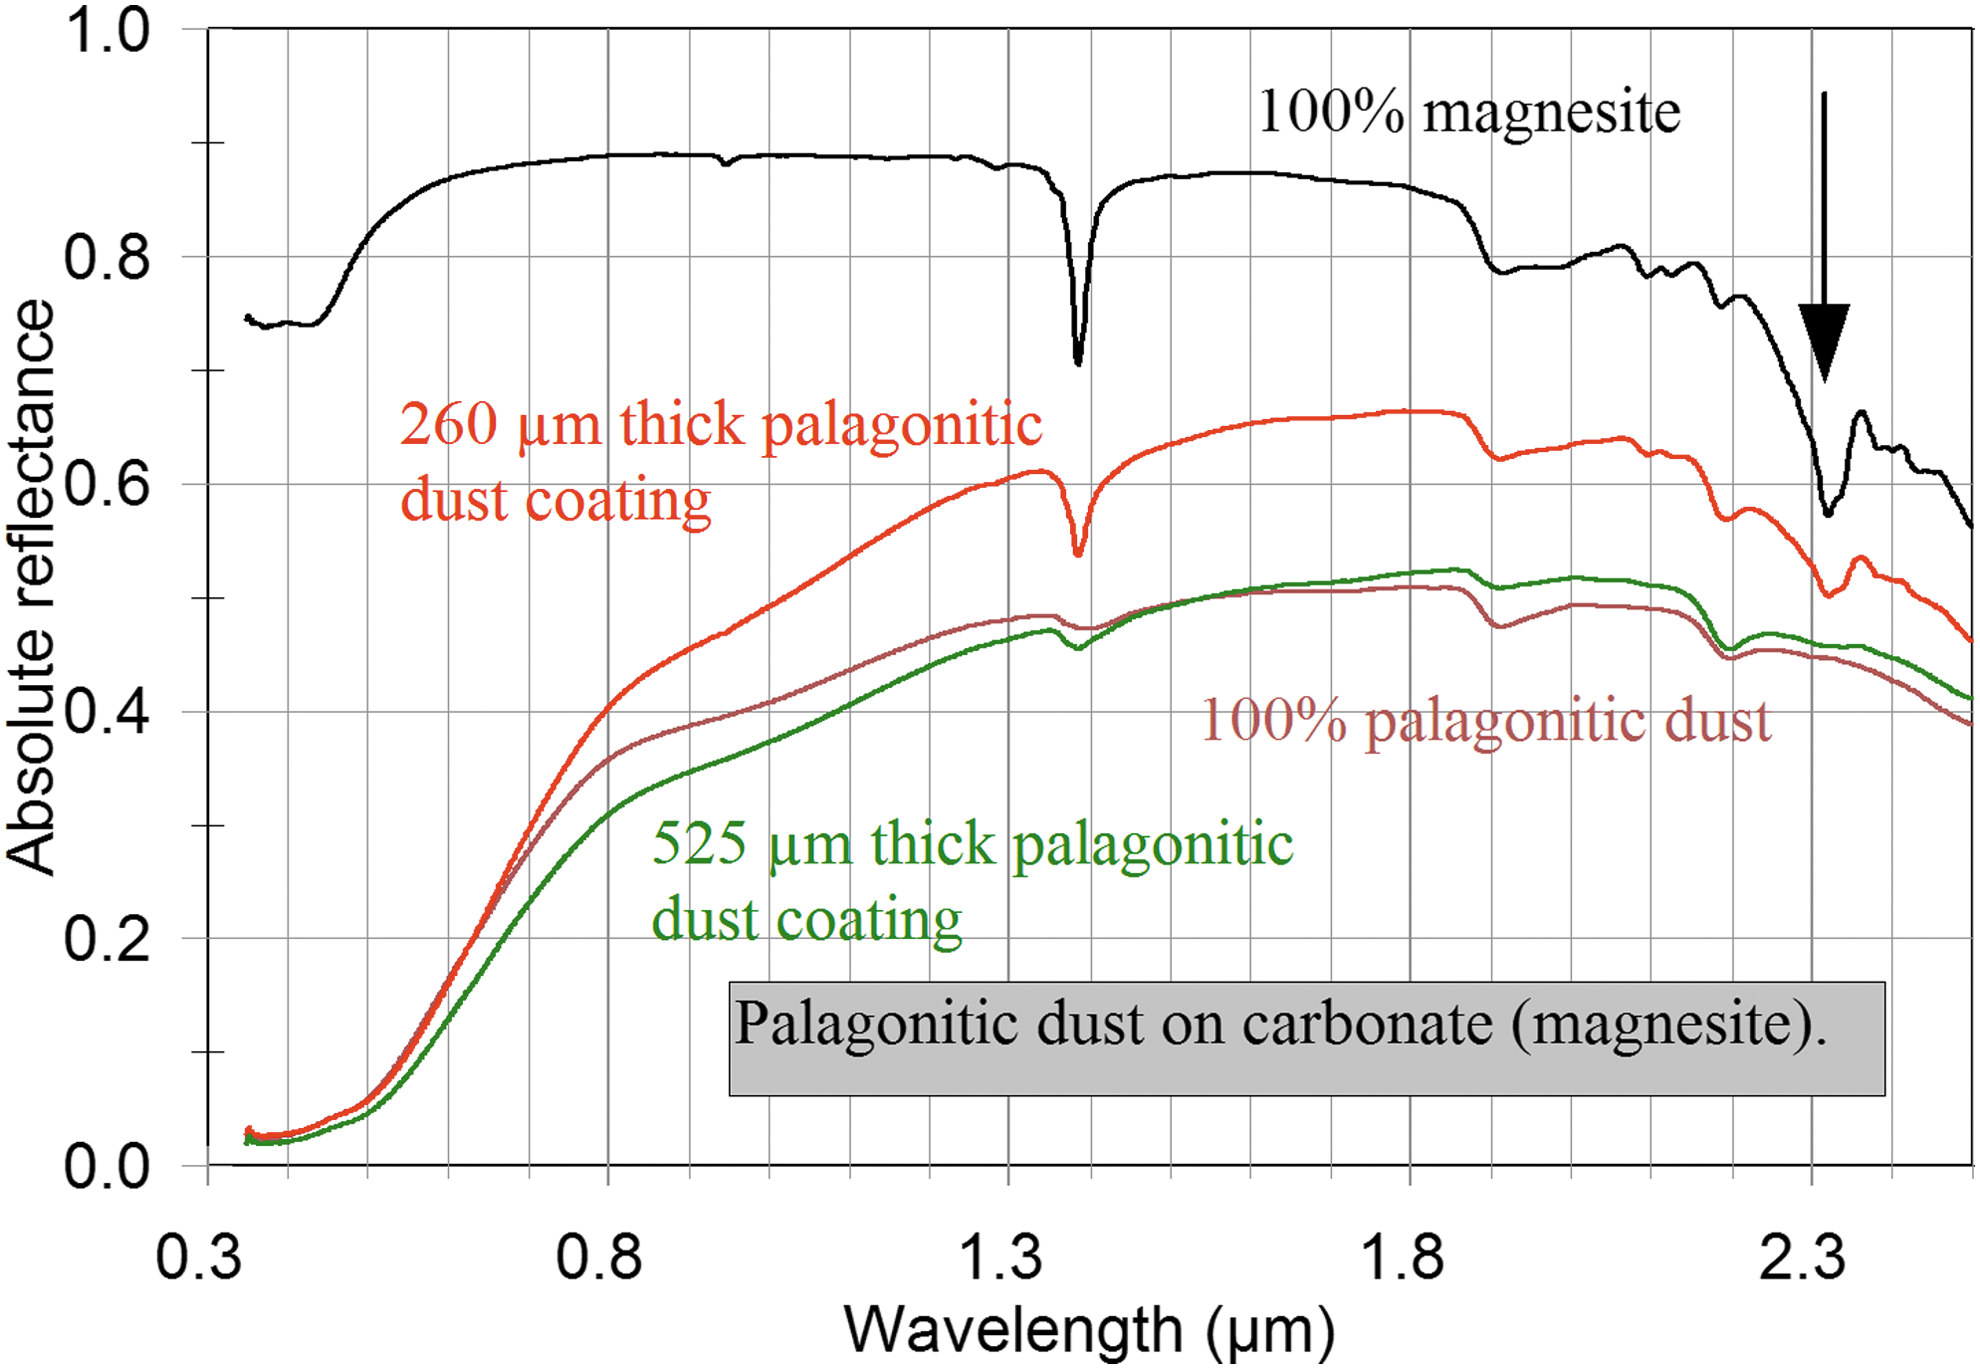
Reflectance spectra of palagonitic dust sprinkled on powdered carbonate (magnesite). The most diagnostic absorption band, near 2.33 μm, is indicated by an arrow. Note that the band is clearly present with a 260 μm palagonitic dust coating. It is still present, but barely discernible for a 525-μm-thick dust coating.
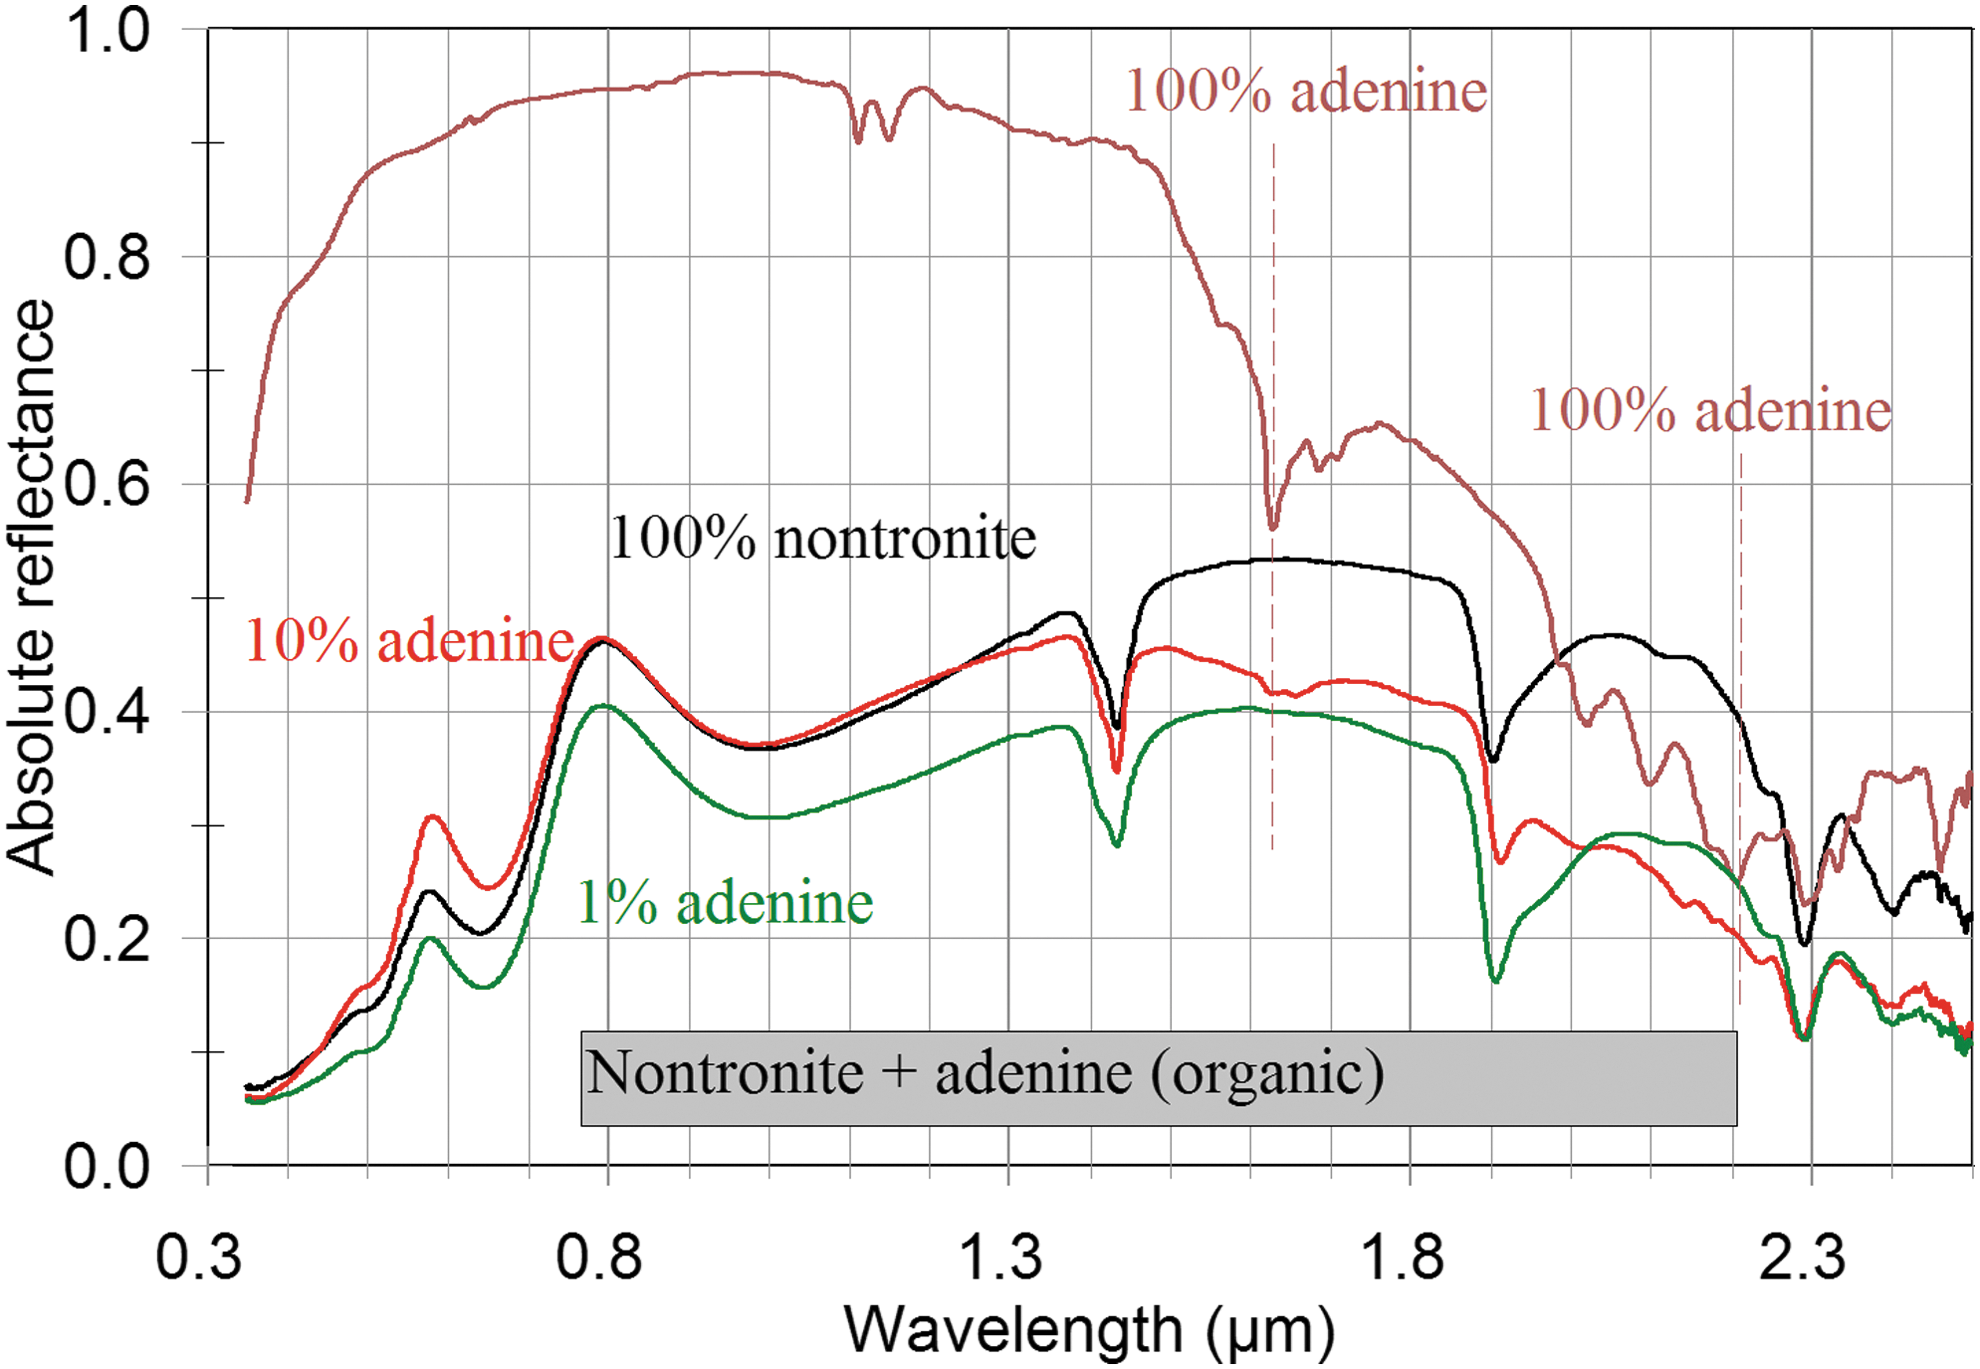
Reflectance spectra of intimate mixtures of nontronite (an Fe-rich clay) and adenine (a component of DNA). The brown arrows indicate spectral regions where adenine absorption bands are still detectable when only 1 wt.% of adenine is present in the mixtures.
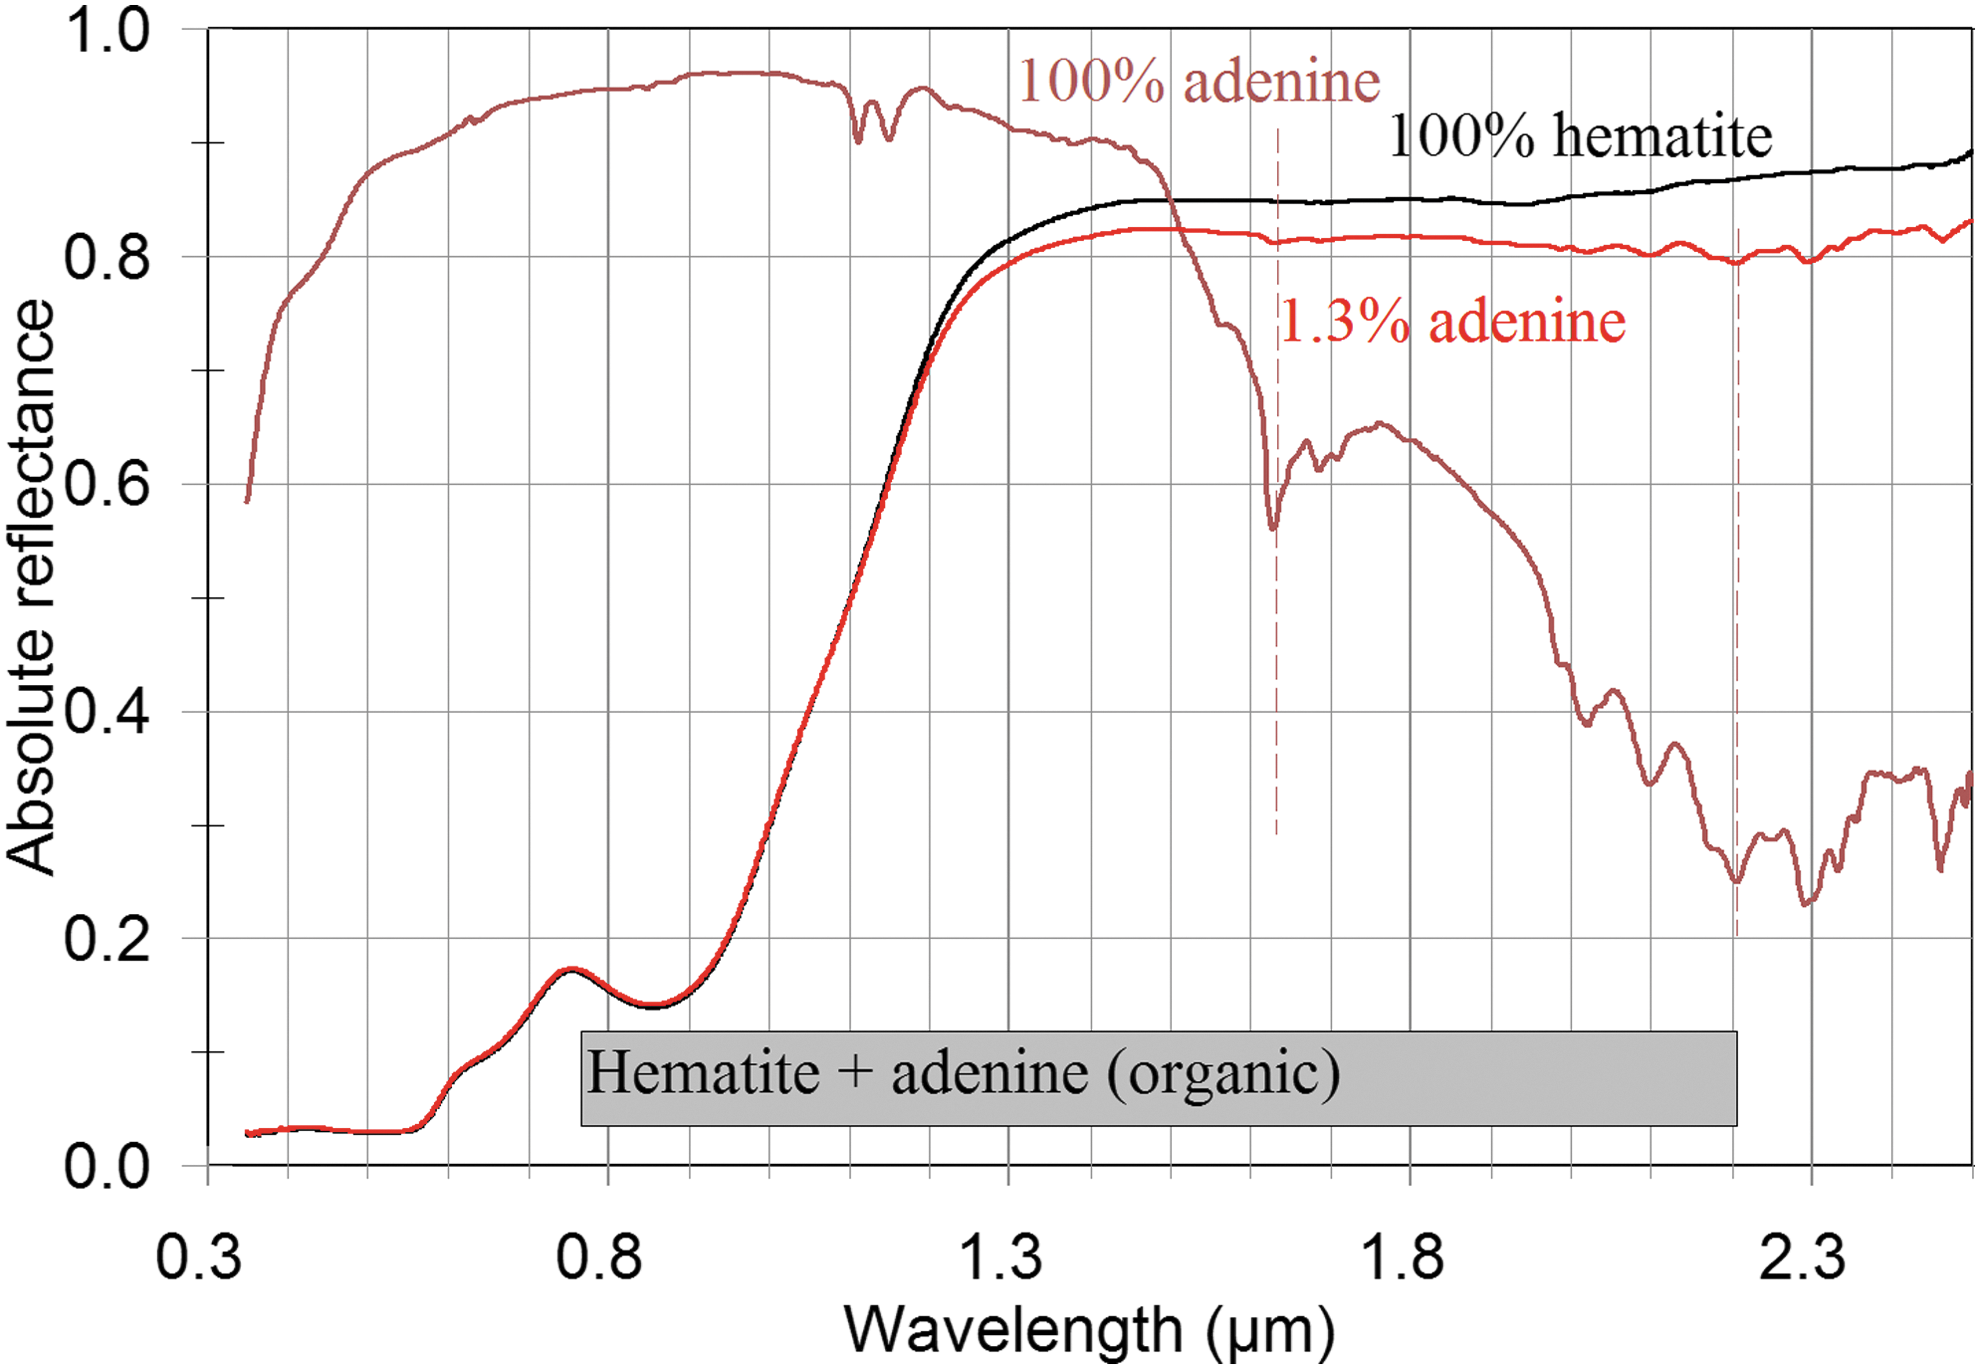
Reflectance spectra of intimate mixtures of hematite (an Fe-oxide) and adenine (a component of DNA). The brown arrows indicate spectral regions where adenine absorption bands are still detectable when only 1.3 wt.% of adenine is present in the mixtures.
Detection limits depend on a wide variety of factors, beside end member abundances. These include factors such as relative grain size, the availability of diagnostic absorption bands, the relative intensity of diagnostic absorption bands, and physical properties such as whether phases of interest are physically mixed or whether an obscuring phase, such as dust cover, if present.
We have found that, at least for the variety of mixtures examined, detection limits are on the order of 10–25 wt.%. For some phases, such as certain organic compounds, detection limits are much lower (e.g., 1 wt.% adenine is detectable in the presence of 99 wt.% nontronite (an iron-bearing clay) or hematite (an iron oxide) (Figs. 13 and 14)). Further extensive tests of mineral mixtures and detection limits are ongoing and planned.
4.5. Environmental requirements and characterization
The placement of the ISEM optical head on the rover mast with no possibility of thermal control imposes stringent requirements on survival temperature. The AOTF is a critical device involving bonding of highly anisotropic materials, such as TeO2 and LiNbO3. Anisotropic thermal expansion makes the AOTF devices vulnerable to large temperature excursion, in particular at low temperatures. AOTF technology has demonstrated survival and even operation down to −130°C and below (Leroi et al., 2009; Mantsevich et al., 2015). Several nonoperational thermal cycles attaining −130°C lower bound were also performed on two dedicated ISEM acousto-optic components; more testing to fully validate the technology is to be completed.
An important aspect of the AOTF spectrometer characterization is the thermal calibration, because the optical heads are intended for operations across a relatively wide temperature range. Some results of thermal characterization of the AOM were described by Mantsevich et al. (2015). The operation of the AO filters was tested in the range of −50° to +40°C. The temperature affects the elastic properties of TeO2, changing the ultrasound velocity and birefringence. The variation of the TeO2 refraction coefficient as a function of temperature is negligible. In turn, the change of the slow acoustic wave velocity causes a noticeable shift of the dispersion curve, comparable with the AO filter pass band in the operating temperature range. The characterization of the flight instrument will therefore include calibration of the dispersion curve within the operational temperature range.
5. Conclusions
Sampling from beneath the martian surface with the intent to reach and analyze material unaltered or minimally affected by cosmic radiation is a significant feature and perhaps the strongest advantage of the ExoMars rover. The selection of the sampling sites and, in more general terms, the remote reconnaissance and studies of the landing site area are a major part of the rover's mission. ISEM offers a method of mineralogical characterization using IR reflectance spectroscopy, a technique well proven in orbital studies and expected to be even more valuable and precise at the local scale.
In the coming year, we aim to deliver field-compatible hardware and participate in tests at terrestrial analog sites and in other joint validations of instrument performance with the ExoMars team.
Footnotes
Acknowledgments
ExoMars is a joint space mission of European Space Agency and Roscosmos. ISEM development is funded by Roscosmos (contract numbers 025-8119/13/425 and 025-8119/16/101). N.E., A.A.F., and A.Y.T. acknowledge support from the Russian Science Foundation (grant number RSF 16-12-10453), which enabled assessment of measurement characteristics of the instrument and the associated modeling. Other coauthors affiliated with IKI acknowledge FANO funding, contract PLANETA 0028-2014-0004. We are grateful to P.N. Lebedev Physical Institute of the Russian Academy of Sciences for the use of Bruker Fourier spectrometer facility. E.A.C. thanks the Canadian Space Agency, the Canada Foundation for Innovation, the Manitoba Research Innovation Fund, the Natural Sciences and Engineering Research Council of Canada, and the University of Winnipeg for supporting the establishment and operation of the Planetary Spectrophotometer Facility at the University of Winnipeg. Development and manufacture of the calibration target are carried out in collaboration with the PanCam instrument team and funded by the UK Space Agency, grant numbers ST/L001454/1, ST/N003349/1 and ST/N006410/1. We thank Dr. Helen Miles for rendering the graphics in ![]() . We thank Manish Patel and an anonymous reviewer, whose comments helped to improve this article. We also express our sincere gratitude to the space agencies, countries, companies, and project teams working to make the ExoMars mission possible. ISEM Science team: Korablev, O.I., Altieri, F., Basilevsky, A.T., Belyaev, D., Bibring, J.P., Carter, J., Cloutis, E., Demidov, N., Esposito, F., Evdokimova, N.A., Fedorova, A.A., Flahaut, J., Gerasimov, M.V., Griffiths, A., Gunn, M., Karatekin, O., Kilian, R., Kuzmin, R.O., Mantsevich, S.N., Martín-Torres, J., Poulet, F., Rodionov, D.S., Schmitz, N., Vago, J., and Zorzano, M.-P. ISEM Technical team: Dobrolensky, Yu., Alexandrov, K., Arefyev, V., Brekhovskikh, Yu.A., Buntov, M.V., Dzuiban, I., Ivanov, Yu.S., Kalinnikov, Yu.K., Kozlova, T.O., Kozlov, O.E., Makarenko, V., Martynovich, F., Muratov, A., Patrakeev, A.S., Rotova, N.V., Sapgir, A.G., Semena, N., Smirnova, A., Stepanov, A.V., Titov, A.Yu., Trokhimovskiy, A.Yu., and Vyazovetsky, N.A.
. We thank Manish Patel and an anonymous reviewer, whose comments helped to improve this article. We also express our sincere gratitude to the space agencies, countries, companies, and project teams working to make the ExoMars mission possible. ISEM Science team: Korablev, O.I., Altieri, F., Basilevsky, A.T., Belyaev, D., Bibring, J.P., Carter, J., Cloutis, E., Demidov, N., Esposito, F., Evdokimova, N.A., Fedorova, A.A., Flahaut, J., Gerasimov, M.V., Griffiths, A., Gunn, M., Karatekin, O., Kilian, R., Kuzmin, R.O., Mantsevich, S.N., Martín-Torres, J., Poulet, F., Rodionov, D.S., Schmitz, N., Vago, J., and Zorzano, M.-P. ISEM Technical team: Dobrolensky, Yu., Alexandrov, K., Arefyev, V., Brekhovskikh, Yu.A., Buntov, M.V., Dzuiban, I., Ivanov, Yu.S., Kalinnikov, Yu.K., Kozlova, T.O., Kozlov, O.E., Makarenko, V., Martynovich, F., Muratov, A., Patrakeev, A.S., Rotova, N.V., Sapgir, A.G., Semena, N., Smirnova, A., Stepanov, A.V., Titov, A.Yu., Trokhimovskiy, A.Yu., and Vyazovetsky, N.A.
Author Disclosure Statement
No competing financial interests exist.