
Abstract
The Raman Laser Spectrometer (RLS) on board the ESA/Roscosmos ExoMars 2020 mission will provide precise identification of the mineral phases and the possibility to detect organics on the Red Planet. The RLS will work on the powdered samples prepared inside the Pasteur analytical suite and collected on the surface and subsurface by a drill system. Raman spectroscopy is a well-known analytical technique based on the inelastic scattering by matter of incident monochromatic light (the Raman effect) that has many applications in laboratory and industry, yet to be used in space applications. Raman spectrometers will be included in two Mars rovers scheduled to be launched in 2020. The Raman instrument for ExoMars 2020 consists of three main units: (1) a transmission spectrograph coupled to a CCD detector; (2) an electronics box, including the excitation laser that controls the instrument functions; and (3) an optical head with an autofocus mechanism illuminating and collecting the scattered light from the spot under investigation. The optical head is connected to the excitation laser and the spectrometer by optical fibers. The instrument also has two targets positioned inside the rover analytical laboratory for onboard Raman spectral calibration. The aim of this article was to present a detailed description of the RLS instrument, including its operation on Mars. To verify RLS operation before launch and to prepare science scenarios for the mission, a simulator of the sample analysis chain has been developed by the team. The results obtained are also discussed. Finally, the potential of the Raman instrument for use in field conditions is addressed. By using a ruggedized prototype, also developed by our team, a wide range of terrestrial analog sites across the world have been studied. These investigations allowed preparing a large collection of real, in situ spectra of samples from different geological processes and periods of Earth evolution. On this basis, we are working to develop models for interpreting analog processes on Mars during the mission. Key Words: Raman spectroscopy—ExoMars mission—Instruments and techniques—Planetary sciences—Mars mineralogy and geochemistry—Search for life on Mars. Astrobiology 17, 627–654.
1. Introduction
T
Raman spectroscopy is based on the analysis of spectral fingerprints due to the inelastic scattering of light when interacting with matter.
When monochromatic radiation of wavenumber ν0 impinges on a transparent material—such as a liquid, a gas, or a crystal—most of the radiation is transmitted in the same direction of incidence, but a small portion is scattered in all directions. If the spectral distribution of the scattered radiation is analyzed, the highest intensity is found at the same wavenumber ν0 (of the incident light), but a tiny spectral component can be observed at wavenumbers ν0 ± νm. This νm shift is a result of the incident light's interaction with the atomic vibration modes characteristic of the illuminated material.
The radiation scattered with the same incident wavenumber (energy or wavelength) is called the Rayleigh scattering. The radiation components scattered with the pair of wavenumbers ν0–νm and ν0+νm receive the name of Raman effect—after the Indian physicist Chandrasekhara Venkata Raman, and his collaborator K. S. Krishnan observed it for the first time in Calcutta at the beginning of 1928 (Raman and Krishnan, 1928). The Raman spectrum consists of a spectral distribution of wavenumbers at both sides of the incident wavenumber light (Fig. 1). The bands at wavenumbers ν0–νm are referred as the Stokes Raman bands, whereas the bands at wavenumbers ν0+νm are called the anti-Stokes Raman bands (Long, 1976, 2002).

The RLS evolution line with the main steps during the development process. It is interesting to note the period in which several options for the combined Raman-LIBS were analyzed. RLS, Raman Laser Spectrometer.
The discovery of the Raman effect is an interesting historical subject because the same phenomenon was observed almost simultaneously by Leonid Mandelstam and Grigory Landsgberg in Russia (Landsberg and Mandelstam, 1928) and by Jean Cabannes, Aimé Cotton, and Yves Rocard in France (Rocard, 1928). Old references to this effect in the Russian and French literature contain the names of the correspondent codiscoverers. Only, after the 60s did the inelastic scattering of light become widely known as the Raman effect in scientific literature.
The observed Raman spectrum of a molecule represents its vibrational modes, that is, the collective motions of all the atoms vibrating with the same frequency, synchronically, with respect to their equilibrium position and with different amplitudes. The description of the vibrations is made in terms of the normal modes of vibration and each of these modes of vibration is represented by a normal coordinate. For a nonlinear molecule or atomic system of N atoms, the number of normal modes/coordinates (and therefore possible vibrations) is 3N–6 (for a detailed study of the molecular vibrations, please refer to Wilson et al., 1955; Ferraro and Ziomek, 1969; Poulet and Mathieu, 1970; Rull, 2012).
Raman scattering is a very weak effect. Its intensity is with a function of the electronic polarization induced by the exciting radiation in the sample's molecules or atoms linked by chemical bonds. The physical property involved in the expression of the Raman process is the first derivative of the electronic polarizability. The Raman effect intensity can be interpreted in terms of the general radiation–matter interaction framework. Starting with the first prediction of inelastic scattering of light made by Adolf Smekal in 1923 (Smekal, 1923), several models have been developed to estimate the Raman intensity of molecules, gases, liquids, and crystals using classical and quantum mechanics description. A vast literature is available covering its description, interpretation, and applications (Szymanski, 1967; Long, 1977, 2002; Slater, 2001; Rull, 2012).
Raman scattering intensity follows the same fourth power law as Rayleigh scattering: the intensity of the Stokes and anti-Stokes Raman bands are proportional to (ν0 ± νm)–4. This fact has consequences for the design of the excitation radiation source and will be discussed in detail later on.
The Raman technique remained a curiosity in physics laboratories for many years until the discovery of the laser—the ideal excitation source. A great expansion of Raman applications ensued as a result of its coupling with the microscope (to give micro-Raman) (Delhaye and Damelincourt, 1975; Damelincourt, 1979; Rosasco, 1980; Delhaye et al., 1996), and also thanks to the use of optical fibers and, more recently, to the technical advances derived from the miniaturization of optics and detectors (Pelletier, 1999; McCreery, 2000; Lewis and Edwards, 2001; Dubessy et al., 2012). At present, the number of applications of Raman spectroscopy is huge; in material science, chemistry, pharmacy, health sciences, and geology, among many others.
The main advantages of the Raman technique are as follows: (1) it is nondestructive, given the laser irradiance on the sample is below the threshold to induce thermal damage. This is critical for organic samples and also for thermolabile materials; (2) no sample preparation needed; (3) it can be used in micro- or macromodes, at close or at long distances, with no physical contact with the samples; (4) it is very fast (spectra in favorable conditions take less than a fraction of second); and (5) the spectral bands provide definitive characterization of the irradiated material's composition. These advantages are also the reason why Raman was proposed as a powerful analytical technique for planetary exploration (Wang et al., 1998; Ellery and Wynn-Williams, 2003; Popp and Schmitt, 2004).
To date, Raman spectroscopy has never been used for space or planetary exploration although a previous development led by H. Hasking and A. Wang was foreseen for the twin MER rovers, Spirit and Opportunity (Wang et al., 1998, 2003). The RLS instrument for ExoMars was the first one selected for a rover mission on Mars. However, the current launch schedule for ExoMars coincides with that of the NASA Mars 2020 mission, opening new and interesting possibilities for the Raman technique since two Raman instruments are being developed for Mars 2020. One named SHERLOC is a resonance Raman and luminescence spectrometer that uses deep-UV laser excitation (Beegle et al., 2014) and works at close distance. The second (SuperCam) is a combined instrument implementing several techniques (LIBS, Raman, time resolved fluorescence [TRF], infrared [IR], and visible) working in standoff mode (Gasnault et al., 2015). The LIBS, Raman and TRF spectroscopies are excited with a pulsed laser.
In this article, the interest is focused on the description of the RLS instrument. We explain how it will contribute to the objectives of the ExoMars 2020 mission, how it will be accommodated in the rover and used to analyze samples. We also discuss the Raman technique's synergies with other instruments in the payload. Finally, we present the outcome of experiments performed over the past few years with a simulator of the Raman operation mode and with science portable prototypes at the field while preparing the instrument.
2. The RLS History
The RLS in its current configuration is the result of a long process and continuous evolution that began with the EXLIBRIS proposal presented by Maurice and Rull (2003) on behalf of an international consortium in response to the Pasteur call for ideas issued by ESA on May 2003 (ESA, letter Number 3, 2004). EXLIBRIS envisaged a combined Raman-LIBS instrument, accommodated on a mast, which works at a distance of ∼2.5 m and uses a small ND:YAG pulsed laser. Although the standoff mode was not considered for the mission, the instrument was selected as part of the Pasteur payload.
At the same time, other proposals were also presented: GENTNER, for a Raman-LIBS spectrometer working in contact mode—led by E. Jessberger (Jessberger and Castellucci, 2003)—and MIRAS, a combination of microscopy and UV Raman spectroscopy—led J. Popp (Popp and Thomas, 2003).
Because of the synergies between these concepts and the relationship between the members of the different teams, a joint international consortium was formed for the development of a combined Raman-LIBS instrument among Spain, France, the United Kingdom, Germany, and the Netherlands.
The instrument was foreseen to work in contact mode—both outside the rover on surface samples with an optical head attached to the rover's robotic arm, and inside the rover with another optical head analyzing cores obtained by the drill. The robotic arm, the drill, and the sample preparation and distribution system were part of the service instruments envisaged in the initial ExoMars Pasteur payload (ExoMars Mission Configuration proposed at the ESA's ESWG#2, 31_August-2_September 2005).
The first Raman-LIBS prototype was developed as an elegant bread board (BB) under an invitation to tender emitted by ESA on June 2005, with TNO as the company responsible for its technical realization, and with Monocrom in charge of developing the excitation lasers at 1064 nm (pulsed) and 660 nm (CW) (Bazalgette Courreges-Lacoste et al., 2007).
From this former concept the instrument evolved with the mission. The following stages took place: (1) elimination of the rover's robotic arm and therefore only Raman-LIBS inside, (2) no LIBS and only Raman on solid cores inside, and (3) finally only Raman inside on powdered samples (the ExoMars Payload: confirmation of the payload suite following restructuring of the mission; ESAPB_HME [2009]
In the current configuration, the RLS instrument will operate on samples collected from the surface and the subsurface (down to 2 m) with the ExoMars rover drill. The samples will be crushed into a fine powder with a grain distribution having as average grain size 200–250 μm (Vago et al., 2017). Thereafter, one of two dosing stations will deposit powder in a sample container in the carrousel. The carrousel will then move to flatten the surface of the powder before presenting it to the ALD instruments for analysis.
Since context information, such as the relationship between the different minerals, is necessary to clearly identify a rock, the collected sample will be observed by way of a high-resolution camera (PanCam) and the close-up imager (CLUPI) before crushing. The physical modifications suffered by the sample during the crushing and distribution process may have an impact on the resulting Raman spectra (Foucher et al., 2013). However, analyzing powder can have its positive counterpart in that it seems to facilitate the detection of minor phases in some cases (Lopez-Reyes et al., 2013a).
Along this process, two main aspects were the objects of special attention: (1) the laser wavelength and (2) the spectrometer. The laser selection (532 nm in this case) was based on several criteria. One is the possibility to induce fluorescence on the sample. Fluorescence is considered “the major enemy of Raman” because this electronic effect inhibits to a large extent the observation of vibrational bands. Other effects, such as the grain size on powdered samples, can also induce a strong background that harms spectral quality (Foucher et al., 2013).
If only fluorescence is taken into account, then the use of long wavelength excitations and, in particular, IR excitation (i.e., 1064 nm) would be the right choice. However, other aspects have to be considered as well. Among those, the Raman efficiency—in terms of its fourth power law—and the detector's spectral response are the most important.
As it has been previously mentioned, the intensity of Raman scattering is proportional to (λ0–λ)–4 or (ν0–ν)4—if wavelength or wavenumber are, respectively, used. Excitations in the UV (at 250 nm) and in the visible (at 500 nm) are, respectively, around 300 and 20 times more efficient than at 1064 nm. Another important consideration is the absolute wavenumber or wavelength at which a particular Raman band appears. This position depends on the excitation's λ0 (or ν0). The whole Raman shift covers normally the range 0–4000 cm–1. A band observed at the limit of 4000 cm–1 has an absolute position of 625 nm when excited at 500 nm, and 1852.5 nm when excited at 1064 nm. Again, this spectral region is around 60 times stronger with the 500 nm excitation than with a 1064 nm excitation taking into account the fourth power factor (see Edwards and Chalmers, 2005; Dubessy et al., 2012 for details).
For the ExoMars scientific objectives, the identification of CH and OH functional groups is of great relevance. As they appear as Raman shift in the range 2800–3650 cm–1, the use of an excitation that allows a better response in this spectral range is of particular importance.
The second aspect guiding laser wavelength selection is detector efficiency. Most detectors show the maximum response in the visible, with a decrease in efficiency of almost half when approaching the IR. Moving the excitation to the red and IR also shifts the Stokes-Raman bands' absolute position, thus reducing the possibility to observe appropriately the key spectral features related to the CH and OH groups.
Although specific modern detectors show enhanced response at the two wings of the visible spectrum (UV and IR), the evaluation of all aspects previously discussed favors the choice of an excitation in the visible. The fluorescence limitations will be analyzed in detail in the operations mode section.
The spectrometer selection also poses some questions that deserve discussion. Although for space applications, size and weight are the main driving parameters, the instrument's overall spectral performance is of great importance, in particular, spectral range, spectral resolution, and optical response (throughput).
Under these conditions, and considering that having no mobile parts is highly desirable, the main possibilities available to the designer are those afforded by transmission and reflection gratings. In the case of RLS, after a detailed analysis of several options, the team selected a transmission holographic grating concept. The main advantage of this optical configuration is that the spectral resolution does not depend on focal length—as is the case for a reflection configuration (Pelletier, 1999; Slater et al., 2001; Dubessy et al., 2012), thus allowing a compact and luminous geometry in which light traverses the grating as a collimated beam.
3. RLS Technical Description
The RLS instrument comprises the following three main units: the spectrometer unit (SPU), the optical head unit (iOH), and the electronics control unit (ICEU), which also includes the laser excitation source. Other elements are the calibration target (CT), to be used on ground and during the mission; the electrical harness (EH) for power and signal communication between units; and the optical harness (OH) connecting the laser to the optical head, both for illuminating the sample and for collecting the Raman light and delivering it to the spectrometer.
The SPU, the laser, the iOH, the CT, and the general coordination of the whole instrument undertaking are the responsibility of the Spanish team. The ICEU is under the responsibility of the French team, who is also developing the power board. The CCD detector, the front-end electronics (FEE), and the electronics board controlling the CCD detector are contributed by the UK team. The OH connecting the laser to the iOH and the iOH to the SPU are provided by the German team. A general overview of the RLS team organization is presented in Figure 2.
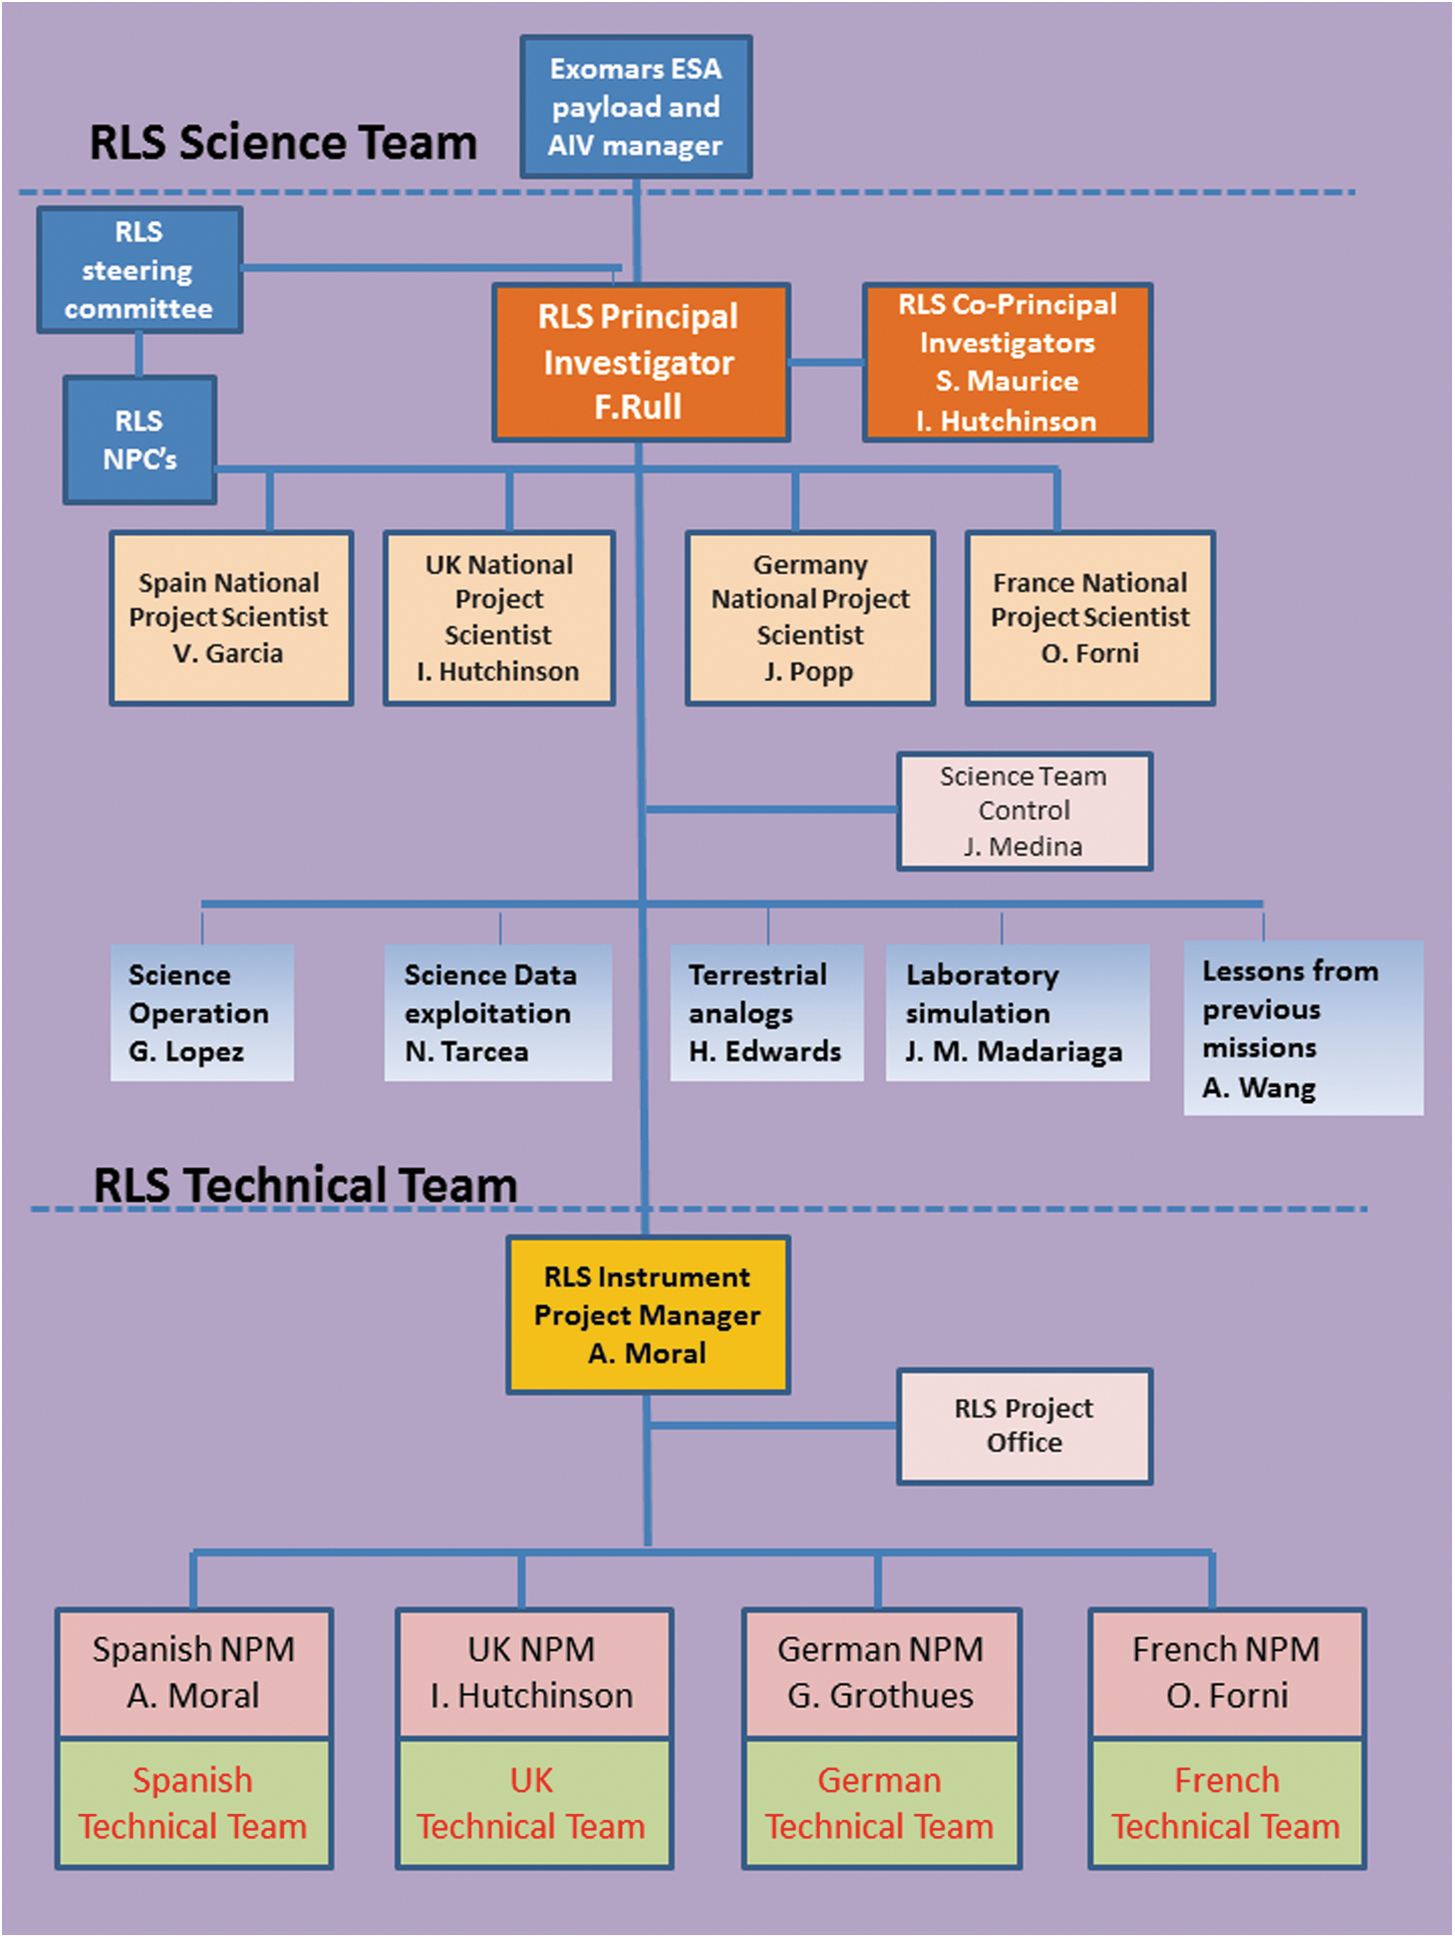
The RLS team organization and key personnel.
The RLS instrument has been designed to fulfill the ExoMars scientific requirements for the rover's Raman spectrometer. They are (exm-rl-icd-esa-00008-1.0-RLS_E-ICD): (1) Identify organic compound and search for life; (2) Identify mineral products and indicators of biologic activity; (3) Characterize mineral phases produced by water-related processes; (4) Characterize igneous minerals and their alteration products; (5) Characterize the water/geochemical environment as a function of depth in the shallow subsurface.
The RLS instrument will operate inside the rover's ALD using its internal optical head. A typical sequence of operations is as follows. The rover uses its drill to collect a sample, which is imaged by PanCam and CLUPI. Shortly thereafter the sample is transferred to the ALD. Once in the ALD, a rock crusher reduces the sample to particulate matter that is deposited in a small, refillable container. A carousel can position this refillable container under each of the ALD instruments' observation positions.
In Figure 3, the RLS instrument block diagram is presented, and in Figure 4, its accommodation inside the rover.
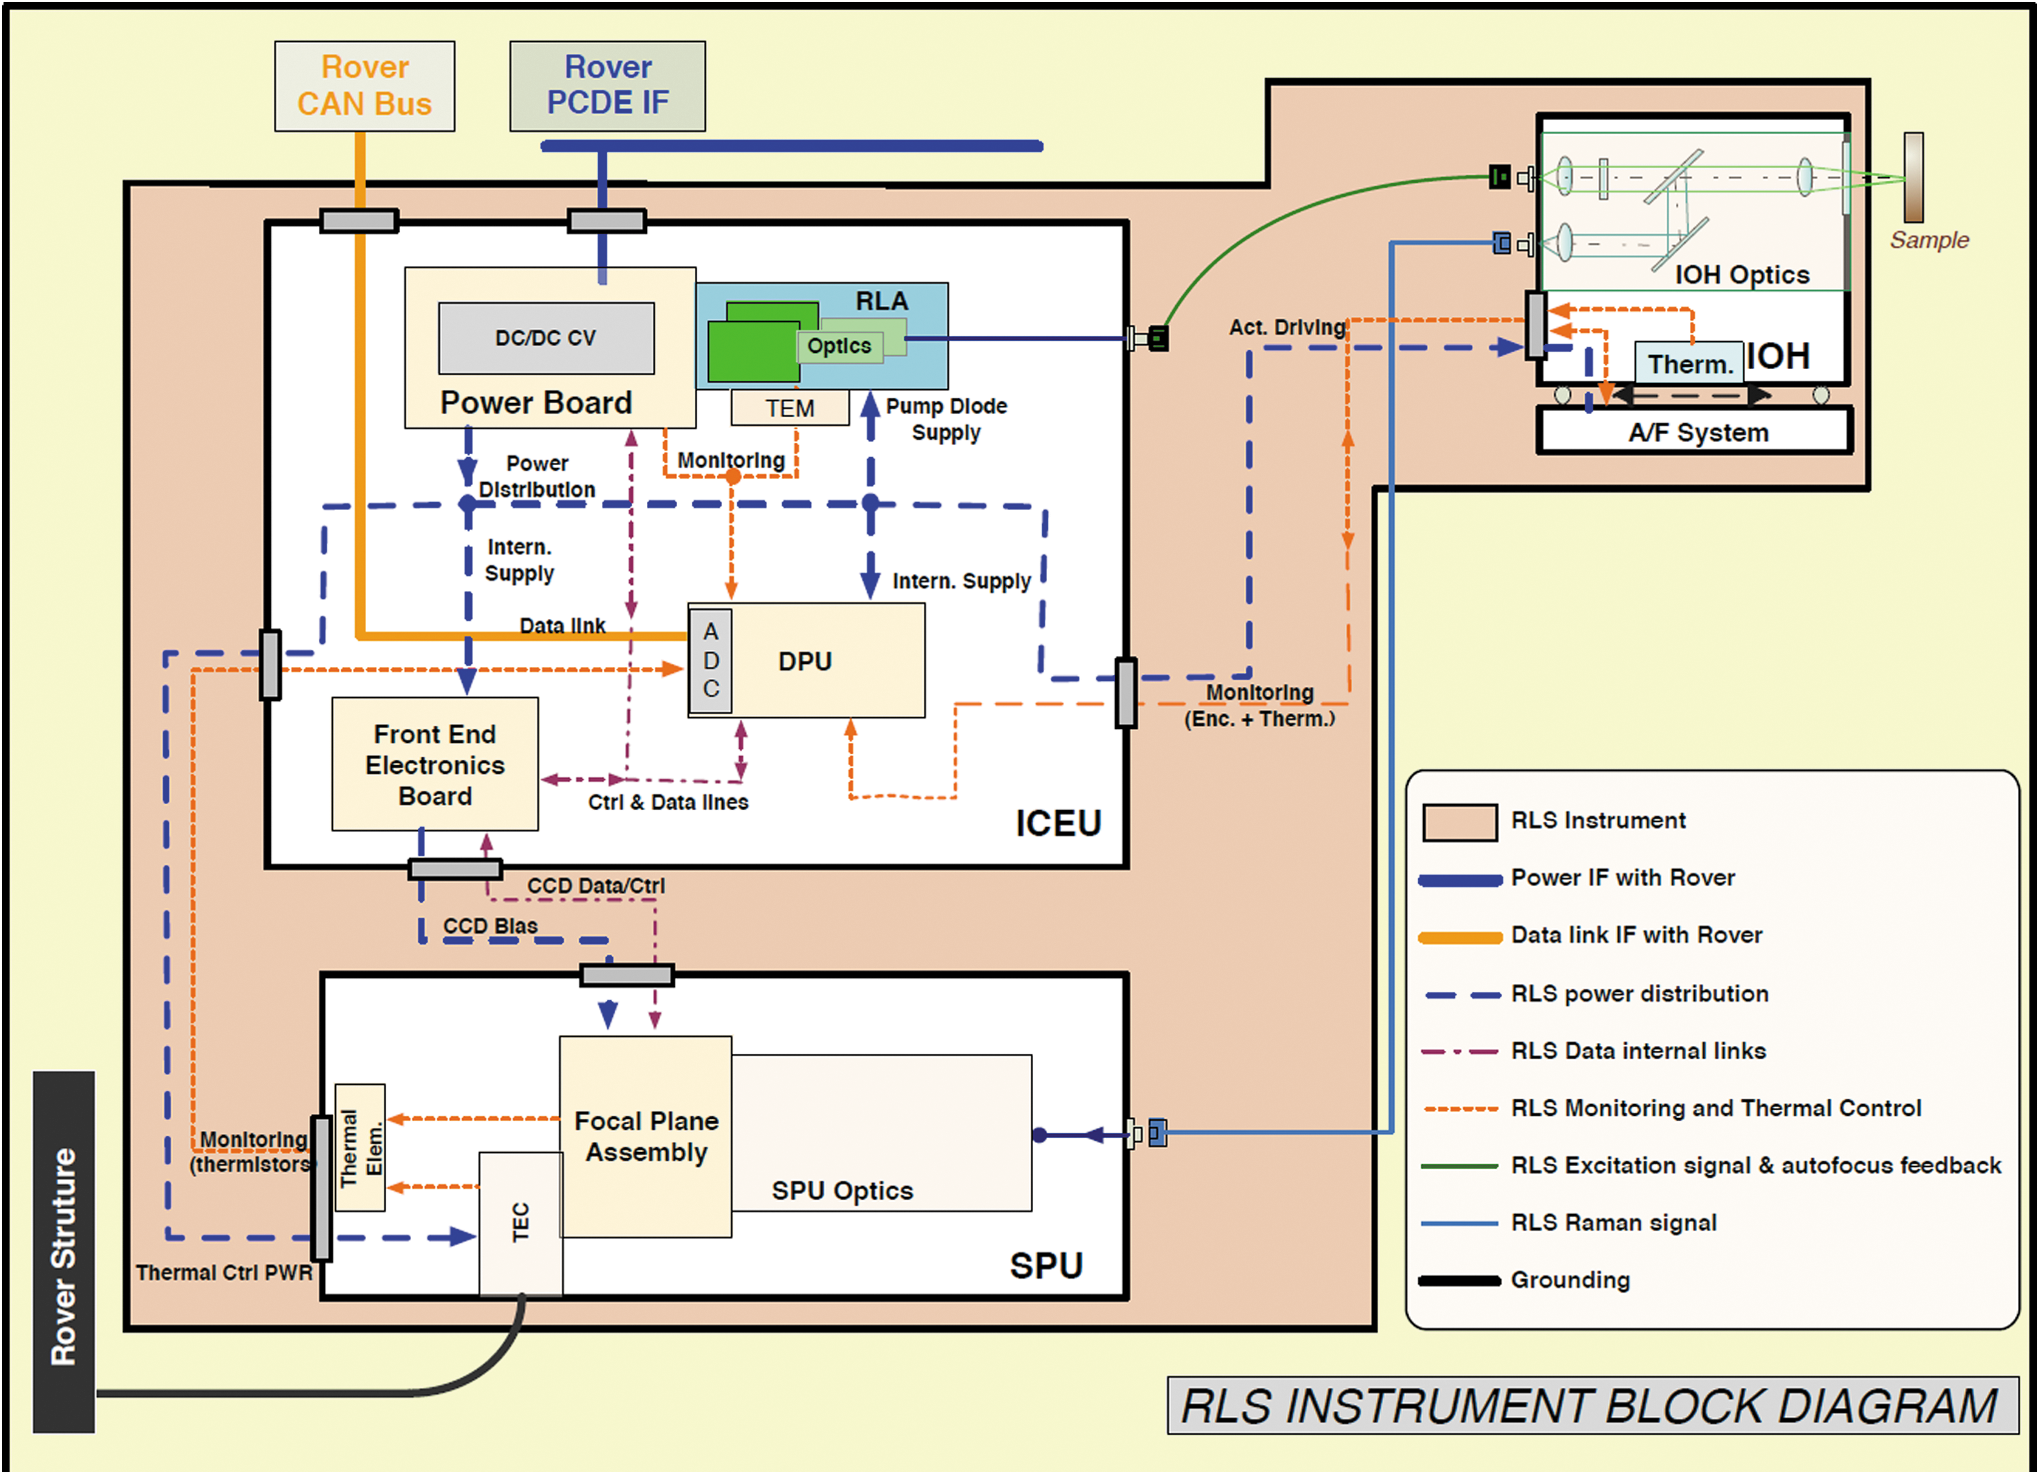
The Raman instrument block diagram.
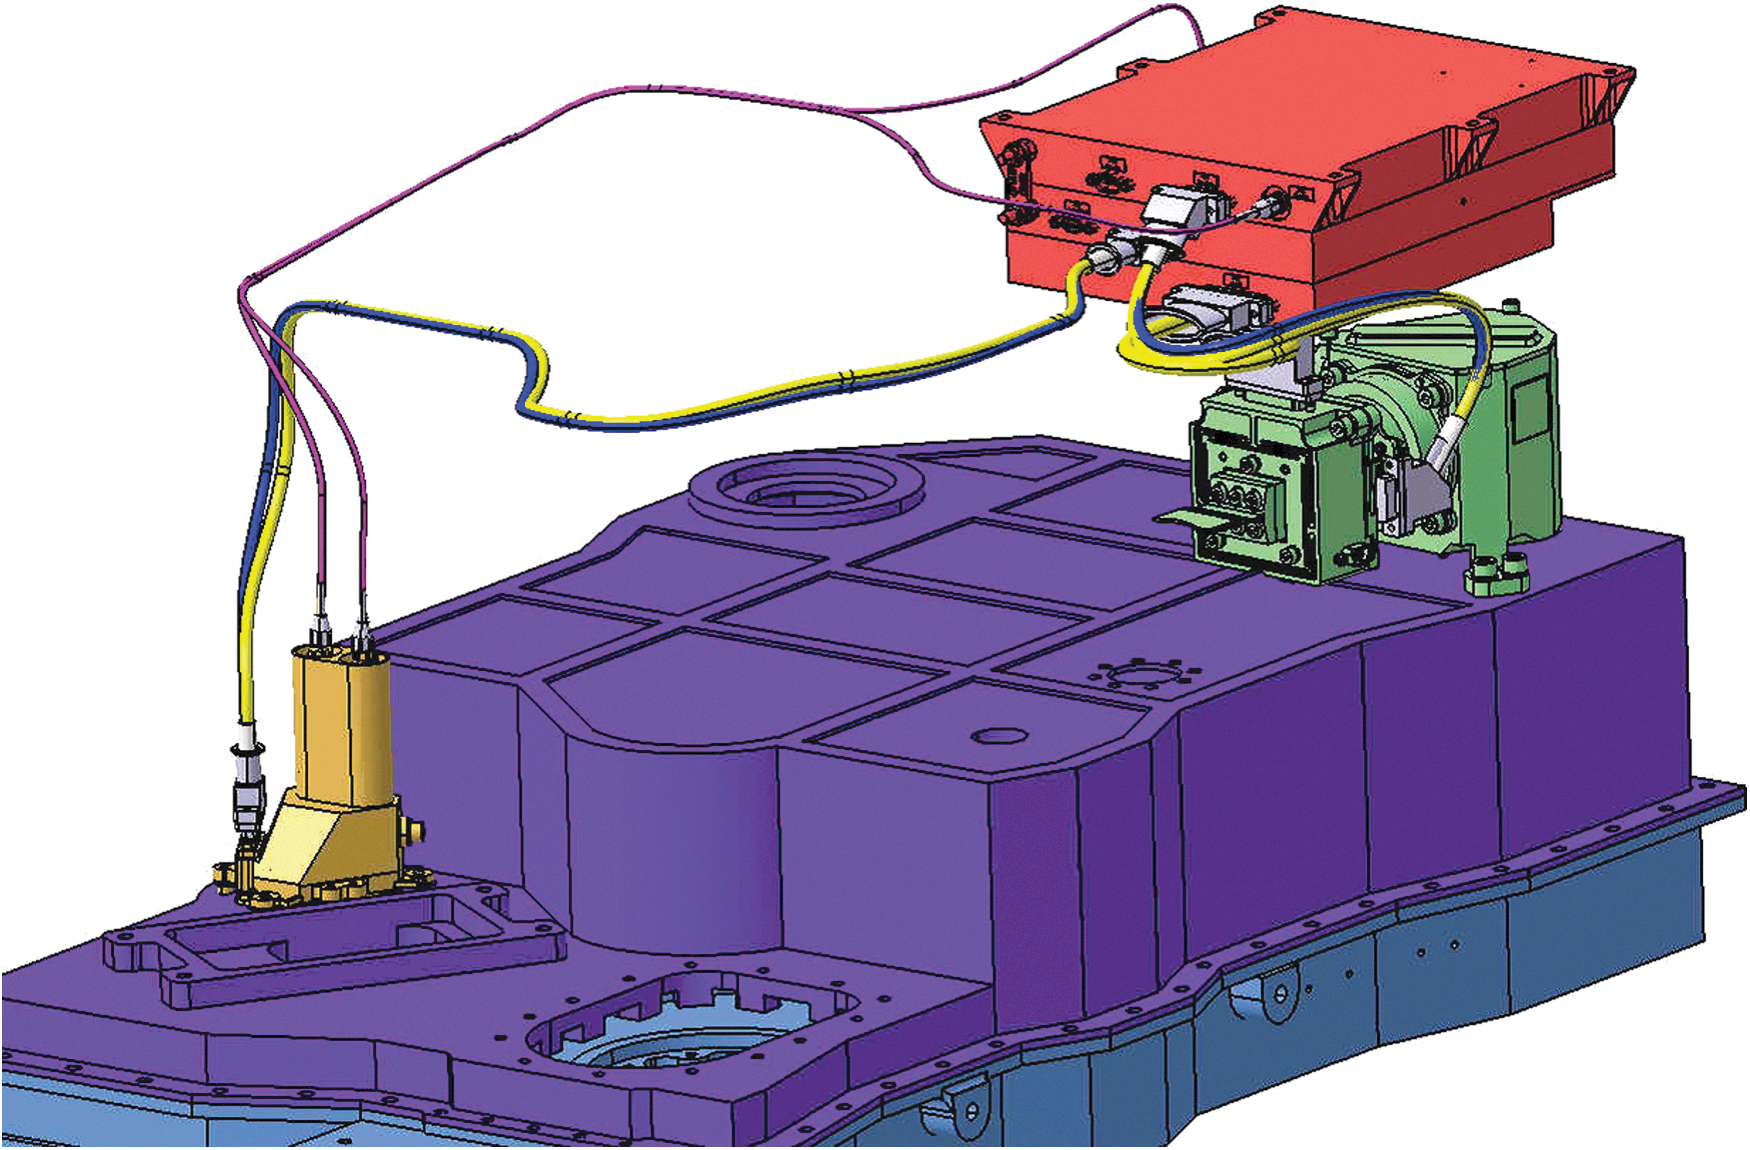
The RLS accommodation inside the rover. In red the ICEU box, in green the SPU, and in yellow the iOH. The optical and electrical hardness of the units is also presented. SPU, spectrometer unit.
4. SPU Description
The SPU is a transmission spectrograph that uses a holographic grating, which disperses the Raman signal that is projected on the charge-coupled device (CCD) detector operated at cold temperature (Fig. 5). The spectrometer main subsystems are (1) the collimating and collecting optics, (2) the dispersive grating element, and (3) the detector. The collimating optics collects the light from the 50-μm-diameter entrance optical fiber (which is fixed to the spectrometer by a MiniAVIM connector) and produces a well-collimated beam. With the fiber NA = 0.22 and a collimator a focal length of 69.71 mm, the two-doublet lenses system reaches by design a #F-number of 2.27. The collection optics is a four-lenses subsystem with a focal length of 48.82 mm and #F-number 1.59. The lenses are manufactured with space application glass from SCHOTT Co.
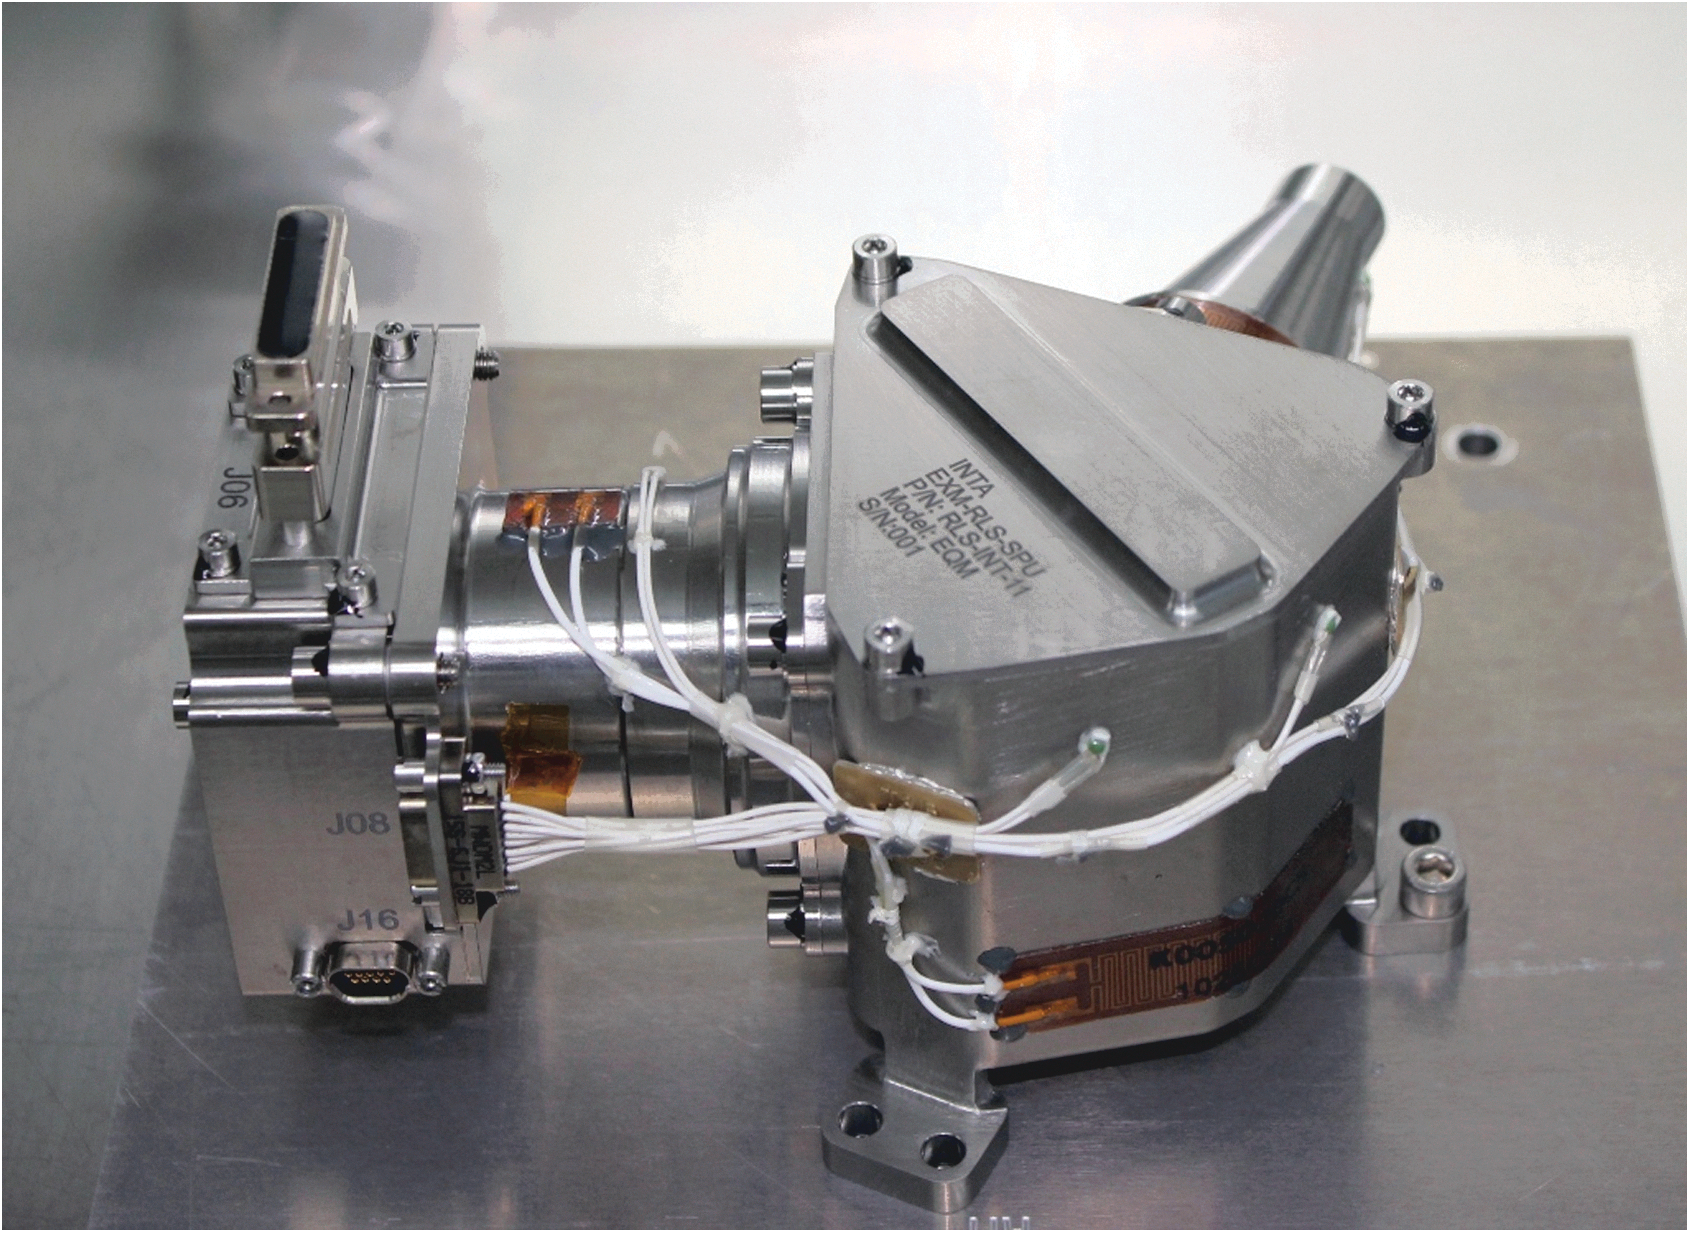
The SPU showing the collimating and collecting optic barrels. The CCD housing is placed at the left. In the figure the current EQM is presented. The SPU mass is 0.85 kg. EQM, engineering and qualification model.
The dispersive element is a transmission-volume-phase holographic grating from Wasatch with 1800 lines/mm. This configuration allows covering the optical range from 533 to 676 nm with a spectral resolution between 6 and 8 cm−1.
The dispersed Raman lines are focused on the CCD detector. This detector is an e2v technologies' CCD device working in back-illuminated configuration and mounted in SiC carrier. The full frame has 2048 × 512 pixels (15 μm size) (Fig. 6).
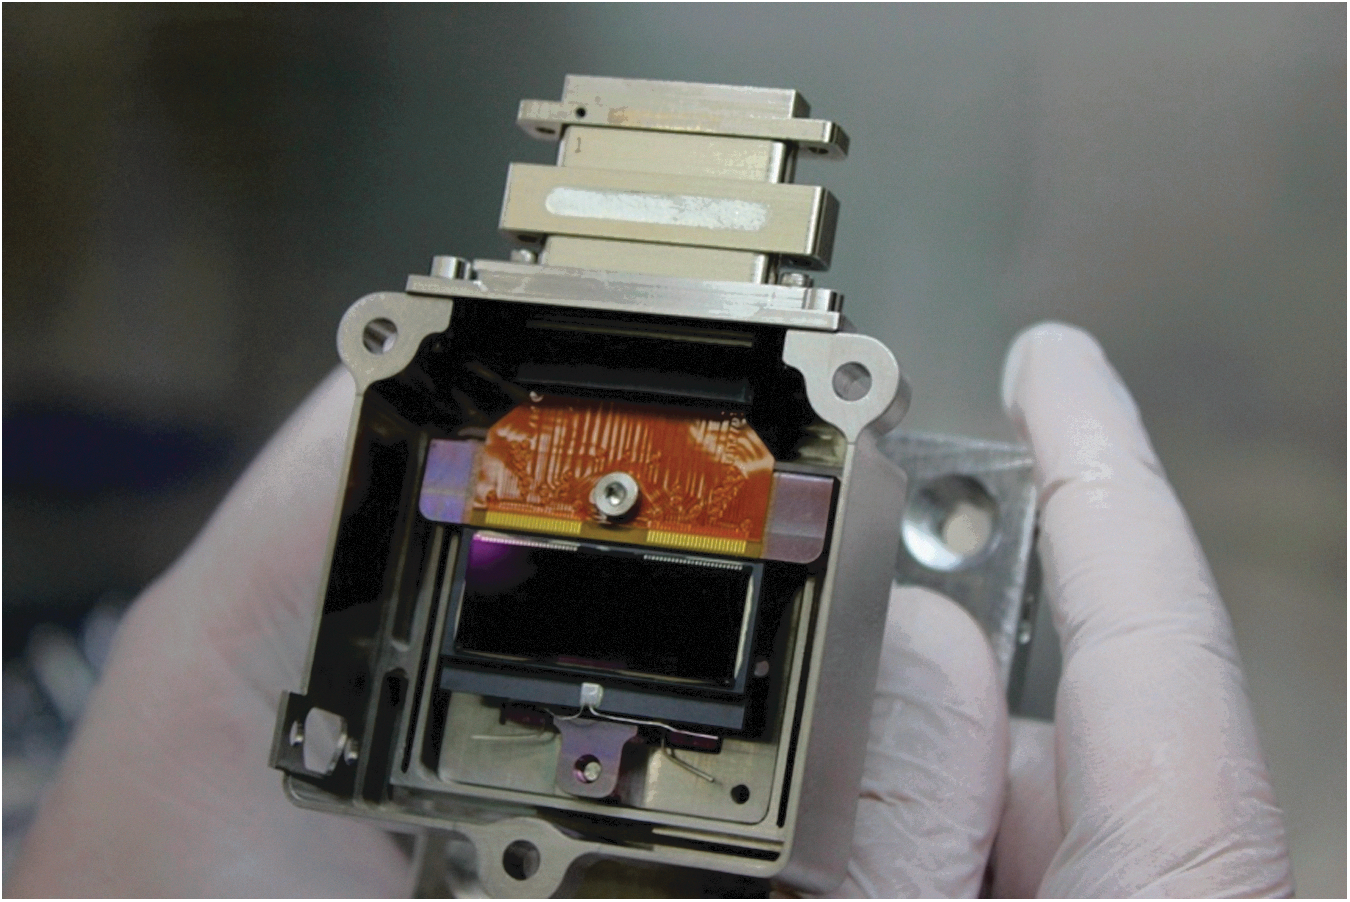
The CCD detector for RLS with its housing for fixation in the SPU body.
To reduce noise and improve the scientific performance, the detector is operated in the range −10°C to −40°C. This temperature is guaranteed by a current-controlled thermoelectric cooler (TEC) system placed in contact with the detector. The SPU is also thermally controlled by means of three (in-parallel) heaters, minimizing thermoelastic stress that may degrade the optical quality of the system during operation at different temperatures on Mars.
5. Internal Raman Optical Head (iOH) Description
The iOH has the double purpose of focusing the incident laser light on the sample with a 50 μm spot diameter and of collecting the scattered radiation from the same area. The iOH is, respectively, connected to the laser and to the spectrometer by optical fibers of 50-μm diameter and NA = 0.22. The iOH includes a focusing mechanism to compensate for the (likely) irregular disposition of the mineral grains on the sample surface (Fig. 7).
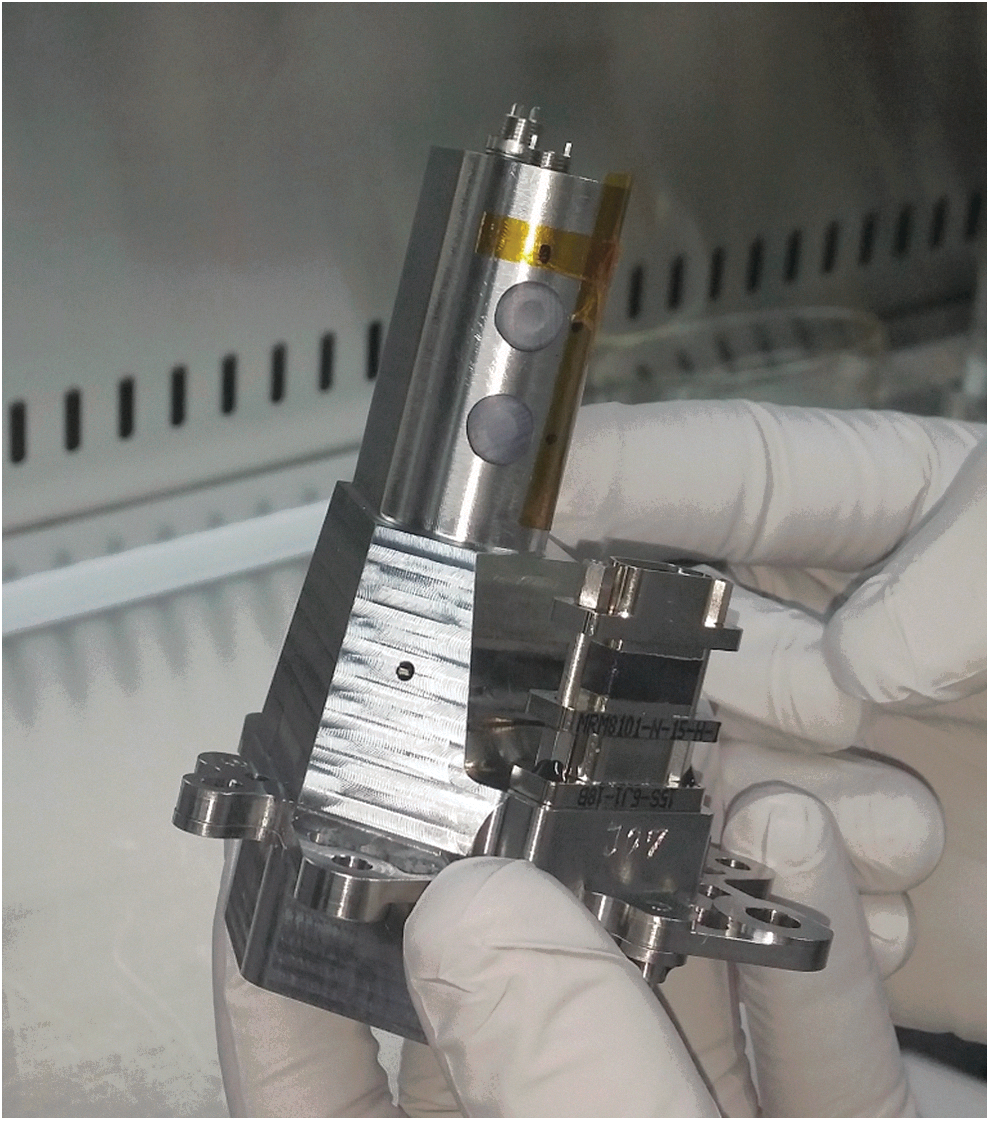
The RLS (EQM) optical Raman head (iOH).
Although the iOH excitation and collection geometries at the sample are the same, the excitation and collection paths are different. A key element in the excitation path is the band-pass filter for removing unwanted radiation (Raman, background) induced by the laser in the fiber. In addition the fiber's surface is polished with an angle for avoiding backscatter radiation returning to the laser unit.
The combination of a notch- and a long-pass filter in the collection path removes laser reflection and Rayleigh scattering with an OD of 10 (Fig. 8). The autofocus mechanism can move the focusing optics along a ±1 mm travel range using a linear ball bearing guide. A linear encoder allows determining the optical position, which is optimized by evaluating the low intensity of the laser reflection in a closed-loop algorithm. The spatial resolution achievable is of the order of ±2 μm.
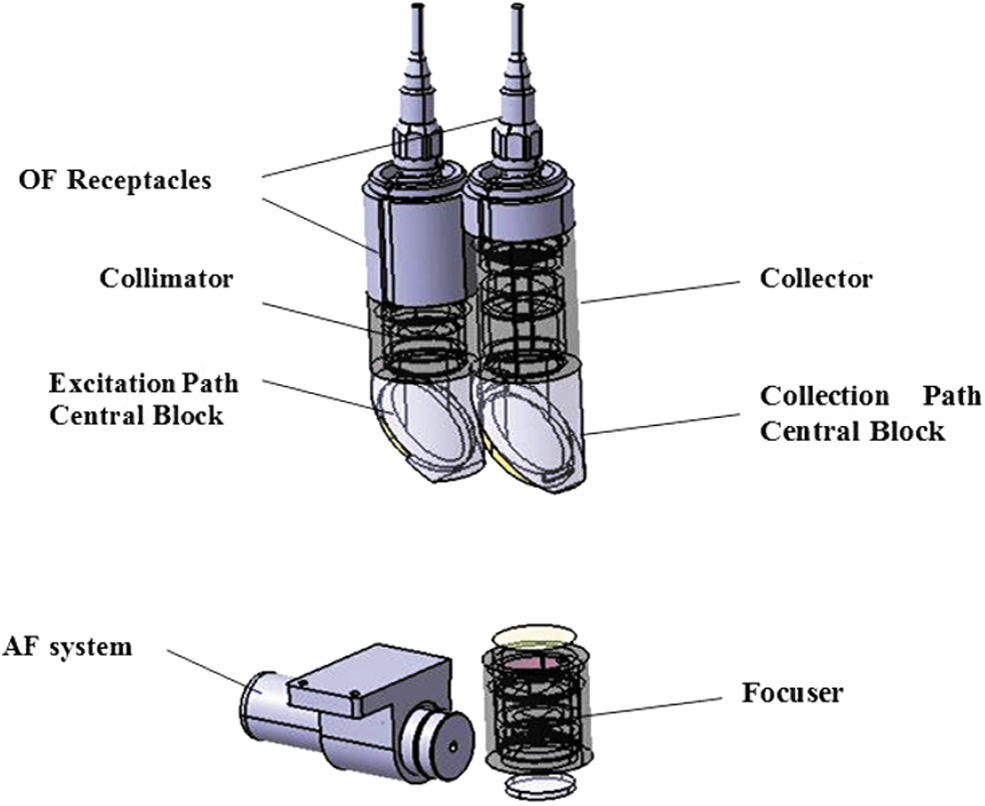
The iOH optical design showing the excitation and collection paths.
6. Instrument Control and Excitation Unit (ICEU) Description
The ICEU is composed of three electronic boards (DC/DC power board, DPU board, and FEE board). The ICEU also contains the excitation unit (the laser) and its control (Fig. 9).
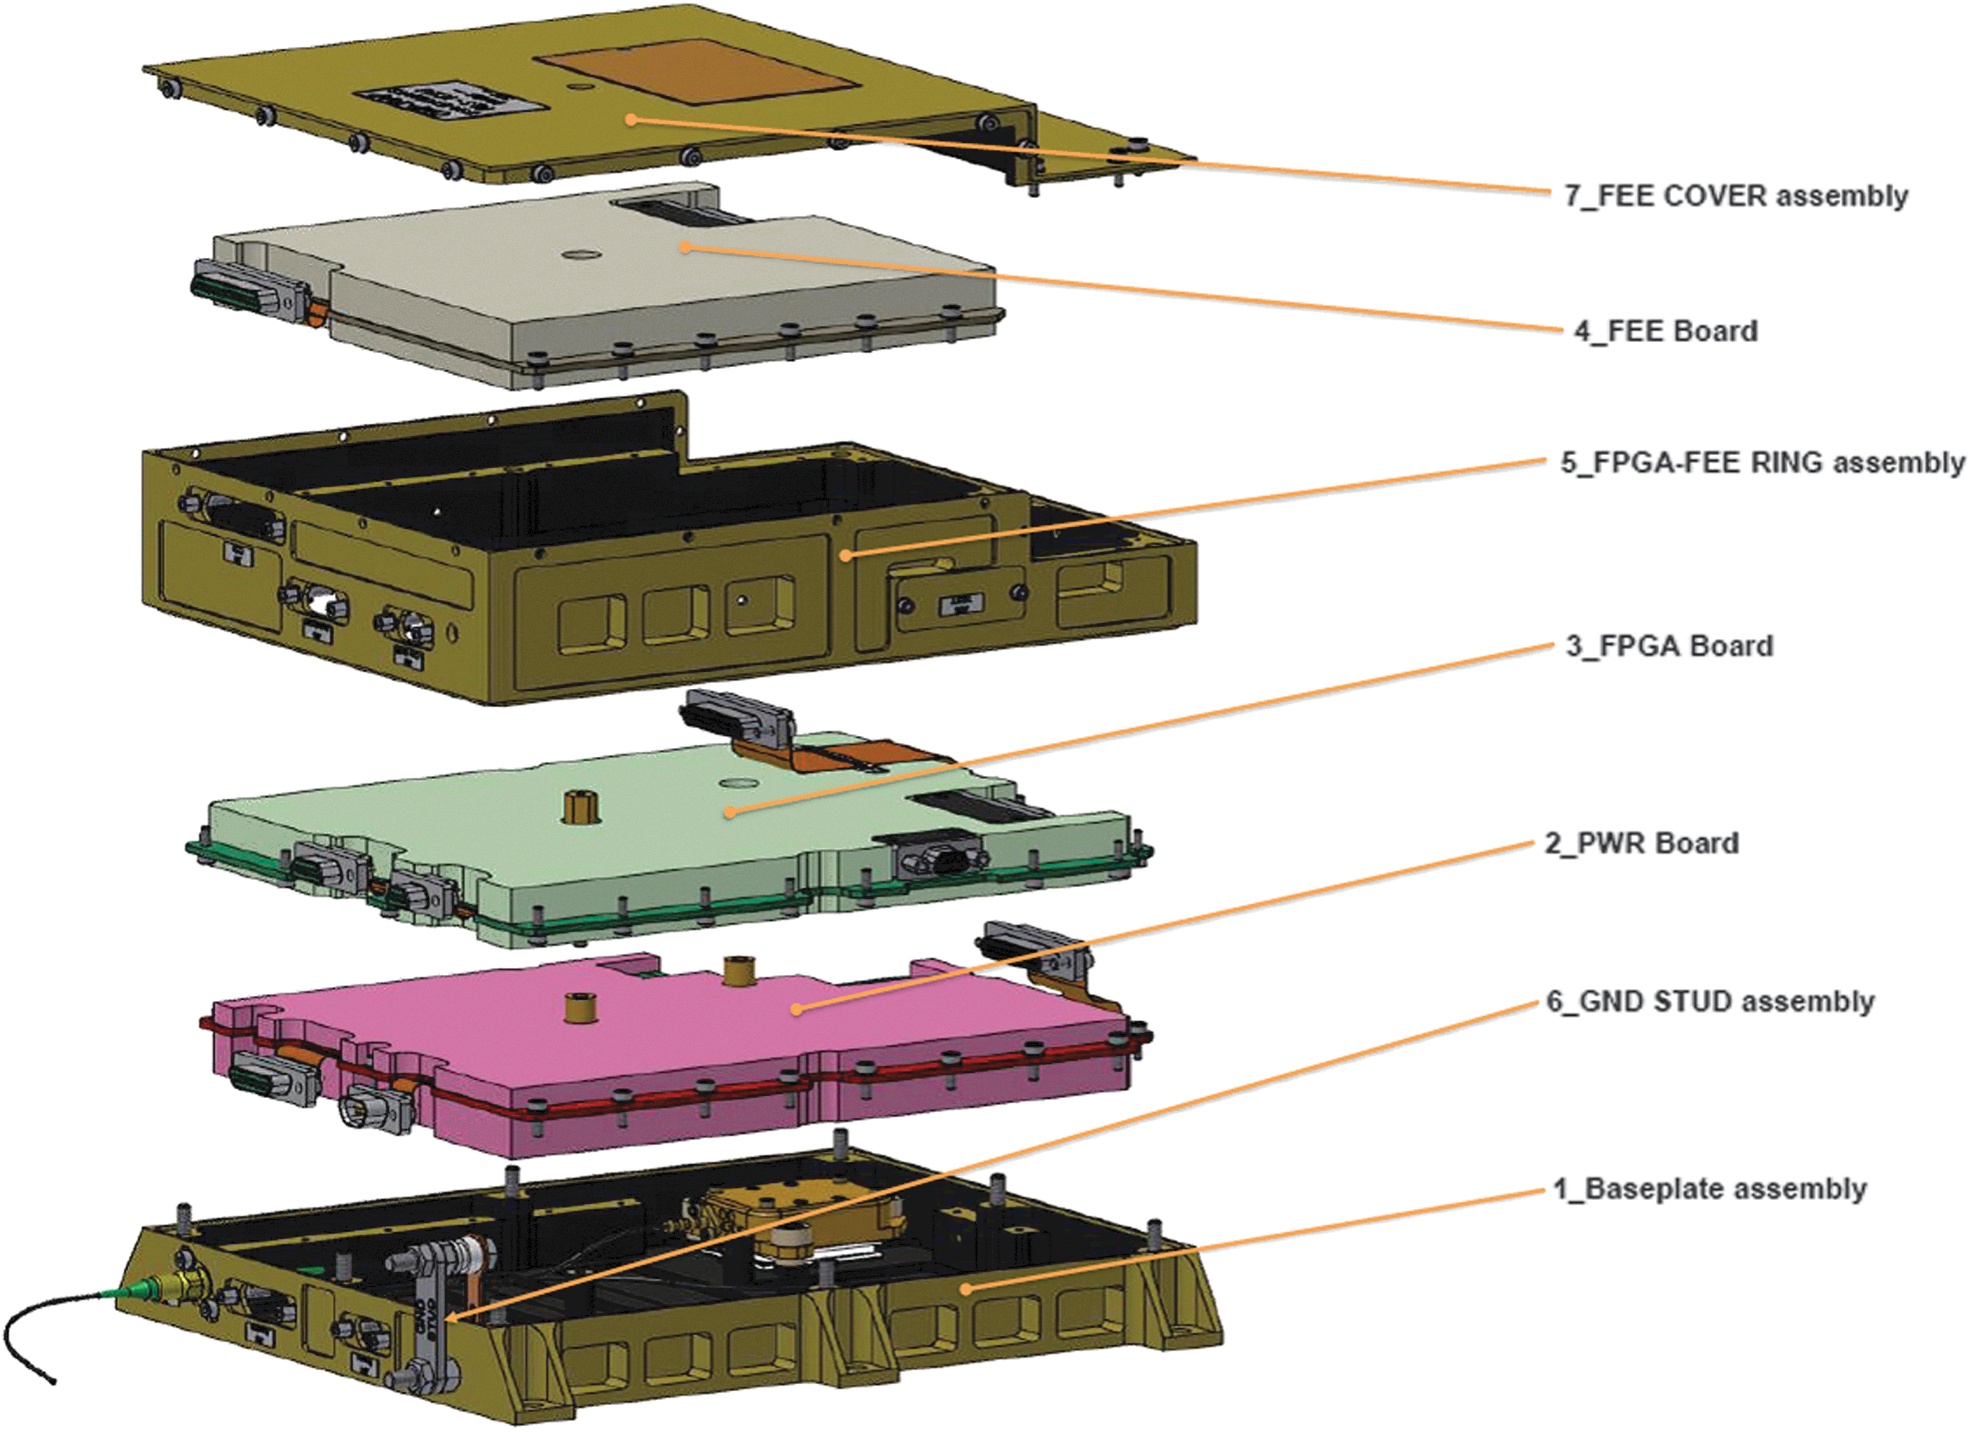
The electronic control unit with the different boards stacked in a vertical configuration. From top to bottom: FEE board, FPGA board, PWR board, laser, optical fibers, and the baseplate assembly. FEE, front-end electronics.
The power (DC/DC) board is responsible for conditioning the rover-provided +28 V primary voltage into the required unit and subunit voltages in a highly stable and safe configuration. Within this board is also accommodated the laser driver, which controls—by using a very accurate closed loop (PID)—the current supply for the laser pumping diode, guarantees stable optical power output from the laser.
The processor (DPU) board carries out several key functions for the Raman spectrometer control, spectral operation, data storage, and communications with the rover. The DPU main functionalities are described below: – To process the received video data coming from the FEE. – To execute the firmware for the actuator drivers to allow autofocus operation in the iOH. – To implement the telemetry acquisition function. – To provide data storage (both for scientific data and software code). – To communicate with the rover via its CAN-Bus. – To provide clocking plus power up reset functions. – To provide the reception (digitalization) and condition of the thermal sensors and voltage chain. – To provide the firmware for the thermal control.
The FEE board provides the required biasing and control signals to drive the CCD detector on the SPU unit. The commanding of the FEE function comes from the FPGA (processor module inside the ICEU) and the biasing is fed through from the internal supply lines generated at the power module. The FEE also receives the video data coming from the CCD (analogue), digitalizing it and transmitting it to the processor module.
The excitation laser unit located inside the ICEU is a critical part of the Raman instrument. The laser must ensure the required wavelength, narrow bandwidth, and intensity required for stimulating the Raman effect in the mineral grains during instrument operation, maintaining the stability of these parameters under all conditions on Mars. In particular, it is the temperature range that imposes the toughest challenge to the laser. To guaranty an adequate laser excitation during the whole mission, we have implemented a redundant configuration using two diode lasers optically coupled to the exciting optical fiber.
The laser has required a long (more than 7 years) and very hard effort from the Spanish team. Its design started from scratch, without previous space heritage in the scientific and technical teams or in the industry responsible (MONOCROM).
6.1. Laser description
The laser diode is a q-mount wavelength stabilized technology pump diode with an optical output at 808 nm working in the temperature range from 15°C to 45°C. Nevertheless, for obtaining optimum, repeatable, and stable performance, a fixed working temperature (around 25°C, with 0.1°C thermal resolution) was set. The laser's emission is very stable (wavelength position below ±50 pm), quite narrow (FWHM below 30 pm). The power output ranges between 10 and 20 mW.
The laser diode is directly focused on the active medium by way of a microlens that allows a high density of pumping. This consists in a neodymium-doped (1%) yttrium-aluminum garnet ceramic (Nd:YAG), generating a 1064 nm emission. Its front face is coated with a reflective material specifically designed for 1064 and 532 nm wavelengths, so then acting as a front mirror for the laser cavity.
To emit at 533 nm, a second harmonic generator (SHG) crystal is used. The SHG—or frequency doubler—requires a fine-tuned thermal stabilization to perform efficiently. In this design, a beta-barium borate SHG crystal was used.
A difficult aspect related to the redundant laser design is combining both beams in a single output fiber. A solution was found by using a polarizer cube, which can let through two beams with linear polarization perpendicular to each other. For example, the primary beam will be horizontal and the redundant beam will be vertical. The polarizer cube lets through the beam coming from the outermost channel and reflects the beam from the internal channel. In this way, both beams can trace the same geometrical path toward the output fiber, illuminating the same spot. Of course, to perform such combination, a perpendicular polarization of both beams has to be performed. This is made by using a polarization rotator, which consists of a quartz half wave plate (532 nm) turning 90° the polarization of the redundant laser channel with respect to the primary channel. This rotator is placed in the redundant path, after the end mirror and before the polarizer cube.
Another device included in the laser is the double polarization beam splitter at 45°, which sends most of the green light (94.5%) toward the output receptacle, but lets pass a small amount (5.5%) through to the feedback photodiode—this is needed for implementing an accurate output power control by means of a PID closed loop. These coatings let pass both polarization directions, the one coming from the inner diode and the one from the outer diode, to allow for feedback control of both channels at once. In addition, as before, the mirror does not let through more than 5% of the IR radiation (808 and 1064 nm).
This system also includes a mirror with a hole. The hole in the mirror allows either of the two linearly polarized beams (not existing at the same time) to go through toward the focusing lens in the optical receptacle. After the sample is illuminated, nonlinearly polarized light is reflected back from it through the output fiber and the lens. The reflected beam has a diameter slightly larger than the hole and therefore some of the light is reflected by the mirror and directed toward the autofocus photodiode. The better the in-focus position reached by the optical head focuser, the higher the reflected light will be on the photodiode.
The laser has to be thermally controlled, which is critical for stability and for achieving optimum performance. This control is implemented by a thermoelectric module in a closed PID loop with the thermal sensors. These are two (redundant) Pt-1000 thermal sensors placed inside the laser housing, below the pumping diodes, for getting an accurate measure of the highest temperatures expected.
All the components are placed in a laser housing made of oxygen-free, high-conductivity copper with a gold coating. The main optical components are placed over KOVAR pads on the laser board by using a solder jet bump technique (Ferrando et al., 2010). Solder jet bumping is a low-stress, highly stable, organic-free soldering technique. The technology is based on the application of small bumping droplets of soldering alloy jetted by pressurized nitrogen capillary. Being the solder jet bumps made with a small diameter (100–200 μm) and melted by a very precise IR laser pulse, just a small thermal stress is induced on the optical components during reflow and soldering.
Finally, the laser housing has an ultraclean air pressurized environment (1 atmosphere) to avoid contamination. This has been achieved by using a hermetic design for the housing cover and for every component that closes the housing (photodiodes, optical receptacle, and electrical feedthrough). Leak rates obtained with the hermetic soldering process are below 10−8 mbar·l/s. Figure 10 shows the laser optical details and the housing.

Left: The optical RLS (EQM) laser design in the redundant configuration. It is possible to see the main laser components: two diodes, the mirrors, and the cube join both beams. Right: The hermetic laser housing.
7. CT Description
The RLS CT is a 1-mm-diameter disk sample of PET (polyethylene terephthalate) placed on a cylindrical foot (Fig. 11). The CT is fixed to the rover carrousel on the Raman optical head field of view, at the same height as the refillable sample container. PET was selected after testing several minerals, single crystals, and polymers because its spectrum shows a sufficient number of fine bands for calibration purposes and also because of its mechanical, thermal, and low outgassing properties (compatible with the mission planetary protection rules). The CT is used for RLS instrument calibration on Mars, and also during assembly, integration, testing (AIT) and prelaunch activities to verify the calibration and performance of the RLS instrument.
The Raman CTs EQM (right) mounted in its support. The PET Raman spectrum (left) shows enough number of fine bands covering all the instrument spectral range. CT, calibration target.
Two identical units of the CT will be placed in the rover's carrousel. One under the optical head in the sample, processing and distribution subsystem (SPDS) nominal (fixed) position to be used for the AIT and cruise phases allowing, if necessary, on-cruise instrument operation and calibration. Thus, this CT unit will be used during the AIT phase for the verification of the instrument health and performance. The second CT will be utilized during the operations phase, once on Mars. The reason for this is that the configuration of the carrousel and instruments inside the ALD does not allow the RLS instrument to be calibrated right before operation without disturbing the martian sample surface.
On Mars, calibrating just before operating the instrument is critical for assessing with picometer resolution the laser wavelength, and also the laser power, at sampling time (since both parameters are highly dependent on the laser temperature). This information will be crucial for a proper interpretation of the scientific data obtained, as the position of the characteristic Raman peaks can change slightly as a result of temperature variations affecting the laser.
8. Electrical and Optical Harness Description
The various elements of the electrical and OH have been designed to connect (electrically and optically) the RLS instrument's main units (SPU, iOH, and ICEU), adapting their length to the ALD layout and to the inside routing and fixation needs.
The EH is composed of three different elements, the EH#1 for command and control of the optical head; the EH#2 to thermally control the spectrometer structure and TEC of the CCD; and the EH#3 for communicating with the CCD and the FEE. The EH uses MicroD connectors; its design was made to minimize mass allowing a flexible routing and a safe operation.
The OH comprises two different patchcords, first the OH#1 for sending the laser light to the optical head (and for receiving the backscattered laser light for autofocus purposes) and the OH#2 for taking the Raman signal back to the SPU. The OH configuration is based on MiniAVIM 50-μm APC connectors.
9. Software Description
The on-board software of the RLS instrument allows performing low-level characterization and unit to system testing campaigns. The on-board software is divided into two main software products: (1) the application software, in charge of performing the full control of the instrument by managing the iOH, CCD, thermal control, laser, CANbus communications, and failure detection, isolation, and safe procedures; and (2) the boot software, which performs the initialization sequence and on-flight patching of the application software.
The RLS application software provides simple operational units so that any commanded sequence can be performed in a safe manner, while allowing full operational flexibility. This operational concept is based on three levels: telecommands are the elemental operations that can be performed by the instrument. Predefined sequences of telecommands are grouped into actions, providing the building blocks of the operation. Sequences of different actions (and other tasks) will be grouped in higher level building blocks called Tasks. During the operational phase of the mission, the Activity Plan, built as a sequence of tasks and actions, will be interpreted by the rover to handle the instrument operation by translating tasks into the corresponding sequence of actions, and these into the final sequence of telecommands that can be interpreted by the instrument.
10. RLS Operational Concept
The measurements carried out by the RLS will be performed as described within the ExoMars Rover Reference Surface Mission, which includes six experiment cycles (with two samples each, one extracted from a surface target and the other at depth) and two vertical surveys (with five samples each extracted at different depths). For more information about the Reference Surface Mission, please consult Vago et al. (2017), also in this issue.
The RLS instrument can analyze several points on the sample surface presented by the SPDS. This will be done based on an autonomous operational concept that takes into account the sample nature and available resources (energy, time and data bandwidth). Two main complementary operating modes have been established to optimize the experiments on Mars.
• Automatic: Predefined coordinates for the complete coverage of the sample container, acquiring multiple, consecutive spots over the sample. In this mode, the RLS instrument can perform a random mapping on the sample surface. During automatic scanning, the rover displaces the target following a preconfigured sequence of movements under the RLS optical head. RLS takes 20 shots at regularly spaced spots on the target. RLS can continue measuring spots by moving the SPDS backward, thus analyzing more spots, until the resources allocated for Raman measurements are reached. This will depend on the efficiency of each spot analyzed and the resources spent for their acquisitions.
• Cooperative: This entails a coordinated analysis using the ALD instruments. An on-board process running on the rover's computer analyses the results obtained by the imaging-IR spectrometer MicrOmega to determine particularly interesting targets for RLS and MOMA-LDMS (please see Vago et al. [2017], this issue). The first instrument to analyze the sample grains, MicrOmega, will acquire multispectral images of the sample in a relatively wide area, providing a general view of the materials. In case something of special interest is found, the SPDS will position the sample under the RLS instrument spot for detailed analysis with Raman spectroscopy and under MOMA LDMS for a first analysis of organic content with laser desorption mass spectrometry. The combination of RLS, MicrOmega, and MOMA-LDMS data will provide the necessary inputs to decide if the sample is analyzed with MOMA-gas chromatograph mass spectrometry (GCMS). The reason is that the number of ovens available for the GCMS is limited, so only a subset of samples will be analyzed with this technique.
11. RLS Spectral Acquisition
The operation mode at instrument level is understood as the series of operations and algorithms that the instrument needs to execute autonomously for obtaining a Raman spectrum of the highest possible quality. The definition of the operations mode needs to implement the actions that the human operator normally performs on Earth (laser focusing on the sample, adjustment of the spectrum's acquisition time, elimination of fluorescence …) in a system able to autonomously decide the best parameter combination for a particular measurement. An additional difficulty that the Raman spectral acquisition poses for automatic methods derives from the great difference between the molar scattering efficiency of different materials, which can reach 4–5 orders of magnitude.
When acquiring Raman spectra in the laboratory, there are many instrument parameters, especially for the CCD device, that must be configured to optimize spectra. Among these are gain, readout speed, and even temperature. However, under Mars operational conditions, the number of parameters requiring adjustments has to be reduced to the minimum. Here two operational-level parameters, Integration Time (t i) and Number of Accumulations (n a), have been selected as the key parameters. Both can be easily modified without affecting the instrument performance, but just total operation time. However, several undesired effects such as fluorescence and cosmic rays can severely modify the reference spectra and thus impair the t i and n a calculation.
Taking into account these considerations, the instrument needs to identify and correct several issues to efficiently acquire Raman spectra: • Saturation avoidance: if spectra saturate, this can lead to errors in the operation flow. Thus, it is of paramount importance that the spectra used for reference do not saturate. • Fluorescence detection and removal: the fluorescence effect on a Raman spectrum increases the background level of the spectrum, potentially decreasing the signal-to-noise ratio (SNR) of the Raman signals. Given that the fluorescence background can decrease when the sample remains illuminated by the laser, RLS implements a method for automatically calculating the fluorescence quenching time based on the background decreasing rate. The control applied by RLS basically consists in quenching the fluorescence emission by keeping the laser on for several seconds/minutes and reading spectra periodically. The effect of the laser is to saturate the energy states of the fluorescence emission, resulting in a gradual decrease of the background. When the difference between two consecutive spectra became stable and lower than the precedent difference, the RLS algorithm stops and the next spectrum is the real one taken as a measure. Fluorescence is very common in terrestrial samples because organics are ubiquitous on Earth. However, it is not expected to observe this effect on Mars very often. Nevertheless, the algorithm is of prime importance in case organic traces are detected and also when other fluorescence sources appear on the samples. • Cosmic ray detection and removal: Cosmic ray is an important source of spectral perturbation and, in particular, on Mars where there is a higher flux than on Earth. To reduce and control this effect, the RLS instrument apart from the shield on the CCD and other critical elements will use dedicated algorithms to detect and remove cosmic rays and spikes that can appear in the reference Raman spectra, and which could cause failures in the algorithms if considered as peaks. Details of the methodology can be seen in Lopez-Reyes (2015). • SNR calculation for on-board operations: RLS instrument implements an algorithm for the calculation of the spectral quality of a spectrum. These data will be used as the essential reference parameter in the acquisition parameter adjustment algorithms. Details can be also seen in Lopez-Reyes (2015).
After these aspects have been analyzed and corrected (in case), the algorithm provides the adjustment of the integration time and the number of accumulations adequate to optimize the spectral quality-based spectrum.
12. RLS ExoMars Simulator and BB
To achieve the maximum scientific return from the RLS instrument once on Mars, it is necessary to perform experiments on Earth under the same operational conditions afforded by the rover. To do so, the team has developed two main tools: (1) the RLS ExoMars simulator at the Unidad Asociada UVa-CSIC-CAB and (2) the RLS BB at INTA (Fig. 12) (Lopez-Reyes et al., 2013a). The scientific simulator allows performing many scientific experiments under conditions similar to those provided by the ALD of the ExoMars rover. It also provides the means to define and develop the necessary algorithms for the automation of the instrument. The basic configuration of the ExoMars simulator consists of an XYZ micrometric positioning system with an optical head attached to the Z axis, and a refillable container attached to the XY positioners. With this system, samples can be analyzed at the mineral grain scale with a three-dimensional positioning accuracy of 2.5 μm. The Raman optical head has a spot size of 50 μm, which matches the requirements of the flight instrument. An internal camera permits imaging the sample through the same optical path. In addition, the Raman optical head is coupled to an external camera so that the sample can be imaged by using different fields of view. The system is also designed to flatten the sample powder with an SPDS-like design, and to position the sample under the instrument's optical head, which will automatically focus on the sample surface.
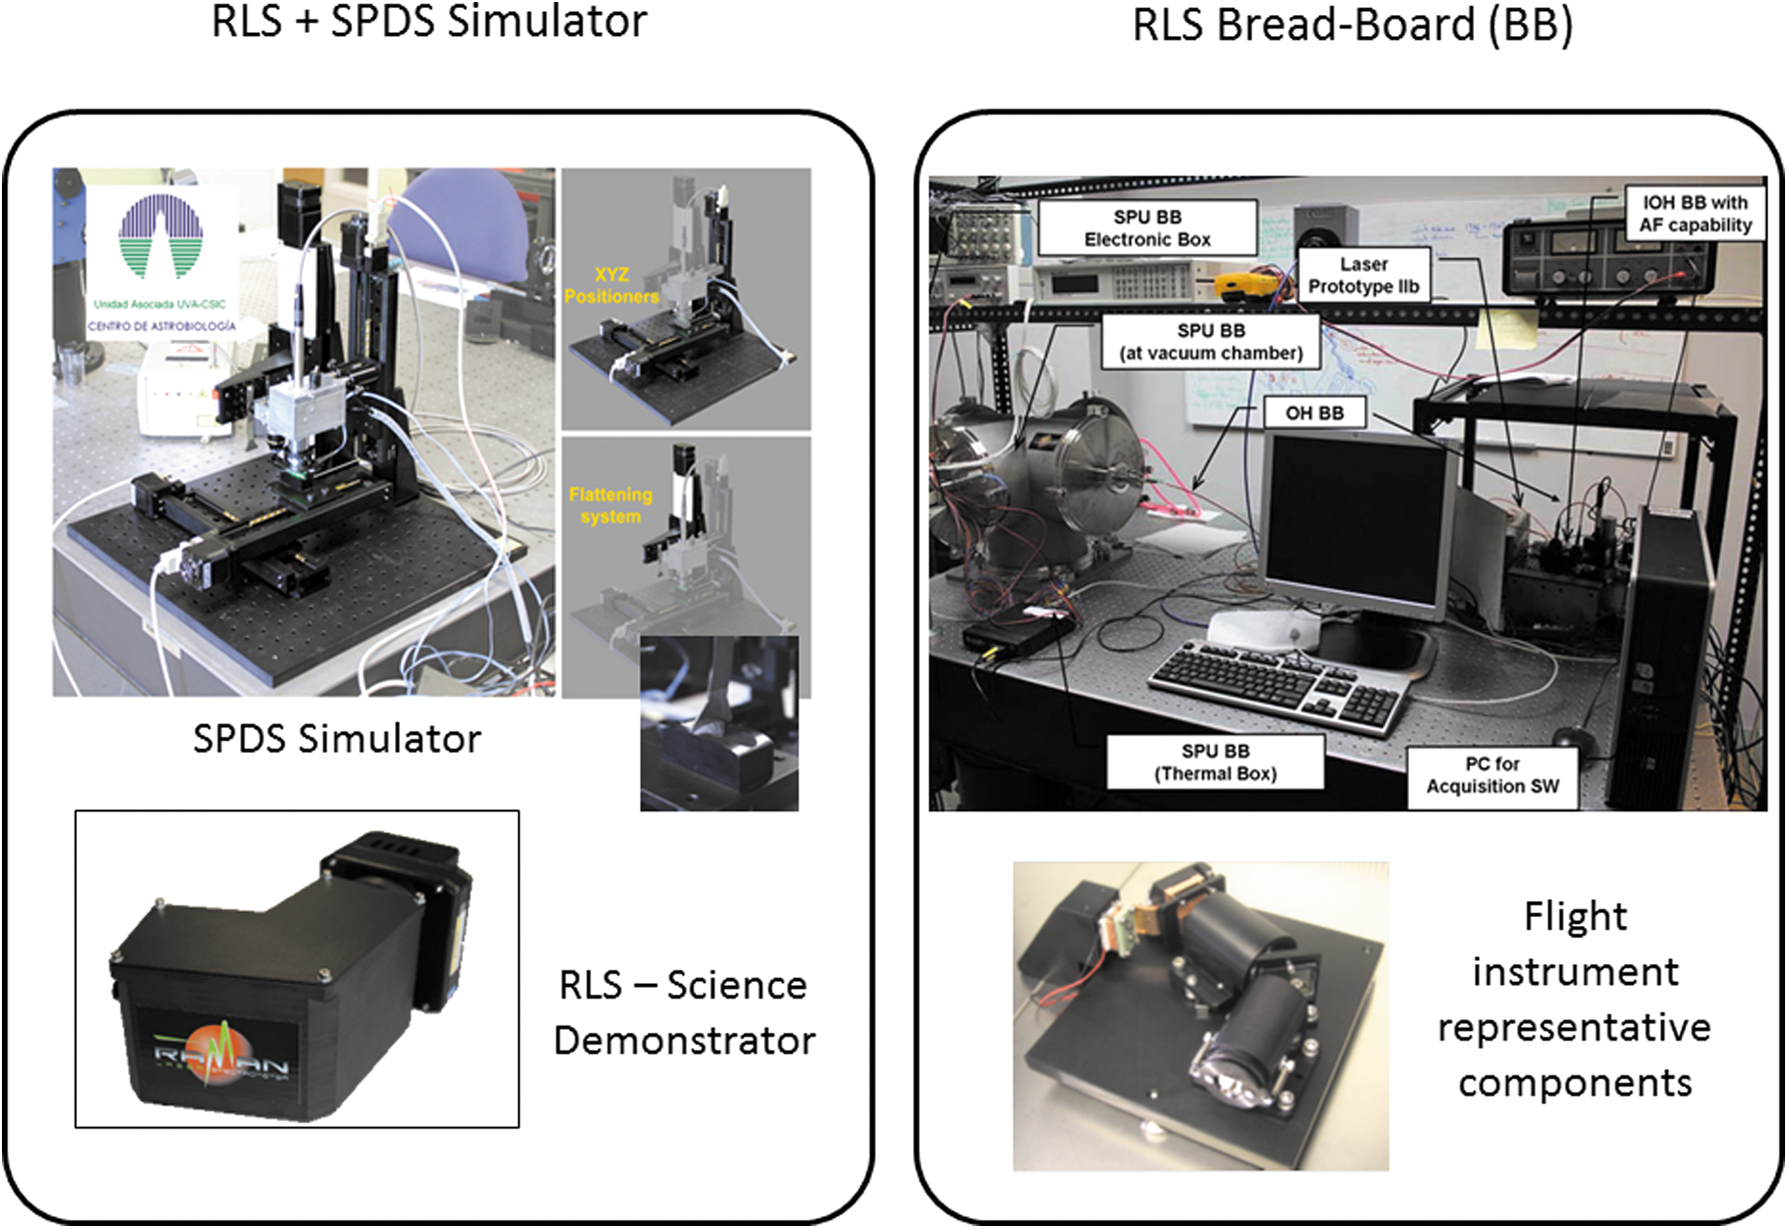
The RLS simulator (left) and BB (right). Both are complementary tools for developing and testing the Raman instrument. BB, bread board.
In addition, the RLS ExoMars simulator has been equipped with a martian chamber to allow performing analysis of samples on a relevant environment (Catalá Espí, 2015). This chamber (Fig. 13) allows analyzing the samples at temperatures and atmosphere representative of the ones that will be found inside the ExoMars rover during operation.
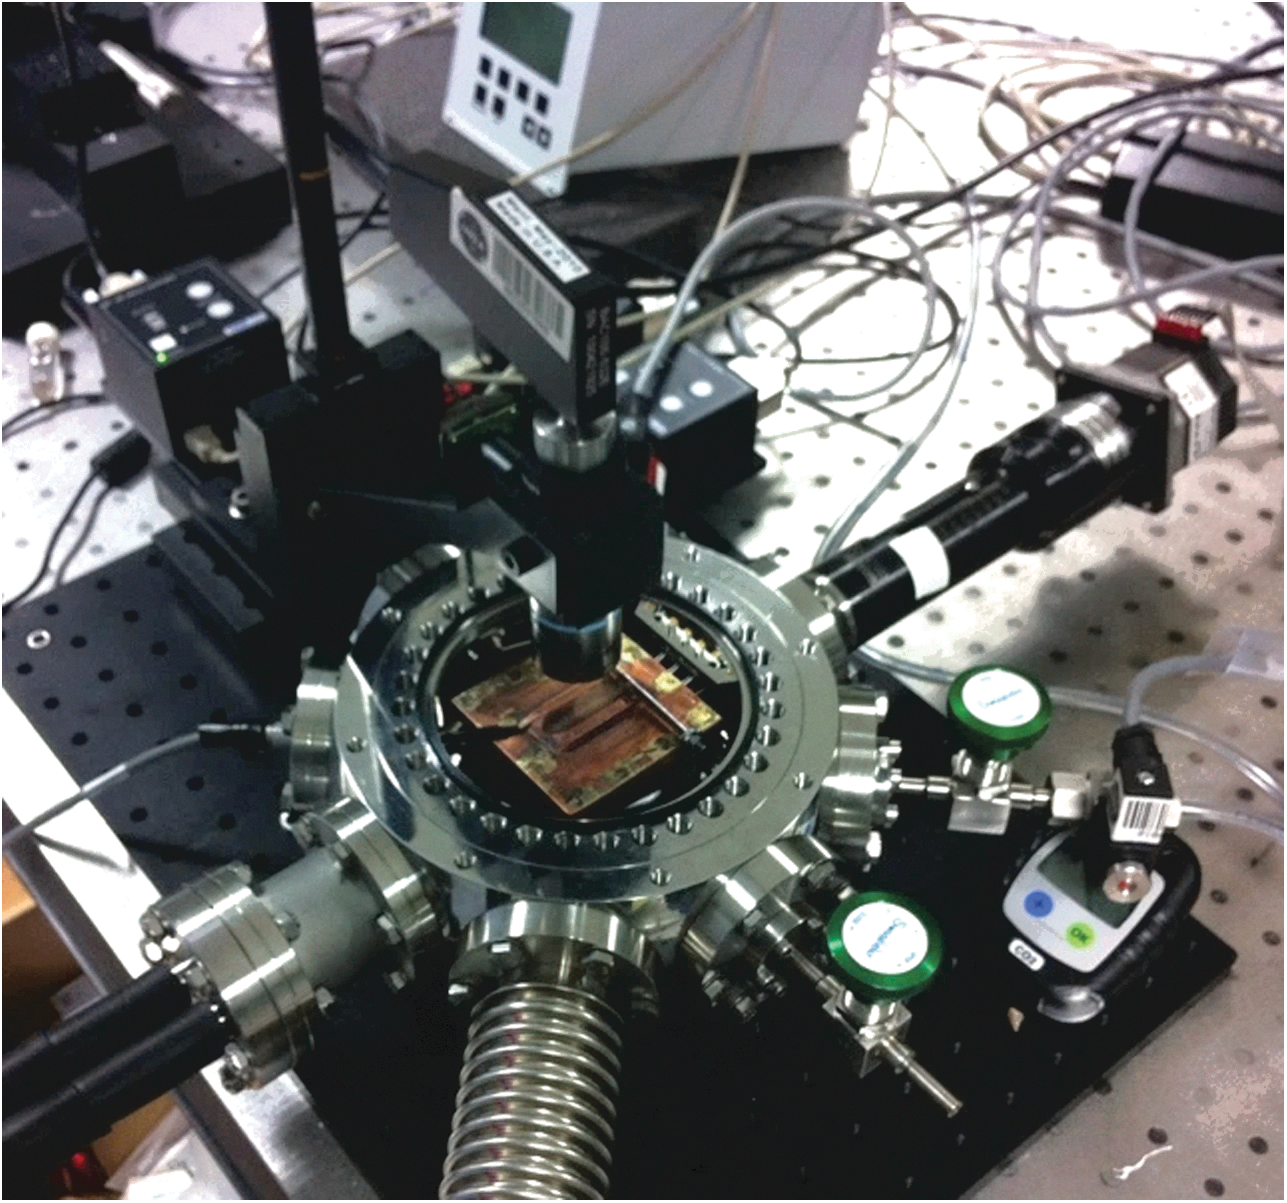
The martian chamber for RLS powdered sample analysis. The chamber also includes a flattening system working under martian conditions to compare the surface characteristics with the prepared under terrestrial conditions.
The BB has been conceived to evaluate the entire instrument's behavior. This analysis includes verification and validation of all the scientific requirements previously analyzed with the simulator. In addition, the BB can be utilized to verify the radiometric model, Raman spectral quality, the calibration procedure, as well as the operation mode. The BB has been built in several steps, starting from commercial, off-the-shelf components and improving to flight representative components. And while the science demonstrator can only work in terrestrial ambient conditions, the BB can operate in mission relevant conditions (temperature and pressure).
13. Ground Segment
The RLS ground segment combines a fully functional replicate of the instrument together with the instrument database (IDB) and Instrument Data Analysis Tool of RLS (IDAT) to do the following: • Assess the activity plan to be uplinked as commands to the instrument in the mission's operational phase—via the rover operations control center (ROCC). • Generate engineering and scientific data products after RLS operation in the processing pipelines at ROCC, and combine data product generation of different instruments and ancillary data from the rover.
Data resulted from each sample acquisition will be scientifically cross-correlated with that obtained by other instruments.
• Generate a set of key performance indicators after each operation to provide a broad overview of the scientific trends of the instrument.
The IDB provides tables (in the SCOS2000 format) and the RLS processing pipeline (following PDS4 standard) to comply with the long-term use of the RLS data hosted in the ESA archives.
IDAT is a ground segment system software/hardware tool that will be used during the operational phase of the mission, not only for instrument health assessment but also for short (and long)-term science exploitation. Short-term use of IDAT will, on a daily basis, provide the scientific team operating the rover with very fast scientific results to make tactical decisions for the following day's rover activities. Having this information analyzed after a very short time (minutes) after the reception of the data from the spacecraft is of paramount importance to take the best tactical course of action. However, this kind of operation also imposes very strict requirements regarding the robustness and reliability of the methods applied for the analyses. It also requires the development and population of databases both under terrestrial and martian conditions. The comparative analysis of samples under terrestrial and martian conditions shows that no noticeable structural changes are detected with the difference on temperature, pressure, and atmospheric conditions between the two planets. Only in some specific cases of very high hydrated phases, minor changes in the OH vibrations were observed. And as the general trend, the Raman widths slightly decrease as a consequence of the low temperature under martian conditions.
In addition, implementation of routines for the automated analysis of the results is included. These tools will also be available to the scientific team for detailed (and slower) analysis of the data, providing support for the long-term science use of the RLS data products by the team (Fig. 14).
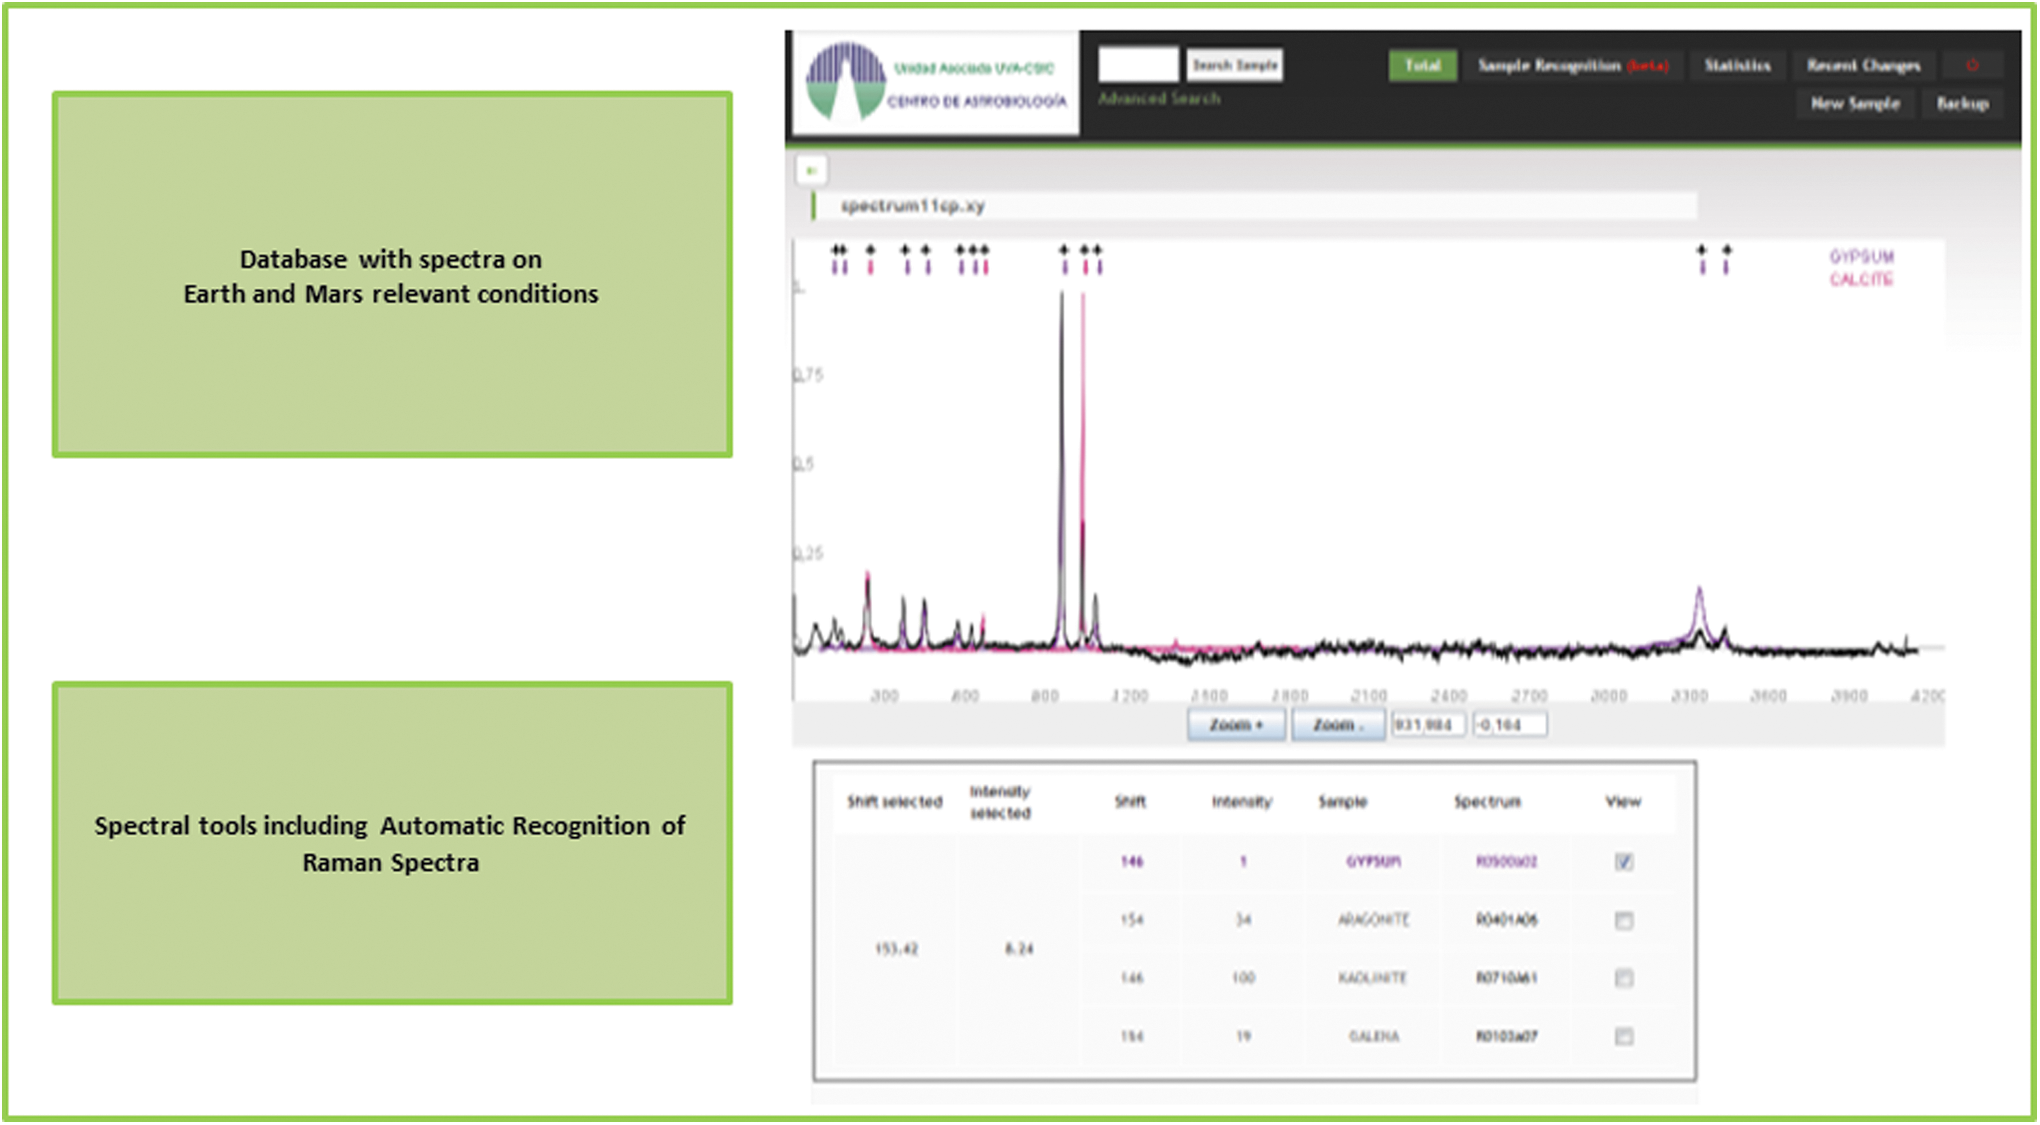
A general picture of some of the main tools developed for the RLS operation and scientific activities prior and during the mission. These tools are grouped in two main systems: one related with the construction and management of spectral databases under terrestrial and martian conditions and the other related with the spectral treatment, including automatic recognition of spectra.
14. Raman Performances and Scientific Capabilities of RSL Within the Mission Framework
14.1. Laboratory analyses with the RLS simulator
To fulfill the mission's scientific goals, the Raman instrument must obtain good quality spectra from the wide variety of materials available at the landing site and encountered while roving on Mars. The main information sources about these materials and their spectral responses are the previous missions, the meteorites (in particular martian meteorites), and the potential martian analogues on Earth. As no Raman has been placed on the martian surface until present, the real materials on which Raman spectroscopy can be applied, and on the basis of which spectral databases and models for interpretation of the geological processes on Mars can be developed, are those obtained from martian meteorites and terrestrial objects.
Raman spectroscopy has demonstrated to be a powerful method for precise analysis of martian meteorites and the RLS team has studied several of them (Rull and Martinez-Frias, 2003; Rull et al., 2004; González-Toril et al., 2005; Rogero et al., 2007).
On the contrary, terrestrial analogues are very interesting. Although no place on Earth is like Mars, several locations offer the possibility to analyze geological processes, and the related materials, that can be compared with those produced on Mars in the past. Of particular importance are those materials related to liquid water alteration processes because understanding the hydrologic cycle of Mars is a key aspect of understanding its geological cycle. The team has analyzed materials from a wide range of places on Earth. Among these are Rio Tinto, Jaroso Ravine, and Tenerife in Spain, Svalbard Islands (Arctic), Barberton (South Africa), and Mauritania.
The methodology used consisted in a double study. At the field, in situ analysis with portable science prototypes of the Raman under development for ExoMars; and in the laboratory, using conventional micro-Raman techniques and the spectral operation simulator (Lopez-Reyes et al., 2013b) allowing reproducing the real RLS operation on Mars (Figs. 12 and 13).
Although the spectral information during the operation will be obtained by observation with the Raman optical head 20 points in a single line on the sample surface, the simulator allows several other options, such as two-dimensional mapping, surface height profiling by using the optical head autofocus device, and finally, the capability to combine other techniques such as an imager in the visible or in the IR. This last case is of prime importance because the possibility to perform combined science between Raman and the IR spectrometer MicrOmega, also onboard the ALD, adds a very important extra value to the spectral observations. This combined science rests on the ability of the rover to place both instruments over the same spot in a sequential way.
In Figures 15 to 19, some results obtained by the simulator working in terrestrial conditions are presented.
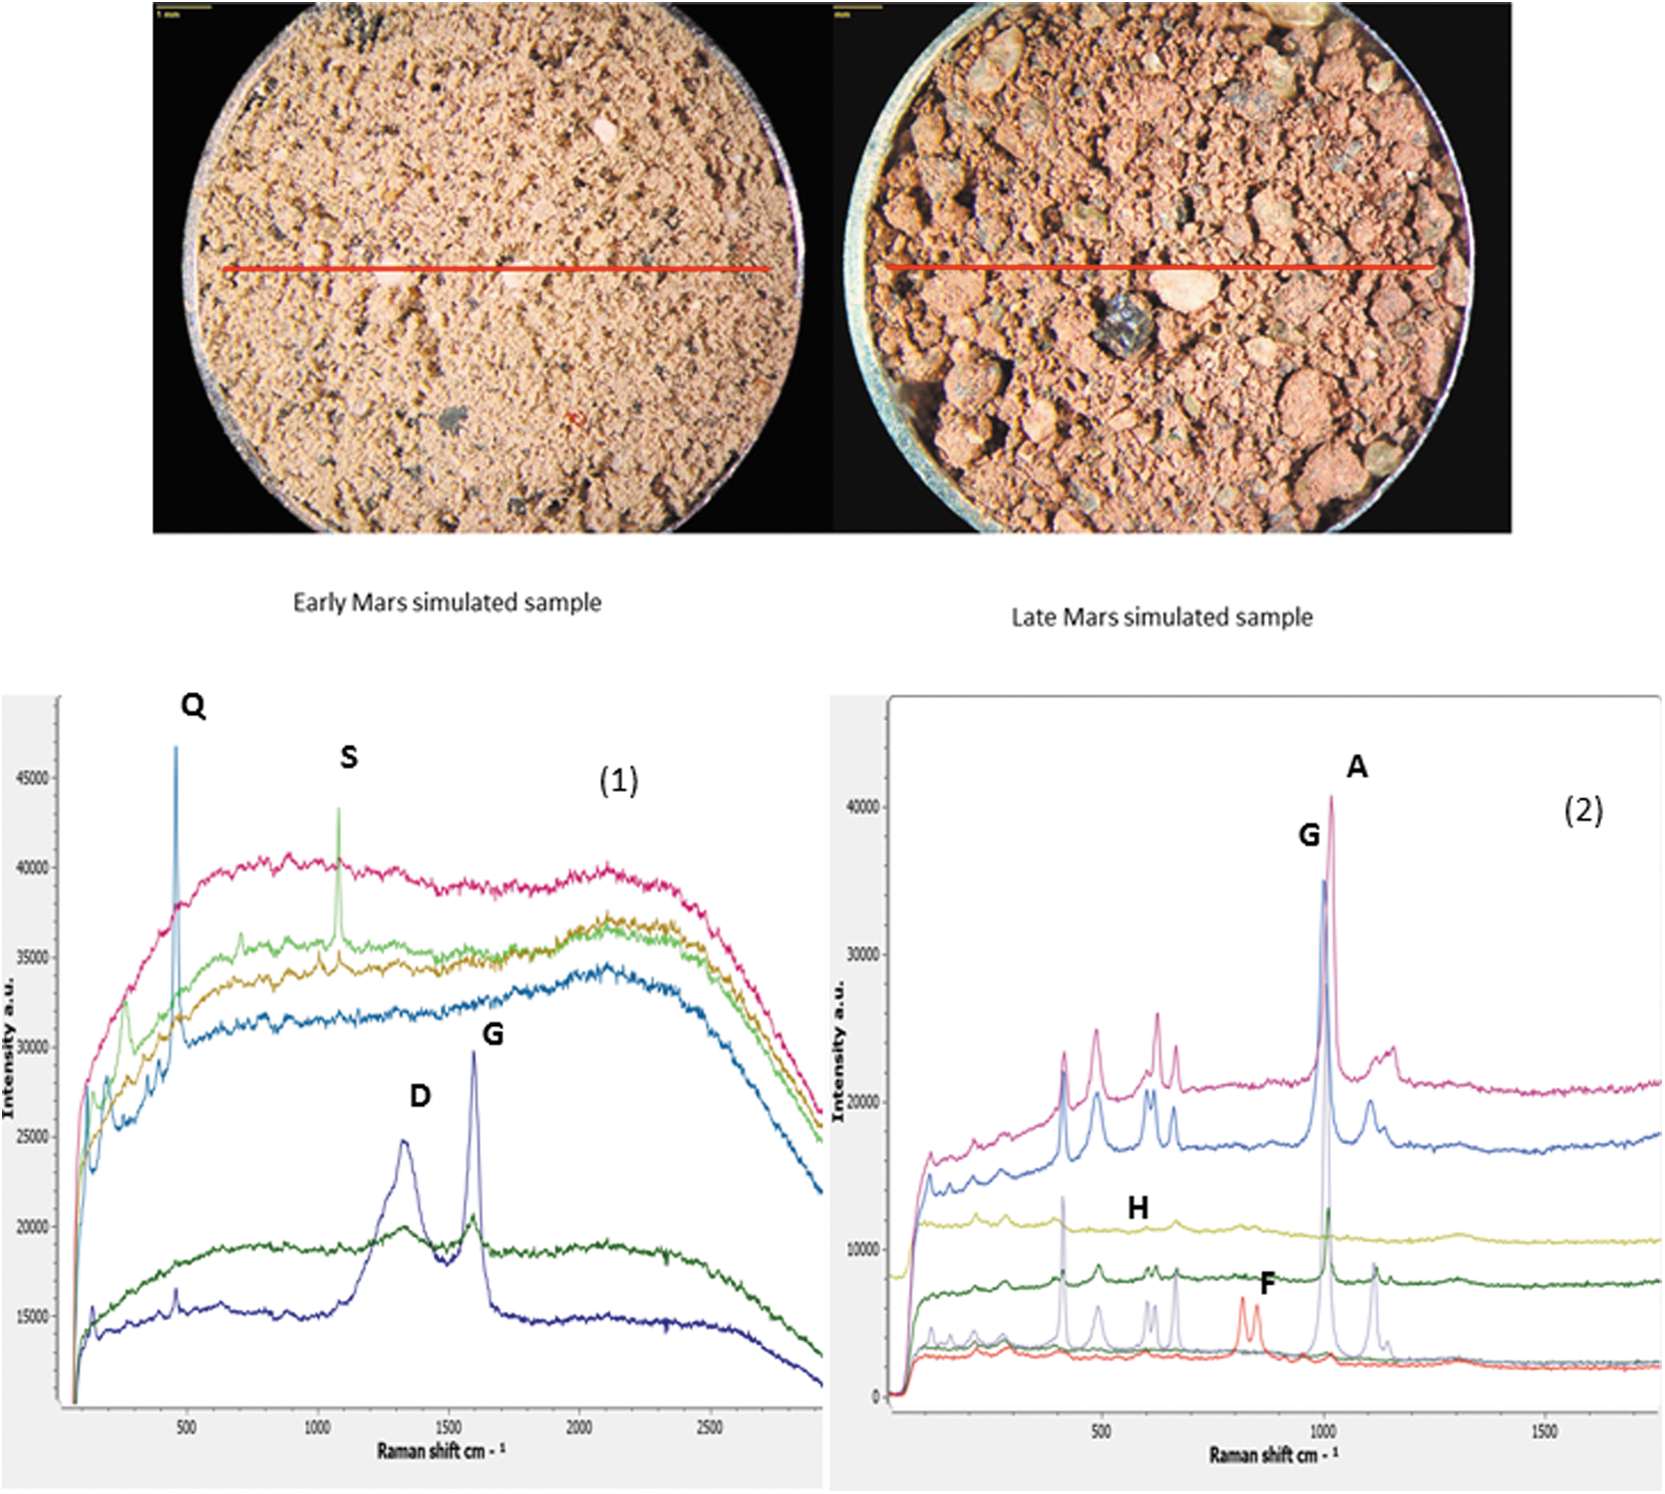
Raman spectra performed in automatic mode along a line (25 spectral points) on two samples prepared by Kaiser-Threde for ExoMars test. On top the samples and the 10 mm line along which the spectra were taken. Bottom, a general picture of some of the 25 recorded spectra in both samples. (1) Early Mars main phases depicted quartz (Q), siderite (S), and carbon (D, G bands). (2) Late Mars main phases depicted gypsum (G), anhydrite (A), hematite (H), and forsterite (F). It is interesting to note that in automatic mode at some spots no clear Raman signal is obtained. This is part of the normal outcome of the process; the spectra are recorded at fixed steps with no possibility to optimize in position.
In Figure 15 are shown Raman spectra performed in automatic mode on two simulant samples of early and late Mars average materials prepared by ESA and Kaiser-Threde. Some of the spectra obtained from 25 points along a line are presented overlaid to demonstrate the real results obtained by the simulator after an automatic scanning in which at each spot the spectral acquisition parameters are obtained from algorithms. It is easy to see that the spectral quality is different at each spot and in some cases, it is hard to obtain useful spectral information. In other cases, the spectra are of high quality. Nevertheless, from the whole set of spectra, it was possible to identify all the mineral phases present in the samples, including minor phases. In early Mars sample, the components detected were quartz, muscovite, albite, siderite, chlorite, and hematite. In late Mars sample, the minerals identified were gypsum, anhydrite, hematite, forsterite, and minor quartz and actinolite. The mineral identification was performed by using the spectral databases developed in this project and confirmed with the literature. These minerals were also confirmed with XRD as a complementary technique, although some of the minor phases were difficult to identify unambiguously. The carbon features were not detected by XRD.
The point-by-point technique also permits quantifying the relative amounts of mineral phases in complex admixtures. The method uses spectra normalized by the maximum intensity at each point and the average over all the points analyzed along the line (see Lopez-Reyes et al., 2012, 2013b for details). This process allows increasing the accuracy and detection limit.
In Figure 16, an example is presented for a binary admixture of calcite and gypsum. Concentrations (1:99 and 90:10) are shown in Figure 16A, B, although the whole range from 1:99 to 99:1 was analyzed. These figures represent, for 30 points analyzed on each sample, the relative maximum intensity of the most representative peaks of calcite (blue) and gypsum (red).
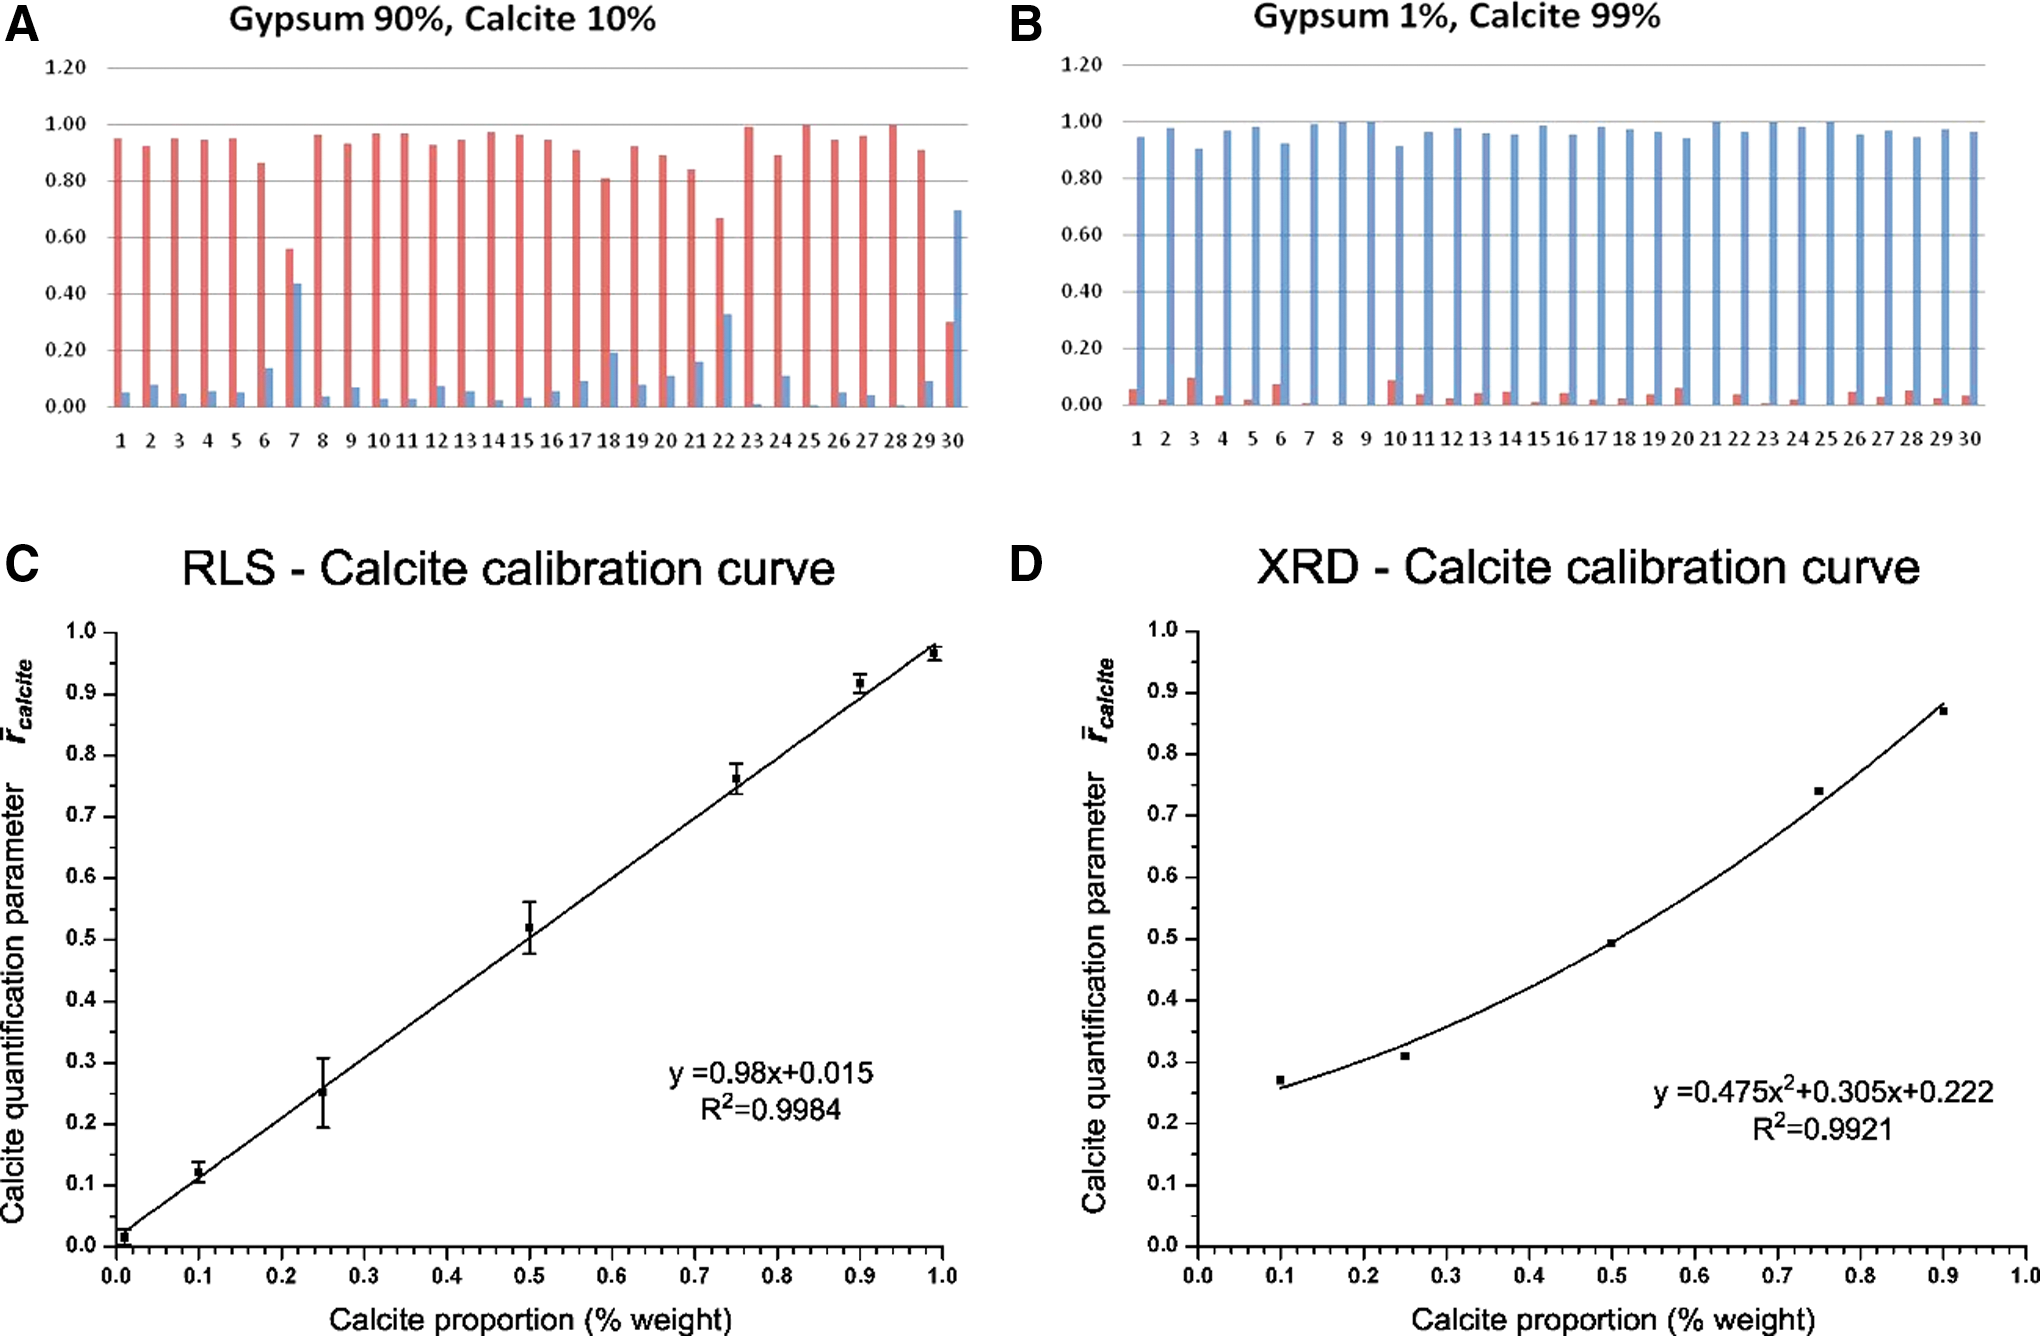
Pseudo-quantification of mineral phases in admixtures using the point by point spectra obtained with the simulator. In this example a binary combination of calcite and gypsum is used for calibration. Detection limit reached around 1%. Above, the relative intensity of the main peaks of calcite (blue) and gypsum (red) in 30 points of binary mixtures in proportion 90:10
The results show that it is possible to see the minor concentration phase at many spots along the line. This is an important result verified in several other examples because to experimentally demonstrate the simple analysis along a line in the bulk powdered sample is enough to characterize the mineral composition of the whole sample, given a sufficient number of spots are analyzed. Furthermore, when the intensity data for each compound from the 30 points are averaged, the calibration curve shown in Figure 16C is obtained. For comparison, the calibration curve obtained with XRD on the same admixture is shown in Figure 16D. As shown, the results with RLS improve the calibration curve obtained when using XRD in terms of curve linearity and detection thresholds, opening the possibility of pseudo-quantifying mineral phases during operation on Mars, without the need to perform corrections on the calibration curve. Details on this work can be found in Lopez-Reyes et al. (2012, 2013b).
Another interesting aspect of the operation with the RLS inside the framework of the ExoMars mission operation cycle is the possibility to combine the potential of two or more techniques to enhance the potential for identification and analysis of relevant materials for the mission objectives. For that the key point is to have the possibility to analyze the same spot with different techniques. In Figures 17 and 18, an example of combined science is illustrated. Figure 17 shows the combined SPDS-RLS setup mounted in collaboration with Thales-Alenia at OHB's facilities in Munich (Musso, 2013; Paul, 2013). Its objective was to check the possibility to bring a particular spot of sample material (one that could have been identified with MicrOmega) under RLS field of view for analysis. The sample was a mixture of quartz and calcite with minute amounts of olivine. In this case, an unknown feature having a diameter of about 70 μm was identified by an imager simulating the MicrOmega capabilities. The SPDS carrousel computed its position and doing the normal operations cycle tried to move the feature under RLS optical head. The real methodology consisted on placing the carrousel at some fixed distance from the estimated feature's position and then gradually advancing at the smaller steps achievable (30 μm nominal), fine tuning spatially the line around the detected feature.

The SPDS setup at Kaiser-Threde facilities in Munich (right), including the crushing and dosing stations and the carrousel and the setup with the RLS optical head and visible camera head (left) to simulate the combined science positioning capabilities. SPDS, sample, processing, and distribution subsystem.
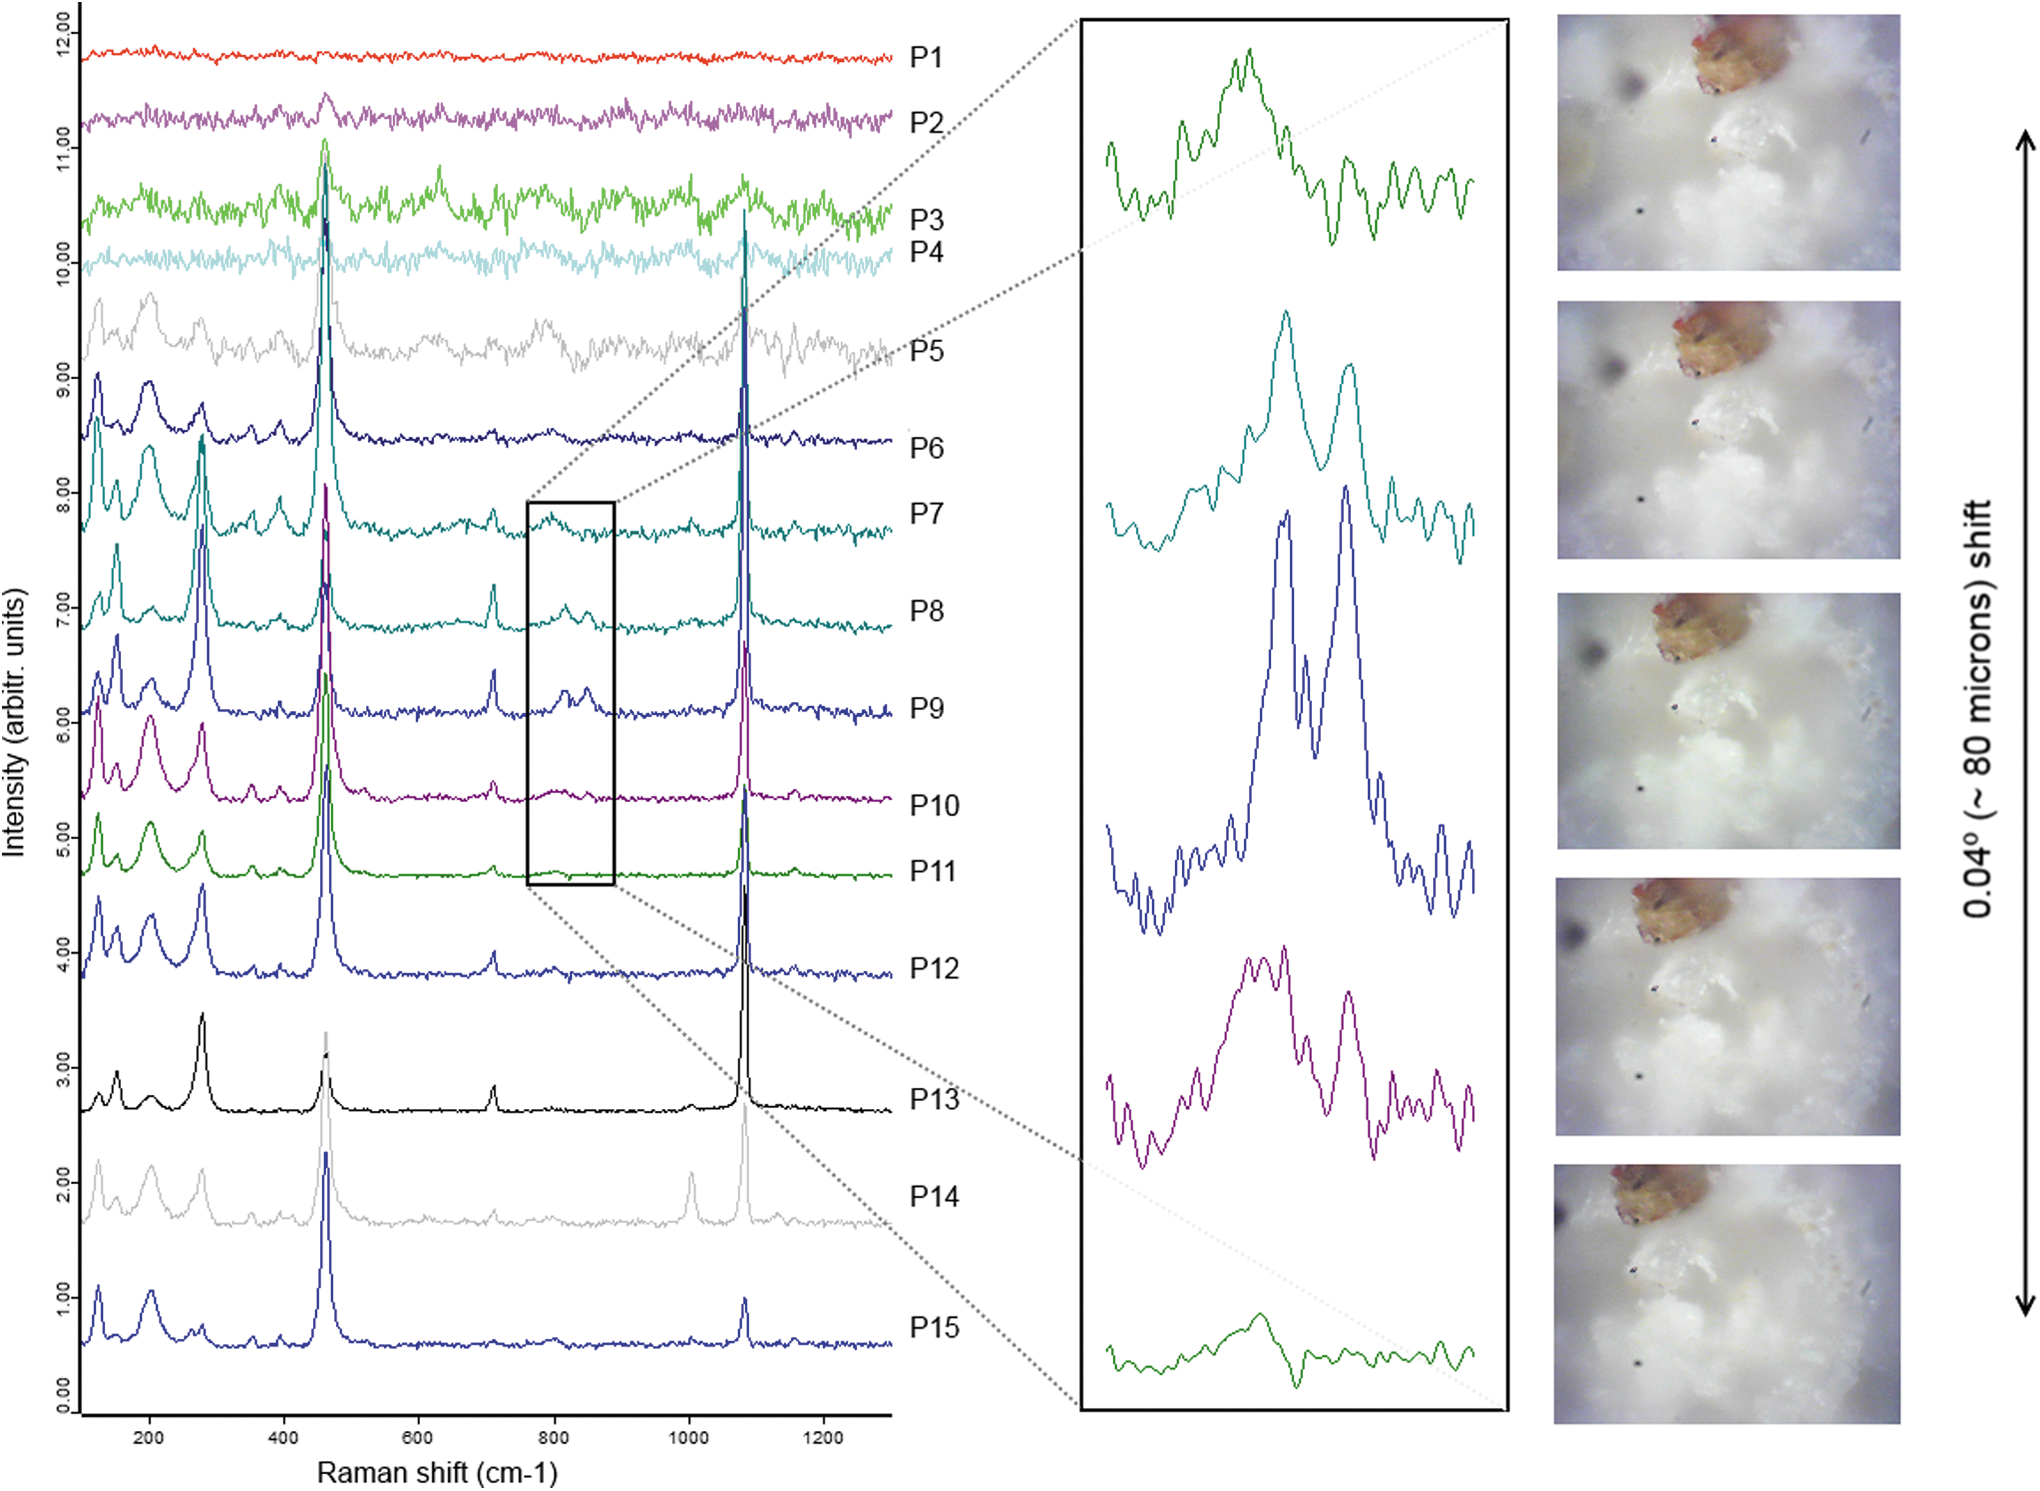
Raman spectra obtained on a powdered sample in which a particular feature is detected with an imager on the surface. After performing the complete scanning with the imager, the carrousel allows to recover the position of the particular feature. For that an estimated position before the possible real position is placed under the RLS-optical head and an automatic Raman scanning is performed using a 30 μm step. The feature is reached by the Raman head and identified as olivine using the characteristic spectral doublet at 824 and 856 cm−1. The images depicted on the right side of the figure are associated with the zoomed spectra and stress the difficulty to visually detect this feature, which is unambiguously detected by the spectrometer.
In Figure 18, the Raman results obtained along 15 points around the feature are presented (Lopez-Reyes et al., 2013b). The Raman spectra clearly show the spectral features associated with the mineral grain species present in the admixture (calcite and quartz) and also at particular positions (P8 and P9), new bands clearly identified as a doublet at 825 and 856 cm−1. This doublet is characteristic of olivine (forsterite). The olivine spectral features practically disappear at positions before and after this particular point. The results confirm the capability to detect specific singular features on the crushed sample's surface when using the SPDS carrousel and, therefore, the possibility to perform combined science with the different instruments during an ExoMars operational cycle.
Very recent results obtained at the University of Valladolid using the MicrOmega engineering and qualification model, in combination with the RLS science prototype and the powder analysis simulator, show that the two instruments can work together extremely well, complementing each other's capabilities. The results obtained will be published elsewhere.
As it has been mentioned previously, no important spectral modifications have been observed under the change from Earth to Mars conditions on fine grained powdered samples. This means that the vast majority of materials present the same Raman spectrum on Earth than under mission operation conditions and no corrections are necessary, allowing the use of terrestrial spectral databases.
A different problem that needs to be stressed is the thermal behavior of the mineral grains, in particular for the fine-grain fraction, when illuminated by the laser under both planetary conditions. In Figure 19, some results are presented on jarosite a key mineral in the geology of Mars. Jarosite is a thermolabile material and was analyzed inside the Mars chamber with the simulator. In the experiment, the laser irradiance on the sample was changed at different temperatures in the range 5°C to −25°C, under pure CO2 atmospheric composition and typical Mars pressure. For each irradiance level, visual images of the surface and Raman spectra were taken. These experiments were compared with the same performed at room temperature and terrestrial atmospheric conditions. Details can be seen (Catalá Espí, 2015). The laser irradiance levels to avoid thermal damage and structural changes are in average ∼60% of those on Earth. And this value is not very different for other thermolabile materials as hematite or goethite. These results are considered of prime importance for the spectrometer design and its safety when operating on Mars, in particular, considering the possibility of detecting organic compounds. In consequence, the laser power output has been reduced accordingly to a safe level for avoiding this issue but not too low to reduce the spectral quality in the majority of the samples to be observed.
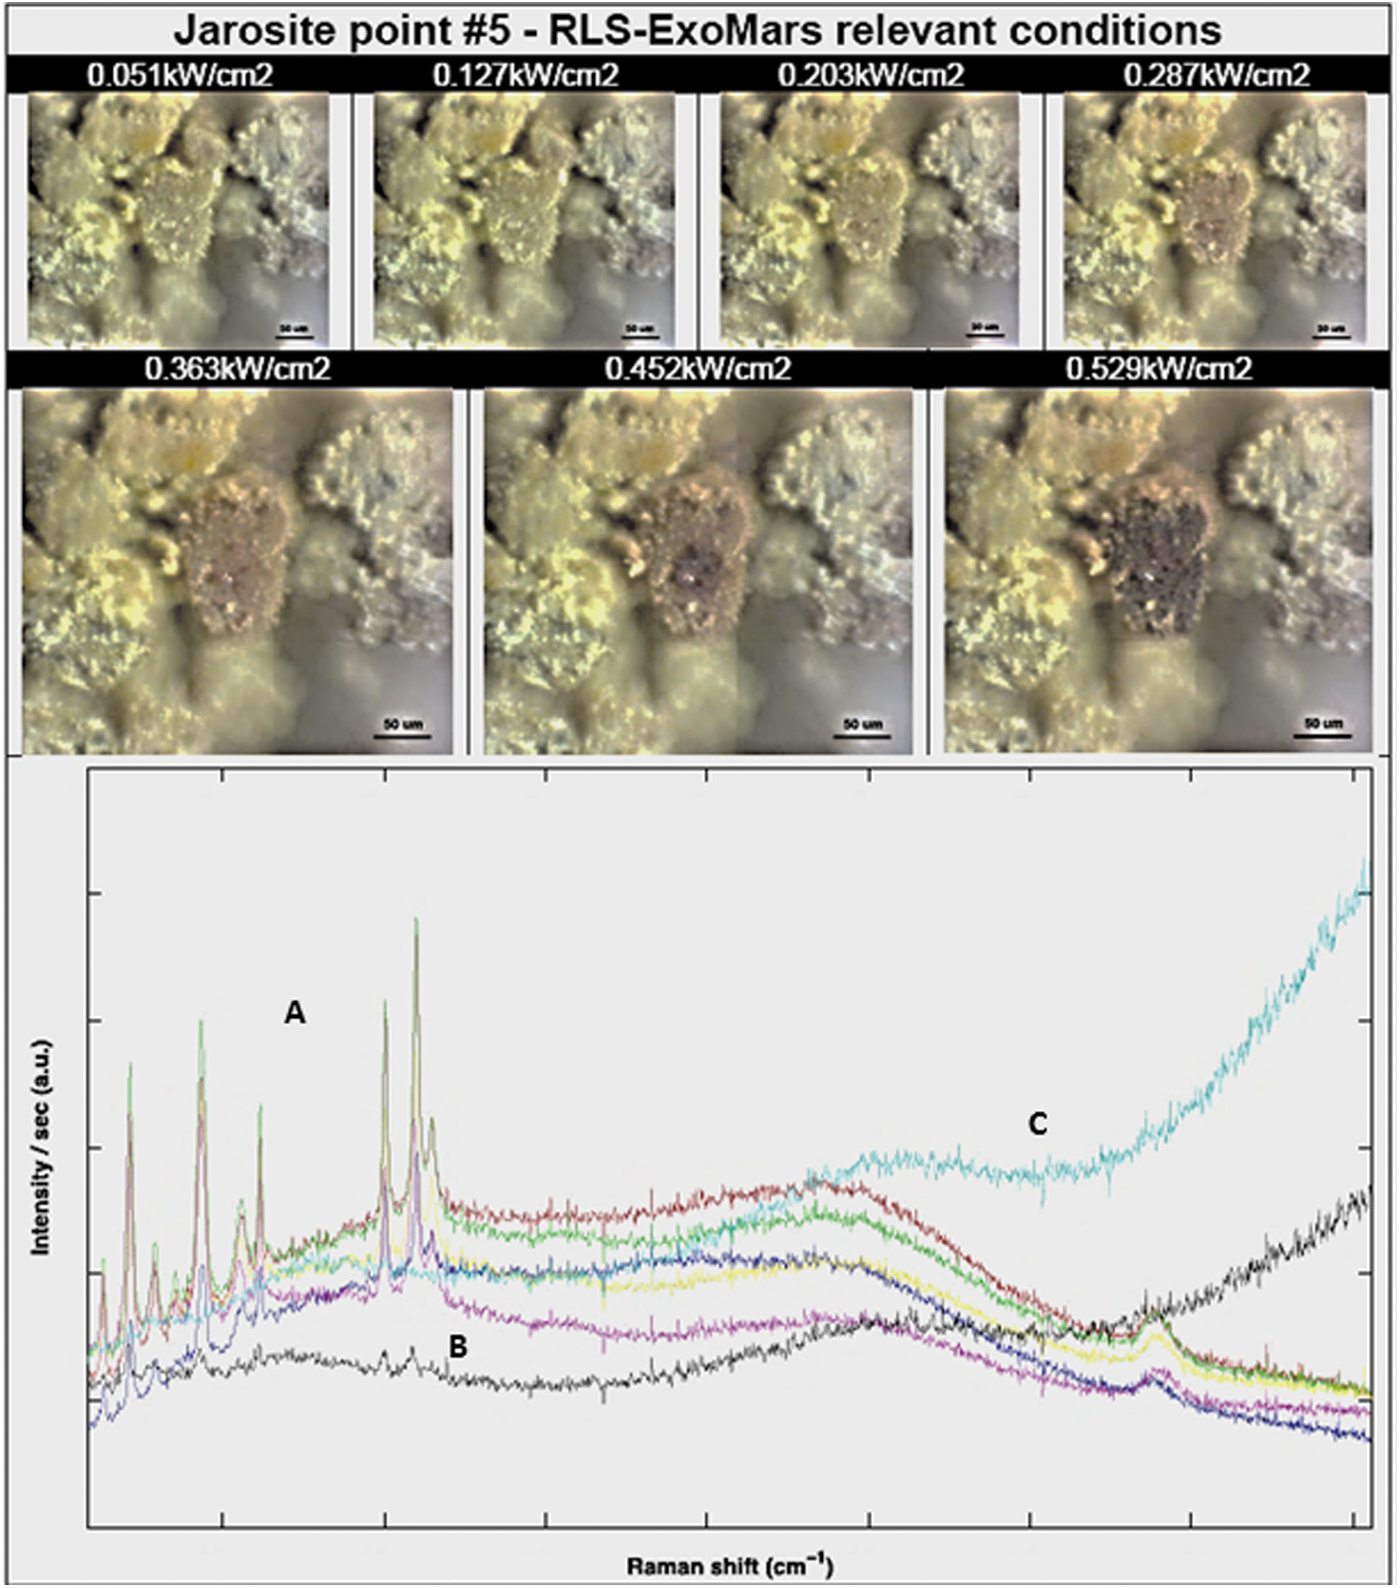
Effect of laser irradiance level on the Raman spectral quality of thermolabile samples (jarosite in this case) under relevant martian conditions. The irradiance threshold for thermal damage is about 60% of the level under terrestrial conditions. Nevertheless, the visual effect of the damage is not directly correlated with the spectral modifications. (A) Spectra in the range of irradiance 0.051 to 0.362 kW/cm2 show the same jarosite spectral features despite the color change from the original to brown. (B) Spectrum obtained with 0.452 kW/cm2. In this case a dramatic structural modification is observed. Visually only a darkening of the central area of the spot laser is observed. (C) The darkening area increases in this picture but the color is not markedly different from (B). The Raman spectrum shows no vibrational features, only the thermal response. (Color graphics available at
It is also noticeable in Figure 19, the difference between the visual aspect of the potential thermal damage and the Raman spectral response. A sample spot irradiated at 0.28 and 0.36 kW/cm2 laser irradiance shows a different color (brown in this case) than the same spot irradiated at very low level indicating apparent thermal damage. Nevertheless, the spectra still are the same with only small differences in the S/N ratio. When the irradiance increases over 0.45 kW/cm2, also the spectra change dramatically indicating real structural damage. This is a relevant result because on Mars, the RLS instrument will work without imaging the sample and only the spectral response will be obtained.
14.2. RLS in situ field analysis
Raman spectroscopy has found many field applications, but not only. Although it is mainly used for mineralogy, this technique is also very useful in cultural heritage work, where the spatial resolution (mineral grain scale achievable), the typical fast data acquisition—and nondestructive character—allow the reliable identification of materials in different conditions without any sample preparation. In our case, two RLS science prototypes have been developed for those studies. These instruments use the same configuration, optical design, laser illumination, and spot size as the flight model, but are built with commercial components. They are also ruggedized for use in harsh environments (cold, hot, dust, etc.) in the field (Fig. 20). Under most conditions, ambient sunlight is a problem that can be avoided to a great extent by using a protective device in the optical head.
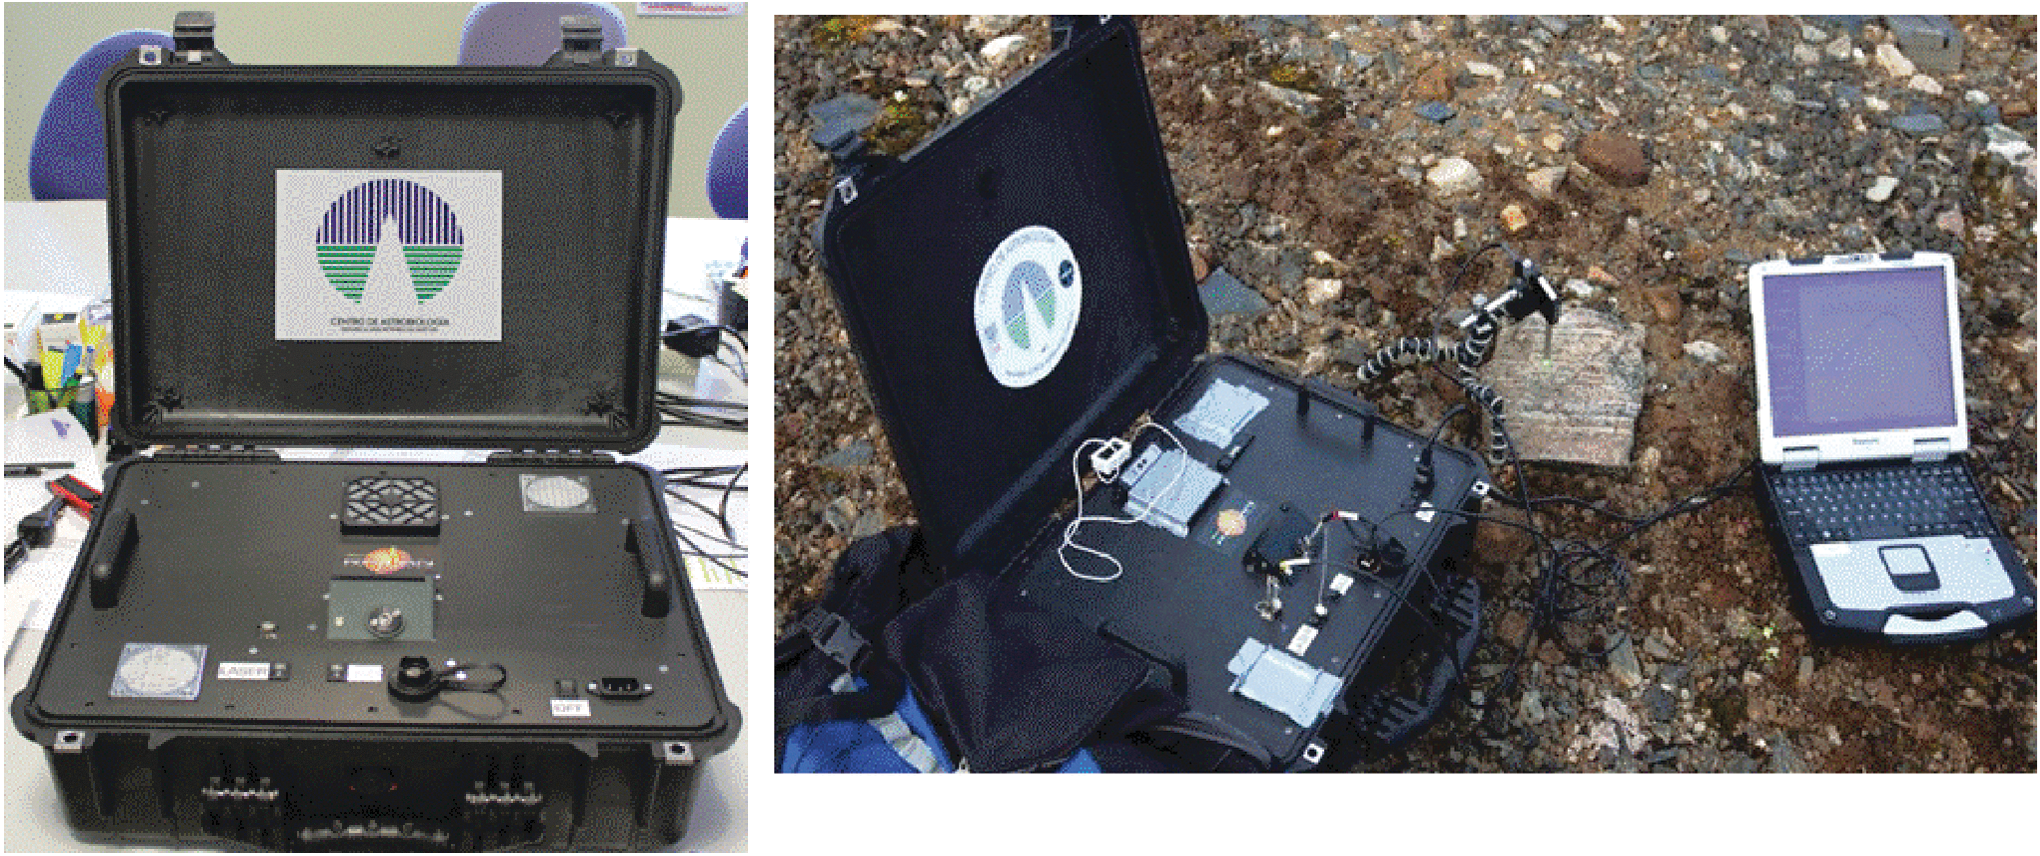
The RLS science prototype adapted to work in field conditions (left) and under operation in the Arctic in an AMASE (NASA-ESA) expedition (right).
In any case, real Raman spectra in the field normally show a high background and a small signal-to-noise ratio. Then, additional spectral manipulations—such as background subtraction, filtering, and signal-to-noise enhancement, among others—become necessary. These manipulations are part of the instrument software included in the IDAT.
The experiments and the data volume collected over the last years are huge. Therefore, we only present but a small fraction of these results here looking for interesting and representative areas.
Hydrated iron-bearing sulfates and iron oxyhydroxides became very important minerals for the Mars geological description after they were detected in Meridiani Planum by the Miniaturized Mössbauer spectrometer MIMOS II onboard the Opportunity rover (Klingelhöfer et al., 2004; Squyres et al., 2004). In particular, the presence of jarosite (KFe3+ 3(SO4)2(OH)6) was regarded as a strong mineralogical evidence of wet and probably highly acidic conditions that prevailed in the Hesperian (3.7 to 3.0 Gy ago) (Clark et al., 2005).
After this discovery, potential Mars analog sites on Earth, in which jarosite is produced by different mineralogenesis processes, have become the subject of great interest (Frost et al., 2006; Edwards et al., 2007; Sobrón et al., 2009; Rull et al., 2014). Among those, the Jaroso Ravine (Almería, SE Spain), the world type locality of jarosite, and the Rio Tinto site (Huelva, SW Spain), where a wide range of hydrated sulfates can be found (Frost et al., 2005; Sobrón et al., 2009; Rull et al., 2014), are considered important potential analog sites of the mineralogenetic processes that occurred on Hesperian Mars, and also from an astrobiological point of view (Fernández-Remolar et al., 2005; Martinez‐Frías et al., 2004).
In Rio Tinto, Raman analysis has been performed at several periods of the year (Fig. 21), alone or in combination with other instruments participating in Mars missions—in particular, using a prototype of the MIMOS II Mossbauer spectrometer on board Spirit and Opportunity rovers (Figs. 22 and 23) (Rull et al., 2008; Klingelhoefer et al., 2016) and the Terra XRD a prototype of the CheMin instrument on board Curiosity rover (Rull et al., 2010a; Sobron et al., 2014).
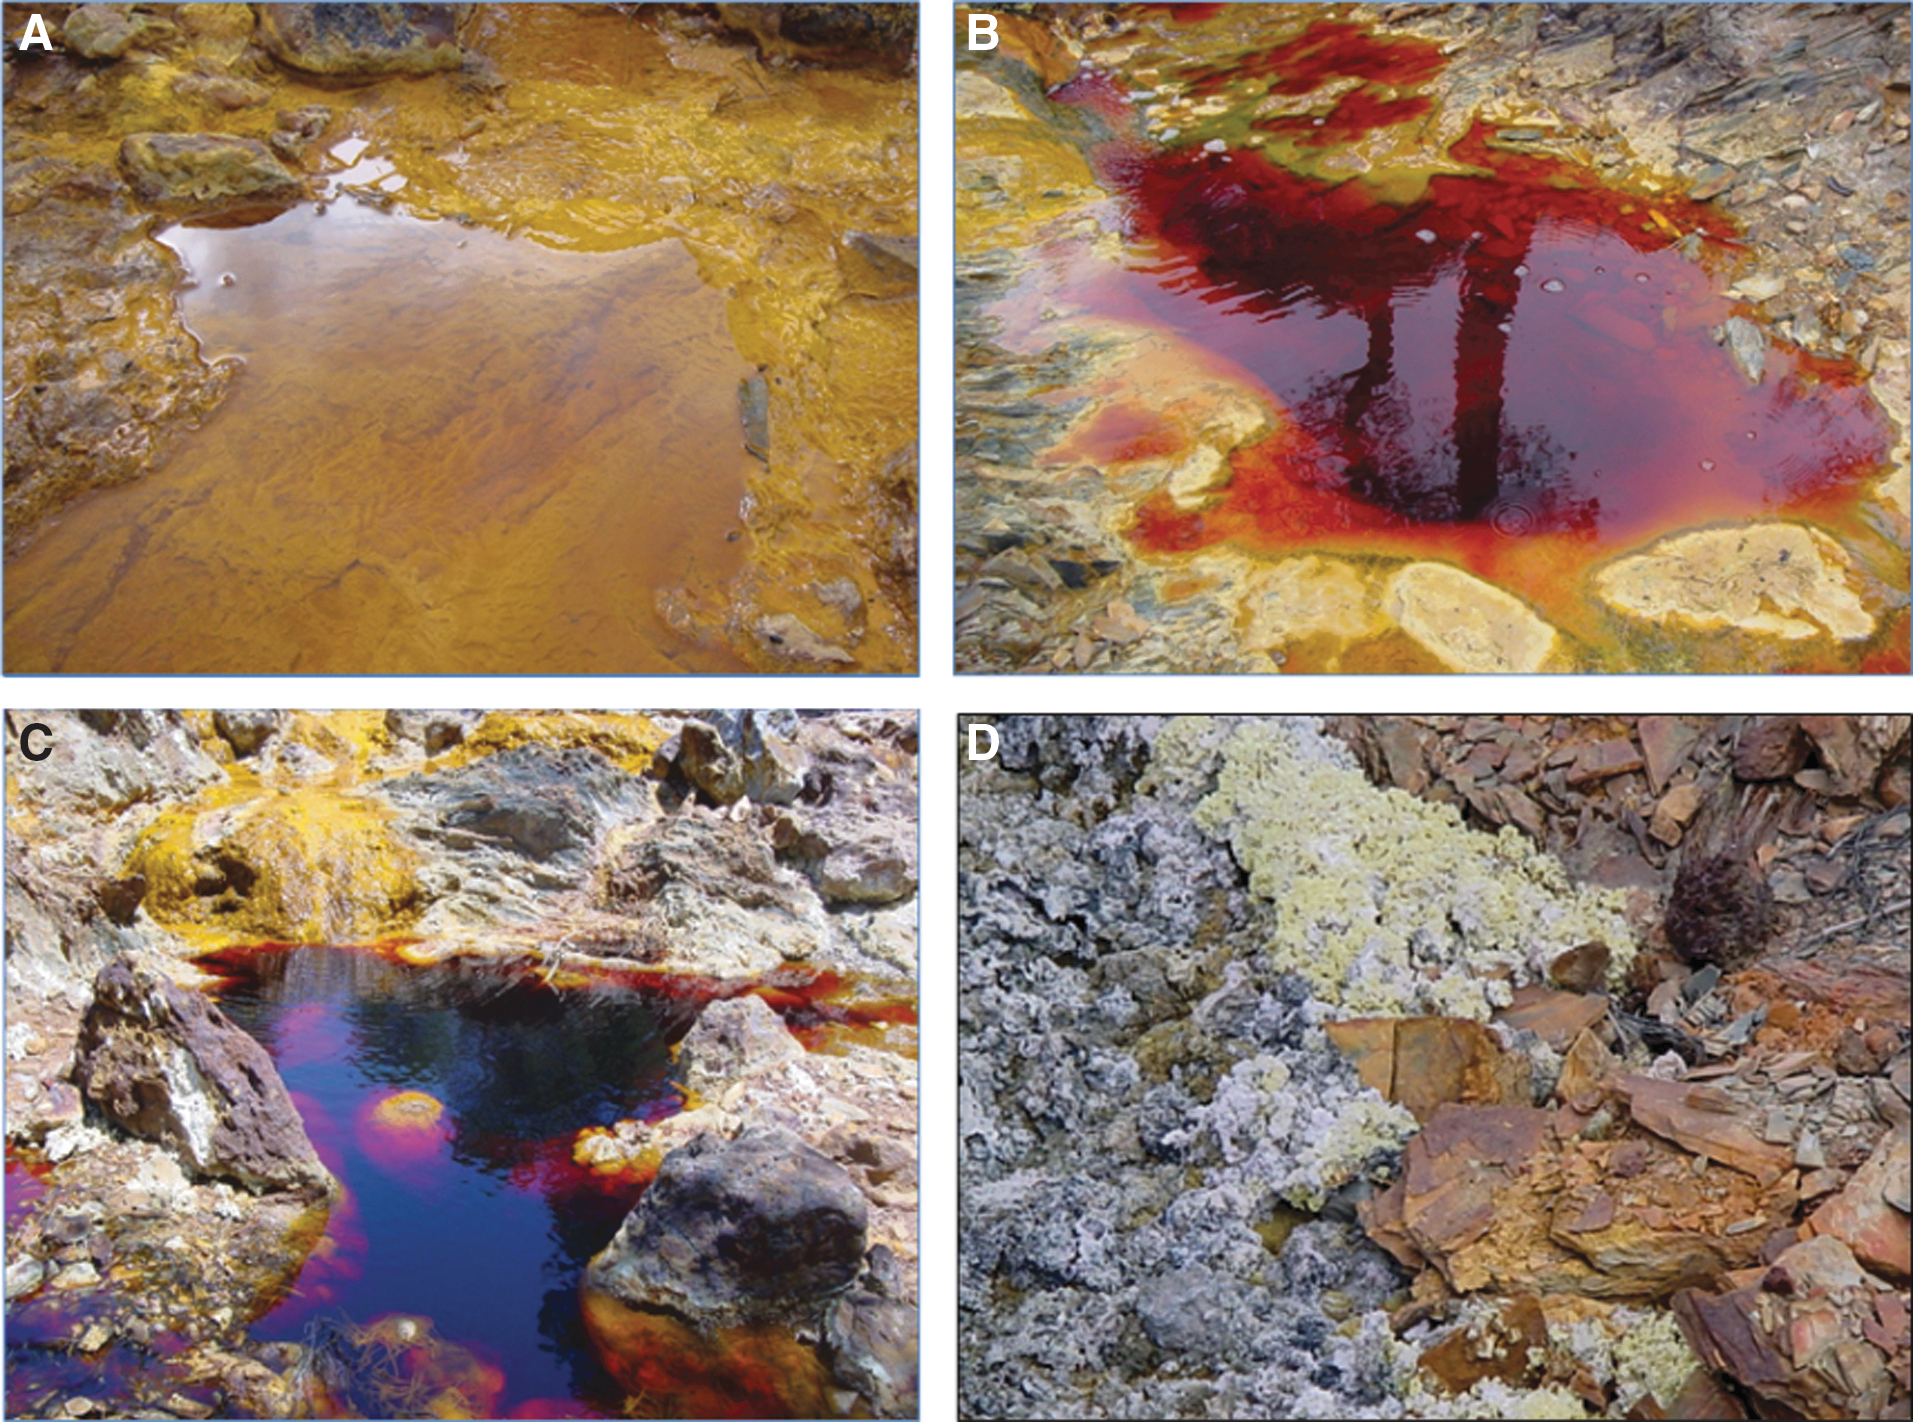
Rio Tinto (SW-Spain) near its source at different periods of the year [
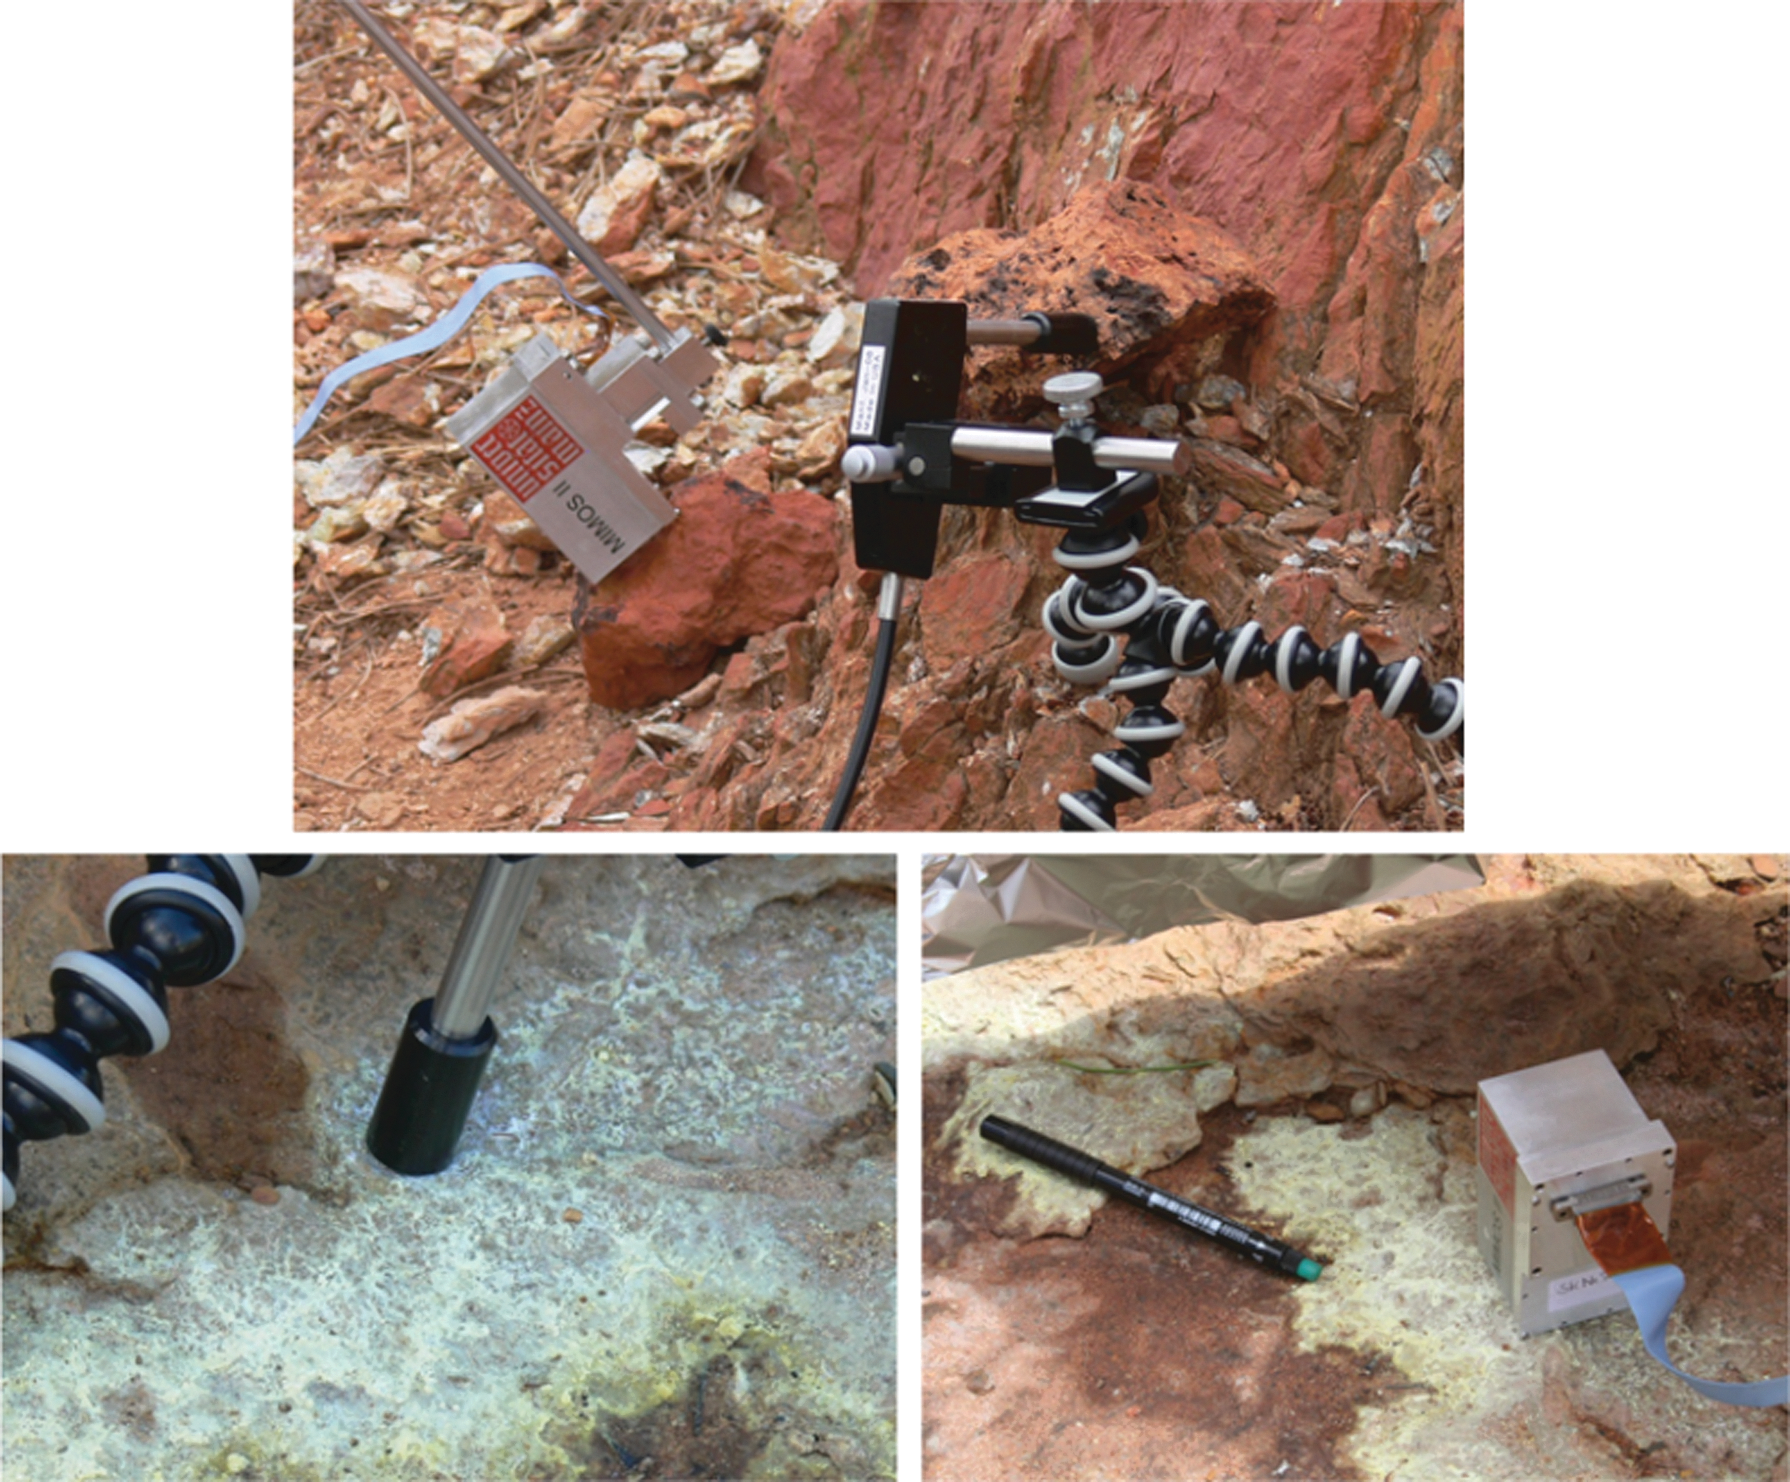
Raman and Mossbauer, working together in Rio Tinto. On the area of Peña del Hierro (top) dominated by Fe-oxides and in the river bank (bottom) dominated by sulfate efflorescences.

(Left) Mössbauer spectrum obtained on the Rio Tinto efflorescences depicted in Figure 22 (bottom). (Right) Raman spectra obtained at some points of the same area. Mössbauer spectrum shows a very intense signal of jarosite and minor signal of copiapite. Raman spectra show mainly copiapite (A) with different hydration degree and minor jarosite (B). It is assumed copiapite is at the surface forming a narrow layer and jarosite is below this layer.
From the whole collection of spectra, up to 13 different minerals were identified around the source of Rio Tinto by applying in situ Raman spectroscopy. This number rose to 19 minerals with the additional Raman analyses using micro-Raman laboratory instruments on collected samples. The complementary Mossbauer and XRD instruments confirmed most of these mineral phases (Rull et al., 2008; Klingelhöfer et al., 2016). It is interesting to note that Raman and Mössbauer sampling the same area observe the same minerals (given the mineral phases are active for Mössbauer), but in some cases their relative amount seems different. This effect is related with the different depth of analysis. Raman accesses only the surface (around 100 μm) and Mössbauer can observe deeper (about 1 mm). An example is presented in Figure 23 with the results obtained on deposits of sulfate efflorescences showed in Figure 22 (bottom) (details from Klingelhöfer et al., 2016).
Finally, the total number of detected minerals with RLS is very close to the whole minerals described in the literature in the area, in particular in the case of sulfates (Buckby et al., 2003). To avoid ambiguity on whether the analyzed minerals are primary or secondary phases, the samples were analyzed immediately, as soon as they arrived at our laboratory.
Raman spectroscopy can also supply useful information about biogenic processes related to mineral formation under acidic conditions. Figure 24 shows an example collected from the Rio Tinto banks with effects of bacterial acidophilic activity on the primary minerals (quartz and pyrite) (Klingelhöfer et al., 2016). The Raman results also indicate a small amount of jarosite and a strong, broad spectral feature with very clear disordered carbon D (∼1350 cm−1) and G (1550–1600 cm−1) bands. Although in general the presence of carbon D and G bands should not be considered conclusive proof of biogenic activity, in this case the bands provide evidence of acidophilic bacterial activity—we can see the bacterial colonies. These results illustrate that Raman spectroscopy can be a valid tool in the search for possible remains of life on minerals.

Raman spectrum
A wide range of Raman analyses were also performed in the Jaroso Ravine (Frost et al., 2005, 2006, 2007; Venegas, 2014), several of them in combination with Mossbauer spectroscopy (Rull et al., 2008). Raman results from the host rocks show that muscovite and graphite are the prevalent minerals, in addition to oxyhydroxides (anatase, rutile, hematite, magnetite, goethite, and lepidocrocite) and silicates (zircon, quartz, orthoclase, and anorthoclase). Other more localized minerals also identified in rock veins were barite, siderite, and quartz and small amounts of pyrite and sphalerite.
Although jarosite is perhaps the most characteristic sulfate in the Jaroso Ravine (Fig. 25), also barite and other sulfates were identified by Raman analysis of hydrothermal breccias both in situ and in the laboratory. These include gypsum, anglesite, and a variety of hydrated sulfate minerals such as natrojarosite, alunite, botryogen, copiapite, ferricopiapite, halotrichite, epsomite, hexahydrite, rozenite, and szomolnokite (Frost et al., 2005, 2006; Venegas, 2014).

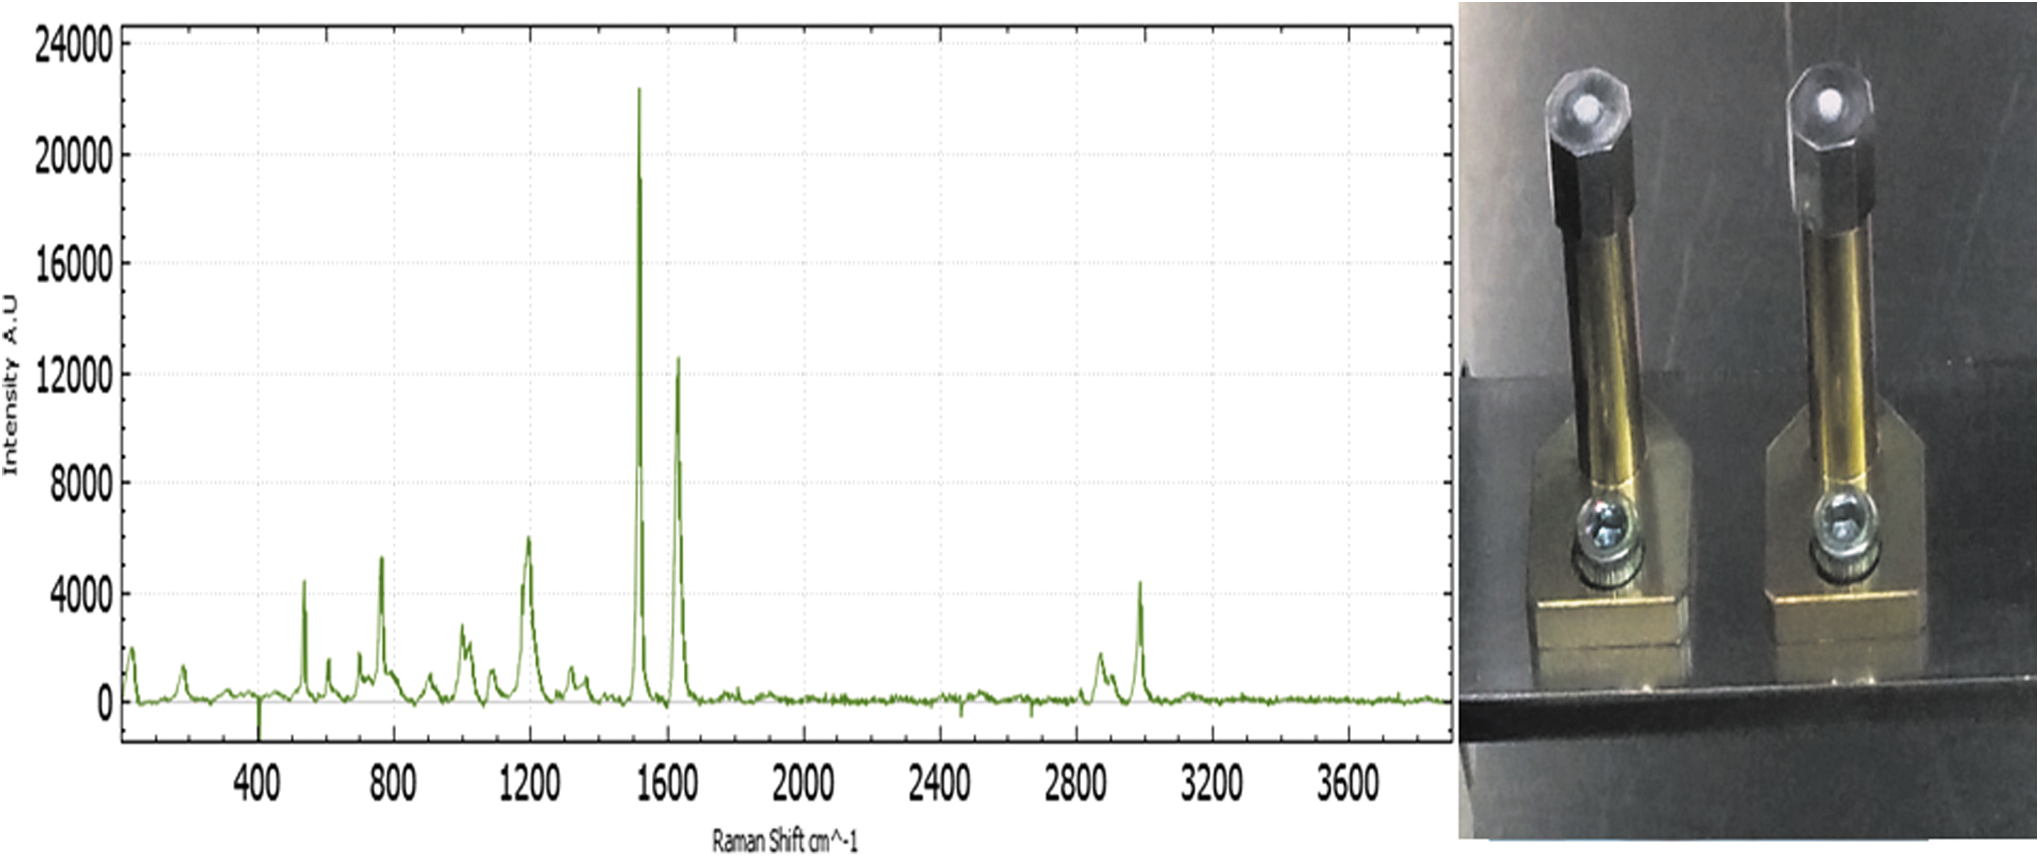
A jarosite outcrop (top-left) of several meters long in the Jaroso Ravine (SE Spain) and a piece of about 10 cm collected from this outcrop containing practically pure jarosite (top-right). The Raman spectrum (baseline corrected) of the piece taken in situ (bottom).
Our Raman instrument team participated in several AMASE expeditions to the Arctic's Svalbard islands (Steele et al., 2008; Rull et al., 2010b; Sansano et al., 2011). We used two Raman configurations, a standoff setup that uses a pulsed laser at 532 nm and a contact one based on the RLS ExoMars science prototype. Results when using the latter instrument are presented here.
One of the AMASE campaign objectives was to operate various rover instruments in a mission realistic scenario. Our Raman spectrometers were used extensively. Of particular interest are the experiments with a higher astrobiology interest. In Figure 26, some of the results obtained are presented. In this case, the combination of a rover with imager capabilities on the robotic arm is looking for particular features in the rocks surface possibly related with biogenic activity. Raman is used for confirmation at the same spots of the mineralogy of the rocks and the potential identification of traces of organics. In Figure 26 can be seen this is the case and beta-carotene was identified as the remains of lichens activity on the rocks' surface.
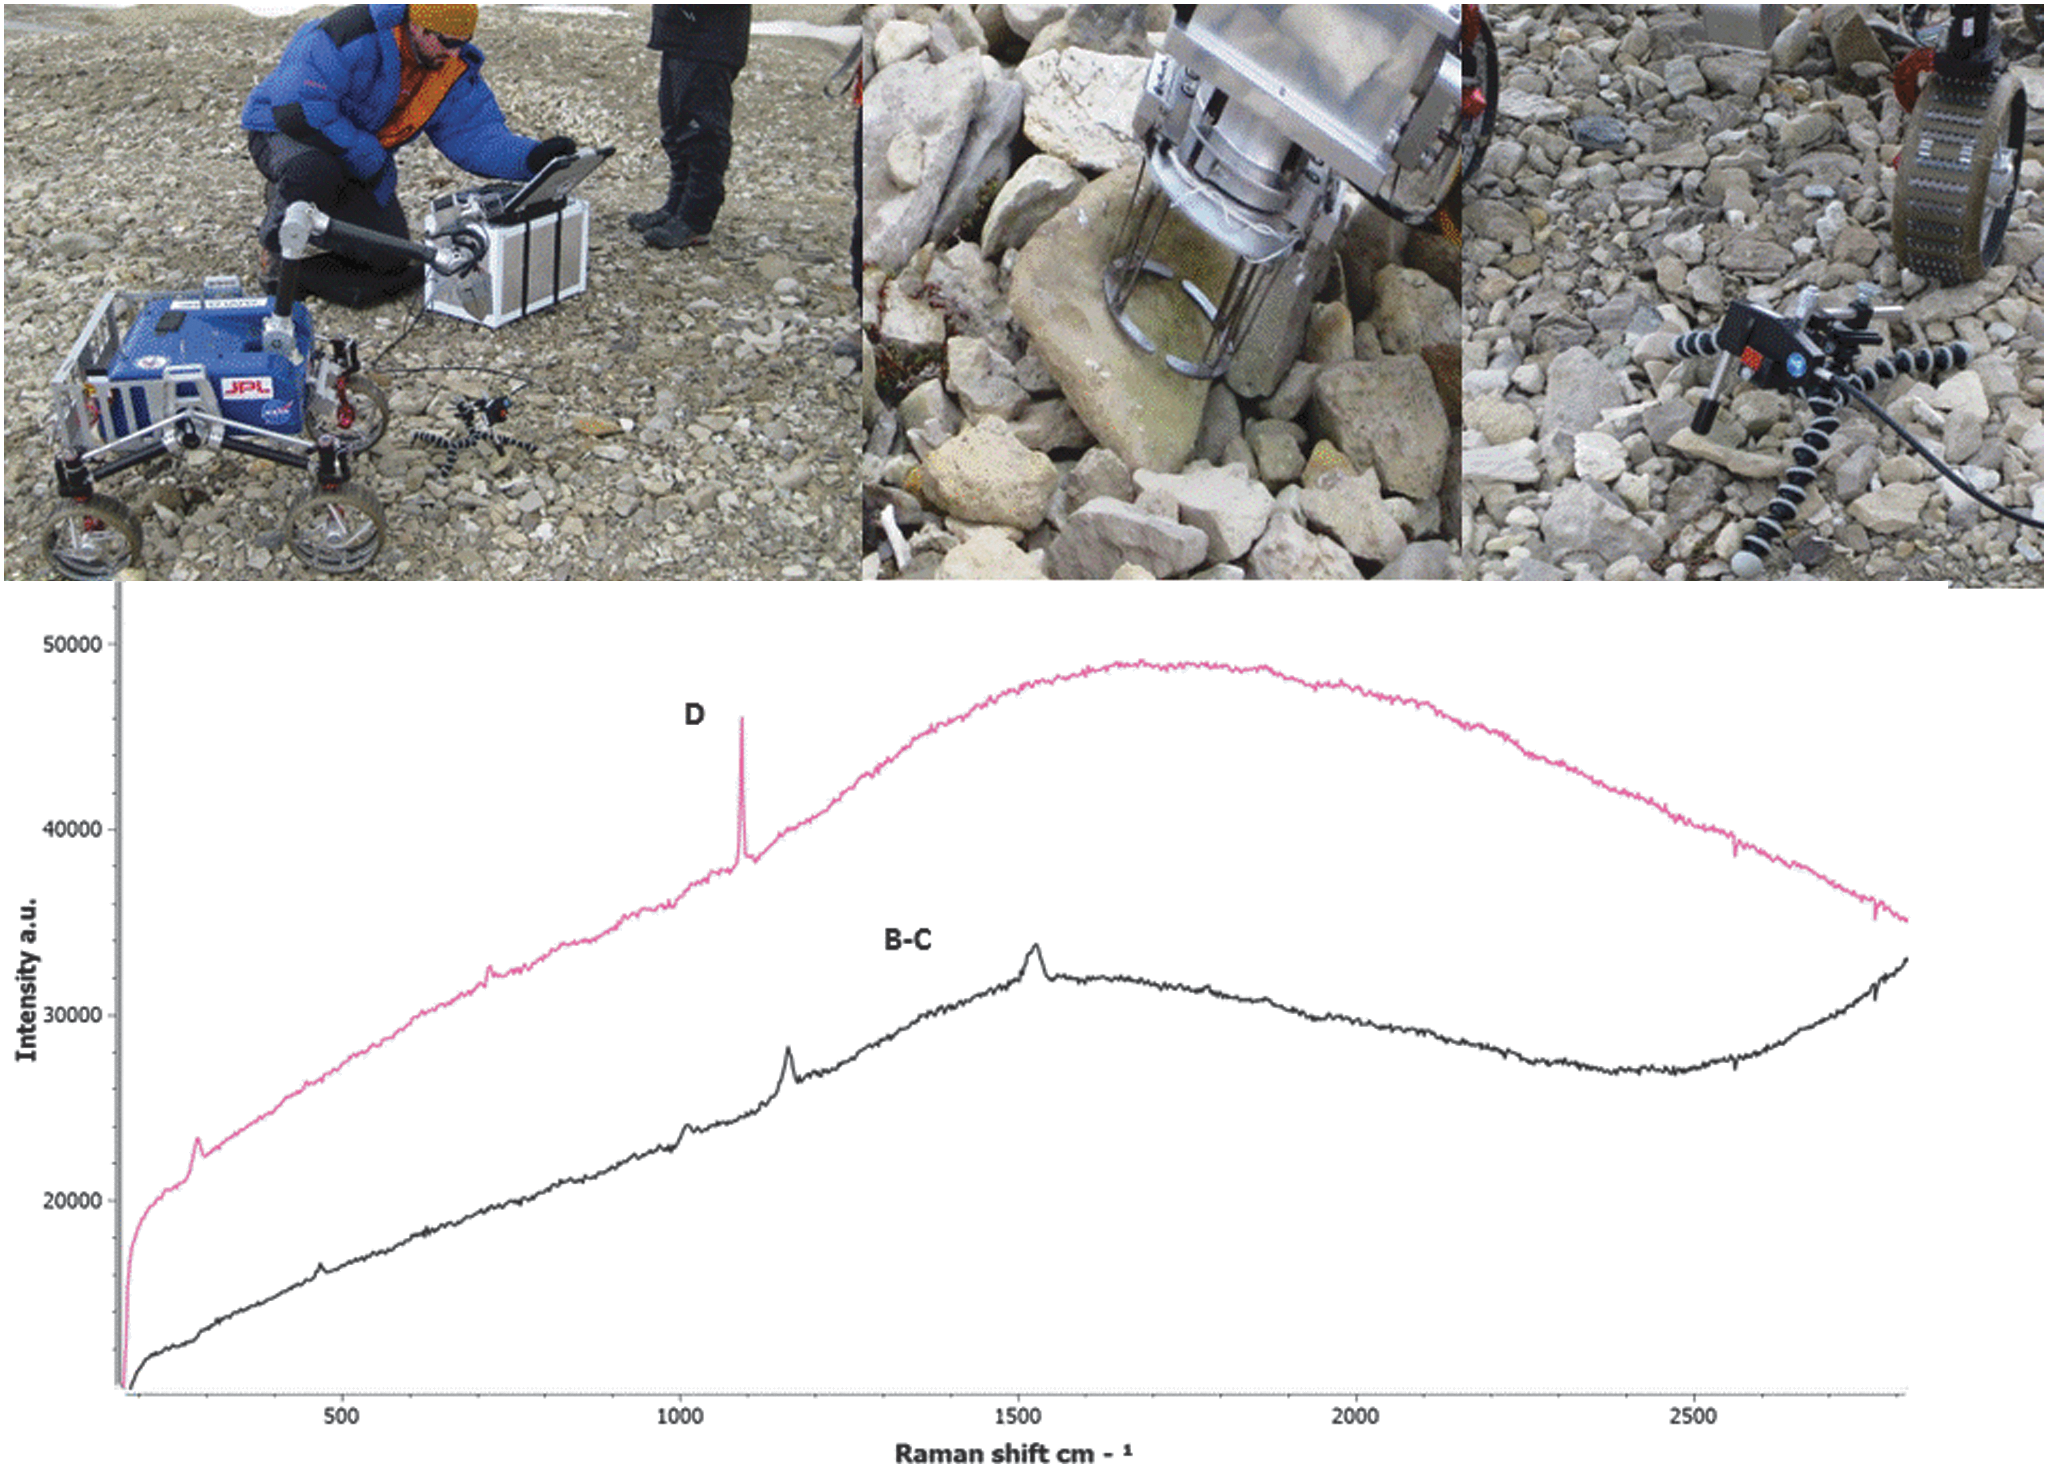
The Raman spectrometer working in collaboration with the robotic arm of a NASA rover prototype during AMASE 2008 expedition. The goal is to verify if the particular features recognized by the rover imager are of astrobiological interest. Raman spectra taken at the same surface area without moving and touching the selected sample allow identifying the mineral composition [dolomite (D) and spectral evidence of beta-carotene (B, C)].
Raman spectroscopy is very sensitive to the presence of organic compounds and can be useful for flagging present or past biological activity. As an example, we present Raman spectra obtained on carbonaceous matter from Barberton Green Belt chert samples (Venegas, 2014). The goal is to compare Raman results obtained on bulk samples where the carbonaceous features can be visually detected and the spectral characteristic placed in their mineralogical context with the powdered sample analysis in automatic mode. What spectral information is retained in the powder analysis is of great interest. In Figure 27, the Raman spectra of a layered sample from Komati River obtained with a laboratory instrument in micromode are shown. Raman allows detecting the mineralogy of the sample: mainly quartz with minute amounts of orthoclase and muscovite and oxihydroxides and traces of carbonates. It is worth mentioning the presence of rutile and anatase. The first order of carbon vibrational bands is also shown. The dark layers have different D and G band spectral features, which correspond to different maturity stages of the carbonaceous matter (see Venegas, 2014, for details).
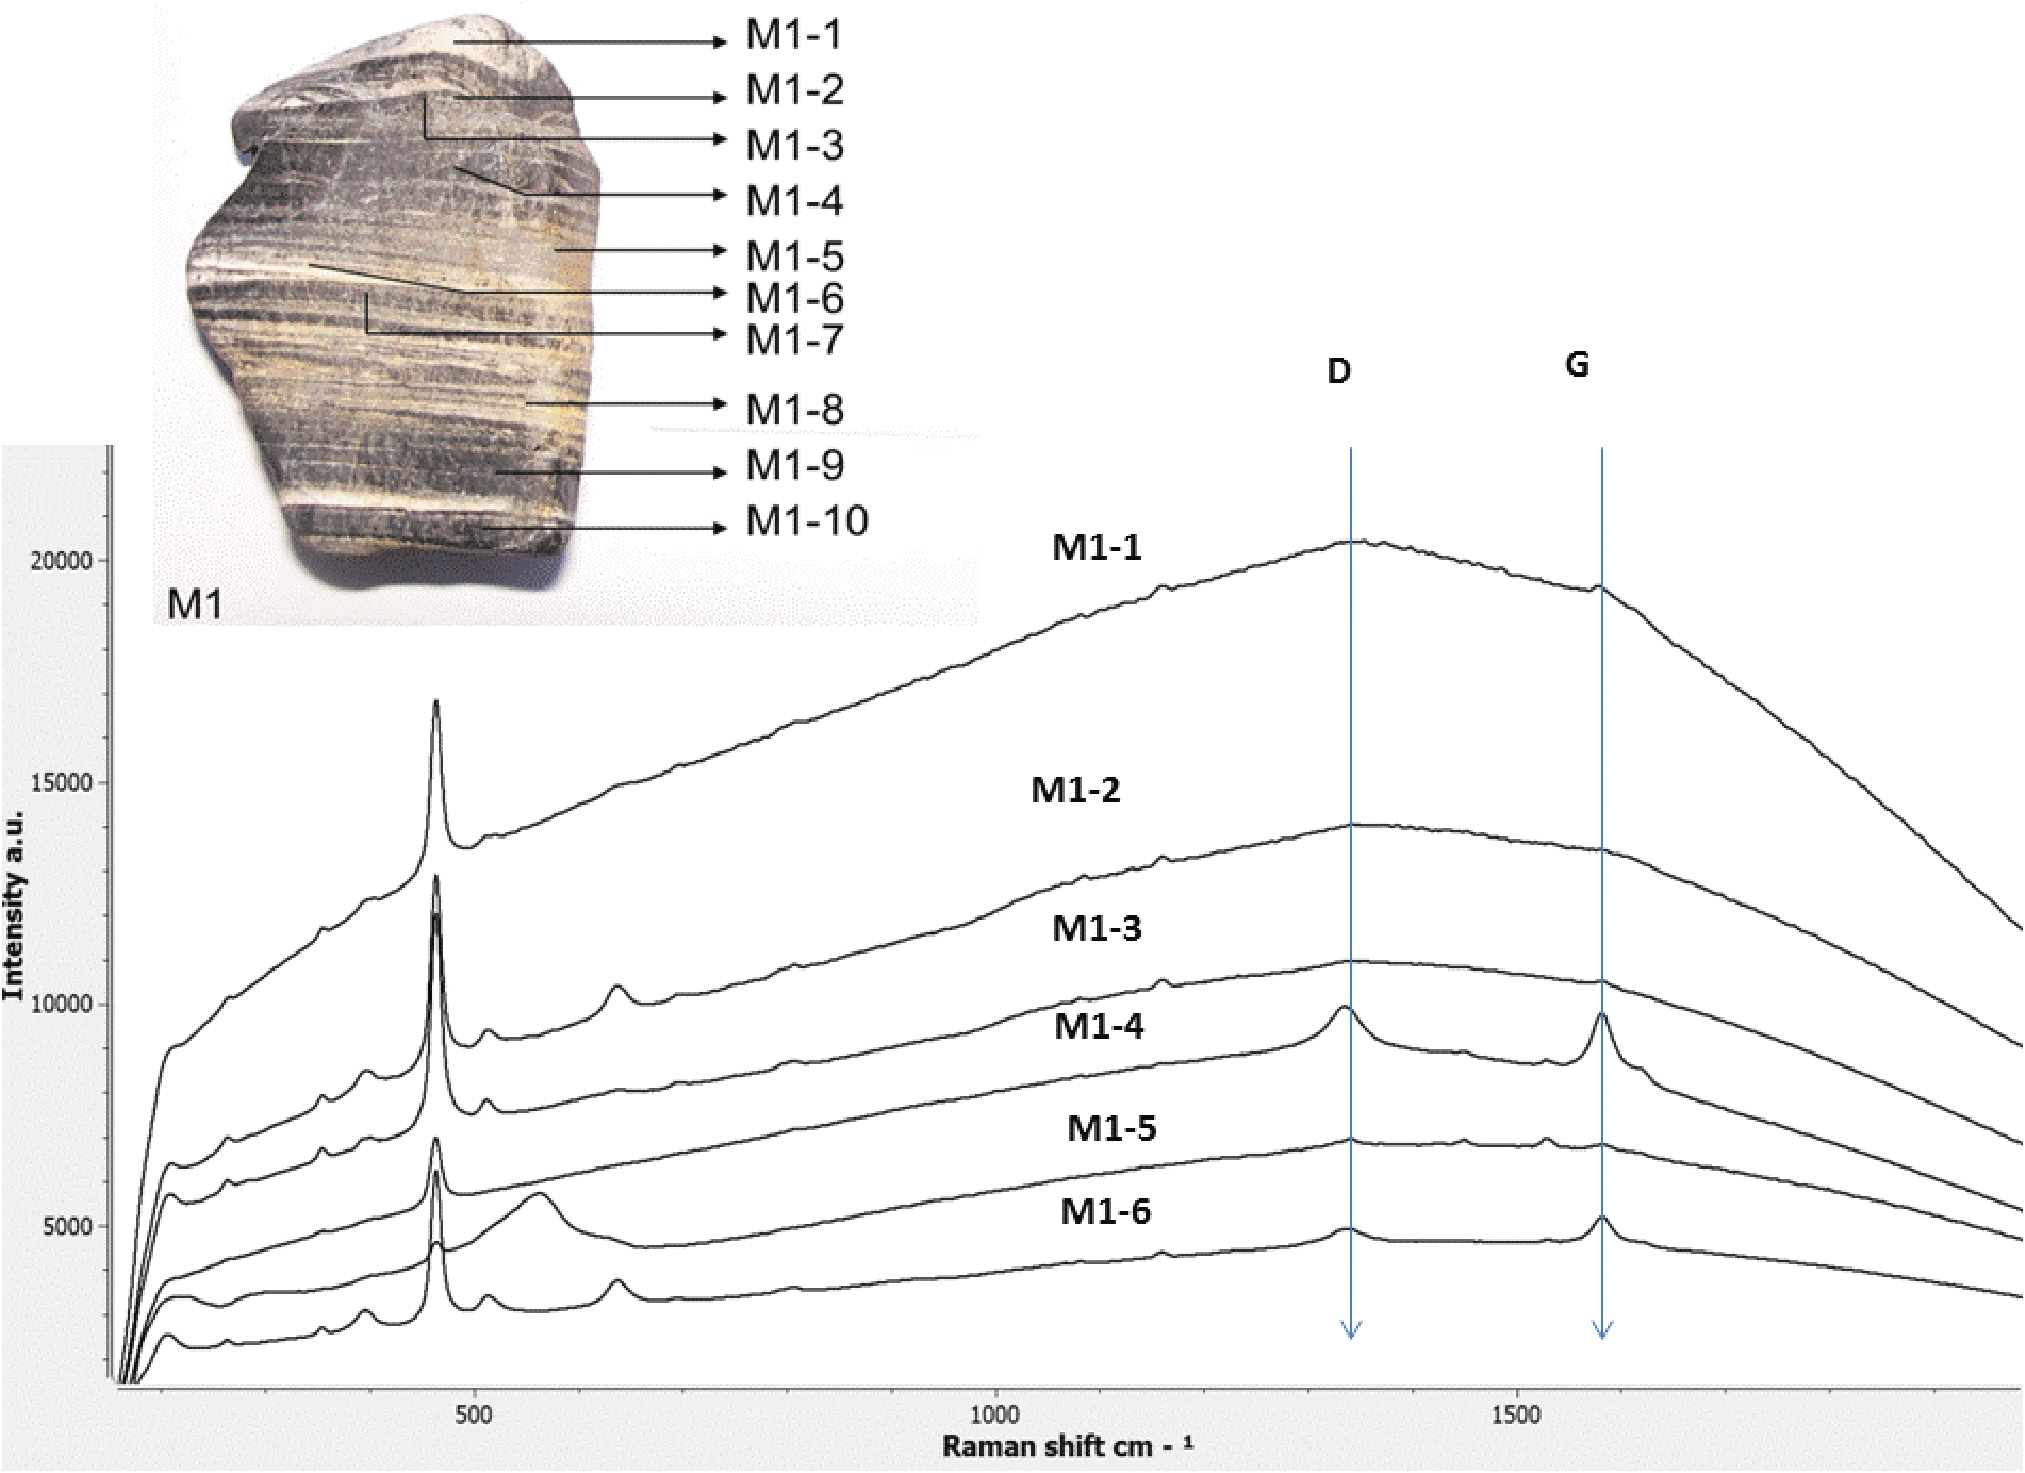
In situ Raman spectra of some of the different layers corresponding to a chert sample from Komati River (Barberton Greenstone Belt (BGB), South Africa. The position of the (D) and (G) bands of carbon is shown allowing detecting differences between the dark and white layers, which correspond to differences in the maturation process of the original material.
Figure 28 corresponds to Raman spectra of a crushed portion of the upper part of the sample. The powder was prepared in a similar form than what the rock crusher in the ExoMars rover will produce. The Raman spectra were acquired in automatic mode on 30 spots along a line. The spectra were presented in overlaid mode to have a general picture of the whole results. We see that practically all the spectral features observed in the original sample (before crushing) are also detected in the powder, including differences in the carbon D and G bands. Nevertheless, the carbon bands were present at all the spots in the sample as a consequence of the crushing procedure.
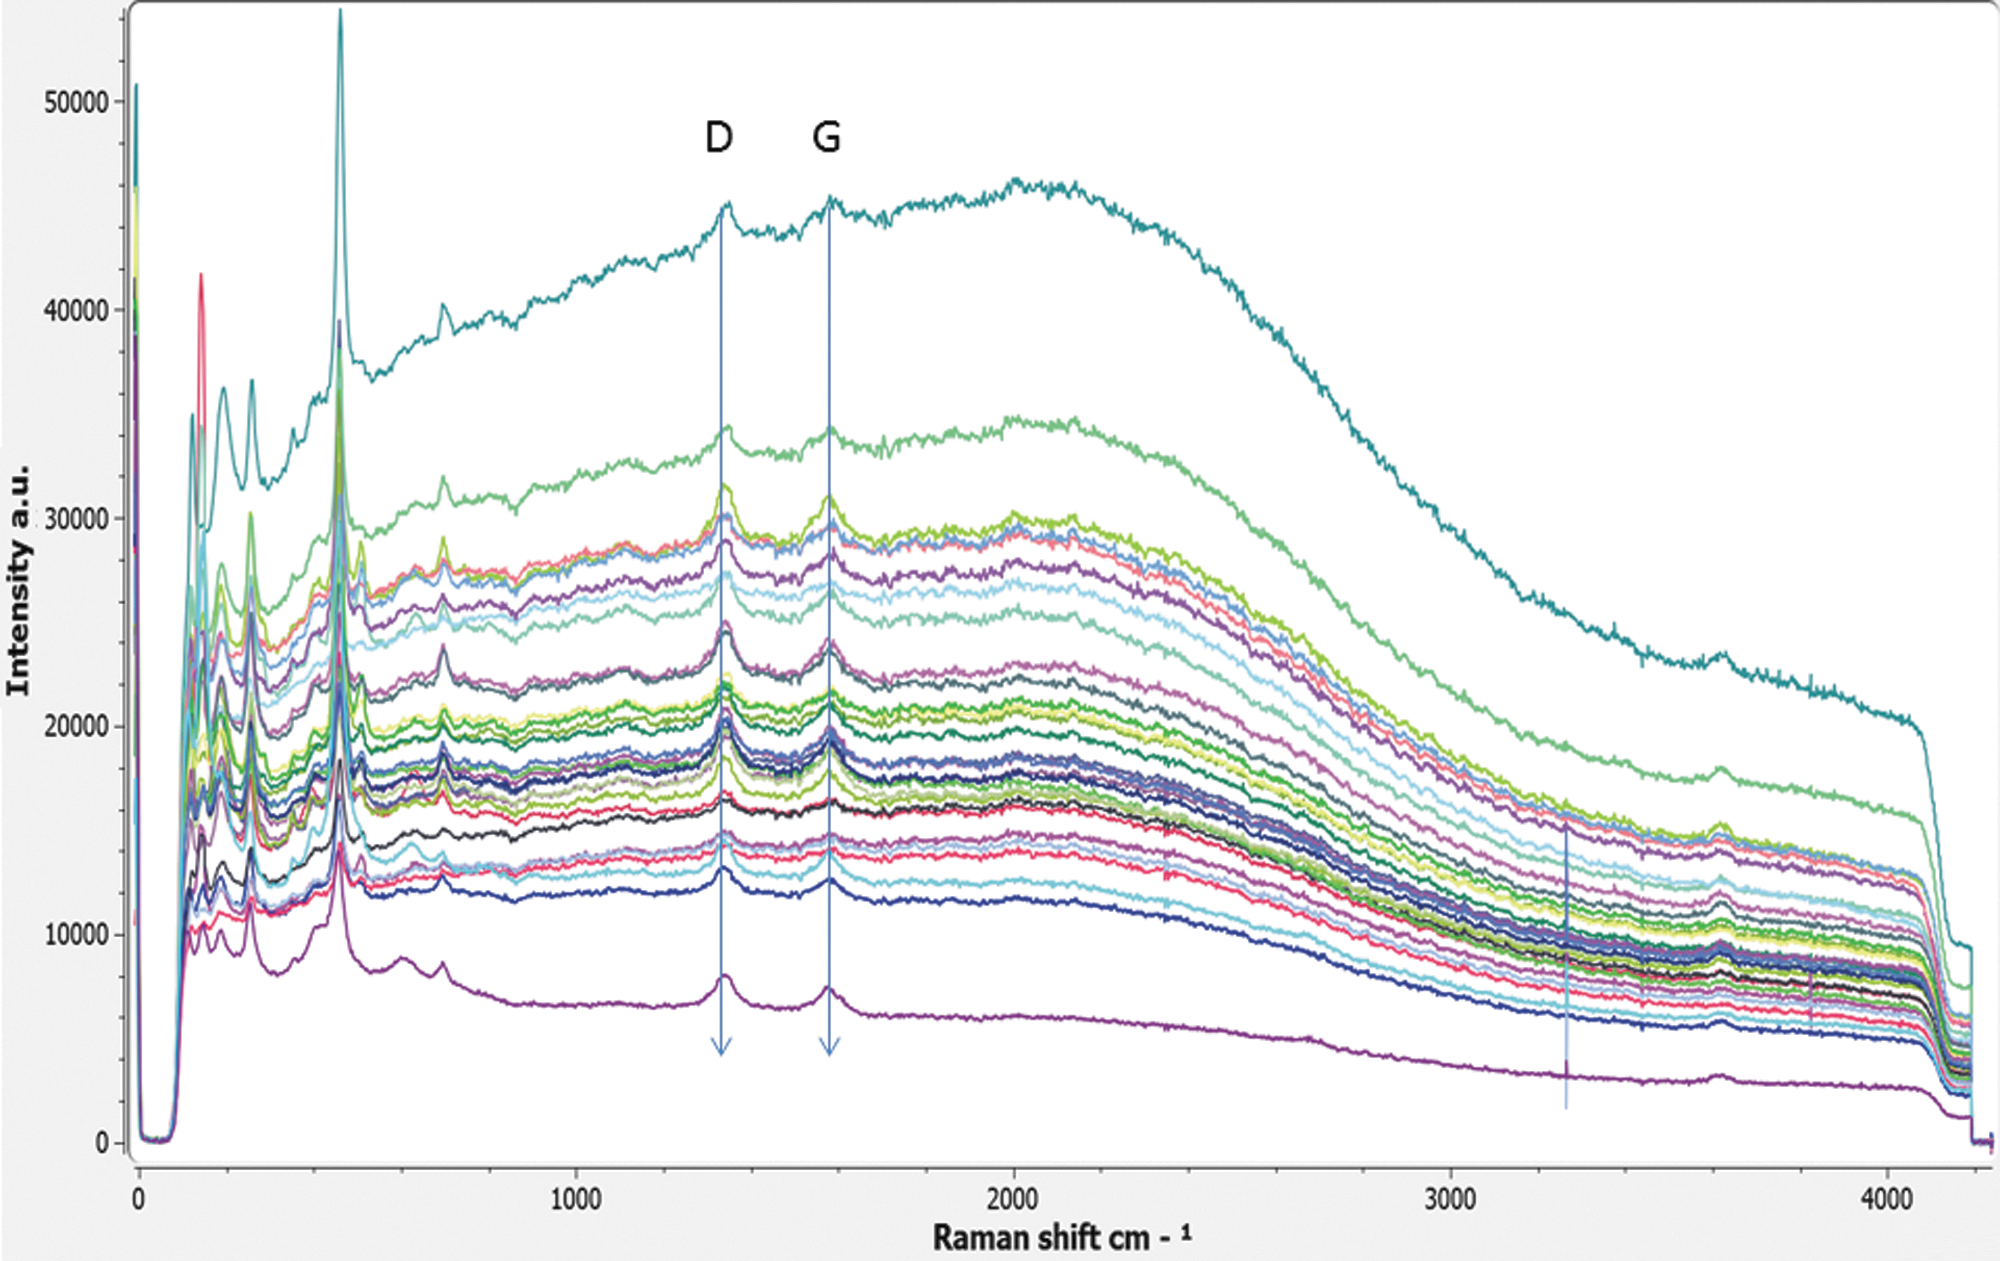
Raman spectra (30 points) along a line on a portion of the sample shown in Figure 27 crushed in a similar way that the ExoMars ALD-crusher will produce. The spectra clearly show all the mineral phases detected in a spectral mapping of the surface made at the laboratory, including the carbonaceous bands. Nevertheless, the mineral grain spatial context associated at each spectrum is lost. ALD, analytical laboratory drawer.
15. Conclusions
The combined science possibilities afforded by the ExoMars rover ALD instruments MicrOmega (IR), RLS (Raman), and MOMA (organic identification by mass spectrometry) are extremely powerful. In particular, Raman and IR spectroscopy provide complementary information on all mineral phases present in a sample—crystalline and amorphous. Raman can also be a very good tool for flagging the presence of organic molecules, and in some cases may identify some compounds too. This information will be used on ExoMars to guide the further search for possible biomolecules by MOMA.
On the ExoMars rover, it will be possible to image the sample before crushing it. Raman measurements will be conducted on the resulting powder, and hence it will not be possible to perform a more traditional, combined visual Raman analysis. Nevertheless, our laboratory results with the RLS instrument prototype demonstrate that we can recover most (and in some cases all) Raman spectral features when working with a sufficient number of sampling points on the particulate sample material.
Footnotes
Acknowledgments
Financial support for this work was made available for the Spanish team through the Projects AYA2008-04529-4 and AYA2011-30291-C02-02 (Ministry of Science and Innovation, Spain, and FEDER funds of EU) and the ESP2013-48427-C3-1,2,3-R and ESP2014-56138-C3-1,2,3-R Projects of MINECO.
Author Disclosure Statement
No competing financial interests exist.