
Abstract
The search for life and habitable environments on other Solar System bodies is a major motivator for planetary exploration. Due to the difficulty and significance of detecting extant or extinct extraterrestrial life in situ, several independent measurements from multiple instrument techniques will bolster the community's confidence in making any such claim. We demonstrate the detection of subsurface biosignatures using a suite of instrument techniques including IR reflectance spectroscopy, laser-induced breakdown spectroscopy, and scanning electron microscopy/energy dispersive X-ray spectroscopy. We focus our measurements on subterranean calcium carbonate field samples, whose biosignatures are analogous to those that might be expected on some high-interest astrobiology targets. In this work, we discuss the feasibility and advantages of using each of the aforementioned instrument techniques for the in situ search for biosignatures and present results on the autonomous characterization of biosignatures using multivariate statistical analysis techniques. Key Words: Biosignature suites—Caves—Mars—Life detection. Astrobiology 17, 1203–1218.
1. Introduction
T
Landed and roving spacecraft have visited the martian surface periodically over the last 40 years to investigate the possibility of extant or extinct life on Mars. Mission objectives have focused on the direct detection of metabolic processes, the broad search for habitable environments, and the identification of organic molecules. Results from these studies have shown Mars to have ancient habitable environments (Grotzinger et al., 2014) and the presence of organic molecules (Freissinet et al., 2015); however, biosignatures associated with indigenous martian life-forms have not been unambiguously identified (Gibson et al., 2001; Biemann and Bada, 2011).
The identification of biosignatures in Solar System samples is analogous to the investigation of the biogenicity of ancient terrestrial rocks. Characteristics of microorganisms on other planetary surfaces are hypothesized to share some similarities with those of primitive terrestrial microbes, including metabolic processes (Nealson, 1998) or the presence of key morphological characteristics (i.e., compartmentalization, molecules used for genetic storage) (Brasier and Wacey, 2012). Debates on the biogenicity of ancient terrestrial biosignature candidates highlight the importance of an instrument suite necessary to reveal a variety of biosignatures to support a determination of the origin or possible biological alteration of any sample (Ohmoto et al., 2008).
Challenges associated with the identification of indigenous martian biosignatures within geological samples have been invoked to argue for the necessity of a Mars sample return mission (Des Marais et al., 2008; Committee on the Planetary Science Decadal Survey, 2012; Kminek et al., 2014), which would allow for the control for terrestrial contamination and selection of a variety of samples from known regions. While in situ investigations on the martian surface can provide important constraints, samples returned to Earth and handled with extreme care to prevent terrestrial contamination may be examined more rigorously in a laboratory setting, including measurements by instrument techniques that are currently at low technology readiness levels or have not yet been developed for in situ analysis (Des Marais et al., 2008). Prior to caching for later collection under the current mission scenario, samples must be selected and prioritized based on in situ chemical analysis, and paired with geological and mineralogical context, through minimally destructive in situ techniques. This in situ analysis step is of particular importance now that organics on Mars have been found only in localized regions of Gale Crater (Freissinet et al., 2015). To address this need for in situ sample vetting, we demonstrate the biosignature detection capabilities of several instrumentation techniques to be considered as a suite on a Mars sample return mission. In the present study, we applied IR reflectance spectroscopy, laser-induced breakdown spectroscopy (LIBS), scanning electron microscopy (SEM), and energy dispersive X-ray spectrometry (EDS) techniques to subterranean samples to demonstrate the identification of biosignatures by this capable suite of instruments. We do not suggest that this suite of instruments is an ideal biosignature identification instrument package, but instead we selected these instruments due to their availability. Nevertheless, we demonstrate the value of implementing multiple instruments in such a study to reveal several distinct biosignatures.
We follow the non-Earth-centric protocol for life detection described by Conrad and Nealson (2001) and define life by the measurable characteristics presented by Nealson and Conrad (1999) and Bains (2014b):
(1) Structure: Organisms contain unique physical structures to extract energy from the environment (by mediating redox reactions, for example) for growth and reproduction. Some structures are also present as membranes that contain the organism, which often strongly contrast with abiotically formed structures within the environment.
(2) Chemical composition: Chemical composition of these structures, out of thermodynamic equilibrium with the surrounding environment and often distinct from the abiotic substrate, can indicate a biological formation mechanism. Biotic processes may be inferred from relative elemental or isotopic ratios, the distribution of oxidation states of transition metals, and the presence of trace elements and organic compounds within the geological context.
(3) Metabolic production: A general characteristic of life is a decrease in entropy relative to its environment. To avoid violating the second law of thermodynamics, free energy must be supplied to the system to maintain this relatively low entropy state. Evidence for the conversion of free energy into energy that is useful to an organism may present itself as metabolic waste products, pH gradients of reactants, or detection of redox reactions occurring at rates faster than expected through abiotic mechanisms.
We omit several characteristics typically associated with life detection from this list as follows. Bains (2014b) purported evolution and replication/reproduction are not practical measurable characteristics of life; the former is an inevitable result of the latter, and both require observations over long periods of time not possible within the current limited-duration mission framework. Observations of the motility of an organism may also require a potentially long period of time to observe directly and may be inferred by the distribution of other biosignatures measured by several techniques. An organism does not necessarily need to develop independent locomotion if, for example, it exists in an environment that replenishes reactants (nutrients) and removes waste products. Motility is therefore also not considered here.
Identification of any of these characteristics individually does not necessarily indicate the presence of life (Conrad and Nealson, 2001). A strong dependence on the identification of morphological structures as evidence for life detection is often considered unconvincing (García-Ruiz, 1999; Boston et al., 2001; Conrad and Nealson, 2001; Bains, 2014b; White et al., 2014). An ideal, reliable method for detecting the presence of life would include the identification of several biosignatures over a range of spatial scales that are independently verified by multiple techniques and imply the presence of biotic activity as indicated by the characteristics described above (Boston et al., 2001; Conrad and Nealson, 2001; Nealson et al., 2002a).
We have tested this life-detection strategy using the aforementioned instruments to determine the presence of biotic activity within geological samples collected from Earth's subsurface. Caves provide a convenient analog site for microbially altered samples, and caves on other Solar System bodies are promising sites for in situ astrobiology investigations (Boston et al., 2001).
1.1. Subsurface habitability
The subsurface offers a unique habitable environment to some of Earth's most taxonomically novel, biochemically unusual, and diverse microorganisms, and is a promising place to search for evidence of life on other Solar System bodies (Boston et al., 2001). The arrival of life on other planetary surfaces, either through independent genesis or lithopanspermia, would have most likely taken place as early as 4.0–3.5 billion years ago. This epoch corresponds to a warmer, wetter climate on Mars and is coincident with the Late Heavy Bombardment, which provided the most statistically likely scenario for the delivery of thermophilic microorganisms from Earth to Mars or icy satellites in the outer Solar System (Blanco et al., 2013; Worth et al., 2013). Subsequent, dramatic environmental changes to planetary surfaces that followed include sublimation of water sources, increased UV irradiation, and extreme temperature variability, all of which may have rendered the subsurface the most habitable environment available to early life. Caves not only offer a sheltered habitat to extant life-forms but can serve to preserve ancient microfossils and biominerals that would have otherwise been rapidly degraded under harsh conditions at the surface (Boston et al., 2001).
A common, and likely valid, assumption when searching for life outside Earth's biosphere is the necessity of water for an organism's growth and survival (Bains, 2014a); thus, the presence of liquid water on a planetary surface is often considered a fundamental condition for defining an environment as habitable (Javaux and Dehant, 2010; Westall et al., 2013; McKay et al., 2014). Planetary bodies with surface and near-surface reservoirs of water within the Solar System, such as the martian polar regions, Europa, Enceladus, Titan, and small differentiated bodies such as Ceres, are considered to be leading candidates for hosting a habitable environment. The search for water on Mars, in particular, has revealed extensive past aqueous alteration of the surface, with evidence suggesting that aqueous weathering has persisted throughout the Amazonian period (Malin et al., 2006; McCubbin et al., 2010). Water ice has been detected in the near subsurface at the north polar region of Mars by the Phoenix lander (Smith et al., 2009), and liquid water has been posited to be stable from the near subsurface to depths greater than ∼310 km below the surface, potentially providing an extensive subsurface habitable zone for resilient organisms (Jones et al., 2011).
Subsurface environments also provide thermal stability and possibly warmer conditions to extant microorganisms, which are necessary to facilitate biochemical reactions (Schulze-Makuch et al., 2013). Jones et al. (2011) showed that the mean seasonal temperature variability approaches 0 K at approximately 100 m below the martian surface, and Paton et al. (2013) demonstrated a substantial decrease in the diurnal temperature variability at relatively low depths on Mars with modest rock and dust coverings due to the high thermal inertia properties of these materials. On airless planetary bodies, thermal stability offered by the subsurface provides refuge from extreme surficial diurnal temperature variations, creating a more consistent environment for microorganisms.
According to A.A. Pavlov et al. (2012), UV and cosmic ray degradation of biosignatures limits the search for evidence of life to recently exposed planetary surfaces (<50 million years on Mars) and the subsurface (>2 m below the air-rock interface on Mars). These authors also demonstrated that cosmic ray irradiation rapidly fragments small organics (∼100 amu) in the near subsurface under martian surface conditions. Cosmic ray–induced nuclear reactions can degrade isotopic ratios indicative of terrestrial biological activity, including the 13C/12C ratio, within 25 million years on the surface (Pavlov et al., 2002). Additionally, UV and ionizing radiation will photodegrade photosynthetic and endolithic microbes at the surface of Mars within a few sols, necessitating a retreat to the subsurface (Dartnell and Patel, 2014). Energetic particles, particularly electrons, can penetrate water ice and damage biomarkers such as polycyclic aromatic hydrocarbons up to 2 m below the surface (Barnett et al., 2012), implying that evidence for life on icy satellites is best preserved underground. The significance of protection from ionizing radiation and thermal variability was revealed in experiments conducted by Schulze-Makuch et al. (2013), who demonstrated the rapid acceleration of biological activity in arid terrestrial environments when exposed to unsophisticated sheltered conditions.
Caves provide convenient entrances for accessing the potentially habitable subsurface on other planetary bodies. They have been identified on Earth's moon and Mars as skylights and lava tubes (Léveillé and Datta, 2010; Wagner and Robinson, 2014), and undiscovered smaller entrances that lead to the subsurface may be inferred from remote sensing thermal inertia measurements (Groemer et al., 2014).
We have demonstrated the detection of biosignatures in caves on Earth to help establish the feasibility of identifying life on other Solar System bodies. Consistent environmental conditions and shelter from ionizing radiation offered by the terrestrial subsurface could have been exploited by primitive microorganisms early on in the history of life on Earth, and at present, these same subsurface attributes provide habitable environments for a vast variety of microorganisms (Kaiser and Bollag, 1990; Boston et al., 1992). As a result, we are now beginning to understand that the subsurface contains a significant fraction of Earth's biomass, possibly equivalent to the aboveground biomass (Lehman, 2007) due in part to the enormous living space provided by the rock fracture habitat both on terrestrial landmasses and in ocean floor rocks. Caves provide us with a human-accessible environment in which to examine some aspects of this vast habitat type. Cave-dwelling microorganisms often extract energy from the environment by mediating reduction-oxidation (redox) reactions (Nealson et al., 2002b). Microbes such as these lithoautotrophs are suitable analogues for microscopic-scale extraterrestrial life-forms, which would have likely evolved to take advantage of similar chemical energy gradients at the rock-air interface (Nealson and Conrad, 1999; Nealson et al., 2002a). The presence of microbiological activity may be evident as distinct products of biomineralization processes (microbial alteration or precipitation of minerals), which are one of the most likely forms of biosignature to be observed on other planetary bodies (Blanco et al., 2013). Within terrestrial cave environments specifically, biological activity has been demonstrated to influence the formation of speleothems, including u-loops, pool fingers, moonmilk, corrosion residue, and snottites, among many others (Boston et al., 2001; Northup and Boston, 2005).
The purpose of the present study was to demonstrate the unique biosignature identification capabilities of several instrumentation techniques and the advantages of applying multivariate statistical analyses to facilitate the detection of biotic activity and vetting of astrobiologically interesting samples. In Section 2, we present an overview of each instrument technique used in our study to identify biosignatures. In Section 3, we present results of each instrument applied to calcium carbonate samples collected from a subterranean environment. In Section 4, we apply multivariate statistical algorithms including principal component analysis (PCA) and partial least squares discriminant analysis (PLS-DA) to a large number of measurements to determine sample biogenicity. These data contain both abiotic and biotic samples known a priori by SEM characterization and are used to demonstrate the success rate of an autonomous identification of biosignatures using unsupervised statistical techniques. We provide concluding remarks in Section 5.
2. Instrument Suite Description
We implemented a suite of analytical techniques to characterize biosignatures in field samples, which included IR reflectance spectroscopy, LIBS, SEM, and EDS. Each of these instrument techniques is capable of identifying unique biosignatures within a geological sample.
2.1. Infrared reflectance spectroscopy
Characterizing the mineralogy of a planetary surface is essential to understanding its geological and chemical evolution, which can also be used to infer the past redox chemistry on the surface. It has been hypothesized that lithotrophic proto-organisms could use redox couples to grow and reproduce (Wächtershäuser, 1988; Kaschke et al., 1994). Further, there is great complexity in understanding whether a particular redox coupling is from biological or abiotic sources (Melton et al., 2014). Searching for evidence of this biological process in the geological record (distinct from the geological formation of these same minerals) may help identify the presence of extant or extinct life (Nealson and Conrad, 1999). It has been shown (Regev et al., 2010; Blanco et al., 2014) that the method of formation of some minerals may be inferred from variations in the vibrational and rotational absorption features of an IR spectrum. Orofino et al. (2007) demonstrated the use of transmission IR spectroscopy following heat treatment of samples to determine their biogenicity. Biosignatures identified with IR spectroscopy are associated with the chemical composition and metabolic production characteristics of life presented in Section 1 and establish the utility of an IR reflectance spectrometer as a biosignature identification instrument technique.
Infrared reflectance spectrometers are routinely recognized as important in situ instruments to include on robotic and landed missions to Mars or elsewhere in the Solar System (Steele et al., 2005; Committee on the Planetary Science Decadal Survey, 2012; Mackwell et al., 2012; Mustard et al., 2013; Pappalardo et al., 2013). The report of the Mars 2020 Science Definition Team specifically notes the unique capabilities of an IR reflectance spectrometer based on acousto-optic tunable filter (AOTF) technology (Mustard et al., 2013). This concept has been demonstrated by the following: remote sensing IR imagers on Mars Express (Korablev et al., 2006) and Venus Express (Bertaux et al., 2007); in situ spectrometers on the future ExoMars (MicrOmega) (Leroi et al., 2009), Mars 2020 (SuperCam) (Wiens et al., 2014), and Luna-Glob and Luna-Resurs (Lunar Infrared Spectrometer) (Korablev et al., 2013); and our group with an IR point spectrometer paired with a miniaturized laser desorption/ionization time-of-flight mass spectrometer (LD-TOF-MS) (Glenar et al., 2003; Chanover et al., 2012, 2013).
Acousto-optic tunable filters are low-power devices that operate on the principle of diffraction in a birefringent crystal (Georgiev et al., 2002; Glenar et al., 2003; Chanover et al., 2011; Tawalbeh et al., 2013). We developed a portable near-IR AOTF point spectrometer to measure the IR reflectance spectrum of geological samples in the 1.6–3.6 μm range with a resolution of λ/Δλ ≅ 250–400. Photons emitted by a broadband IR light source are collimated and directed through the AOTF TeO2 crystal. A radio frequency signal applied to a piezoelectric transducer creates an acoustic wave in the crystal that modulates the refractive index. Phase matching conditions in the crystal result in the diffraction of a narrowband beam of the IR photons whose wavelength is dependent on the applied radio frequency. A small aperture placed after the TeO2 crystal isolates the narrowband beam from the remaining broadband photons. The diffracted photons are focused on a sample surface (with a spot size of approximately 2 mm), and the reflected signal is collected and re-imaged onto a HgCdTe detector. A detailed description of the development of this spectrometer is available in the work of Tawalbeh et al. (2013). The development and specifications of a portable prototype, the Portable AOTF Spectrometer for Astrobiology (PASA), are discussed in the work of Chanover et al. (unpublished data).
The wavelength range covered by our AOTF IR spectrometers includes important mineralogical and biogeochemical absorption features and thus offers a useful wavelength range with which to probe for astrobiological investigations. The 1.6–3.6 μm range contains spectral signatures useful in identifying several common minerals relevant to terrestrial planetary surfaces, including silicates (Pieters and Englert, 1993; Núñez et al., 2014), carbonates (Gaffey, 1987; Pieters and Englert, 1993; Blanco et al., 2013, 2014), sulfates (Pieters and Englert, 1993; Gendrin et al., 2005; McAdam et al., 2014; Nachon et al., 2014; Poulet et al., 2014), basalts (Richardson et al., 2013; Sugawara et al., 2014), clay minerals (Pieters and Englert, 1993; Post and Noble, 1993; Ehlmann et al., 2011), and iron oxides (Pieters and Englert, 1993; Squyres and Knoll, 2005; Horgan et al., 2014; Potter-McIntyre et al., 2014), all of which are ubiquitous on the martian surface. IR spectral signatures of the fundamental stretching and bending modes of ices and volatiles relevant to icy Solar System bodies, including H2O, CO2, H2S, and irradiated ices, also lie within the spectral range covered by the AOTF IR spectrometer (Pieters and Englert, 1993; Chanover et al., 2013). Additionally, features that correspond to many of the basic organic compounds essential to life on Earth, such as characteristic group frequencies of amino, hydroxyl, and methyl groups, as well as O-H, N-H, and C-H stretching fundamentals indicative of aromatic species, lie within the 1.6–3.6 μm range (Pieters and Englert, 1993).
2.2. Laser-induced breakdown spectroscopy
Laser-induced breakdown spectroscopy is a robust technique capable of revealing the elemental composition of a geological sample. LIBS has the ability to penetrate through dust coverings by taking repeated measurements and produce a depth profile of a target, a feature unique to LIBS compared with other standoff measurement techniques. The emission spectrum produced by the LIBS instrument represents the elemental constituents of the plasma and is used to infer the mineralogy of a sample. McMillan et al. (2006) and Chavez et al. (2013) demonstrated that the detection of certain trace elements within geological samples reflects the environmental conditions at the time of formation, indicating the geographical location and biogenicity of a sample. These biosignatures correspond to the chemical composition and metabolic production characteristics of life presented in Section 1. LIBS is a versatile technique capable of providing context mineralogy, identifying biomineralization processes, and distinguishing between extant or extinct life and its substrate (Conrad and Nealson, 2001).
Rapid technological development and miniaturization of LIBS, as well as its ability to analyze an unprepared sample, make it an attractive option for spaceflight. LIBS has been successfully demonstrated as an in situ instrumentation technique as part of the ChemCam instrument package on the Mars Science Laboratory (Wiens et al., 2011; Anderson and Bell, 2013; Johnson et al., 2015), has been selected as part of the SuperCam instrument on the Mars 2020 rover (Wiens et al., 2014), and is being considered for future in situ exploration of other planetary environments (Committee on the Planetary Science Decadal Survey, 2012; S.G. Pavlov et al., 2012; Mustard et al., 2013; Zacny et al., 2013).
To illustrate the technique in the analysis of cave samples, we measured our field samples upon return to the laboratory with a commercial Ocean Optics LIBS 2500+ instrument and broadband spectrometer (Model 2000) to determine the elemental compositional variability of geological samples. This LIBS system operates by vaporizing and atomizing target material with a high-powered 1064 nm IR laser pulse, which ionizes the gas, converting it to a plasma. Photons emitted during plasma recombination are collected by optical fibers and pass through a camera system and spectrograph, and the diffracted visible light is measured by a CCD (charge-coupled detector). The resultant visible spectrum (200–980 nm with a resolution of Δλ = 0.1 nm) is analyzed by comparison to a LIBS spectral endmember library to identify the elemental constituents of a sample.
2.3. Scanning electron microscopy and energy dispersive X-ray spectroscopy
Scanning electron microscopes (SEMs) reveal the ultrastructure of microscopic organisms and the geological environment they are associated with. Energy dispersive X-ray spectroscopy can provide an elemental map of structures identified by SEM imaging, thus providing compositional analysis of morphological features of interest. This data set can provide additional supporting evidence for the biogenicity of a sample. The microscopic topography of an area inferred from the SEM image leads to the identification of morphological structures consistent with biological activity. Characteristic microscopic structures indicative of microorganisms may include filamentous structures (Boston et al., 2001; Spilde et al., 2005), ellipsoid or spherical structures (Nealson and Conrad, 1999; Nealson et al., 2002b; Spilde et al., 2005, 2008; White et al., 2014), and smooth bacterial film coatings or biomats (Nealson and Conrad, 1999). Morphological similarities to microbiological structures alone are not sufficient evidence for the detection of extant or extinct life (Gibson et al., 2001). Some inorganic processes may precipitate microscopic structures that resemble those produced biologically (García-Ruiz, 1999). Regions of the SEM micrograph may be selected for further analysis by the energy dispersive X-ray spectrometer (EDS), providing elemental composition context information for each structure that can aid in the classification of its origin. The detection of microscopic morphological features consistent with biological structures and elemental mapping of a region are associated with the structure and chemical composition characteristics of life presented in Section 1. Although a portable SEM/EDS is not yet available, a need for in situ fine-structure microscopy measurements with correlated mineralogical characterization of samples on other planetary surfaces has been expressed (Barney et al., 2012; Mustard et al., 2013; Pappalardo et al., 2013). To accomplish these science objectives, spacecraft have recently employed other in situ techniques including alpha particle X-ray spectroscopy and multispectral microscopic imagers (Barney et al., 2012; Committee on the Planetary Science Decadal Survey, 2012; Mustard et al., 2013); however, these techniques are unable to match the spatial resolution of the SEM/EDS.
On cave samples returned to the laboratory, we examined several morphologically distinct regions with the commercial Hitachi S-3400N Type II SEM equipped with an EDS microanalysis system for simultaneous elemental mapping. Small, millimeter-sized regions of the sample were extracted and attached to a sample holder via an electrically conductive adhesive. A sputtered conductive coating was not applied to the samples. In this technique, initially, a beam of high-energy electrons (0.3–30 keV) is focused onto a ∼1 nm region of a sample. These electrons ionize target atoms near the sample surface, ejecting their inner orbital electrons. Vacancies in the inner shell are quickly filled by electrons from an outer shell, which emit a characteristic X-ray during the transition. The electron beam is scanned over a microscopic scene, and a micrograph of the area (with a resolution limit of 2 nm) is reconstructed from detections of secondary electrons. The contrast of the image indicates the elemental composition of the surface, with bright areas corresponding to higher atomic numbers. The elemental composition of each pixel is inferred from the detection of the characteristic wavelength of backscattered X-rays.
3. Biosignature Characterization Results
To characterize the biosignature detection capabilities of the instrument suite described in Section 2, we measured a set of calcite samples collected from Fort Stanton Cave. Fort Stanton Cave is an extensive limestone cavern in central New Mexico with diverse speleothems and cave decorations. The cave formed several million years ago and is hydrologically subdued today, although flooding events of several years' duration have been observed over the past decade. However, the particular entrance accessed now is likely only a few hundred years old (Davis and Land, 2006). Fort Stanton Cave is protected by the New Mexico Bureau of Land Management as a National Landscape Conservation Area, which acts to prevent extensive indirect contaminants introduced by recreational cavers, making it an ideal field site to identify the presence of native microbes (Spilde et al., 2009, 2012).
Calcite (CaCO3) is a carbonate mineral, which was only relatively recently discovered with in situ analysis on the martian surface, and indicates that liquid water must have been present during formation (Boynton et al., 2009). Other carbonate minerals have been identified at several distinct geological regions on Mars with in situ and remote sensing techniques and represent some of the most astrobiologically interesting samples to investigate (Blanco et al., 2013; Guido et al., 2013). Calcite is the most commonly precipitated mineral by biogenic mechanisms on Earth (Boston et al., 2001; Blanco et al., 2013), therefore making it a compelling mineral class with which to demonstrate the biosignature detection capabilities of an instrument suite.
Calcium carbonate speleothems most commonly precipitate out of a carbonic acid-rich solution saturated with Ca2+ cations, as shown in the classical karst reaction in Eq. 1 (Onac and Forti, 2011). Biological processes may influence speleothem formation by acting as nucleation sites for the precipitation of some minerals, through the alteration of the acidity or reduction potential of the substrate, or by direct precipitation of minerals as end products of redox reactions resulting in an alteration of the crystal structure, growth rate, and crystal orientation (Boston et al., 2001; Melim et al., 2001; Onac and Forti, 2011; D'Elia et al., 2014).
We removed approximately 100 geological samples (∼5 cm in diameter) from inconspicuous locations from several passages in Fort Stanton Cave on May 2, 2013. A map of the entrance to Fort Stanton Cave showing the approximate calcite sampling locations is presented in Fig. 1. Samples were identified in the field and selected to maximize the variety of macroscopic morphological features, which may be representative of the formation of the sample; this diverse sample set includes minerals precipitated abiologically and through biomineralization. Following collection, we immediately stored all samples in resealable plastic bags (Economy Stock Zipper Bags Product No. 3525A) to limit gross contamination.

An annotated map of the first several kilometers of passage in Fort Stanton Cave showing the approximate location of calcite sample collection. The Snowy River formation is truncated on this map but extends several kilometers north and south. Sample collection on Snowy River was limited to the first kilometer of the formation near Turtle Junction. Map courtesy of the Fort Stanton Cave Study Project. Color images available online at
We present measurements of characteristic biologically precipitated calcite samples collected from the eastern wall and floor of Don Sawyer Memorial Hall (DSMH) in Fort Stanton Cave on May 2, 2013. The initial hypothetical determination of the biogenicity of these samples was inferred by their macroscopic characteristics consistent with microbial activity, which in this case include white calcite spherules resembling coralloids coating the host rock (Barton and Northup, 2007; Banks et al., 2010). We note that this classification based on a limited visual inspection is not necessarily accurate; however, this sampling approach is operationally similar to vetting performed by landed missions prior to collection of in situ measurements. Images of a sample collected are presented in Fig. 2a and 2b.

(
Microscopic morphological evidence for biosignatures is often best preserved on Earth in carbonate minerals (Allwood et al., 2013b). We examined each morphologically distinct region of a sample with the SEM/EDS to identify the presence of morphological ultrastructure consistent with features associated with microorganisms expected to exist in carbonate samples. Samples were adhered to an aluminum plate with conductive tape and placed in the SEM vacuum chamber. A 20 kV electron beam was used to target each sample. We emphasize that, while morphological similarities to microbiological structures are not sufficient evidence to fully support the claim for the unambiguous detection of life (García-Ruiz, 1999), the images do reveal promising regions of each sample to probe and may indicate the biogenicity of some speleothems.
Results from SEM imaging presented in Fig. 2c contain evidence of biological films coating the carbonate host rock, as well as long (50 μm) filaments approximately 5 μm in diameter, indicative of fungal filaments, perhaps calcified (Verrecchia et al., 1993; Banerjee and Joshi, 2014). An SEM micrograph of the exposed coralloid layered structure shown in Fig. 2d contains evidence for spheroid clusters, roughly 5 μm in diameter, consistent with the shape and size scale of nanobacteria (Nealson et al., 2002b; Barton and Northup, 2007; Douglas et al., 2008; Jones and Bennett, 2014). A secondary, rough-textured deposit is also visible on the surface of these spherules, which may be the result of biologically induced carbonate precipitation (Barton and Northup, 2007).
An EDS spectrum of the region probed by the SEM in Fig. 2c is presented in Fig. 2e. Regions with suspected morphological evidence of biological activity (blue circle annotations) contain more carbon than abiotic features nearby (red square annotations). Additionally, an increased detection of Ca and O in the biological features may indicate higher concentrations of calcite or calcium oxalate (CaC2O4) in these regions, indicative of biological precipitation (Verrecchia et al., 1993).
Figure 2f shows an annotated IR spectrum of the calcite sample measured by the AOTF IR reflectance point spectrometer. We measured two regions of the sample: the host rock (upper trace) and the white coralloid features (lower trace). Carbonate features (-CO3) are evident in all sample regions, as is a broad H2O hydration feature. The carbonate feature appears shifted from 1.9 to 1.95 μm in the coralloid spectrum, most likely indicating higher heavy metal content (Mg or Fe) (Gaffey, 1987; Clark et al., 2007; Chanover et al., 2013). The hydroxyl (OH) feature at ∼2.75 μm is only present in the spectra of freshly cleaved surfaces and is diminished in spectra of exposed regions due to water adsorption onto the surface, which overwhelms these features. Broad CH and CO3 features from 3.35 to 3.5 μm are observed only in the host rock (Murchie et al., 2007), which provides support for calcite or oxalate precipitation by an underlying microbial community.
Analyses of visible and IR reflectance spectra of biological and abiological carbonate minerals by Berg et al. (2014) suggest that absorption features at 1.7 and 2.0–2.2 μm corresponding to C-H bonds may indicate the presence of organic molecules. Additionally, Orofino et al. (2007) demonstrated the determination of the biological origin of heat-treated calcium carbonates using transmission IR spectroscopy. Regev et al. (2010) demonstrated the presence of spectral variability between calcites formed by different mechanisms using an IR spectrometer with a spectral resolution comparable to our AOTF IR reflectance spectrometer by comparing the absorption depth of the ν2 and ν4 C-O vibrational bending modes. The presence of these IR spectral biosignatures is not obvious in the spectrum shown in Fig. 2f; however, the presence of biosignatures in all calcite AOTF IR spectra, consistent with the results presented by Berg et al. (2014) and Regev et al. (2010), is evident when analyzed with multivariate analysis techniques. A more detailed discussion of the biogenicity of calcite samples collected from Fort Stanton Cave, as inferred from IR reflectance spectra using these statistical approaches, is provided in Section 4.1.
The inorganic composition of this sample is inferred from the LIBS emission spectrum, presented in Fig. 2g. We collected 200 measurements from 100 unique locations on each sample. The first shot in each measurement pair probes the outer layer of the sample, and the second shot measures the sample at a depth of approximately 10 μm. Figure 2g represents an average of all 200 shots. We measured each sample under argon gas to increase the signal strength of the mineral emission by reducing the ambient air ionized during the ablation process. We removed all emission peaks associated with Ar in each averaged LIBS spectrum. The spectrum is dominated by the detection of calcite with strong carbon and oxygen lines, indicating that the major mineral class observed is likely a calcium carbonate (Wiens et al., 2005).
Trace elements associated with biomineralization of calcite (including Pb, Ba, Mg, and light rare earth elements such as Nd) were detected with LIBS and used to confirm the biogenicity of these samples (McMillan et al., 2014; Kochelek et al., 2015). These elements are not annotated on the calcite-dominated spectra presented in Fig. 2g due to their relatively low concentration; however, their contribution to the spectrum was quantified by using the multivariate analysis techniques discussed further in Section 4, providing evidence that supports the biological nature of this calcite sample.
4. Statistical Analyses
We applied two multivariate statistical analysis techniques—principal component analysis (PCA) and partial least squares discriminant analysis (PLS-DA)—to the AOTF IR spectrometer and LIBS data sets to identify the presence of biosignatures within field samples. Several individual IR spectra associated with each distinct region of a sample were acquired, whereas each LIBS measurement represents the average emission spectrum over an entire sample. We used PCA and PLS-DA algorithms applied to both data sets to help discriminate between the biotic or abiotic origin of a geological sample and, from that, inferred the presence of organisms. A biotic influence on the formation of these minerals may manifest itself through the detection of trace elements, organic species, or a varied crystal structure through biomineralization processes (Borsato et al., 2000; Boston et al., 2001; McMillan et al., 2006; Krinsley et al., 2009; Blanco et al., 2013). In our case, samples are classified a priori based on results from SEM measurements, where samples with positive identification of morphological features associated with biological precipitation of carbonates are classified as biotic and samples with an absence of such evidence are classified as abiotic.
4.1. Principal component analysis
In PCA, the principal components are defined as the orthogonal dimensions of uncorrelated variables (wavelength values for reflectance and LIBS spectra) along which a decreasing amount of variance in the data set exists starting from the highest. The magnitude of the variance of each spectrum from a principal component may be used to characterize a sample based on the physical representation of the principal component (Esbensen, 2002). We demonstrate that variation within some principal components in calcite spectra measured by the LIBS and AOTF IR point spectrometer is dependent upon the method of formation, which may be used to infer the biogenicity of the sample, as proposed by Conrad and Nealson (2001). The identification of the source of variability within a geological data set has been previously demonstrated by applying PCA to LIBS data, whose principal components represent a distinction in the geographical location of the formation of a mineral (McMillan et al., 2006). Similarly, PCA has been successfully implemented to distinguish between sulfate and chloride ices and salts on extraterrestrial surface analogues measured with LIBS (Schröder et al., 2013). The development of a robust PCA technique requires a large volume of laboratory measurements and provides a unique means of determining the formation of these minerals (Wold et al., 2001).
In Figs. 3 and 4, we present the PCA of each distinct region of all calcite samples measured by the AOTF IR point spectrometer and LIBS, respectively. We independently identified the presence of biotic activity in these samples with SEM measurements by the direct detection of fossilized microbes or biogenic morphological features. The first seven principal components of the data sets acquired by each instrument are calculated and examined to identify which principal components, if any, represent spectral variability caused by biotic activity.
(
(
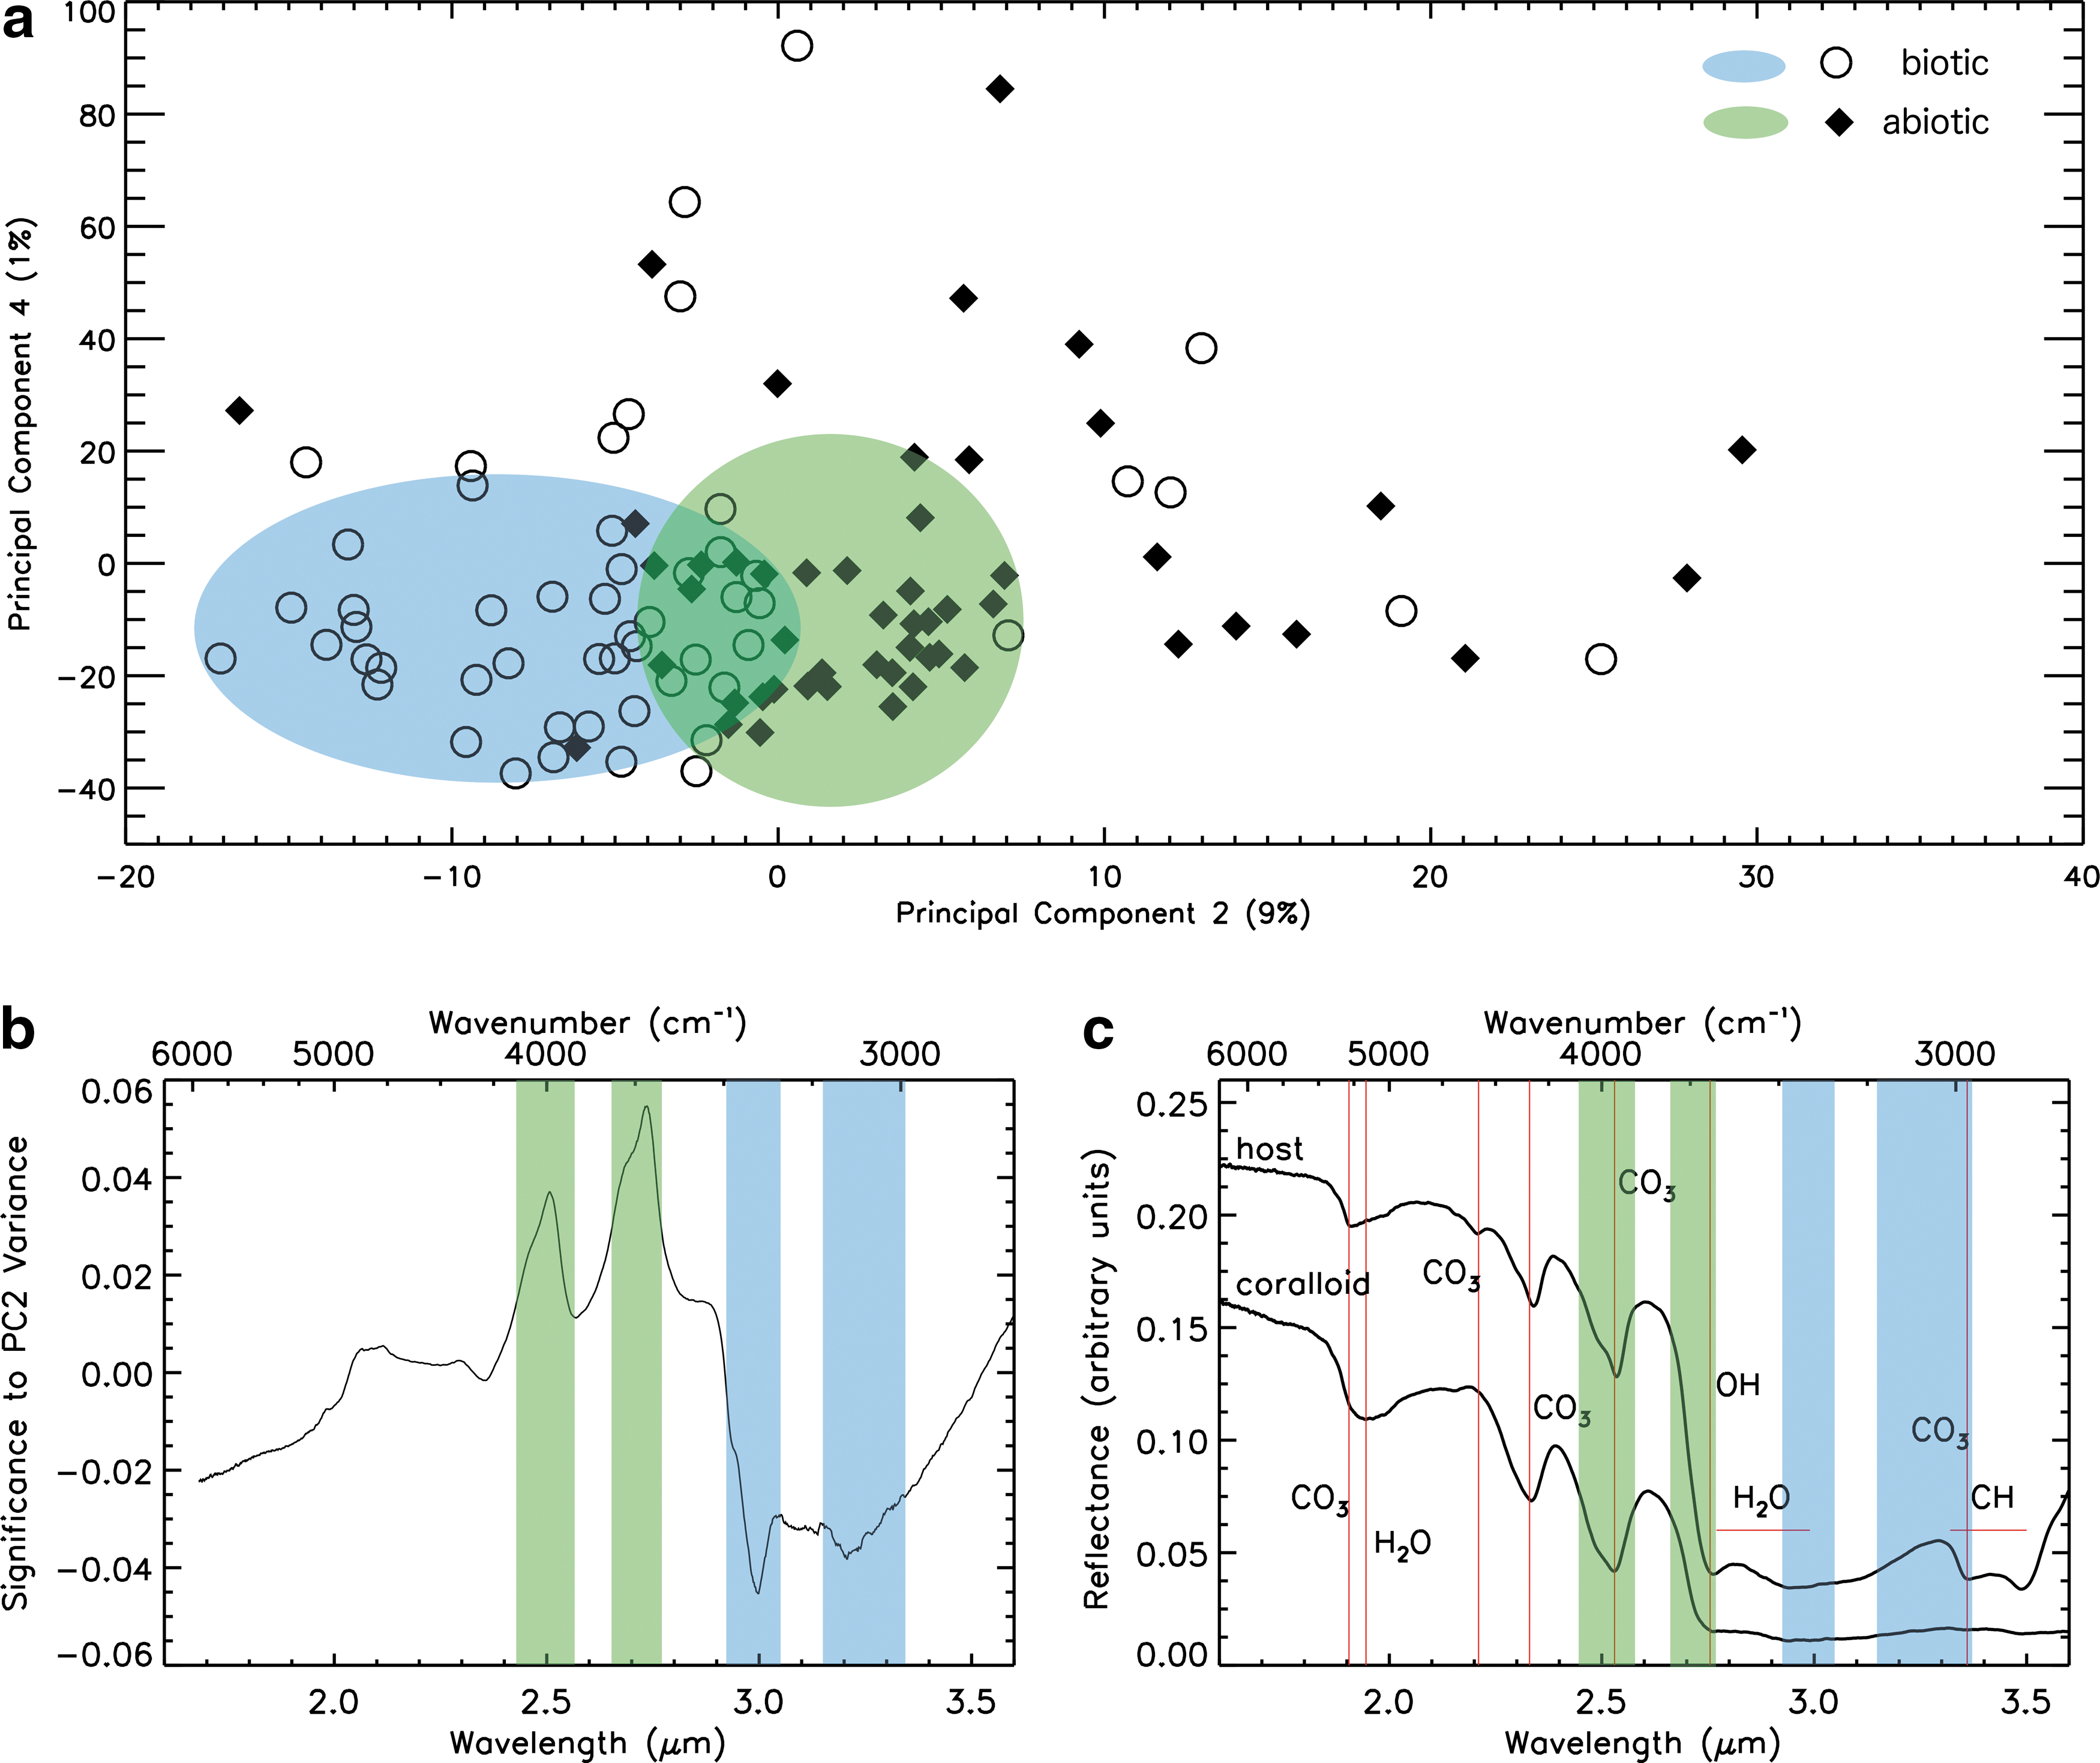
We find that variance within principal component 2 (PC2) corresponds to variability between biotic and abiotic calcite samples in the IR spectroscopy data set, as shown in Fig. 3a. The figure shows the scores for PC2 (which accounts for 9% of the total variance) and PC4 (which accounts for 1% of the total variance) with annotations representing samples with (open circles) and without (filled diamonds) SEM evidence for biological activity. Variability within PC1 is dominated by H2O absorption variability (2.73 and 2.9 μm), most likely due to the presence of a thin gypsum coating on some of the calcite samples. The bimodal distribution of PC2 scores demonstrates the biosignature detection for each sample. The absorption features responsible for this variability are inferred from the loading plot of PC2, shown in Fig. 3b. Samples containing SEM evidence for biotic activity have low PC2 values, which represent deeper broad H2O absorption centered at 3.0 μm and weaker carbonate (CO3 at 3.35 μm) and CH (at 3.35 and 3.5 μm) absorption features, shown in Fig. 3c. Reflectance spectra of inorganic samples have weaker bound hydration absorption, and their spectra are characterized by a deeper hydroxyl feature (2.76 μm) and carbonate feature (CO3 at ∼2.5 μm).
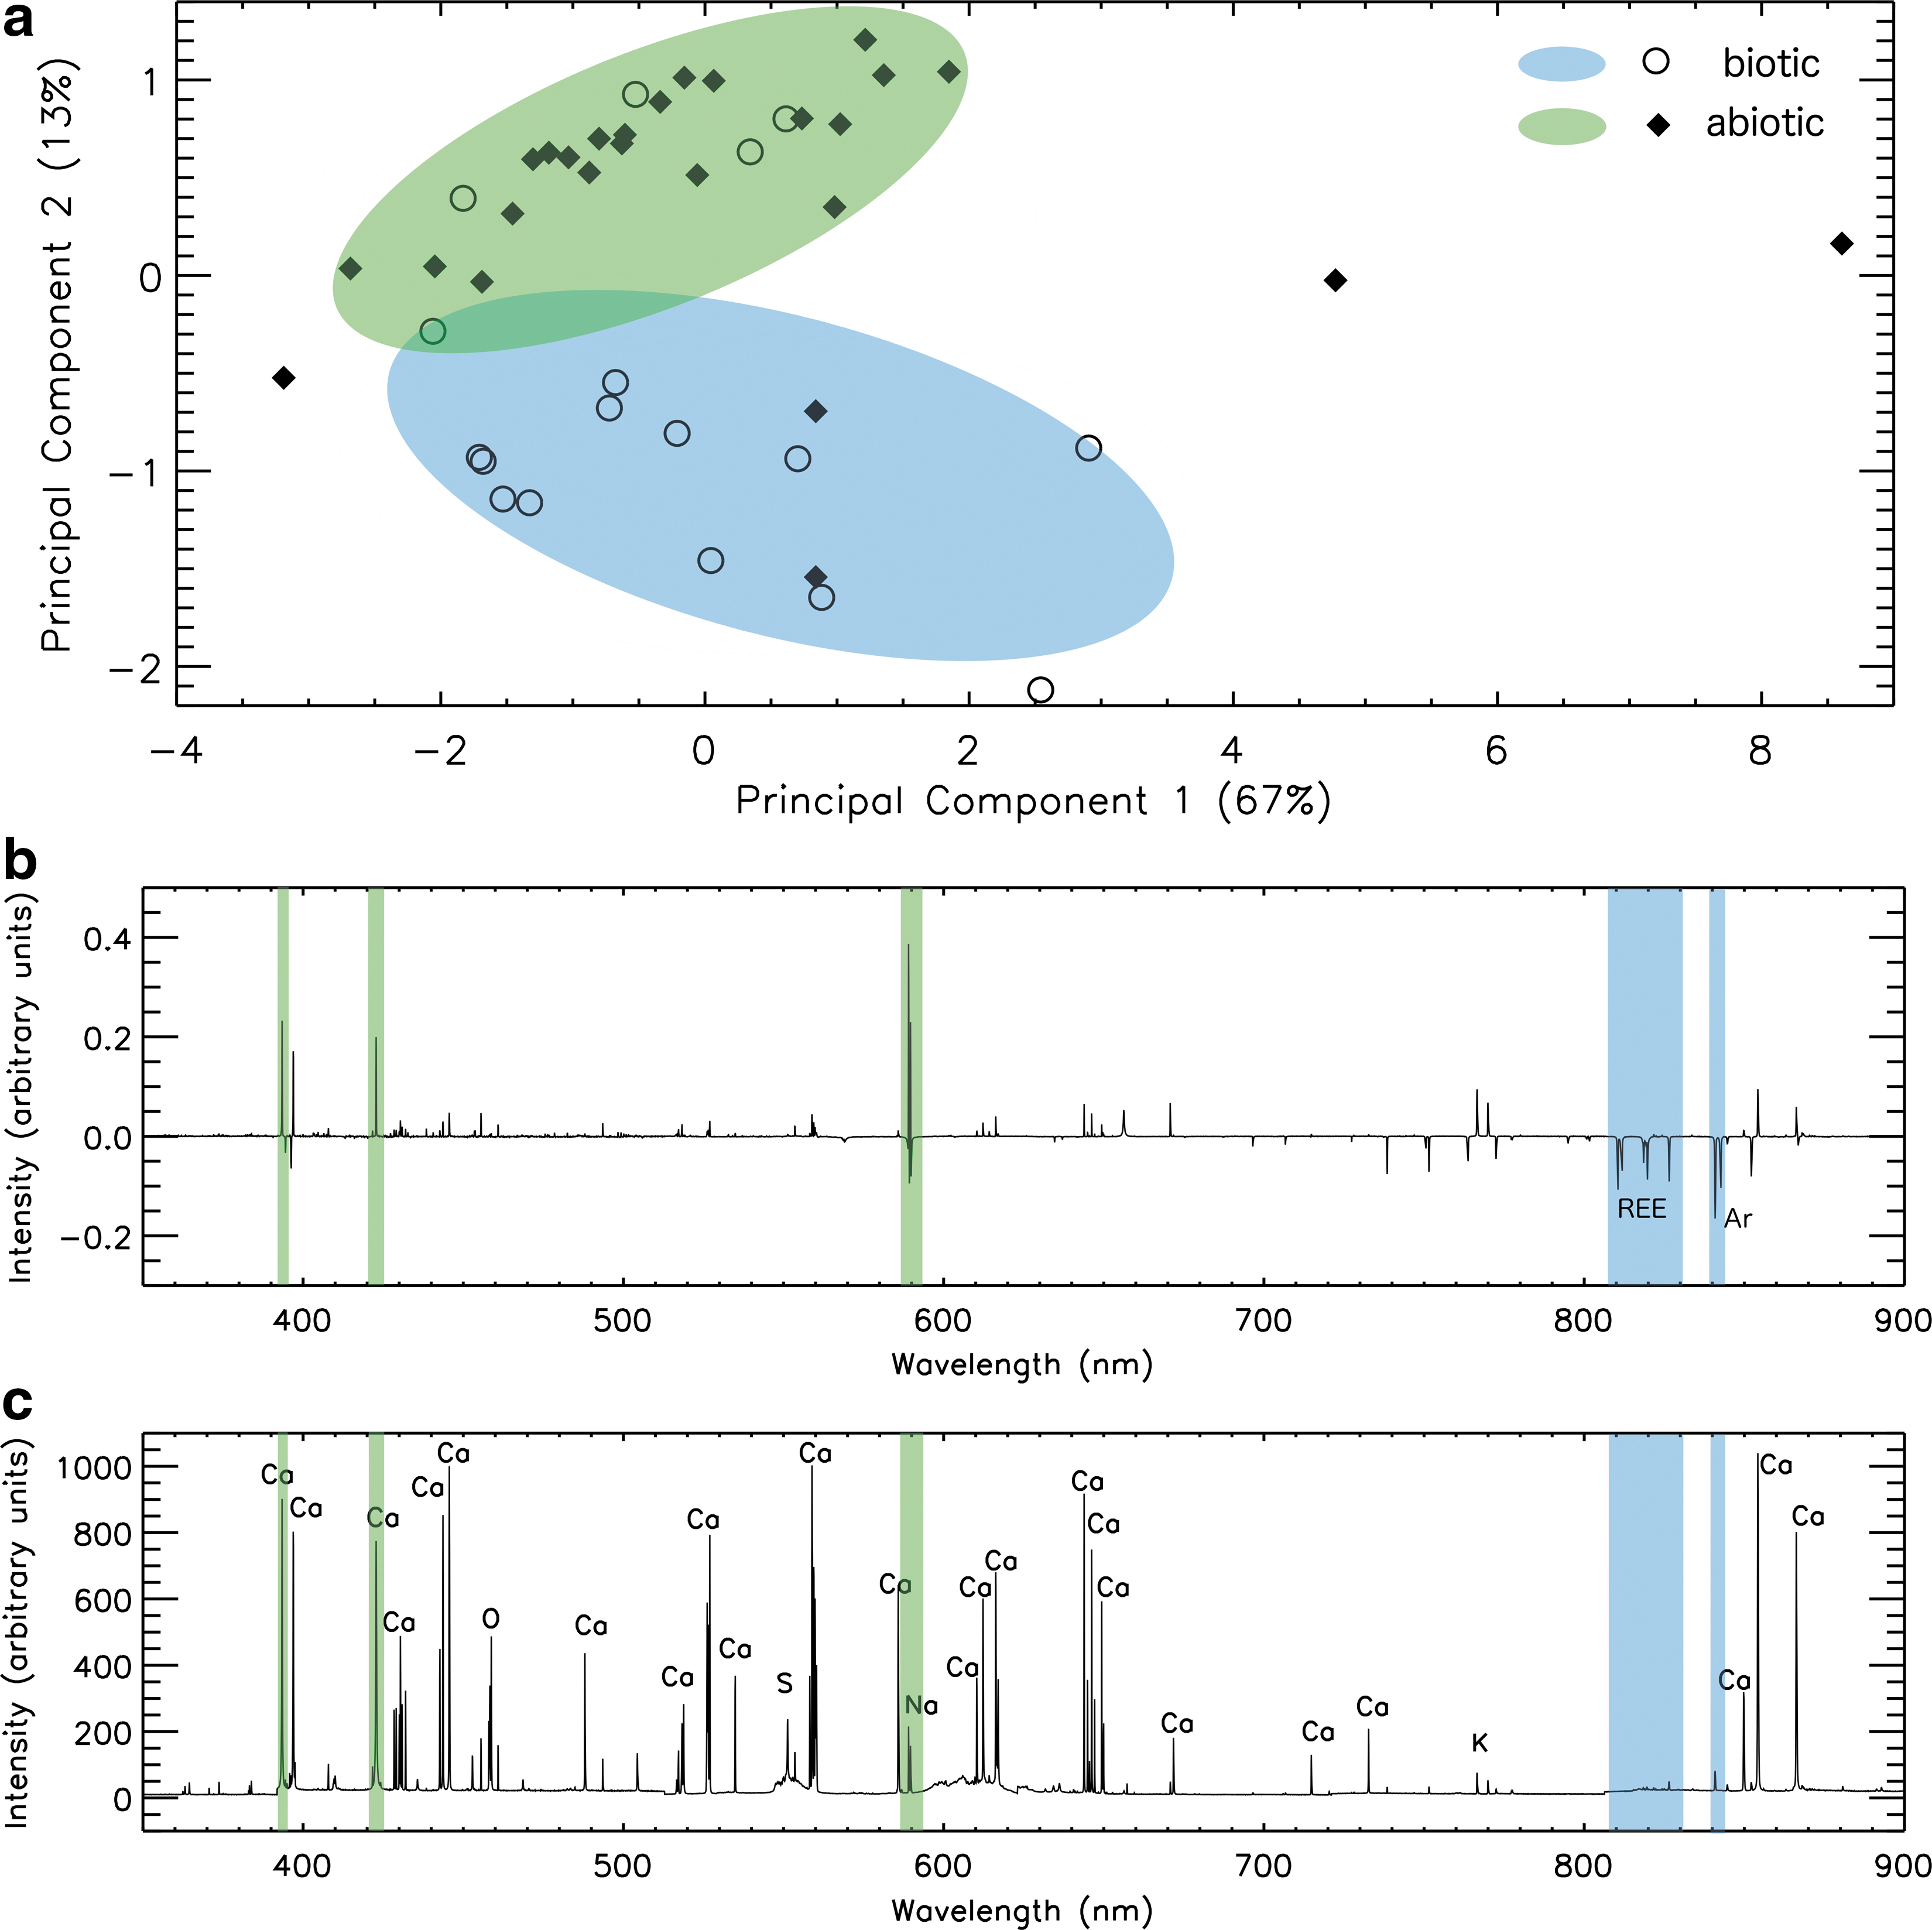
Principal component analysis applied to the LIBS data set may also reveal the biogenicity of a sample along PC2, as shown in Fig. 4. In this case, variability within PC1 is primarily dominated by variations in Ca emission peak intensity. The observed separation of biotic and abiotic samples along PC2 is dominated by the presence of a strong Na emission line in abiotic samples, as shown in the loading plot presented in Fig. 4b. Samples containing SEM evidence for biotic activity (open circles) have low PC2 values, which represent, in general, an absence of a strong Na emission peak at 589 nm and the presence of weak features associated with rare earth elements (REEs) (810–830 nm). A strong affinity of microorganisms and microbial mats for some REEs has been reported extensively (Takahashi et al., 2005, 2007). In fact, the affinities are so striking that they are being contemplated for application as environmental engineering solutions (Kuroda and Ueda, 2010; Moriwaki and Yamamoto, 2013). We are continuing to investigate how these elements may be related to the presence of microscopic organisms in our study sites. Emission spectra of inorganic samples are characterized by an absence of these REEs.
Biologically and abiotically precipitated calcite samples were collected from a variety of regions within the cave (as shown in Fig. 1), indicating that variability within the spectral features responsible for biogenicity (highlighted in Figs. 3c and 4c) is not significantly influenced by formation location. We note that the biogenicity of many calcite samples may be incorrectly identified by applying PCA to LIBS or IR spectroscopy data. Several samples classified as biological have positive PC2 scores, and conversely, some samples with no SEM evidence for biological activity have negative PC2 scores, as shown in Figs. 3a and 4a. Some abiological samples may have been misclassified; many microbial carbonates do not produce direct morphological evidence following biomineralization (D'Elia et al., 2014). Additionally, spectra with a PC2 score near 0 do not contain strong evidence for classifying the biogenicity of a sample. Although PCA may not exclusively determine the presence of the biological influence of a sample, the results may identify the most promising candidates for follow-up measurements to identify the presence of microbial activity.
4.2. Partial least squares discriminant analysis
We use a PLS-DA algorithm, a supervised technique that requires the assignment of a subset of all samples to a class a priori, to identify the presence of microbial alteration within calcium carbonate samples measured by the AOTF IR point spectrometer and the LIBS instrument. The maximum variance between samples of different classes within this subset is calculated. This variance is compared with samples in the unassigned subset of the data, for which a class membership value (between 0 and 1) is calculated based on the difference in the magnitude of the variance of the uncorrelated variables (wavelength values for IR or emission spectra) (Esbensen, 2002; Schröder et al., 2013).
We applied this technique to infer the presence of microbial alteration in calcium carbonate samples collected from Fort Stanton Cave. A subset of all calcite samples is first assigned a binary value identifying the sample as biotic (0) or abiotic (1) (based on morphological SEM evidence); the PLS-DA algorithm then calculates class membership values for the “unknown” subset of samples. We compare the binary class value assigned to these samples to their known biotic or abiotic origin to determine the accuracy of the model.
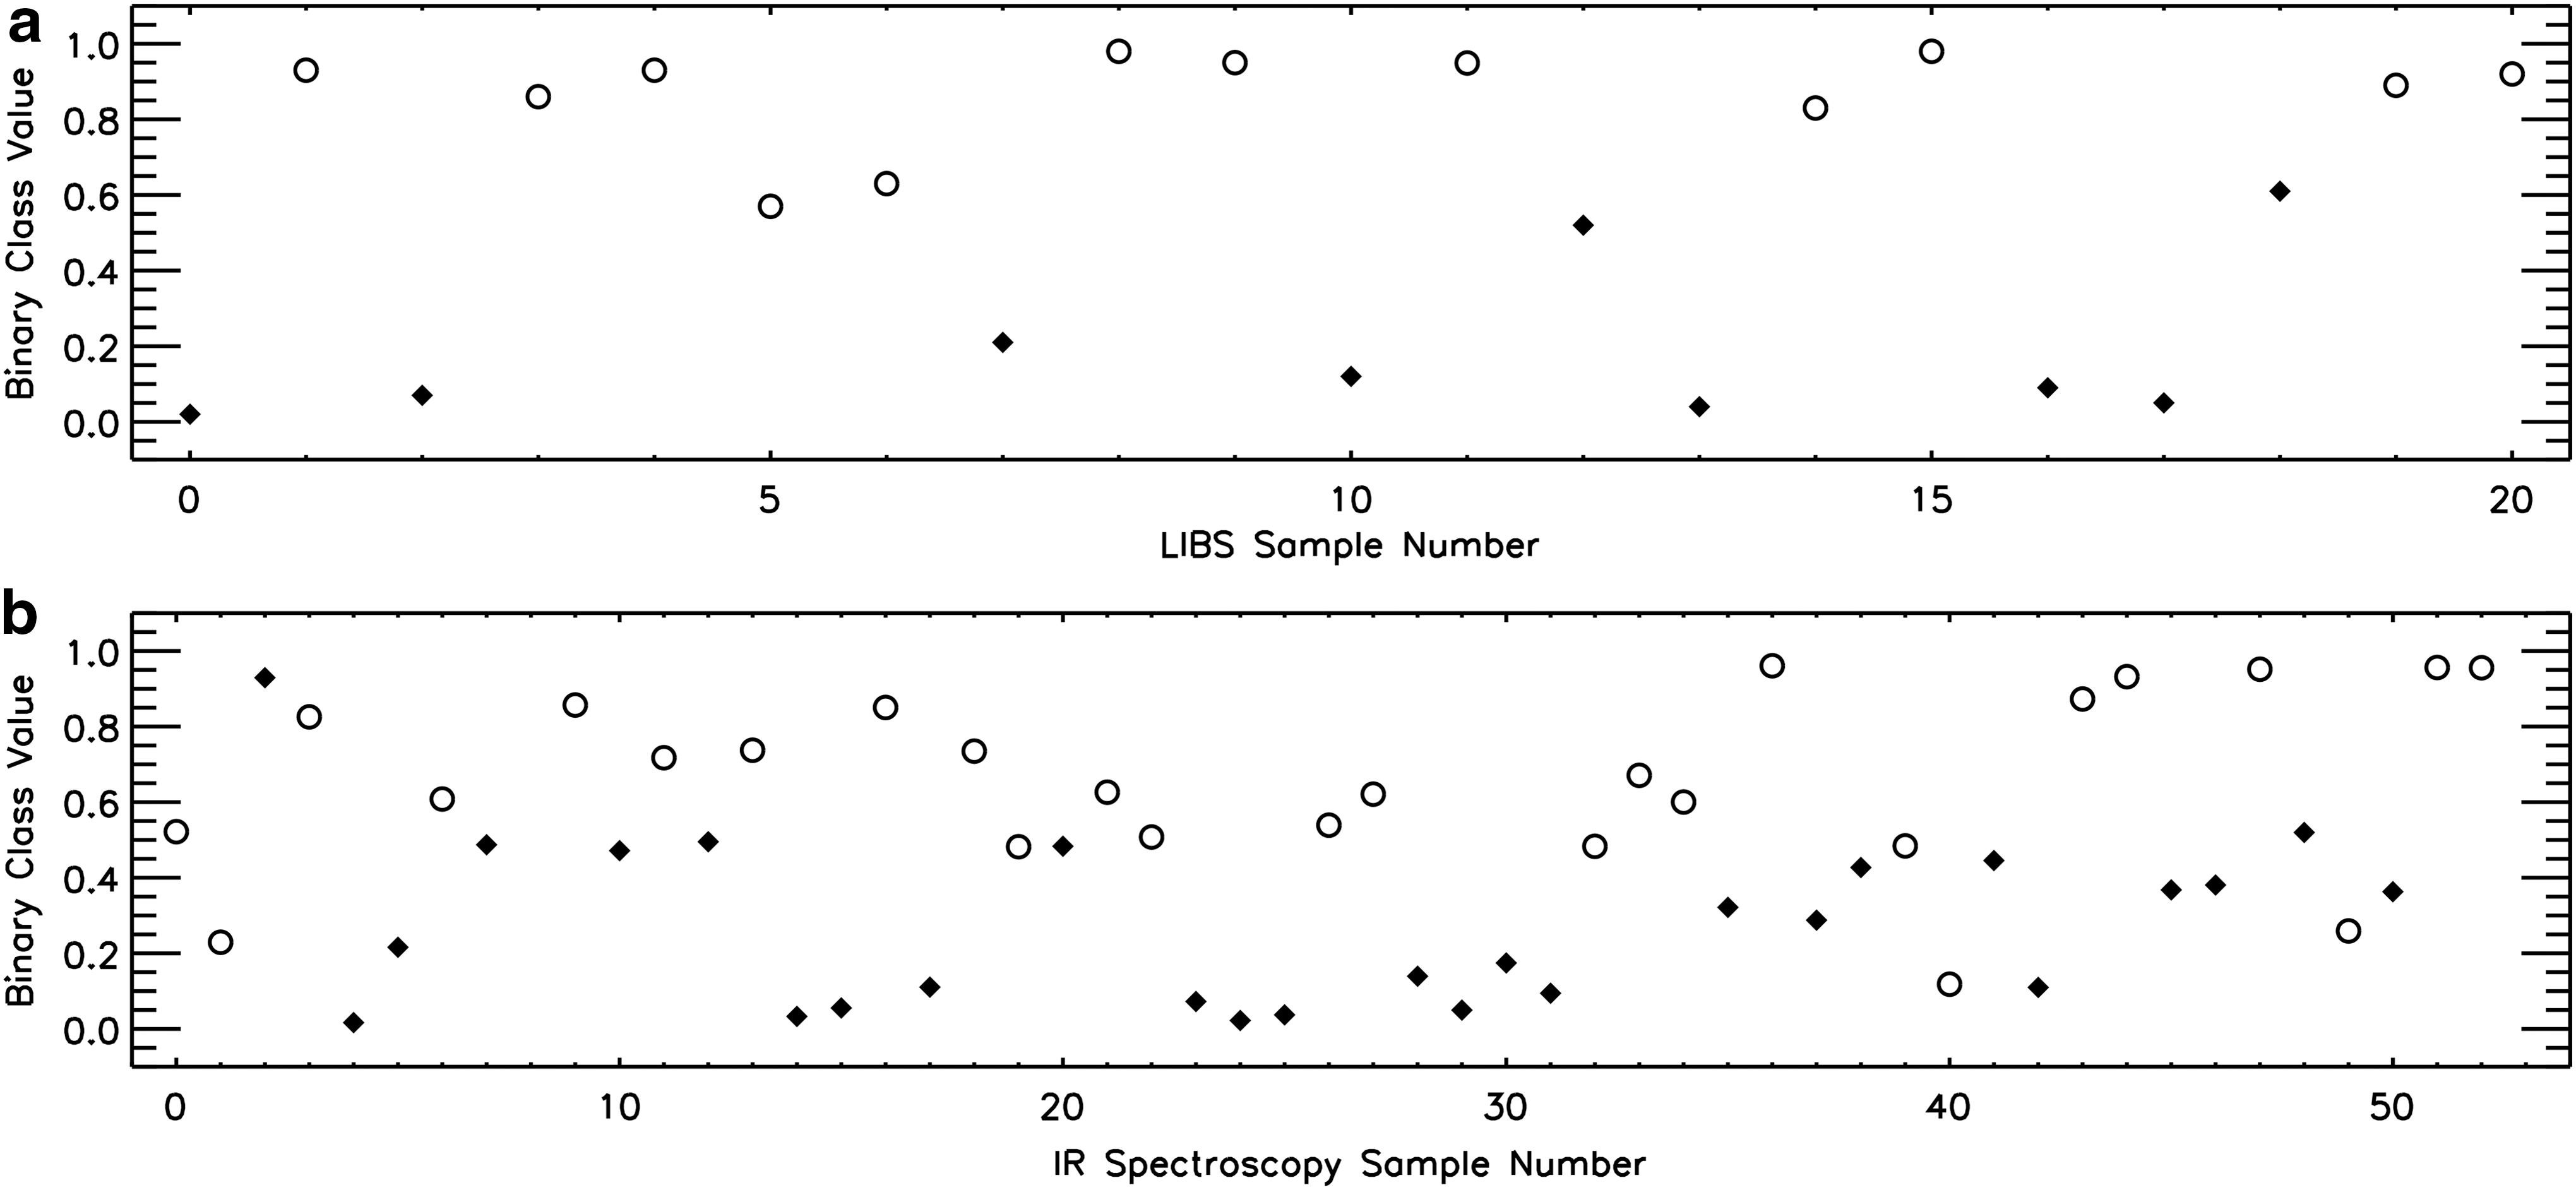
The results of the PLS-DA technique applied to the identification of calcite samples containing the presence of microorganisms are presented in Fig. 5 for the LIBS (Fig. 5a) and AOTF IR spectrometer (Fig. 5b) data sets. The PLS-DA technique successfully classified 90% of calcite samples measured with the LIBS instrument and 81% of samples measured by the IR spectrometer. Traces of REEs contribute most significantly to the differences between biotic and abiotic samples for the LIBS data, and biotic IR spectra are characterized by broad H2O absorption and weak carbonate and CH absorption features.
The biogenicity assignment of the calcium carbonate samples from PLS-DA applied to LIBS (
Partial least squares discriminant analysis identifies biosignatures within a sample more reliably than PCA because PLS-DA ignores spectral variances between samples unrelated to the biotic origin of the sample. However, PLS-DA requires the classification of a subset of samples a priori and therefore requires a second biosignature identification technique to be implemented (Esbensen, 2002). The expansion of the biogenic calcite data set to include samples from other field sites is planned for the calibration of the PLS-DA model to account for variability under a range of formation conditions (Kochelek et al., 2015). The results of this future study may establish the practicality of implementing such a statistical analysis technique to LIBS spectra on other Solar System bodies such as Mars to identify biogenic carbonates.
5. Conclusions
In this study, we have demonstrated how the detection of biosignatures within subterranean samples on Earth can be improved by using a suite of instruments, many of which are candidates for future landed and roving missions to other planetary surfaces (S.G. Pavlov et al., 2012; Mustard et al., 2013). Measurements of biogenic field samples from each of these instrumentation techniques provide a unique data product useful in identifying the biogenicity of a sample. Microscopic morphological biosignatures from SEM micrographs reveal the ultrastructure associated with endolithic activity or biomineralization processes, and the associated elemental mapping of these structures using EDS provides additional evidence of their origins. IR spectroscopy reveals the major mineral composition of a sample as well as many absorption features corresponding to some of the basic organic compounds essential to life on Earth, which can indicate the chemical history of an environment and thus its habitability. Results from LIBS spectra provide the elemental composition of a sample, including the presence of trace elements, which can be used to infer biomineralization of a mineral.
Multivariate analysis techniques, including PCA and PLS-DA, facilitate the characterization of biosignatures within a sample set and are used here to provide an initial classification of the biogenic or abiogenic origin of samples. We demonstrate that PCA applied to LIBS and IR spectroscopy measurements of calcite samples can distinguish between these formation mechanisms in many cases due to the presence of trace elements and IR spectral variability associated with these two sample classes. Orofino et al. (2007) identified a similar result with transmission IR spectroscopy measurements of calcites, following heat treatment. Our results imply that reflectance IR spectroscopy may be an effective technique for the identification of biomineralized calcites, which is much more suitable for in situ investigations than the heat treatment preparation of samples for transmission IR spectroscopy required by the Orofino et al. (2007) study. However, we are cautious to conclude that the LIBS or IR spectral variability resulting from the biological or abiological precipitation of these calcites (inferred from PC2 in both cases) is exclusively associated with biogenicity. Further analysis of other sample classes at a variety of locations will be necessary to confirm the validity of this technique and its potential for extraterrestrial biosignature identification applications.
The use of a suite of complementary instruments for in situ investigations of other Solar System bodies is essential for the unambiguous detection of biological activity. We have demonstrated the effectiveness of such an instrumentation suite and suggest that the subsurface provides the most favorable likely environment for the emergence, growth, and preservation of primitive extraterrestrial microorganisms on planets like Mars. Methods for remote robotic exploration of extraterrestrial caves are currently being developed (Parness et al., 2013; Huber et al., 2014), which will enable the future access to rigorous terrain environments, including the subsurface. Future astrobiology investigations of planetary (sub)surfaces will benefit from an instrument payload focused on the identification of a diverse suite of biosignatures.
Footnotes
Acknowledgments
This work was supported by a NASA Space Technology Research Fellowship (grant number NNX13AL49H). This work was also supported by grants from NASA's Experimental Program to Stimulate Competitive Research (EPSCoR; grant number NNX08AV85) and Astrobiology Science and Technology Instrument Development (ASTID; grant number NNX08AY44G) programs. Additional support was provided by New Mexico Tech, NMSU's Astronomy and Electrical and Computer Engineering Departments, the New Mexico EPSCoR program office, and an Interdisciplinary Research Grant from the NMSU Vice President for Research.
The authors would like to thank Robert Hull for his contributions to the AOTF IR spectrometer electronics system, as well as Rula Tawalbeh, John Gariano, and Ivan Dragulin for their assistance with further development of the AOTF point spectrometer and data acquisition software. We thank Peter Cooke for assisting in SEM and EDS data acquisition. We would also like to acknowledge Steve Peerman, Wayne Walker, and the Fort Stanton Cave Study Project for their assistance in sample acquisition and guidance within the Fort Stanton Cave. We thank the Roswell office of the Bureau of Land Management for access to Fort Stanton Cave and permission to sample within it.
Author Disclosure Statement
No competing financial interests exist.