
Abstract
Cave minerals deposited in the presence of microbes may host geochemical biosignatures that can be utilized to detect subsurface life on Earth, Mars, or other habitable worlds. The sulfur isotopic composition of gypsum (CaSO4·2H2O) formed in the presence of sulfur-oxidizing microbes in the Frasassi cave system, Italy, was evaluated as a biosignature. Sulfur isotopic compositions (δ34SV-CDT) of gypsum sampled from cave rooms with sulfidic air varied from −11 to −24‰, with minor deposits of elemental sulfur having δ34S values between −17 and −19‰. Over centimeter-length scales, the δ34S values of gypsum varied by up to 8.5‰. Complementary laboratory experiments showed negligible fractionation during the oxidation of elemental sulfur to sulfate by Acidithiobacillus thiooxidans isolated from the caves. Additionally, gypsum precipitated in the presence and absence of microbes at acidic pH characteristic of the sulfidic cave walls has δ34S values that are on average 1‰ higher than sulfate. We therefore interpret the 8.5‰ variation in cave gypsum δ34S (toward more negative values) to reflect the isotopic effect of microbial sulfide oxidation directly to sulfate or via elemental sulfur intermediate. This range is similar to that expected by abiotic sulfide oxidation with oxygen, thus complicating the use of sulfur isotopes as a biosignature at centimeter-length scales. However, at the cave room (meter-length) scale, reactive transport modeling suggests that the overall ∼13‰ variability in gypsum δ34S reflects isotopic distillation of circulating H2S gas due to microbial sulfide oxidation occurring along the cave wall-atmosphere interface. Systematic variations of gypsum δ34S along gas flow paths can thus be interpreted as biogenic given that slow, abiotic oxidation cannot produce the same spatial patterns over similar length scales. The expression and preservation potential of this biosignature is dependent on gas flow parameters and diagenetic processes that modify gypsum δ34S values over geological timescales. Key Words: Gypsum—Sulfur isotopes—Biosignature—Sulfide oxidation—Cave. Astrobiology 18, 59–72.
1. Introduction
T
To accomplish this goal, one approach is to investigate mineral-based biosignatures in Earth's subsurface. In particular, sulfidic caves on Earth that host extensive ecosystems in the absence of light (Sarbu et al., 1996, 2000; Vlasceanu et al., 2000; Boston et al., 2006; Jones et al., 2008) are promising analogues for potential life-hosting, subsurface systems on planets with inhospitable surfaces. Sulfidic caves are formed by sulfuric acid speleogenesis, via the oxidation of hydrogen sulfide (H2S) transported into the cave through groundwater. Hydrogen sulfide is degassed due to turbulent flow and oxidized above the water table to sulfuric acid by aerobic microbes such as Acidithiobacillus thiooxidans (Hose et al., 2000; Macalady et al., 2007; Jones et al., 2011, 2014). The produced sulfuric acid dissolves limestone (Eq. 1), enlarges cavities, and subsequently forms gypsum deposits (CaSO4·2H2O) that can accumulate to several centimeters' thickness on the cave wall (Hose et al., 2000; Galdenzi and Maruoka, 2003; Jones et al., 2015):
Massive deposits of gypsum have been found in both actively forming and inactive sulfidic caves as old as 10 million years (e.g., Hill, 2000; Galdenzi and Maruoka, 2003; De Waele et al., 2016).
Given that microbial H2S oxidation is 10 to 105 faster relative to abiotic oxidation (Wilmot et al., 1988; Buisman et al., 1990; Luther et al., 2011; Jones et al., 2015), a geochemical tracer of microbial sulfur cycling may be expressed in gypsum. One such tracer is sulfur isotopes (δ34S). Compiled gypsum δ34S values from several sulfidic caves showed tremendous variability, spanning a range of +5‰ to −13‰ relative to the presumed H2S source (Table 1). Gypsum δ34S values reflect the sulfate source, being consistently higher by about 1‰ (Raab and Spiro, 1991, and references therein). If microbial H2S oxidation produces sulfate with a distinct isotopic composition compared to abiotic processes, gypsum δ34S can be a target for biosignatures. Sulfate production via H2S may be indirect and proceed through the formation and further oxidation of sulfur species of intermediate oxidation states such as thiosulfate, sulfite, and elemental sulfur with distinct isotopic fractionations. Thus, to use S isotopes as biosignatures, it is crucial to constrain the isotopic fractionation factor associated with microbial H2S oxidation as well as the oxidation pathways in the cave system, alongside additional variability associated with the H2S source isotopic composition and transport processes.
(1) This study. (2) Galdenzi and Maruoka (2003). (3) Zerkle et al. (2016). (4) Hose et al. (2000). (5) van Everdingen et al. (1985). (6) Grasby et al. (2012). (7) Onac et al. (2009). (8) Onac et al. (2011). (9) Hill (2000). (10) Pisarowicz (1994). (11) Onac et al. (2007). (12) De Waele et al. (2016).
Groundwater H2S.
H2S gas.
Average δ34S of groundwater H2S in Frasassi.
In this study, we evaluate the extent to which gypsum from the sulfidic Frasassi caves reflects the microbial H2S oxidation known to be occurring in the system. Over 50 gypsum samples were collected and characterized for S isotopes and morphology. The data were used to constrain the apparent isotopic fractionation associated with aerobic microbial H2S oxidation in this system. Coupled to reactive transport models that take into account H2S gas flow, the different length scales at which microbial H2S oxidation imparts variations in δ34S of cave gypsum deposits are explored, yielding spatial patterns in δ34S at the meter-length scales that can be recognized as biosignatures. A simple strategy for detecting biosignatures in ancient cave systems through systematic sampling of mineral deposits over meter-length scales is presented. The preservation potential of this biosignature is discussed in terms of gas flow variability and physical and chemical diagenesis.
2. Sampling Site
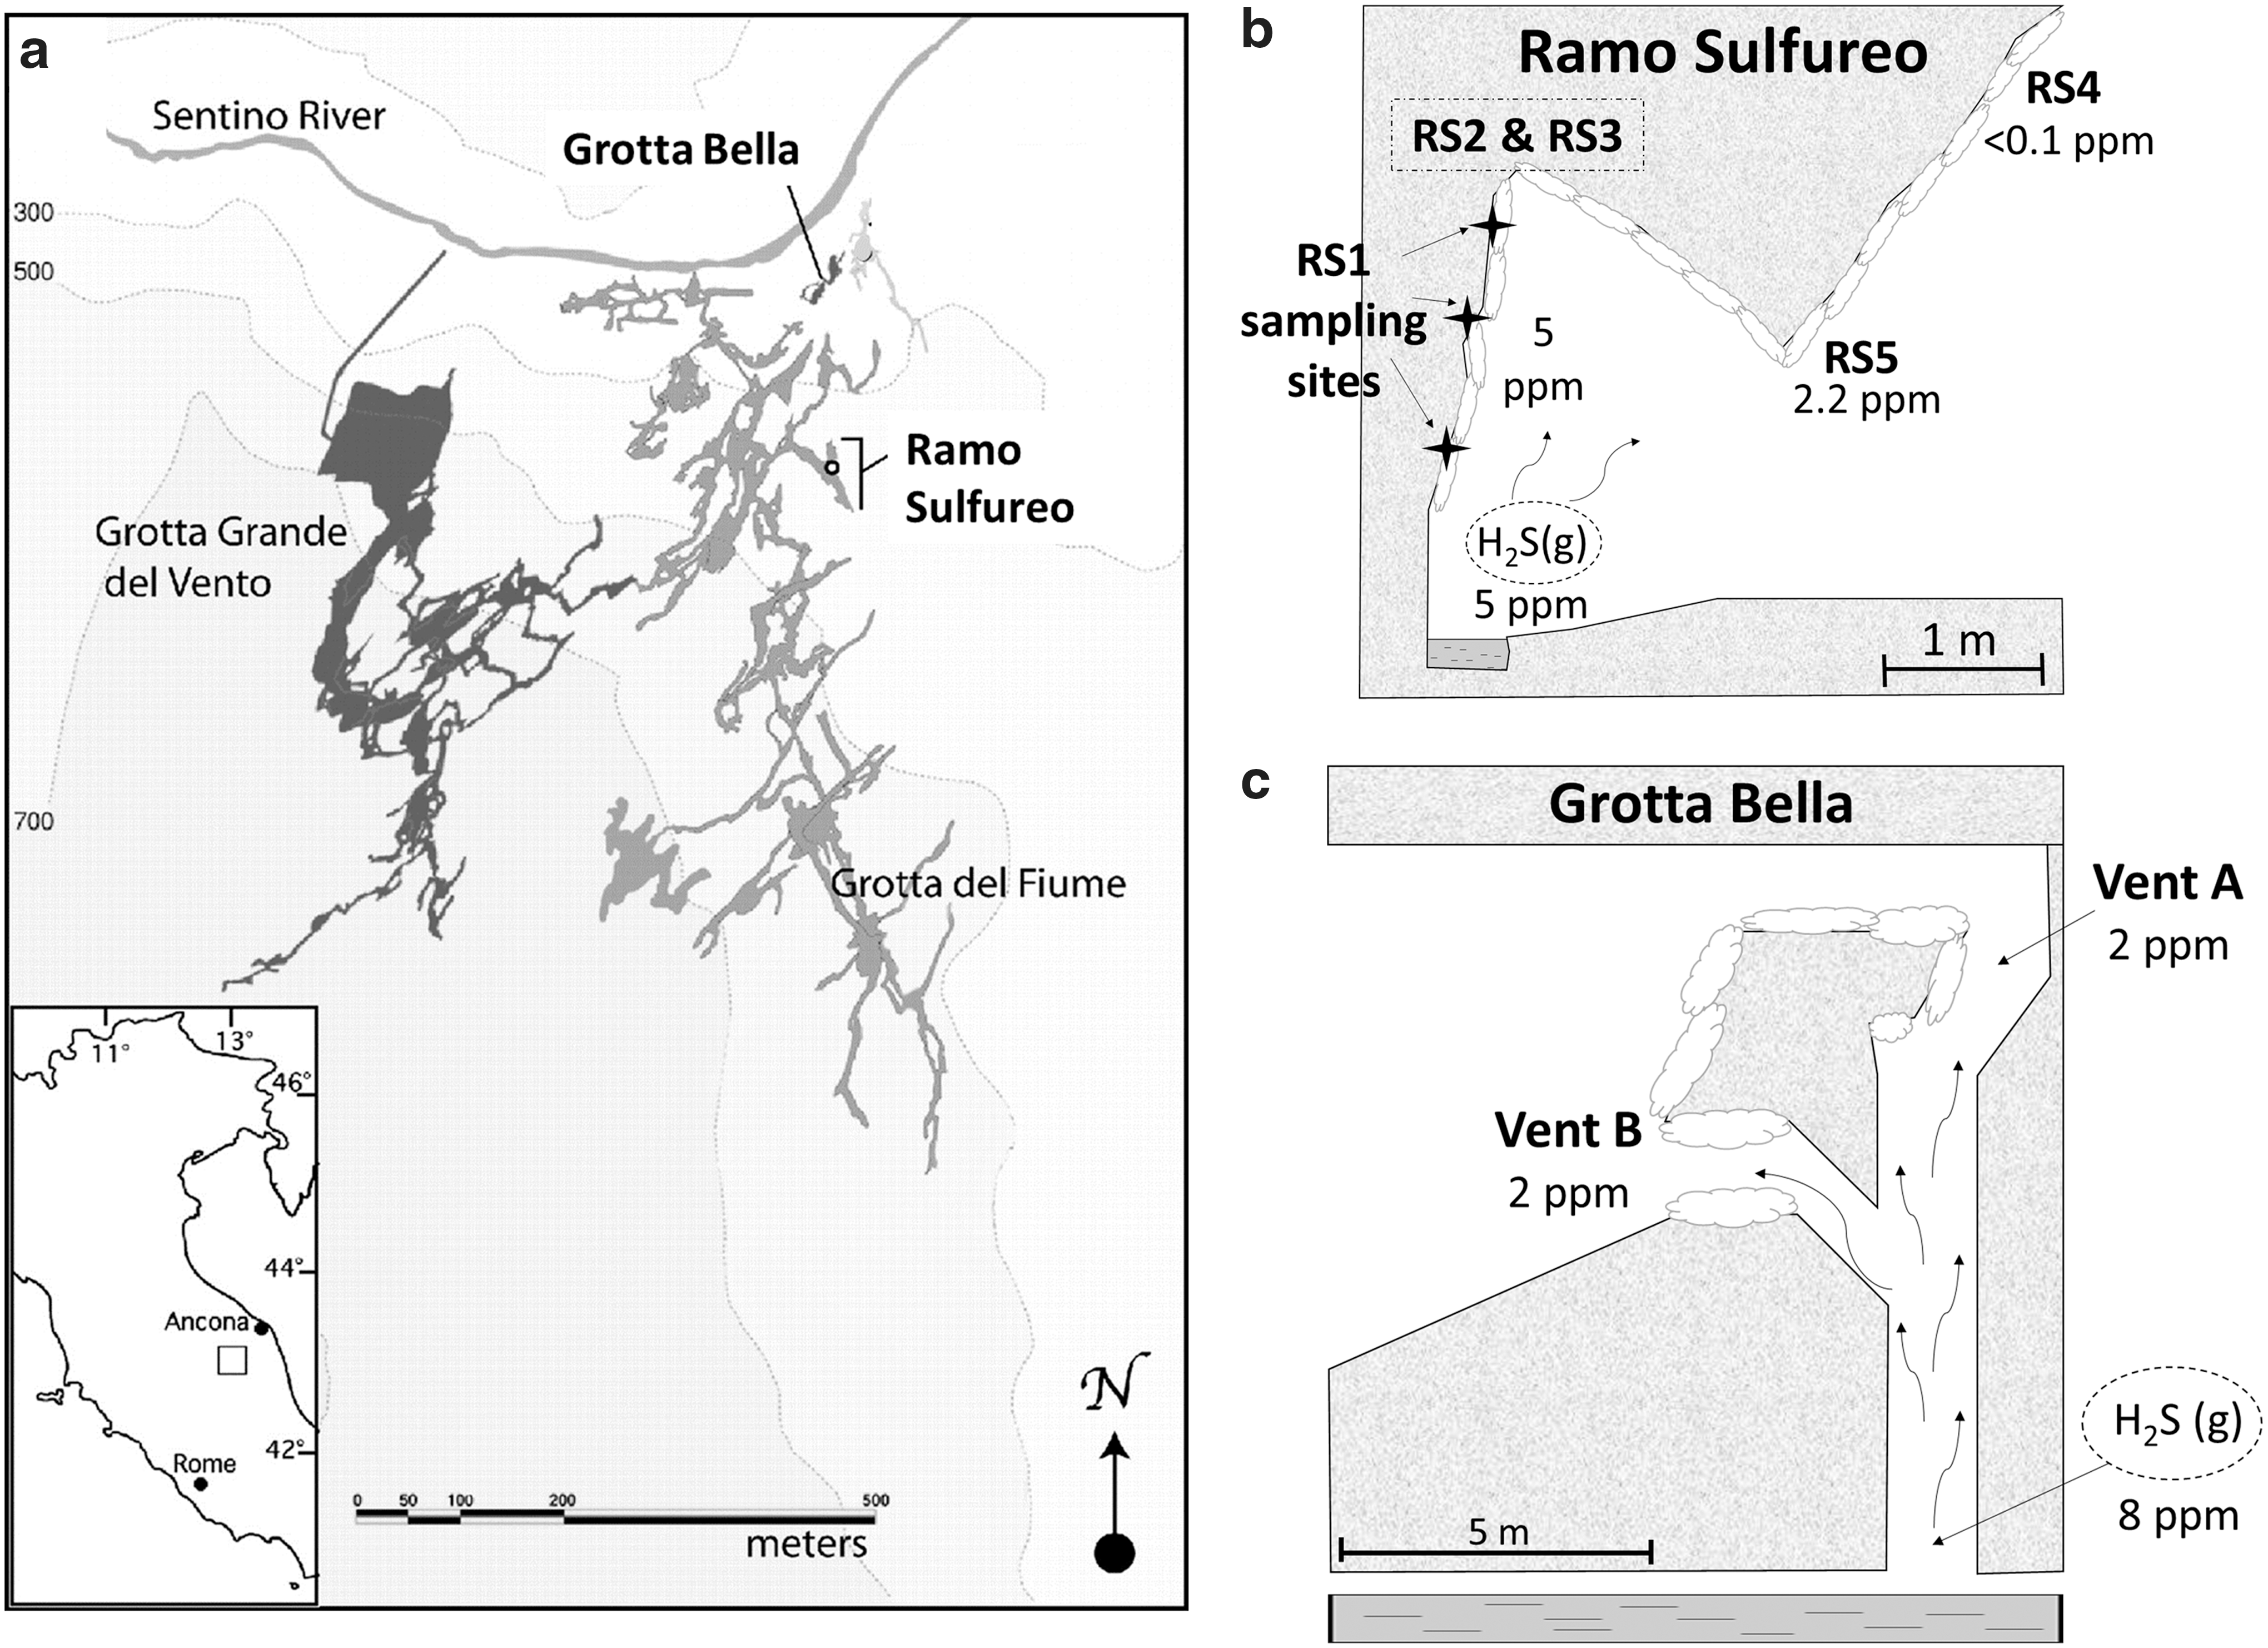
The Frasassi cave system in Italy (43.39 N, 12.96 E) is a large network of actively forming and older passages with an explored length of 25 km (Fig. 1a). Temperature fluctuations in the cave are small (13 ± 1°C), and humidity is constantly near 100%. A recent study suggests that subaerial H2S oxidation at Frasassi is more important for cave formation than subaqueous H2S oxidation (Jones et al., 2015). Limestone cave walls are actively dissolving, resulting in gypsum crusts along with small amounts of elemental sulfur (S(0)). Gypsum crystals display different textures, including a pasty mixture made up primarily of microcrystalline gypsum, dry wall crusts, and centimeter-sized euhedral needles (Galdenzi and Maruoka, 2003; Macalady et al., 2007; Harouaka et al., 2016). The gypsum deposits are often covered with acidic biofilms, including mucus-like “snottites” with pH <1.8 (Vlasceanu et al., 2000; Galdenzi and Maruoka, 2003; Macalady et al., 2007; Jones et al., 2008, 2011, 2014). Snottites are dominated by the aerobic S-oxidizing species of A. thiooxidans, as well as smaller populations of Acidimicrobium and relatives of the archaeon taxon G-plasma (Vlasceanu et al., 2000; Macalady et al., 2007; Jones et al., 2011, 2014). Snottite populations were shown to contain diverse forms of sulfide:quinone oxidoreductase (SQR) and sox genes implicated in sulfide oxidation (Jones et al., 2011, 2014).
(
Two cave rooms were sampled in this study: Ramo Sulfureo and Grotta Bella (Fig. 1b–1c). Sample locations are near the water table above H2S-degassing streams. In Grotta Bella, H2S(g) rises through several chimneys that begin at the water table approximately 8 m below. The H2S(g) concentration in the chimneys ranges between 3 and 8 ppmv (Jones, 2011). In comparison, H2S(g) concentrations at Ramo Sulfureo's sampling sites are higher, ranging from 3.4 to 25 ppmv and decreasing quickly away from the water table (Galdenzi and Maruoka, 2003; Macalady et al., 2007; Galdenzi et al., 2008; Jones et al., 2008, 2011, 2014). Sulfur dioxide gas was not detected at either site (Jones et al., 2011, 2014).
3. Materials and Methods
3.1. Field sampling
Gypsum and elemental sulfur deposits were collected with a clean spatula into acid-cleaned tubes prefilled with 90% isopropanol or 95% ethanol. Figure 1 shows sampling locations in Grotta Bella (GB) and Ramo Sulfureo (RS). In Grotta Bella, 21 samples were collected from areas within 2 m of H2S-degassing chimneys. In Ramo Sulfureo, over 50 total samples were collected. Five different locations in Ramo Sulfureo (named RS1 to RS5) located within 5 m of the water table were extensively sampled (Fig. 1b). Gypsum minerals were collected as a function of height from the water table (RS1) or morphology (RS2, RS3, and RS4). At location RS5, soft gypsum crust about 2.5 cm thick was subsectioned by layers into nine approximately equal portions and analyzed separately. Additionally, four gypsum samples associated with visible, yellowish elemental sulfur deposits were collected from sites RS05 and RS07. At all collection sites, the pH of damp gypsum crusts or limestone walls was measured with pH strips.
H2S(g) and SO2(g) concentrations were measured with either a PGD2 portable gas detector (ENMET Corp., Ann Arbor, MI, USA), Draeger diffusion tubes (part # 6733091; 2.5 h equilibration time), or Draeger pump tubes (part # 6728041; Sugarland, TX, USA). Error in gas measurements is estimated to be up to 25%. At Grotta Bella, H2S(g) was collected for isotopic analysis by using a 1 L gas syringe with a gas-tight valve connected to Tygon tubing. The air sample was directly pumped into 100 mL of 20% zinc acetate solution until the solution became cloudy, indicating the precipitation of zinc sulfide. The precipitates were pelleted by centrifugation at 6000g for 15 min. The supernatants were removed, and the pellets were converted to Ag2S by the addition of 1 mL 10% AgNO3. Precipitated Ag2S particles were then pelleted by centrifugation as above, and the supernatants were removed.
3.2. Laboratory analysis: Gypsum and elemental sulfur
Quantitative analysis of gypsum crystal morphology was achieved by measuring aspect ratios (length/width of a crystal) by imaging via a dissecting microscope (for large gypsum needles) or scanning electron microscopy equipped with an energy dispersive spectroscopy (EDS) detector (FEI Quanta 200 ESEM). For microcrystalline gypsum and coarse-grained (wall crust) samples, aspect ratios of over 50 individual crystals were averaged to obtain the bulk aspect ratio of the sample, with typical 1 SD of <1.8. Aspect ratios of gypsum needles were averaged from varying numbers of crystals due to sample limitation, ranging from one (single crystal) to 50.
Organic carbon contents were measured on a C/S analyzer (LECO Corporation, MI, USA). Gypsum samples were dried at 60°C and powdered before being weighed into the instrument. Samples containing observable calcite under scanning electron microscope were excluded from measurements. Blank tests on laboratory grade CaSO4 (Alfa Aesar) were performed to check for carbon contamination from ethanol or isopropanol used during sampling. Untreated and ethanol-treated laboratory CaSO4 yielded organic carbon values within measurement error of ±0.04 wt %.
For S isotopic analyses, gypsum samples from Grotta Bella were briefly vortexed and sonicated in isopropanol for 10 min. Samples were then centrifuged at 4000g for 10 min. A dark brown substance, likely composed of organic materials and clay particles, separated out into the solution or settled at the top of the gypsum pellet. This substance was removed by pipetting. The samples were centrifuged and pipetted from the top repeatedly until the dark substance was no longer visible and only pure gypsum remained.
Gypsum samples from Ramo Sulfureo were powdered and dissolved overnight in 5 mL 5 N HCl with continuous shaking. Residual solids were pelleted at 6000g for 20 min. Supernatants containing dissolved sulfate were transferred to clean tubes and precipitated as BaSO4 by the addition of 1 mL 1 M BaCl2 solution. Precipitated BaSO4 was pelleted by centrifugation at 6000g for 20 min. The supernatant was removed, and the remaining BaSO4 was washed twice with H2O.
Elemental sulfur particles were separated from gypsum by repeated dissolution of gypsum in 5 N HCl. The samples were then extensively washed in water by repeated centrifugation. Brown residues that settled to the top of the yellow elemental sulfur layer were removed by resuspension and pipetting until only pure elemental sulfur remained (confirmed by measuring sulfur weight percent via the C/S analyzer).
3.3. Experimental determination of isotopic fractionation
Three laboratory experiments were conducted to determine fractionation during (1) microbial S(0) oxidation to sulfate and (2) gypsum precipitation at acidic pH. In the first experiment, triplicate cultures of A. thiooxidans strain GB30-2c, isolated from gypsum crust in the Grotta Bella cave room (Jones et al., 2016), were grown on a shaker table at room temperature in defined mineral medium containing 3 g/L KH2PO4, 0.4 g/L MgCl2·6H2O, 0.25 g/L CaCl2·2H2O, 0.08 g/L NH4Cl, and supplemented with 10g/L S(0). Elemental sulfur was pre-sterilized by autoclaving at 100°C for 30 min on 3 consecutive days. Initial pH of the medium was 4.2. Sampling and analyses were performed weekly for 3 weeks. Cell concentrations were counted with a hemacytometer, pH values were determined with pH strips, and sulfate concentrations were determined by anion chromatography (Dionex ICS-2500) on 0.2 μm filtered samples. For isotopic analysis, sulfate was precipitated as BaSO4 by the addition of BaCl2, which was then centrifuged and washed repeatedly with MQ water as described above to >95% purity. Initial and final S(0) particles were pelleted by centrifugation at 8000g for 20 min. After removal of the supernatant, S(0) was treated with 12.5 mg/mL lysozyme and 1% sodium dodecyl sulfate (SDS) to remove cell materials (Bosshard et al., 2000; Zerkle et al., 2009). The treated S(0) was pelleted as before and washed at least three times with MQ water to remove any traces of SDS.
In the second experiment, gypsum was precipitated abiotically at pH 5.5. Experimental procedures and detailed geochemical data for this experiment were described previously (Harouaka et al., 2014). Briefly, CaCl2·2H2O and Na2SO4 stock solutions were mixed together in a batch reactor to precipitate gypsum over a range of saturation states. Gypsum was allowed to precipitate until dissolved Ca concentrations reached a stable value as monitored by analysis of solution aliquots via inductively coupled plasma–atomic emission spectroscopy. The crystals were collected after filtration through a 0.45 μm PVDF filter paper. In the third experiment, gypsum was precipitated in a mineral medium containing S(0) (final pH 1.3–1.6) and 50 mM Ca either in the presence or absence of A. thiooxidans (Series 1 experiments; Harouaka et al., 2016). In these second and third experiments, the S isotopic compositions of the final dissolved sulfate (precipitated as BaSO4) and gypsum were analyzed.
3.4. Measurements of S isotopic compositions (δ 34S) and isotopic notations
Sulfur isotopic analyses of air-dried and powdered Ag2S, CaSO4, BaSO4, and S(0) were conducted via elemental analysis–isotopic ratio mass spectrometry either at the Carnegie Institution of Washington, Pennsylvania State University, or the SIRFER facility at the University of Utah. About 0.05–1 mg of powdered samples was placed into tin tubes, mixed with excess V2O5, and combusted at 1000–1200°C to produce SO2, which was then measured by the spectrometer. All isotope measurements are expressed in delta notation (δ34S; Eq. 2) relative to Vienna Canyon Diablo Troilite (V-CDT) isotopic standard:
Isotopic standards were used to construct calibration curves for linear and two-point corrections. International standards used were NBS-127, NBS-123, IAEA-S-1, and IAEA-S-3 with δ34S values of +20.3, +17.1, −0.3, and −32.3‰, respectively (IAEA, 1995). In-house standards include lab-prepared GFS barite (δ34S = −3.2‰, Watanabe et al., 2009), methionine (δ34S = −6.2‰), and natural barite from the Fig Tree group, Barberton, South Africa (δ34S = +4.1‰). External reproducibility was < ±0.5‰ (1 SD) for all samples, as determined by the analysis of standards and replicate samples over multiple analytical sessions.
We denote the intrinsic fractionation factor associated with a process using alpha (α) notation, where the subscripts P and R stand for product and reactant, respectively:
In systems where α is not known, or isotopic expression is the result of multiple processes as is typical for natural systems, the apparent isotopic fractionation between two phases can instead be written in terms of the capital delta (Δ) notation, where the subscripts a and b represent distinct phases:
4. Results
4.1. Field data
Description and analytical results for all samples are presented in Table 2. The pH values of all gypsum crusts were <2.5. Concentrations of H2S(g) ranged between 1.5 and 5 ppmv, with the exception of site 4 in the Ramo Sulfureo cave room (RS4) where H2S(g) was below the detection limit (<0.1 ppmv). Sulfur dioxide gas was never detected (<0.1 ppmv). At Grotta Bella, the concentration of H2S(g) in the chimney was 8 ppmv just above the water table and was constant, within error, to 7.8 m above the water table. At the top of the chimney (vent A), 8 m above the water table, H2S(g) concentration was 2 ppmv. Measured δ34S values of H2S(g) at vent A and just above the water table were −16.5 and −11‰, respectively. At vent B in Grotta Bella, the H2S(g) concentration was 2 ppmv with a δ34S value of −10.2‰.
4.2. Grain morphology
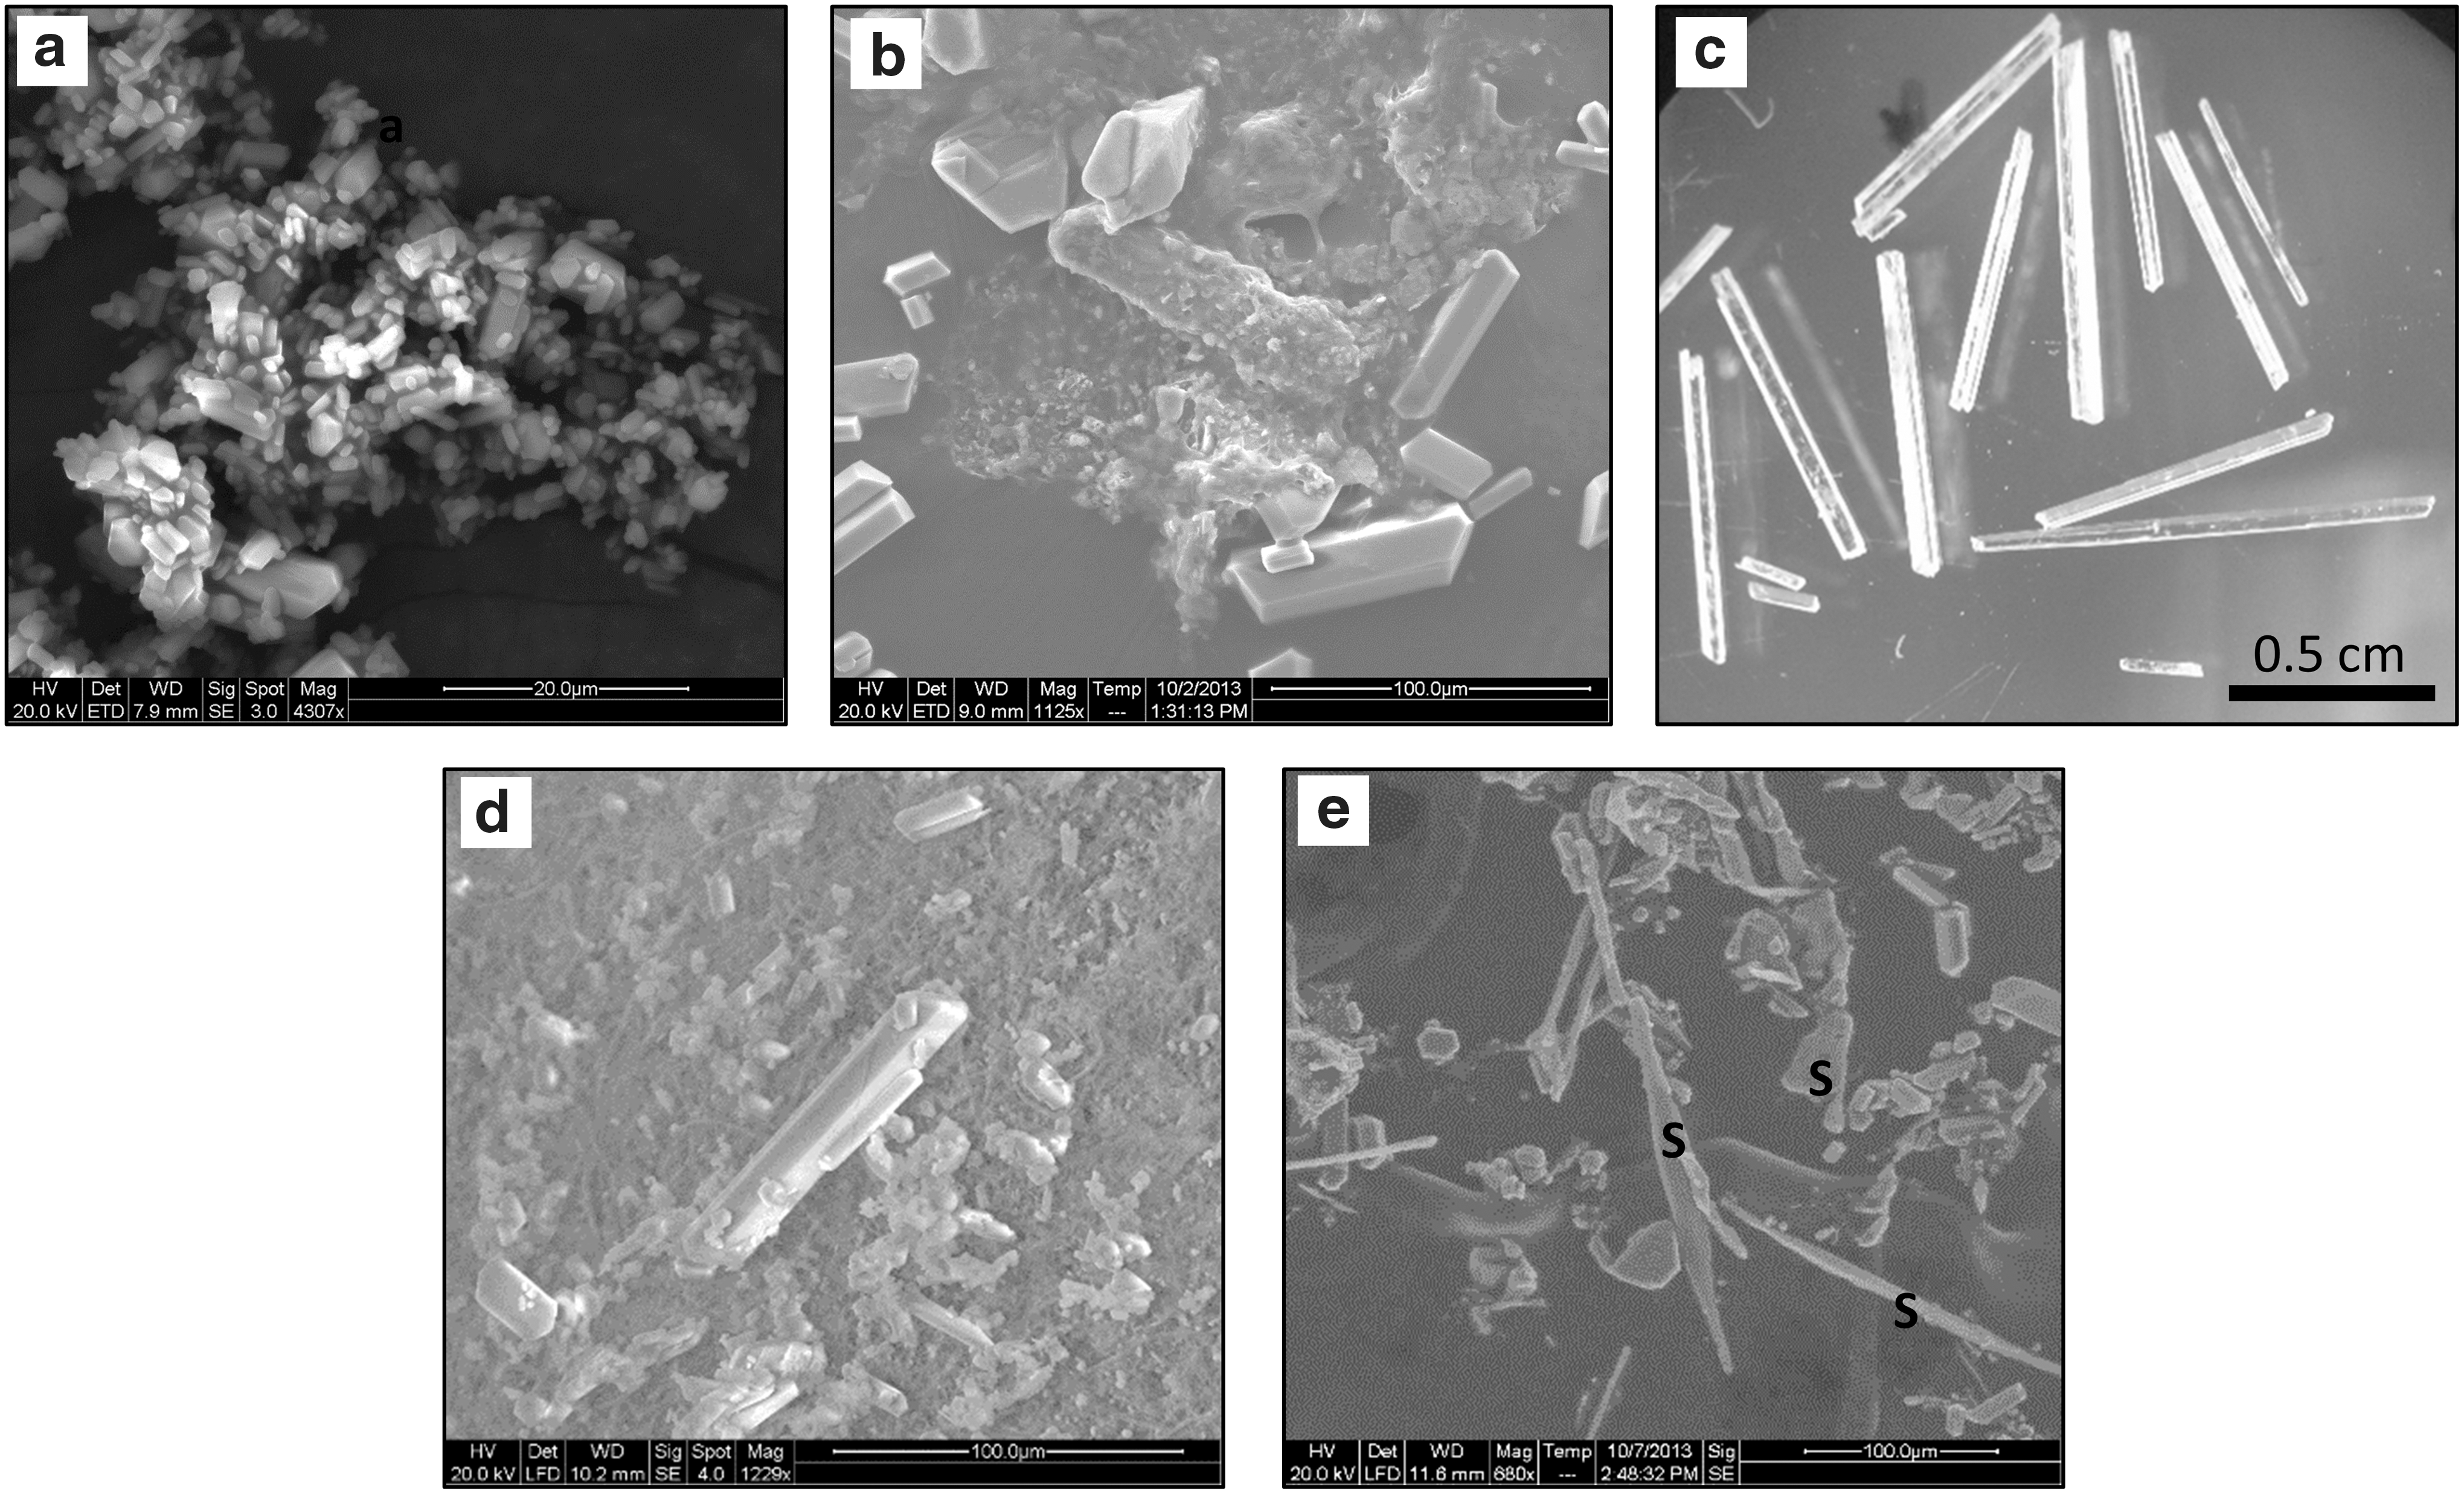
Variants of gypsum morphologies were observed through the naked eye as well as by microscopy, which can be classified into soft microcrystalline gypsum aggregates, coarser-grained wall crusts, small needles, and large needles. Microcrystalline gypsum aggregates are the most prevalent form of gypsum in the cave and are composed of <30 μm long crystals (Fig. 2a). Wall crust gypsum tends to show larger variations in terms of crystal sizes, ranging from 10 to 2000 μm long crystals (Fig. 2b). Needles are common but less prevalent than microcrystalline gypsum and wall crusts. At Ramo Sulfureo, small needles between 0.1 and 1 cm long (Fig. 2c) are found near the water table, often in association with snottite biofilms.
(
Scanning electron microscopy observations of snottite surfaces revealed gypsum minerals embedded within a biofilm matrix (Fig. 2d). Elemental sulfur particles (Fig. 2e) and amorphous organic matter were found in association with some gypsum samples. Aspect ratios for all gypsum crystals ranged between 1.8 and 22.7 (Table 2). We classified the gypsum minerals into two main types based on aspect ratios: microgypsum (including wall crusts; aspect ratios between 1.8 and 4.4) and needles (aspect ratios between 7 and 23).
4.3. Sulfur isotopic compositions of gypsum and elemental sulfur
The δ34S of microgypsum, needles, and elemental sulfur ranged from −15 to −24‰, −12 to −19‰, and −17 to −19‰, respectively (Fig. 3; Table 2). Gypsum samples collected within 10 cm of one another showed δ34S variations of up to 8.5‰, with microgypsum typically showing lower values relative to needles (Fig. 4). Physically separated microgypsum around needles also had lower δ34S values (−19.2 ± 0.3‰) relative to the needles (−17.0 ± 0.1‰) (site RS2, n = 2). Elemental sulfur particles were isotopically similar to associated gypsum, ranging from being 0.2‰ higher to 2.2‰ lower (site RS05 and RS07, n = 4).
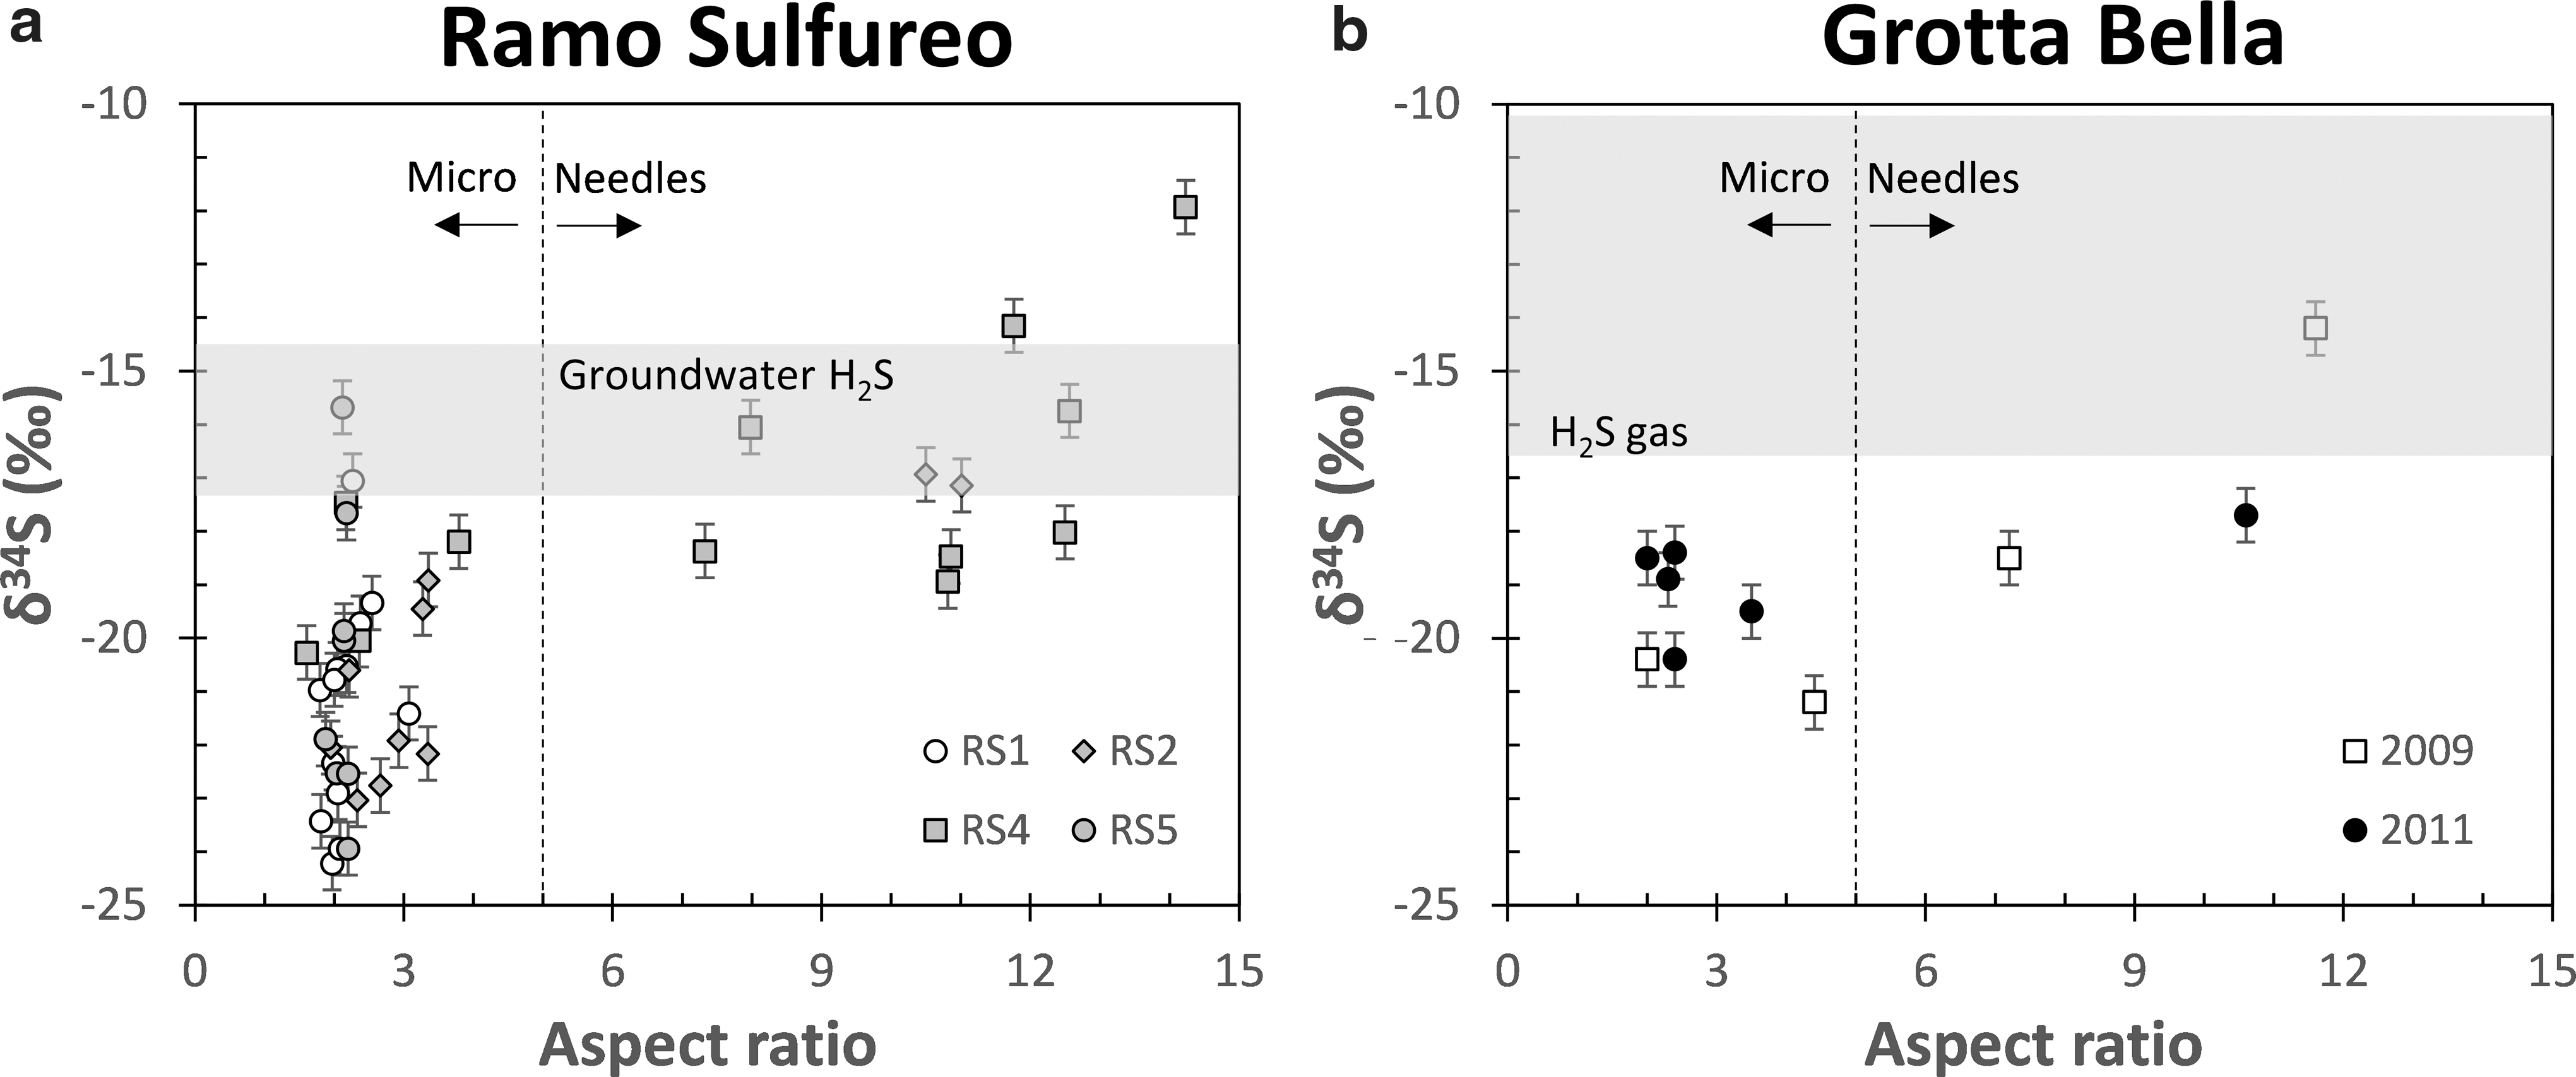
Gypsum δ34S values as a function of crystal aspect ratios at (

Δ34S values of gypsum relative to the maximum gypsum δ34S value at each site. At sites where needles (♦) and microgypsum (○; including wall crusts) co-occur, microgypsum crystals are isotopically depleted relative to needles. Maximum range in δ34S values of gypsum at each site is about 8.5‰. Data for samples LL, RS G27-26, RS G14-13, and Triponzo are from Galdenzi and Maruoka (2003).
At site RS5 where gypsum was sampled by depth, δ34S values ranged between −15.7 and −23.9‰ with no systematic variation with distance from the limestone cave wall. Interestingly, δ34S values decreased with height at site RS1, with average values of −19.5 ± 1.4, −21.0 ± 1.0, and −23.6 ± 0.5‰ at 1.2, 2.0, and 2.6 m height from the water table, respectively (Fig. 5).
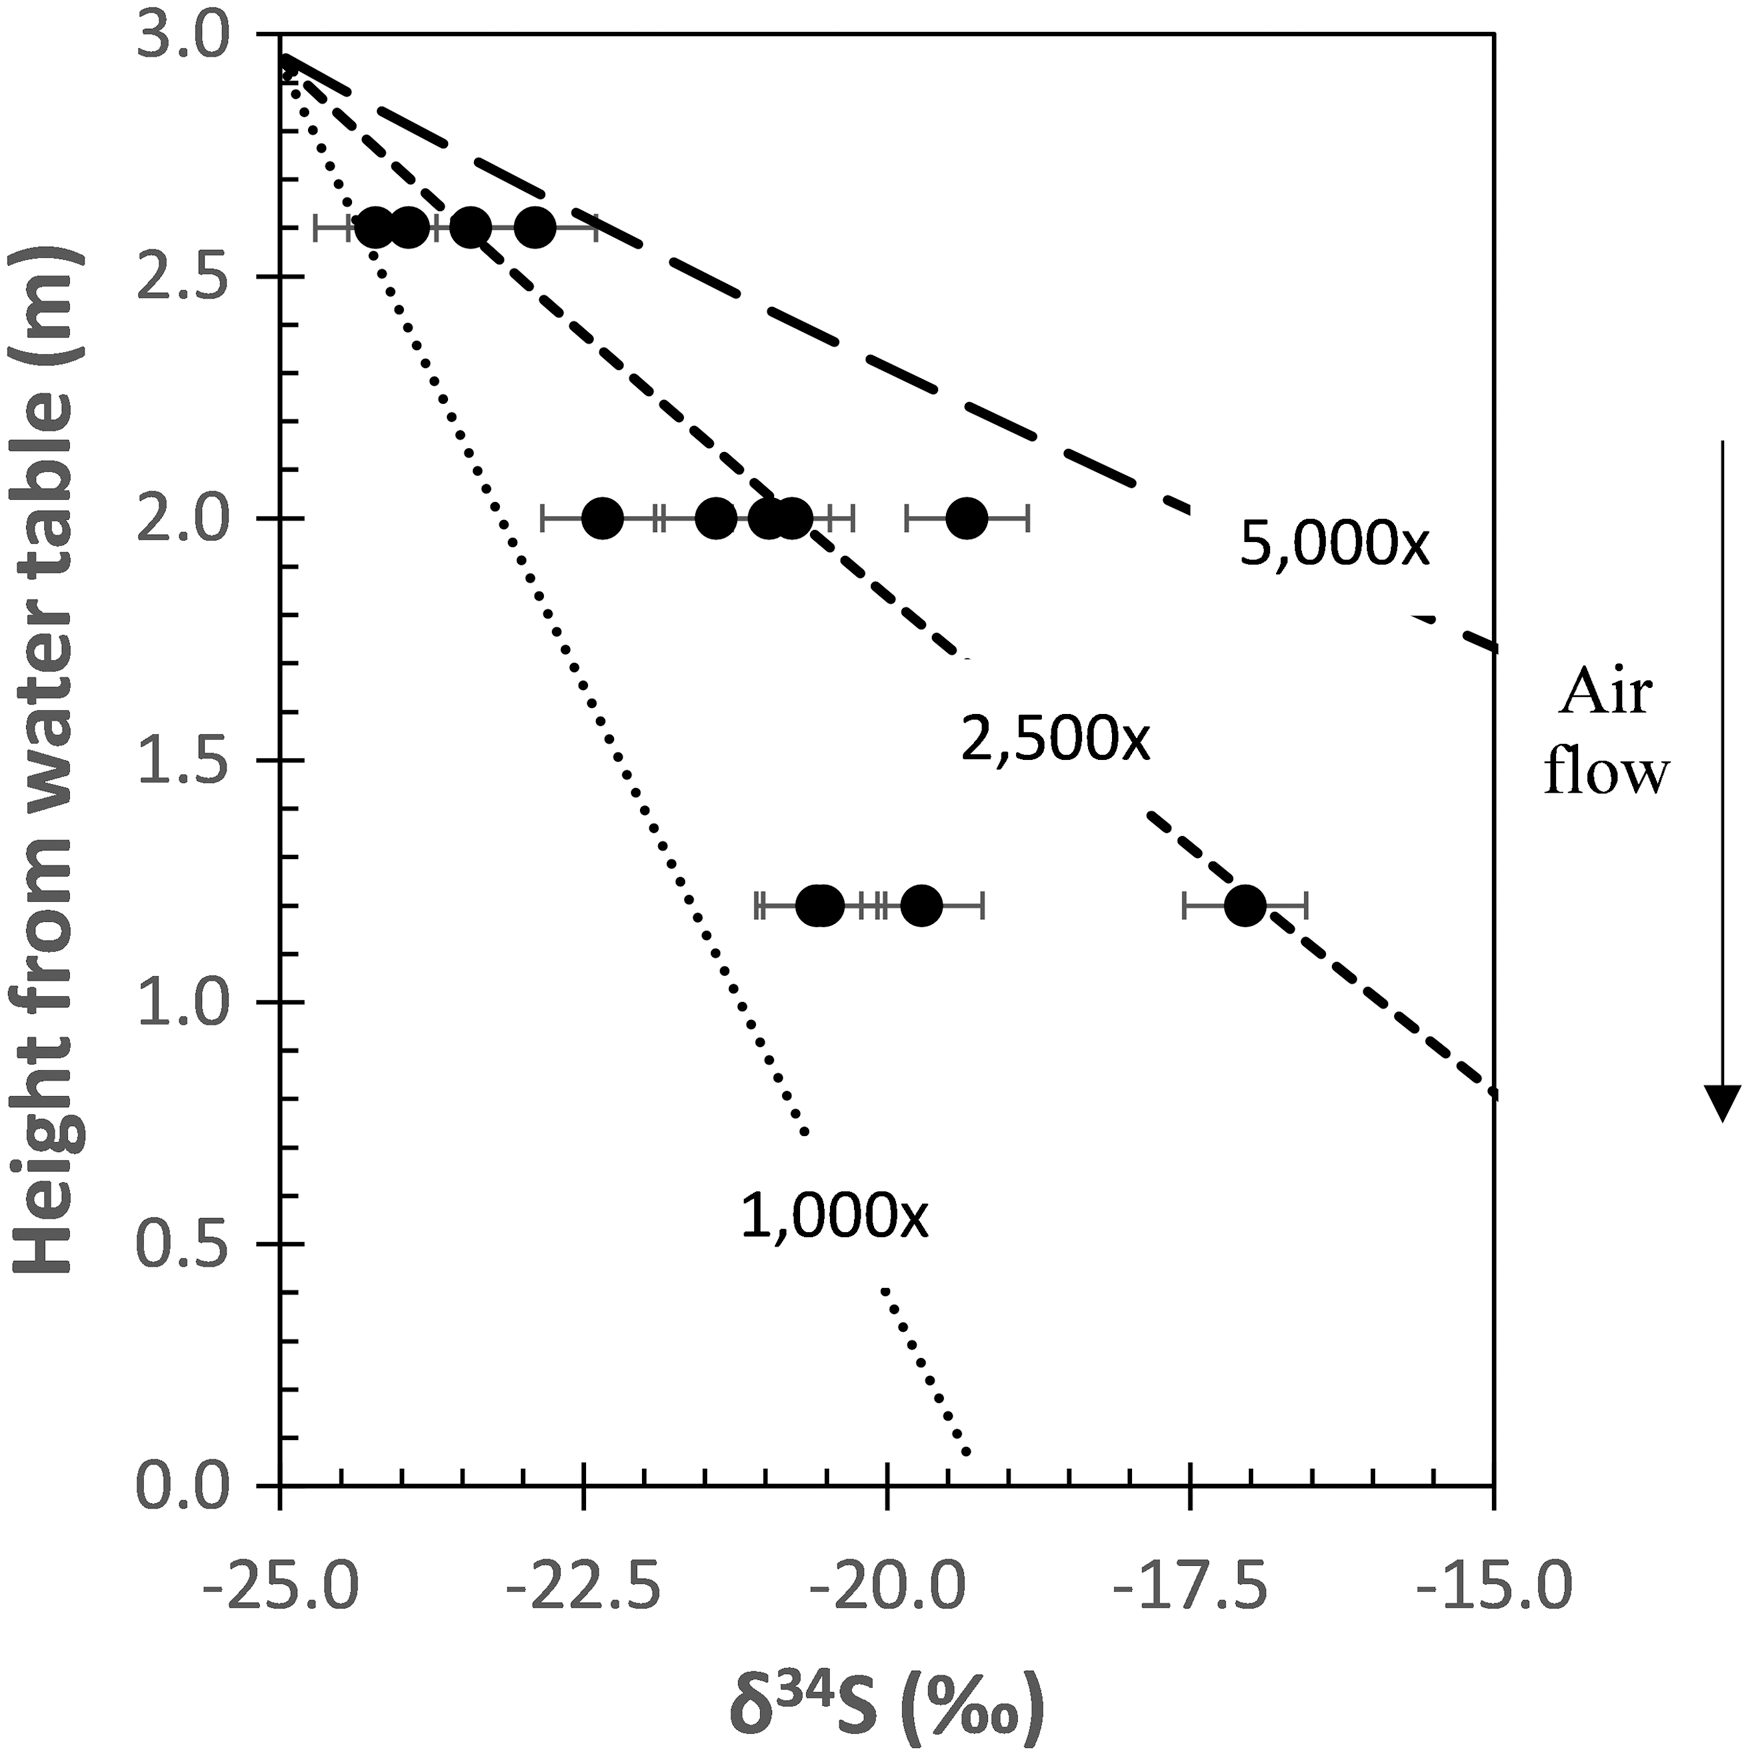
Variations of gypsum δ34S (black circles) as a function of height at location RS1. The two parameters are strongly correlated, with R 2 = 0.67. Different dashed lines denote sulfate δ34S as a function of height based on 1D modeling results using different oxidation rates (relative to abiotic oxidation rate) with αoxi = 0.992. H2S(g) source at the top is assumed to have a δ34S value of −17‰, which is similar to the minimum groundwater H2S δ34S at Ramo Sulfureo. H2S oxidation rate is constrained to be between 1000 and 5000 × faster relative to abiotic rate, indicating the spatial pattern is a type of biosignature for S-oxidizing microbes.
4.4. Experimental results
During growth on elemental sulfur, A. thiooxidans produces sulfuric acid as the sole product. Cell density increased from 1 · 106 to 2.5 · 108 cells/mL over 3 weeks, with a concurrent increase in dissolved sulfate (up to 60 mM) and decrease in pH from 4.2 to 1.3. Abiotic controls did not show any sulfate production. The δ34S of sulfate and elemental sulfur in the cultures at the end of the incubation were within ±0.5‰ relative to initial elemental sulfur (Supplementary Table S1; Supplementary Materials are available at
Gypsum crystals precipitated abiotically at pH 5.5 were 0.2‰ lower to 1.7‰ heavier relative to dissolved sulfate. Similarly, gypsum precipitated in the presence or absence of A. thiooxidans at pH 1.6 were between 0.1 and 1.2‰ heavier relative to dissolved sulfate. On average, the fractionation associated with gypsum precipitation is approximately +1‰.
5. Discussion
5.1. Comparison of isotopic effects due to microbial and abiotic H2S oxidation at centimeter sampling scale
With the aim of evaluating the utility of gypsum δ34S as biosignatures, it is crucial that we constrain the observed isotopic fractionation from active microbial H2S oxidation in the caves and compare it to the fractionation expected solely from abiotic oxidation. Sulfate (in the form of gypsum) is the major end product of H2S oxidation, with elemental sulfur being present only on small sections of the cave wall. Other products of H2S oxidation such as thiosulfate and sulfite are expected to be minor or rapidly converted to sulfate under acidic conditions (Davis, 1958; Zhang and Millero, 1991; Kamyshny et al., 2014) characteristic of the cave wall (pH <2.5). Thus, direct microbial H2S oxidation to sulfate is likely the major pathway for sulfate production in this system.
In Frasassi, gypsum δ34S varies from 4‰ higher to 9‰ lower relative to either H2S in the groundwater or H2S gas in the air (Fig. 3). This isotopic variation most likely reflects the combined effects of variation in δ34S values of the H2S source, microbial H2S oxidation, and distillation effects as the H2S source becomes depleted. In comparison, microbial oxidation of elemental sulfur to sulfate and subsequent gypsum precipitation will produce negligible isotopic fractionation, as suggested by laboratory experiments and field data from gypsum associated with elemental sulfur (site RS05 and RS07).
In terms of the H2S source, long-term δ34S monitoring of groundwater sulfide in Ramo Sulfureo (Zerkle et al., 2016) coupled to consideration of fractionation during sulfide speciation (H2S and HS-) and volatilization/solubilization processes suggest a maximum variability of 3‰ to be imparted to gypsum δ34S (Supplementary Discussion). Intriguingly, we found a 6‰ variation for H2S gas sampled on the same day from various locations within Grotta Bella. This range cannot be explained by the aforementioned processes and is most likely caused by distillation effects during oxidation, as suggested by large H2S(g) concentration differences within cave rooms (Fig. 1). Thus, we cannot assume a homogenous δ34S value for H2S gas that reaches microbial communities located on different parts of the cave wall. Upon oxidation, laboratory studies with A. thiooxidans suggest that the produced sulfate will have δ34S values that are 6–18‰ lower relative to H2S (Kaplan and Rafter, 1958; Kaplan and Rittenberg, 1964). The large isotopic effects are, however, measured when sulfate is the minor reaction product, have never been reproduced, and therefore may not apply to the cave system.
To circumvent these uncertainties, we therefore attempt to directly determine the apparent isotopic fractionation (Δ34SSO4- H2S) due to microbial H2S oxidation in the cave system by comparing the isotopic range of gypsum collected within small areas (<10 cm apart) of the cave walls. Up to 8.5‰ variations in gypsum δ34S were observed, with needles having higher values compared to microgypsum by 2‰ on average (Fig. 4). We interpret these differences to reflect varying rates and extent of H2S oxidation on needles relative to microgypsum (Galdenzi and Maruoka, 2003). The highest oxidation rate is expected around needles covered with dense microbial biofilms (snottites) in comparison to sparser populations around microgypsum crusts (Hose and Macalady, 2006; Macalady et al., 2007; Jones et al., 2011). Assuming control of δ34S by distillation effects, the δ34S of gypsum needles should be most similar to the original δ34S of the H2S source due to mass balance consideration. Our data then suggest that the apparent isotopic fractionation during microbial H2S oxidation to sulfate (either directly or through elemental sulfur intermediate) varies from 0 to −8.5‰, and up to −9.5‰ if the +1‰ fractionation during gypsum precipitation is considered. The apparent fractionation determined for microbial oxidation in the cave system (Δ34SSO4-H2S = 0 to −8.5‰) is at the more positive end of those determined from the 1960s experiments for A. thiooxidans (−6 to −18‰; Kaplan and Rafter, 1958; Kaplan and Rittenberg, 1964) and overlaps with results from culture experiments using anaerobic, chemotrophic microbes (−1.3 to −4.3; Poser et al., 2014) that utilized similar H2S oxidation pathways as A. thiooxidans (Jones et al., 2011, 2014).
More importantly, we can compare the measured gypsum δ34S to values expected from abiotic H2S oxidation. Through abiotic oxidation experiments, Fry et al. (1988) showed that sulfate is expected to be on average 5‰ lower relative to the H2S source, as calculated from isotopic mass balance using the measured δ34S of residual H2S. Multiple reaction products were also formed in the aforementioned experiments with distinct isotopic compositions. Thus, applying the experimentally determined fractionation to natural systems is difficult without knowing the proportion of reaction products. We therefore assume that sulfate will be the dominant product of abiotic H2S oxidation in the cave system and that the average isotopic effect of −5‰ is representative of this reaction. With these assumptions, the measured gypsum δ34S values are quite similar to those expected from abiotic H2S oxidation (range of −1.8 to −7.3‰; mean = −5‰). Overall, the δ34S values of actively forming gypsum at the centimeter scale cannot be used to distinguish between biological and abiotic H2S oxidation with confidence and are ambiguous as biosignatures.
5.2. Impact of transport processes on the isotopic expression of microbial H2S oxidation at the cave room scale
In Frasassi, the ∼13‰ variation in gypsum δ34S cannot be fully explained by microbial H2S oxidation and δ34S variation in groundwater sulfide. Additional processes, potentially related to isotopic fractionation of H2S in the gas phase, are required to explain the isotopic variation. Interestingly, the δ34S values of microgypsum and H2S(g) exhibit 5–6‰ variations with height above the water table (Fig. 5). Thus, we hypothesize that variations in isotopic values of gypsum at the cave room scale may be primarily a function of H2S(g) transport in tandem with isotopic distillation during microbial oxidation.
Convection and diffusion are two possible transport processes for H2S(g) in a cave system. Isotopic effects on H2S(g) will depend on which is dominant, as diffusion can fractionate while convection does not (Chanton, 2005). In the cave, gas convection is expected to dominate over diffusion due to temperature-driven air currents (see Supplementary Discussion). To visualize these air currents, we utilize Energy2D, a visual simulator that couples physical equations of heat transfer with fluid dynamics (Supplementary Materials; Xie, 2012). The simulations show that even with small temperature differences observed in Frasassi (<1°C), air convection is significant at the scale of a cave room. In Ramo Sulfureo, stable convection cells on the order of 3 m in diameter developed in the model simulations (Fig. 6). Passive tracers in Energy 2D simulations suggest that H2S(g) molecules released from the stream will concentrate mainly in the first convection cell above the stream surface. This is consistent with our data, which show a constant concentration of H2S(g) near the stream (∼5 ppm) that decreases significantly over ∼4 m to <0.1 ppm in Ramo Sulfureo. In contrast, the Grotta Bella cave room has a different geometry, which results in substantially different gas flow patterns. Temperature gradients between the bottom water and wall ceiling result in convection that is driven vertically upward through narrow chimneys in Grotta Bella. Thus, gas flow pattern is expected to differ considerably among different cave rooms due to geometrical variations and temperature gradients.
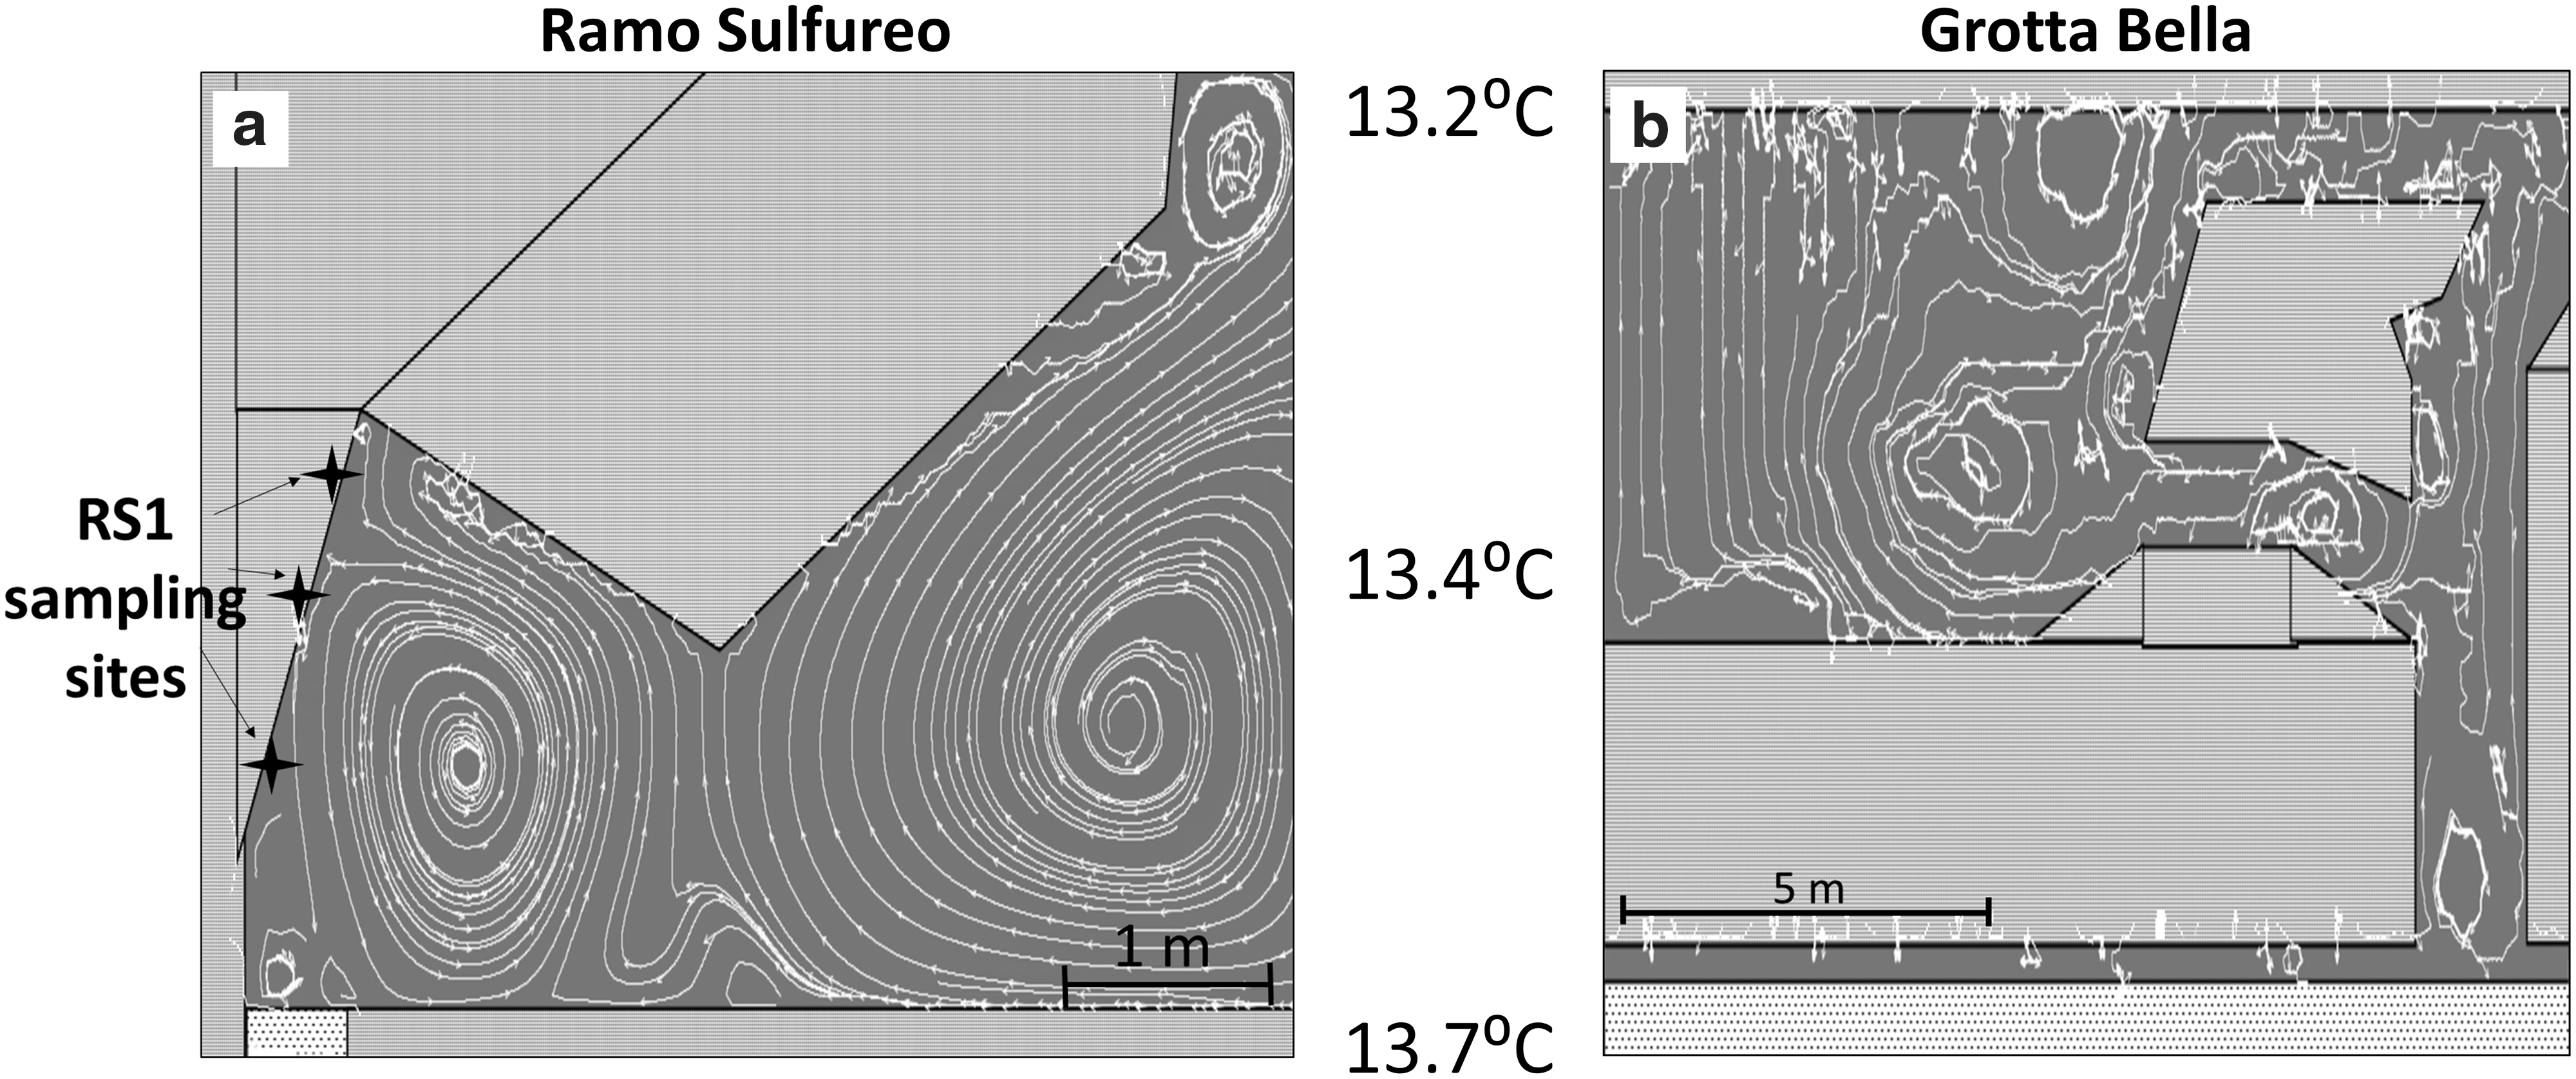
Snapshots of Energy 2D simulations showing air flow patterns at (
Since convection controls H2S(g) transport in the cave system, the transport process itself does not have an effect on the isotopic composition of H2S(g). Thus, chemical reactions between circulating H2S gas and water films on the cave walls are likely the primary influence on the isotopic variability in gypsum. Specifically, we hypothesize that (1) isotopic exchange between H2S(g) and aqueous H2S in water films (H2S(aq)) and/or (2) subsequent oxidation of aqueous H2S to sulfate may lead to the expression of isotopic distillation effects at meter-length scales. At equilibrium, the δ34S of H2S(aq) will be 1‰ higher than H2S(g) at 13°C (Czarnacki and Hałas, 2012 and references therein), which will leave the convecting H2S(g) isotopically lighter. Meanwhile, the oxidation of H2S to sulfate can generate isotopically light sulfate (αoxi = 0.995 assumed for abiotic oxidation, Fry et al., 1988; αoxi = 0.992 assumed for microbial oxidation based on gypsum δ34S variation at the centimeter scale), which will leave the residual H2S(aq) and H2S(g) isotopically heavy. To evaluate the extent to which these reactions can influence δ34S of cave gypsum, we constructed a 1D model in CrunchTope (Steefel et al., 2014) that simulates a 3 m air column in continuous contact with a cave wall that is saturated with water. In the model space, H2S(g) is supplied continuously from one boundary through convection, allowed to exchange with water films and be oxidized in solution to sulfate, with fractionation factors assigned to each process. Details of the model are provided in the Supplementary Materials.
Interestingly, the model simulations suggest that considerable gradients in sulfate δ34S occur over meter-scale distances through both gas-water exchange and H2S oxidation. Gas-water exchange imparts transient gradients that disappear on timescales of minutes (Supplementary Fig. S3). Because gypsum formation likely occurs over timescales of weeks to months (Galdenzi and Maruoka, 2003; Jones et al., 2015; Harouaka et al., 2016), gas-water exchange is unlikely to be a primary control on gypsum δ34S. By comparison, H2S oxidation imparts isotopic gradients that persist at steady state. Depending on the values chosen for the fractionation factor and sulfide oxidation rates, the δ34S of sulfate (and, by extension, gypsum) can differ by as much as 15‰ over 3 m (Fig. 7). Because of the small volumes of water per unit area at the cave wall-atmosphere interface (width = 0.01 cm; Dreybrodt et al., 2005) and the resulting mass balance of H2S between gas and aqueous phases, local concentration gradients in the atmosphere (within ∼0.5 cm of the interface) are sufficient to generate sizable isotopic effects discernible by meter-scale sampling of gypsum.
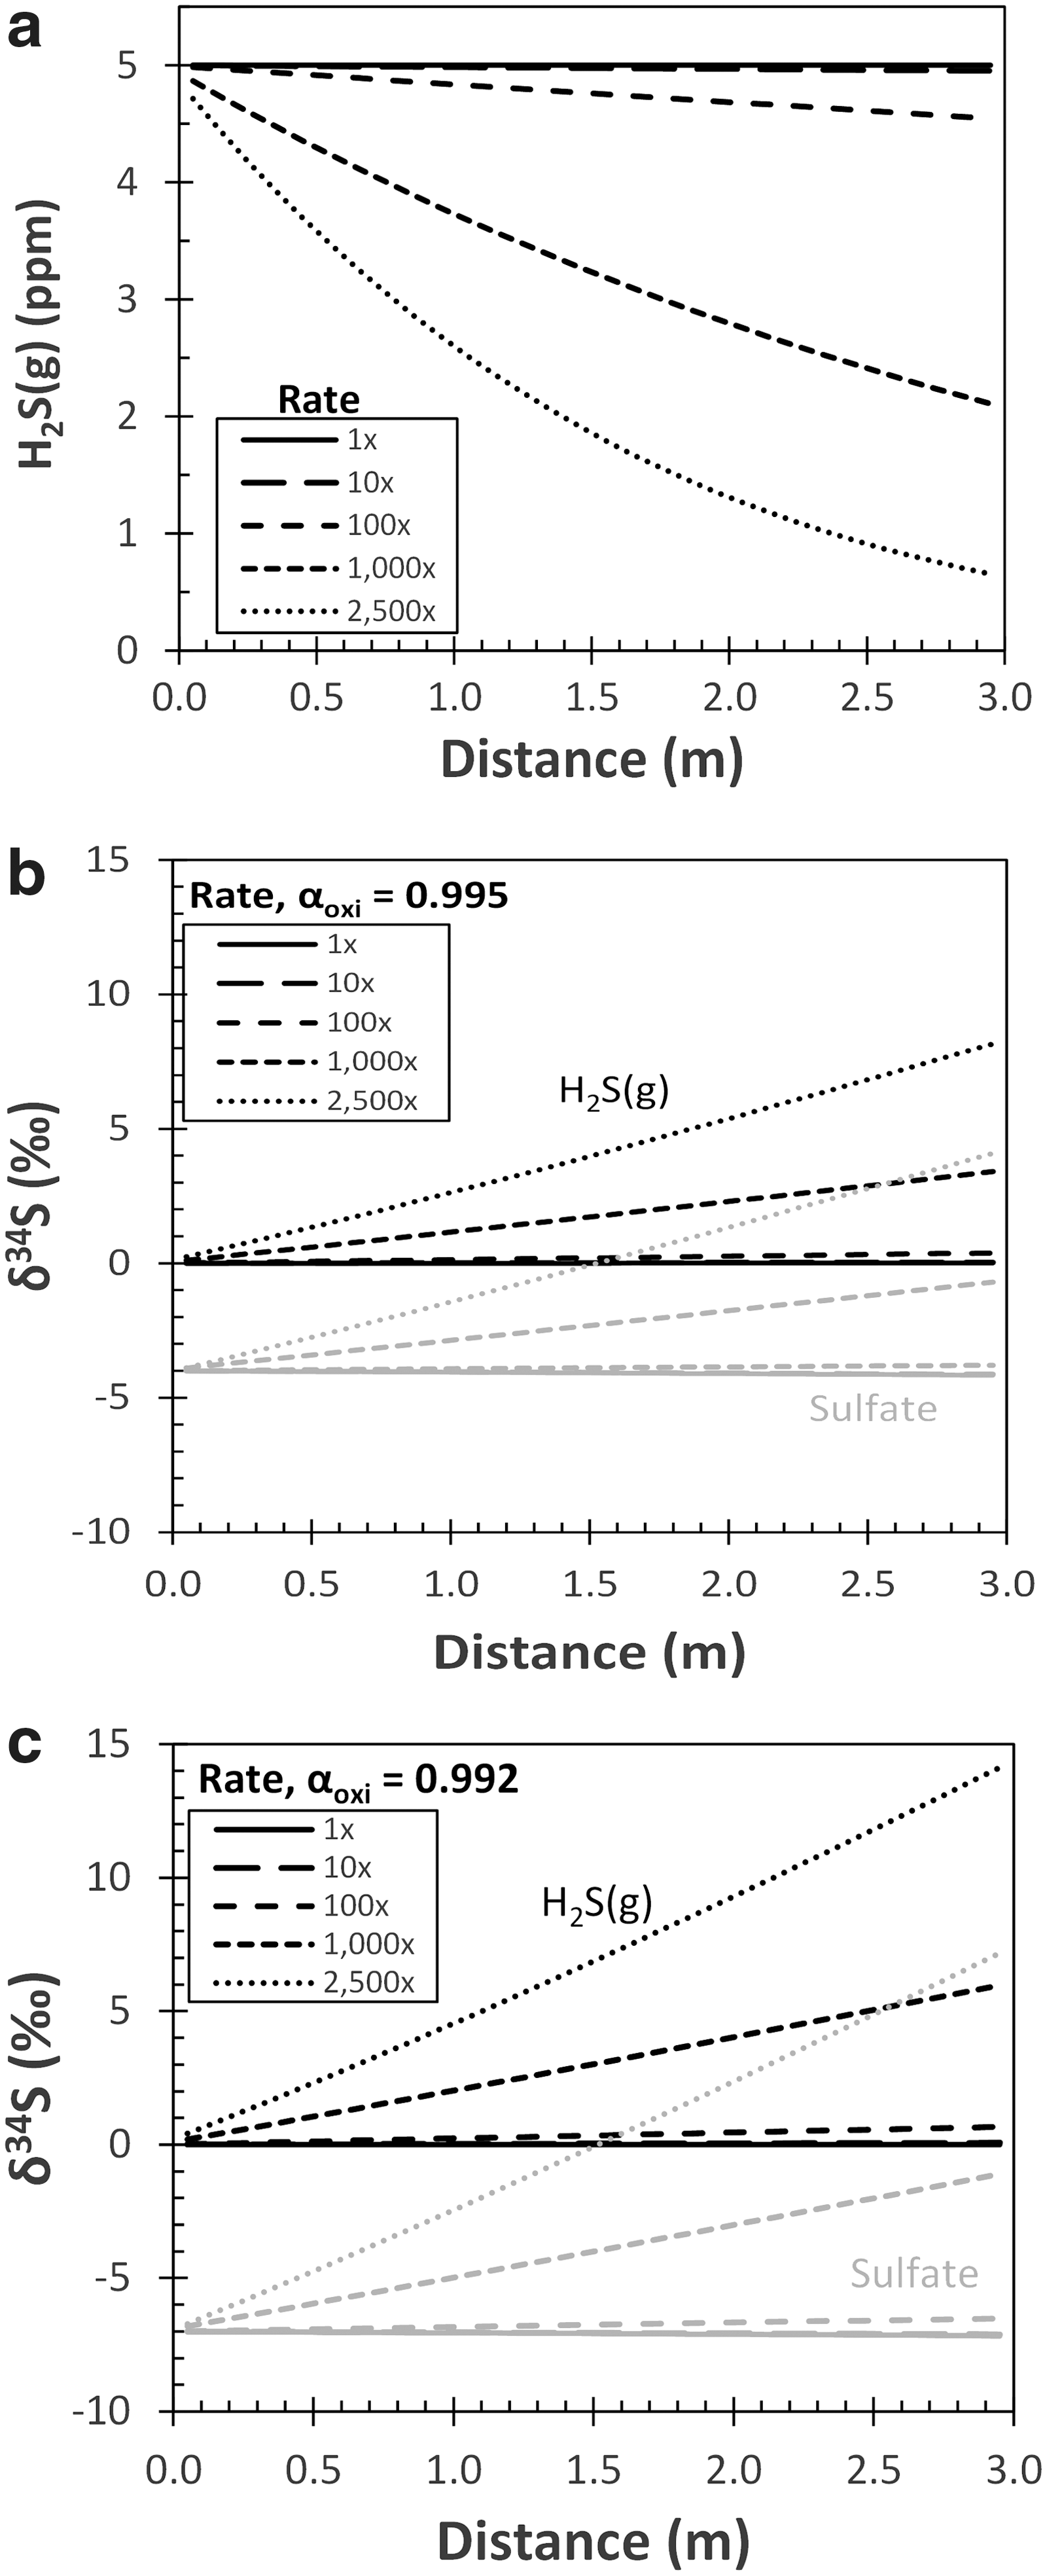
Results of reactive-transport model at flow rate of 0.2 cm/s, αequi = 1.001 and variable oxidation rates. Baseline oxidation rate (1 × ) was calculated using the abiotic rate law of Millero et al. (1987). Faster oxidation rates were tested to simulate microbial H2S oxidation by changing the abiotic rate constant to be between 10 and 2500 times larger. (
The 1D model is also useful for constraining sulfide oxidation rates, which can provide additional evidence for the importance of microbial H2S oxidation to gypsum formation. Assuming a constant gas flow velocity and direction, oxidation rates are estimated to be between 0.14 and 0.71 μmol sulfide/m2/h at site RS1, which are 1000 to 5000 times faster relative to the abiotic rate (Fig. 5). Similar isotopic gradients could be expressed at slower oxidation rates if the actual H2S(g) flow path is longer, as might be the case for molecules of gas in circulating convection cells. Therefore, the rates determined should be considered as maximum estimates. Our finding implicates microbial H2S oxidation as an important process in gypsum formation.
Ultimately, we suggest that the isotopic signal of microbial sulfide oxidation is expressed spatially at a meter scale. The spatial pattern differs within a cave room as driven by geometrical variations and patterns of air circulation affected by temperature and pressure. Along a gas flow path, systematic variations of gypsum δ34S at the meter scale are a potential biosignature, given that slow abiotic oxidation cannot produce the same signal in gypsum deposits.
5.3. Strategies for sampling in cave systems and potential complications
Our observations from actively forming sulfidic cave rooms suggest that systematic variations of gypsum δ34S along gas flow paths can be interpreted as strong evidence for biosignatures. We therefore propose the following steps to develop sampling strategies in ancient cave systems. Sampling missions should start with reconnaissance and cross-section mapping of a cave room, taking particular note of features where gas may have circulated such as chimneys, rounded domes, and cupolas (Galdenzi and Maruoka, 2003; Audra et al., 2007; De Waele et al., 2016). Visualization of gas flow patterns can be aided with simulations (such as Energy2D), which also allows for some constraints on the flow velocity. Sampling areas within a cave room can then be decided based on the gas circulation patterns. We suggest sampling over certain length spacing/scales where gypsum δ34S should vary by more than typical analytical δ34S resolution of < ±0.5‰. The length scale varies as a function of the ratio of H2S oxidation rate to gas flow velocity but is relatively insensitive to the isotopic fractionation associated with H2S oxidation (Fig. 8). At high oxidation rate relative to flow velocity, the sampling length scale is <1 m and is easily achievable in many cave rooms. At low oxidation rate to flow velocity, however, the sampling length scale becomes large (>1 m) and may not be feasible in certain study sites.
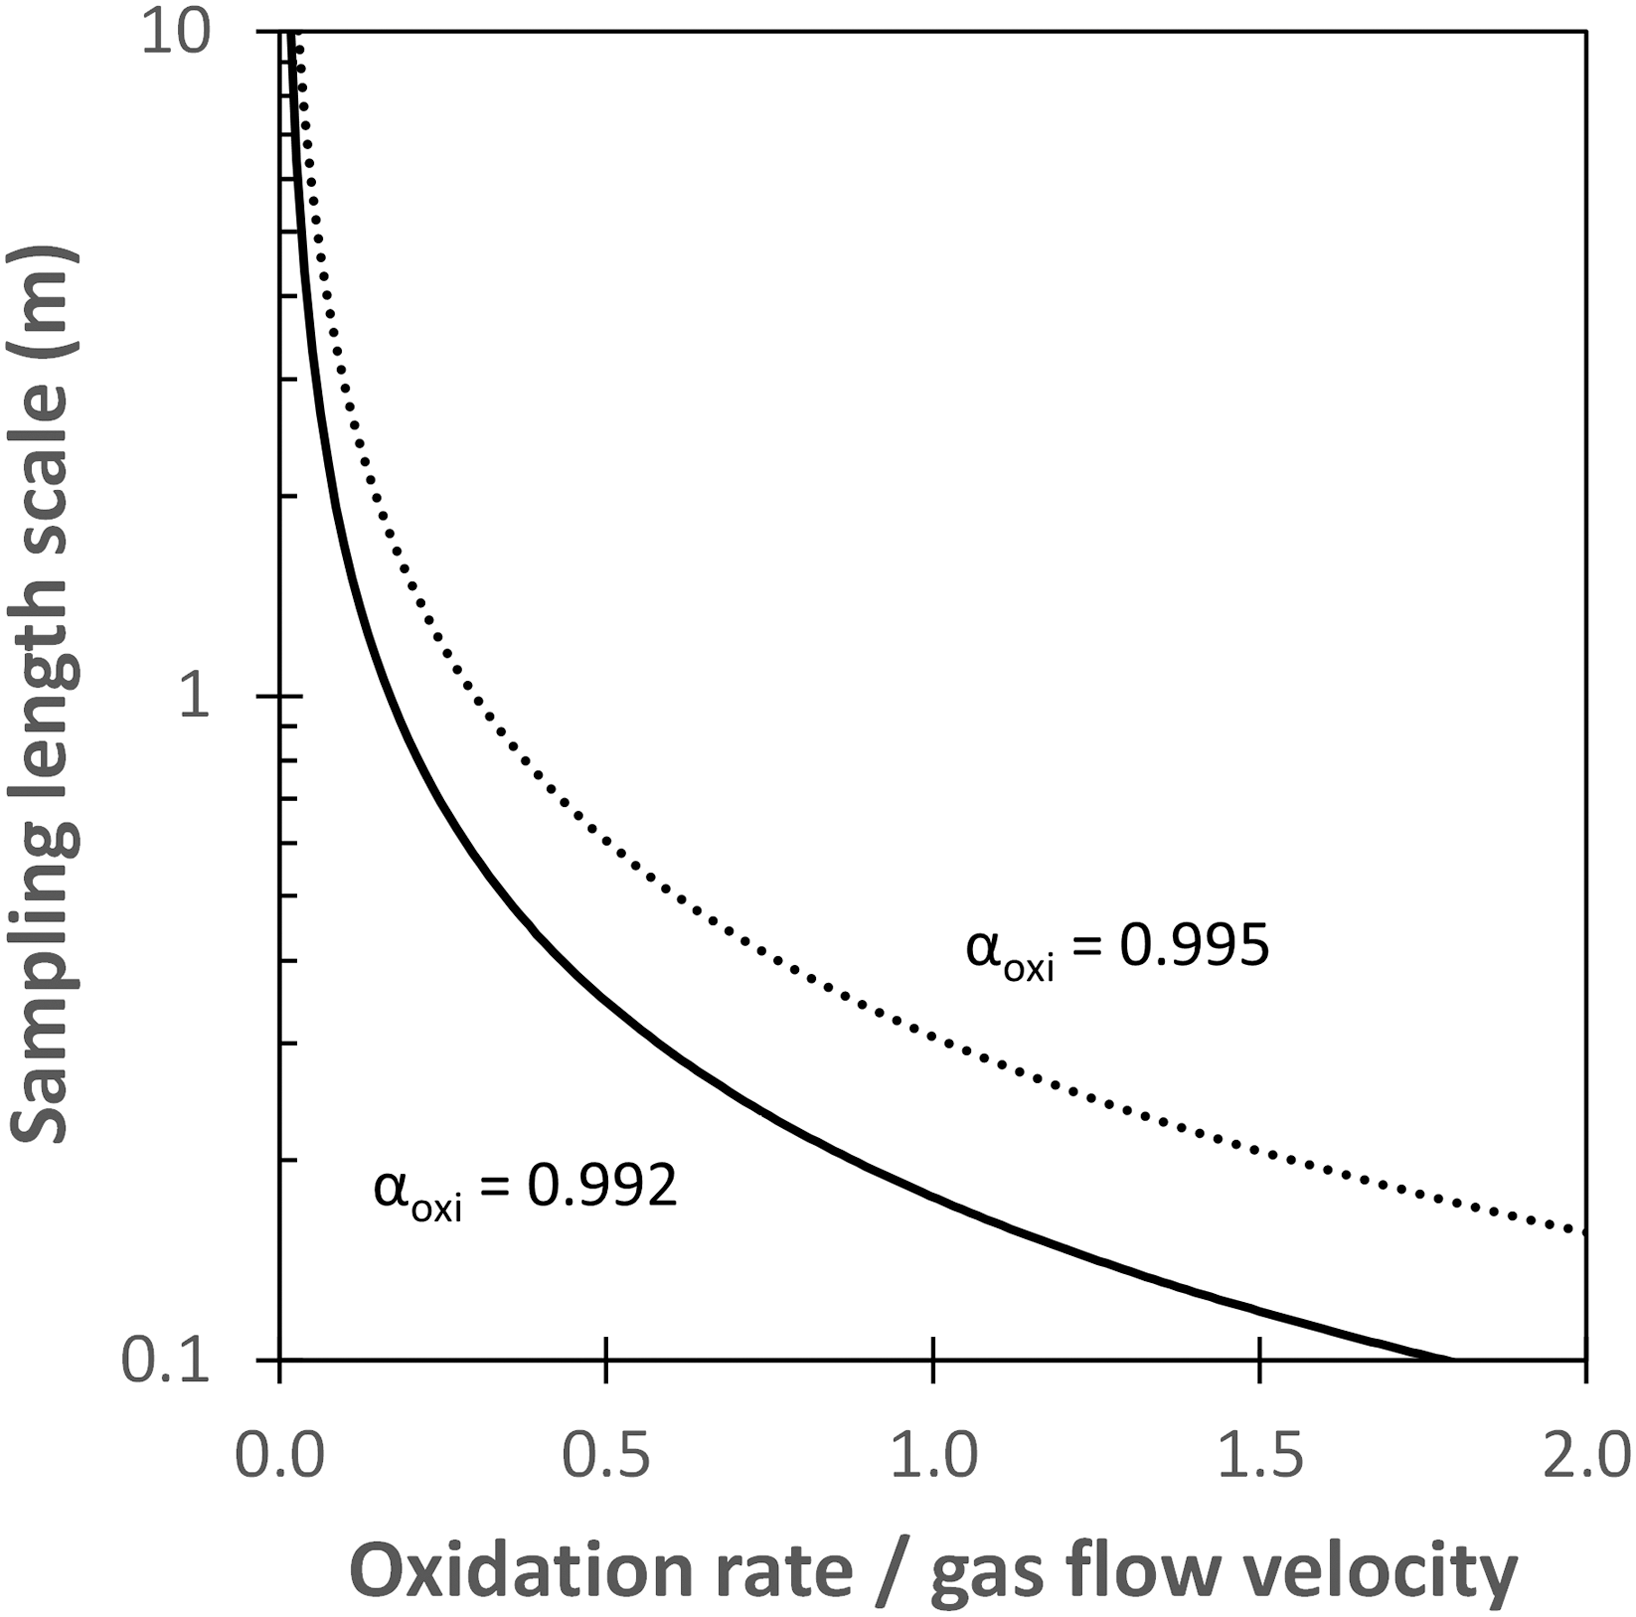
Sampling length scales at different ratios of H2S oxidation rate (μmol/m2/h) to gas flow velocity (cm/s). The length scale here is defined as the minimum sampling spacing required in order to detect gypsum with δ34S difference of ≥ ±0.5‰, considered as a minimum estimate for analytical resolution. Solid and dashed lines represent simulations where αoxi = 0.992 and 0.995, respectively.
Complications with this sampling approach result from uncertainties caused by potential inversions of gas flow as a result of diurnal and seasonal variations, especially for cave rooms located very close to openings to the surface (De Freitas, 1982; Lacanette et al., 2009). Spatial patterns built up in gypsum δ34S during a particular time period may be overprinted in the subsequent time period. Furthermore, wall gypsum is known to fall to the floor, where it can remain as floor deposits or be dissolved by undersaturated groundwater (e.g., Galdenzi and Maruoka, 2003; De Waele et al., 2016); consequently, any context for spatial pattern is lost.
Additionally, cave gypsum deposits are subjected to recrystallization that can potentially alter their original isotopic compositions (Galdenzi and Maruoka, 2003). Where H2S(g) is undetectable, Frasassi gypsum deposits tend to be isotopically heavier relative to modern-day groundwater H2S (−7.5 to −16‰ versus −13 to −21‰; this study; Galdenzi and Maruoka, 2003; Zerkle et al., 2016). One explanation is that old gypsum deposits could be sourced from past groundwater H2S with higher δ34S. Zerkle et al. (2016), however, showed that δ34S values of groundwater H2S within a cave room varied by <2‰ over decadal timescales, making this explanation unlikely. Changes over longer timescales remain unconstrained and are not testable with current techniques. Alternatively, as the water table recedes, older gypsum deposits could have been exposed more and more to small quantities of residual H2S(g) that have higher δ34S values due to isotopic distillation by extensive sulfide oxidation near the water table. Instead of a H2S source, older gypsum deposits could also reflect a component of gypsum precipitated from sulfate with high δ34S, which originated from sulfate-reducing microbes (Galdenzi and Maruoka, 2003) or percolating drip waters (Wynn et al., 2013). Regardless of the mechanism (or mechanisms), there are potentials for biogenic signals to be overprinted with time. Sampling missions should thus focus on targeting gypsum deposits that remain on the cave wall and do not show evidence of recrystallization or dissolution.
In summary, gypsum in sulfidic cave rooms displays clear biosignatures for S-oxidizing microbes in the form of systematic δ34S variations along gas flow paths. We propose strategies for detecting biosignatures in caves as well as other partially enclosed systems by first reconstructing gas flow patterns to decide on sampling areas followed by sampling over a defined length scale. Systematic patterns of gypsum δ34S along gas flow paths can be considered direct evidence for biological sulfide oxidation. Complications can arise as a result of gas flow inversions and physical or chemical diagenesis that can overprint this biosignature. Constraining these complicating factors should be subjects for future studies.
Footnotes
Acknowledgments
This work was supported by grants to M.S.F. and J.L.M. from NASA NAI (NNA09DA76A and NNA04CC06A). M.M. acknowledges support from the Lewis and Clark Fund for Exploration and Field Research in Astrobiology through NASA and the American Philosophical Society. The authors thank M. Arthur and A. Montanari for providing facilities and laboratory space at Penn State University and the Osservatorio Geologico di Coldigioco in Italy, respectively. Thanks to S. Mariani, S. Cerioni, M. Mainiero, F. Baldoni, S. Carnevali, members of the Gruppo Speleologico C.A.I. di Fabriano and the Federazione Speleological Marchigiana for assistance during field campaigns, and to J. Wang, A. Chorney, Y. Watanabe, L. Liermann, D. Walizer, and I. Schaperdoth for technical support and assistance with laboratory analyses. The authors thank A. Zerkle and an anonymous reviewer for constructive reviews that improved the manuscript.
Author Disclosure Statement
No competing financial interests exist.
Abbreviations Used
References
Supplementary Material
Please find the following supplemental material available below.
For Open Access articles published under a Creative Commons License, all supplemental material carries the same license as the article it is associated with.
For non-Open Access articles published, all supplemental material carries a non-exclusive license, and permission requests for re-use of supplemental material or any part of supplemental material shall be sent directly to the copyright owner as specified in the copyright notice associated with the article.