




Abstract
Hydrogen, produced by water radiolysis, has been suggested to support microbial communities on Mars. We quantitatively assess the potential magnitude of radiolytic H2 production in wet martian environments (the ancient surface and the present subsurface) based on the radionuclide compositions of (1) eight proposed Mars 2020 landing sites, and (2) three sites that individually yield the highest or lowest calculated radiolytic H2 production rates on Mars. For the proposed landing sites, calculated H2 production rates vary by a factor of ∼1.6, while the three comparison sites differ by a factor of ∼6. Rates in wet martian sediment and microfractured rock are comparable with rates in terrestrial environments that harbor low concentrations of microbial life (e.g., subseafloor basalt). Calculated H2 production rates for low-porosity (<35%), fine-grained martian sediment (0.12–1.2 nM/year) are mostly higher than rates for South Pacific subseafloor basalt (∼0.02–0.6 nM/year). Production rates in martian high-porosity sediment (>35%) and microfractured (1 μm) hard rock (0.03 to <0.71 nM/year) are generally similar to rates in South Pacific basalt, while yields for larger martian fractures (1 and 10 cm) are one to two orders of magnitude lower (<0.01 nM/year). If minerals or brine that amplify radiolytic H2 production rates are present, H2 yields exceed the calculated rates.
1. Introduction
T
Previous studies suggested that radiolysis might support life on Mars (i.e., Lin et al., 2005b; Sherwood Lollar et al., 2007; Lefticariu et al., 2010; Türke et al., 2015). However, few studies quantified radiolysis rates. To better understand the origin of the subsurface methane flux on Mars, Onstott et al. (2006) investigated the diffusion of He, H2, and CH4 through the martian crust. They calculated radiolytic production rates for the deep subsurface crust based on the chemical composition of martian meteorites and a 6.6 km-thick crustal profile of estimated porosity. In contrast to their global approach, we calculate specific rates for a broad range of lithologies, including both water-saturated rock and sediment, based on compositional data at 11 specific sites on Mars.
These 11 sites include the three currently proposed Mars 2020 Rover landing sites (Witze, 2017), five other sites that were previously under consideration for the Mars 2020 mission (Ono et al., 2016), and three sites with minimum or maximum mean martian rates of radiolytic H2 production (based on radionuclide concentrations). Our purpose of selecting these sites is to quantify (1) the magnitude of radiolytic H2 production in the wet martian past at potential Mars 2020 landing sites, and (2) the range of H2 production rates in present-day martian subsurface groundwater.
Identification of past and present habitable environments is one of the main objectives of Mars Exploration missions (Mustard et al., 2013). Because oxidative H2 respiration is a source of chemical energy for microbial life, estimates of past H2 production rates based on the radioisotope compositions of proposed Mars 2020 sites are important for understanding the ancient habitability of the sites.
Eight sites were originally considered as the possible landing sites for the Mars 2020 mission (Mustard et al., 2013). Many of these locations have similar geological and topographic features, in part because the final site must be safe for rovers to land and travel (Mustard et al., 2013). The eight candidate sites were narrowed to three based on the following criteria: an ancient environment likely to have been habitable, accessible rocks with potential for biosignature preservation, and geological materials that may answer questions about planetary evolution (Witze, 2017).
The three sites currently under consideration for the Mars 2020 landing site are as follows: Jezero Crater, an ancient lake that has both deltaic and lacustrine deposits with well-defined stratigraphy (Schon et al., 2012; Witze, 2017); NE Syrtis Major which was once volcanically active, with widespread evidence of past liquid-water activity and a variety of interesting environments, including a banded olivine-carbonate unit and a crater-retaining cap of mafic rock (Hiesinger and Head, 2004; Ono et al., 2016); and Columbia Hills, where Mars Exploration rover Spirit provided evidence of ancient hydrothermal activity and/or hot springs (Squyres et al., 2008).
In addition to these three locations, we evaluate radiolytic H2 production for five other sites originally under consideration for Mars 2020: Eberswalde Crater, Holden Crater, Nili Fossae, Mawrth Vallis, and SW Melas Chasma. We include these sites as points of comparison for the three sites still under consideration, as all eight sites may have once harbored liquid water, and potentially H2-oxidizing life (Ono et al., 2016).
Finally, we chose three additional locations, based on their radioisotope compositions, to evaluate minimum and maximum radiolytic H2 production rates on the past martian surface and in the present subsurface: Acidalia Planitia (maximum rate), the northern pole (minimum rate for an ice-covered region), and Promethei Terra (minimum rate for a region without ice cover). The locations of the 11 sites are shown in Figure 1.
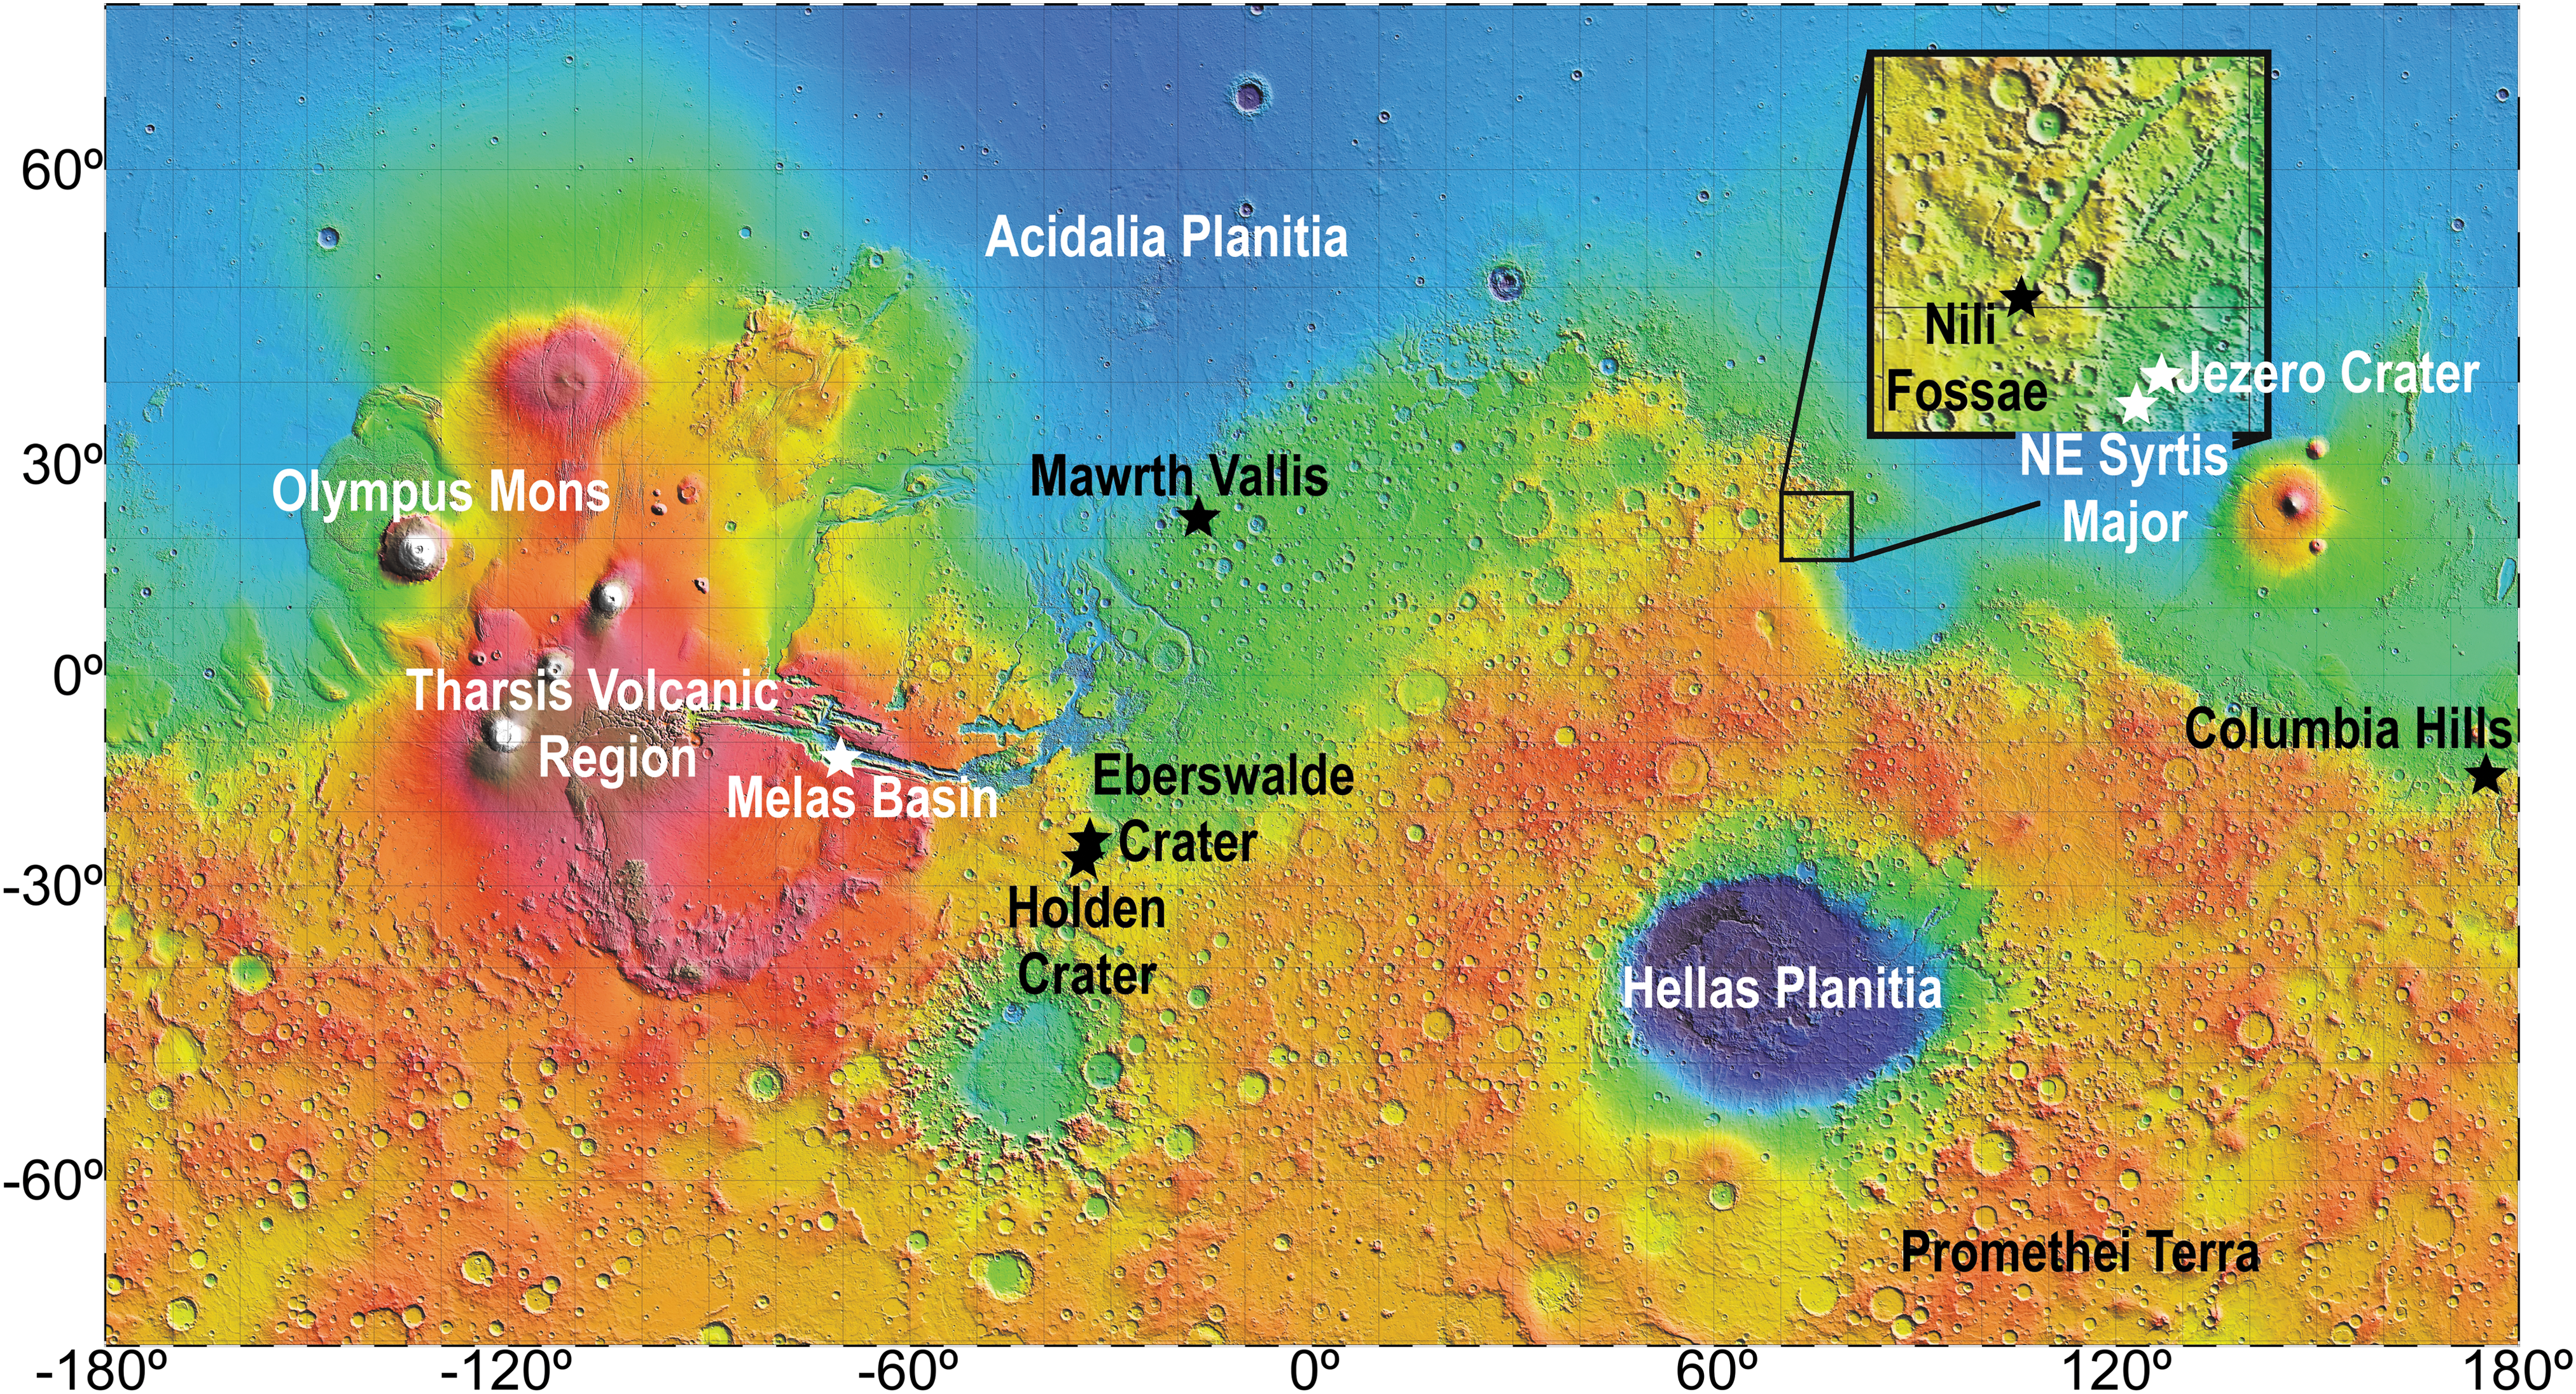
Topographic map of Mars. Site names and significant features identified. Topology map based on data from the Mars Orbiter Laser Altimeter (Smith et al., 2003).
Martian surface material ranges from loose, fine-grained regolith to large pieces of fractured rock. To account for this heterogeneity, we calculate H2 production rates using two different radiolysis models. One model is for fractured hard-rock aquifers (Dzaugis et al., 2015, 2016), the other is for water-saturated fine-grained sediment (Blair et al., 2007).
2. Methods
In this section, we describe the radiolysis models and discuss the variables used in our calculations: fractured rock composition, sediment porosity, radioactivity, density, and H2 yield per 100 eV absorbed (G-value). Lithologies of the 11 localities are described in Table 1, and calculated H2 production rates are given in Table 2.
Radionuclide concentrations are determined from the interpolated distribution maps in Figure 1. Uranium concentrations are calculated using a U/Th ratio of 0.28.
Volume-normalized rates are given for three fractured-rock scenarios (varying fracture width) and three sediment scenarios (varying porosity).
2.1. Fractured hard-rock model
We previously used this model to calculate production rates in terrestrial oceanic basaltic aquifers (Dzaugis et al., 2016). In this study, we use parameter values appropriate for Mars.
Within hard-rock aquifers, ionizing radiation produced during the decay of radioactive elements in the rock decomposes water molecules and leads to production of hydrogen molecules (Le Caër, 2011). To calculate H2 production rates within fractured hard-rock aquifers, we first integrate the decay energy that reaches the water [MeV/(cm2·s)]. This is the radiant flux, and depends on
Decay power, decay energy per time per solid angle [MeV/(sr·s)], determined by the activity decay energy of the radionuclides (U, Th, and K) in the rock.
Irradiance, amount of incident power normalized to surface area (decay power/cm2), depends on the geometry of the radiation's path from the source to the surface of interest.
Attenuation, the decrease of intensity as the radiation travels through rock and water.
The water-volume-normalized dose rate [MeV/(cm3
water·s)], is equal to the radiant flux divergence between rock–water interfaces divided by the distance between the interfaces. Finally, H2 production rate (nanomolar H2/year) is given as follows:
where the absorbed dose rate (D α,β,γ) from each type of radiation is multiplied by its respective G-value (G α,β,γ), and the number of H2 molecules created per 100 eV of energy absorbed (see Section 2.5 for more details on G-values). For a more detailed description of the parameters and the equations, see Dzaugis et al. (2015).
As mentioned above, the radiant flux and therefore dose rates are affected by the attenuation of radiation energy. Attenuation depends on matrix composition. The martian crust is dominantly basaltic (McSween, 2015). Igneous rocks from Gusev and Gale craters and SNC (Shergotty, Nakhla, and Chassigny) meteorites, as well as measurements from the γ ray spectrometer (GRS) on Mars Odyssey, all indicate ∼40–55 wt % SiO2 (McSween et al., 2003). We thus utilize energy–range relationships for each type of radiation traveling through basalt or water. For α-radiation, the energy–range equation for basalt was derived by Brennan and Lyons (1989). To calculate attenuation of β and γ radiation through rock and water, we use energy–range data from the National Institute of Standards and Technology (NIST) database (Hubbell and Seltzer, 2004; Berger et al., 2005). Because the NIST database does not include energy–range data for basalt, we use data for SiO2 adjusted for the higher density typical of martian basalt.
The dose rate also depends on the thickness of rock adjacent to the fracture. We calculate dose rates produced from the radiation emitted by 1-m-thick rock abutting both sides of the fracture. One meter of rock accounts for >99% of the entire dose rate. α- and β-Radiation generated by the 238U, 235U, and 232Th decay series and β particles by 40K decay have ranges which are much <1 m in basalt, and >99% of γ-radiation is absorbed over this distance. However, since α-radiation is more energetic than β- or γ-radiation and travels in rock on average ∼30 μm, absorbed dose rates in microfractures produced by 30 μm-thick rock are only ∼10% lower than rates from 1 m of rock.
Using the dose rates and G-values, we calculate water-volume-normalized radiolytic H2 production rates for a range of fracture apertures. H2 production rate per volume of water decreases as fracture width increases. The stopping power of water results in loss of particle energy near the rock–water interface. The decrease in volume-normalized H2 production is due to the limited ranges of α and β radiation (30 μm and a few mm, respectively) and increased volume of water (Dzaugis et al., 2016), which does not produce significant radiation itself. Since we do not know the distribution of fracture widths in martian basalt, we present three cases to illustrate how H2 yields depend on width (1 μm, 1 cm, and 10 cm). Supplementary Table S1 (Supplementary Data are available online at
2.2. Sediment model
We also calculate radiolysis rates for fine-grained water-saturated sediment in which we assume a homogeneous mixture of water and particles <30 μm in diameter (stopping distance of α-particles, the distance a particle travels before its kinetic energy is 0) (Blair et al., 2007).
In this protocol, dose rates for α-, β-, and γ-radiation are calculated based on activity (Section 2.3), the sum of radiative energy released by each radionuclide decay series, grain density (Section 2.4), the ratios of relative stopping power for each radiation type, and porosity of the sediment (Blair et al., 2007). Once radiation doses are known, we can calculate the H2 production by multiplying the dose rate from α-, β-, and γ-radiation by their respective radiation chemical yields (G-value, see Section 2.5). For a full summary of the factors used in this protocol, see Supplementary Tables S2 and S3.
We include three different porosities (5%, 35%, and 80%) to parallel the fractured rock model. The calculations with 5% porosity define a high-H2-production end-member scenario, because H2 production rates per volume of water are highest where porosity is low. The calculations with 35% porosity are consistent with many previous studies of martian sediment. A value of 35% porosity has been used in many studies that calculate timescales for formation of martian depositional fans and deltas, such as in channelized fans located in Holden crater and Melas Chasma (Jerolmack et al., 2004; Kleinhans, 2005; Metz et al., 2009). Finally, because our model is restricted to medium-silt grain size (30 μm), we provide results for 80% porosity, a value typical of uncompacted pelagic clay on Earth's seafloor (Hamilton, 1976; Spinelli et al., 2004).
We update the values of Blair et al. (2007) for the decay energy of the 238U, 235U, and 232Th series, assuming secular equilibrium, and 40K (Supplementary Table S4). For each radionuclide, we separately sum the energy of α-, β-, and/or γ-radiation energy (U and Th: MeV/decay series; K: MeV/decay). Our β-energy sums differ greatly from those of Blair et al. (2007), because we calculate an average initial energy for each β-particle, while Blair et al. use the maximum energy value for each β-particle. β-Particles are emitted with a continuous spectrum of energies ranging from near-zero to a maximum value specific to each radionuclide. To account for this distribution, when calculating β-decay energy sums, we use the average initial energy, which is approximately one-third of the maximum energy (L'Annunziata, 2007). These updated values match the values that we use in our fractured rock calculations.
2.3. Radionuclide concentrations
Both radiolysis models require radionuclide activities. The principle radioisotopes that can drive water radiolysis on Mars are in the 238U, 235U, and 232Th decay series and 40K. The U and Th series emit α-, β-, and γ-radiation, whereas 40K emits β- and γ-radiation. Radiolysis rate is proportional to radionuclide activities. For 40K and 232Th abundances, we used data collected using the GRS on the Mars Odyssey (Boynton et al., 2007). GRSs determine the abundance and distribution of K and Th by measuring characteristic γ rays that are emitted from the top few tens of centimeters of the planet's surface (Boynton et al., 2004). The GRS data comprise the most exhaustive record of radionuclide concentrations for Mars. However, this record is geographically low resolution. The footprint diameters over which 50% of the Th and K signals are received are 240 and 215 km, respectively. Therefore, although microscale variability in radionuclide concentrations undoubtedly exists, our calculations do not take into account variations in radionuclides at distance smaller than the GRS footprints.
Landers and rovers have also collected K abundance data (McLennan, 2001). The lander and rover measurements, however, are more spatially restricted, and U and Th concentrations are not determined. K abundance based on satellite GRS correlates to in situ data collected at landing sites by surface instruments (Boynton et al., 2007; Karunatillake et al., 2007).
Galactic cosmic rays (GCRs) can also contribute to radiolysis at the surface of Mars, if water is present. GCRs comprise 85% protons, 14% α particles, and small percentage of heavy ions (Dartnell et al., 2007). However, ∼3 m below the surface GCR are no longer the main source of radiation; at depths >3 m, radionuclides contained in martian sediment or rock provide the main radiation source for radiolytic H2 production (Hassler et al., 2014).
Th and K are mapped for the globe (Boynton et al., 2007). However, near the poles, ice cover can bias Th and K abundances toward lower values because some of the top 10 cm is composed of ice (Taylor et al., 2007; Boynton et al., 2007). Boynton et al. (2007) summed elemental spectra and binned them in 5° × 5° bins to improve signal-to-noise ratios. We include the reported uncertainty associated with smoothed radionuclide concentration measurements in our final radiolysis error calculations reported in Supplementary Tables S5 and S6. U abundances have not been calculated from GRS data due to its weak signal-to-noise ratio (Boynton et al., 2007; Karunatillake et al., 2007). In this study, we calculate U concentrations by using Th concentrations from GRS data and assuming a constant U/Th ratio of 0.28 (a value characteristic of most SNC meteorites) (McLennan, 2003; Baratoux et al., 2011). We show global maps of U, Th, and K distributions in Figure 2.
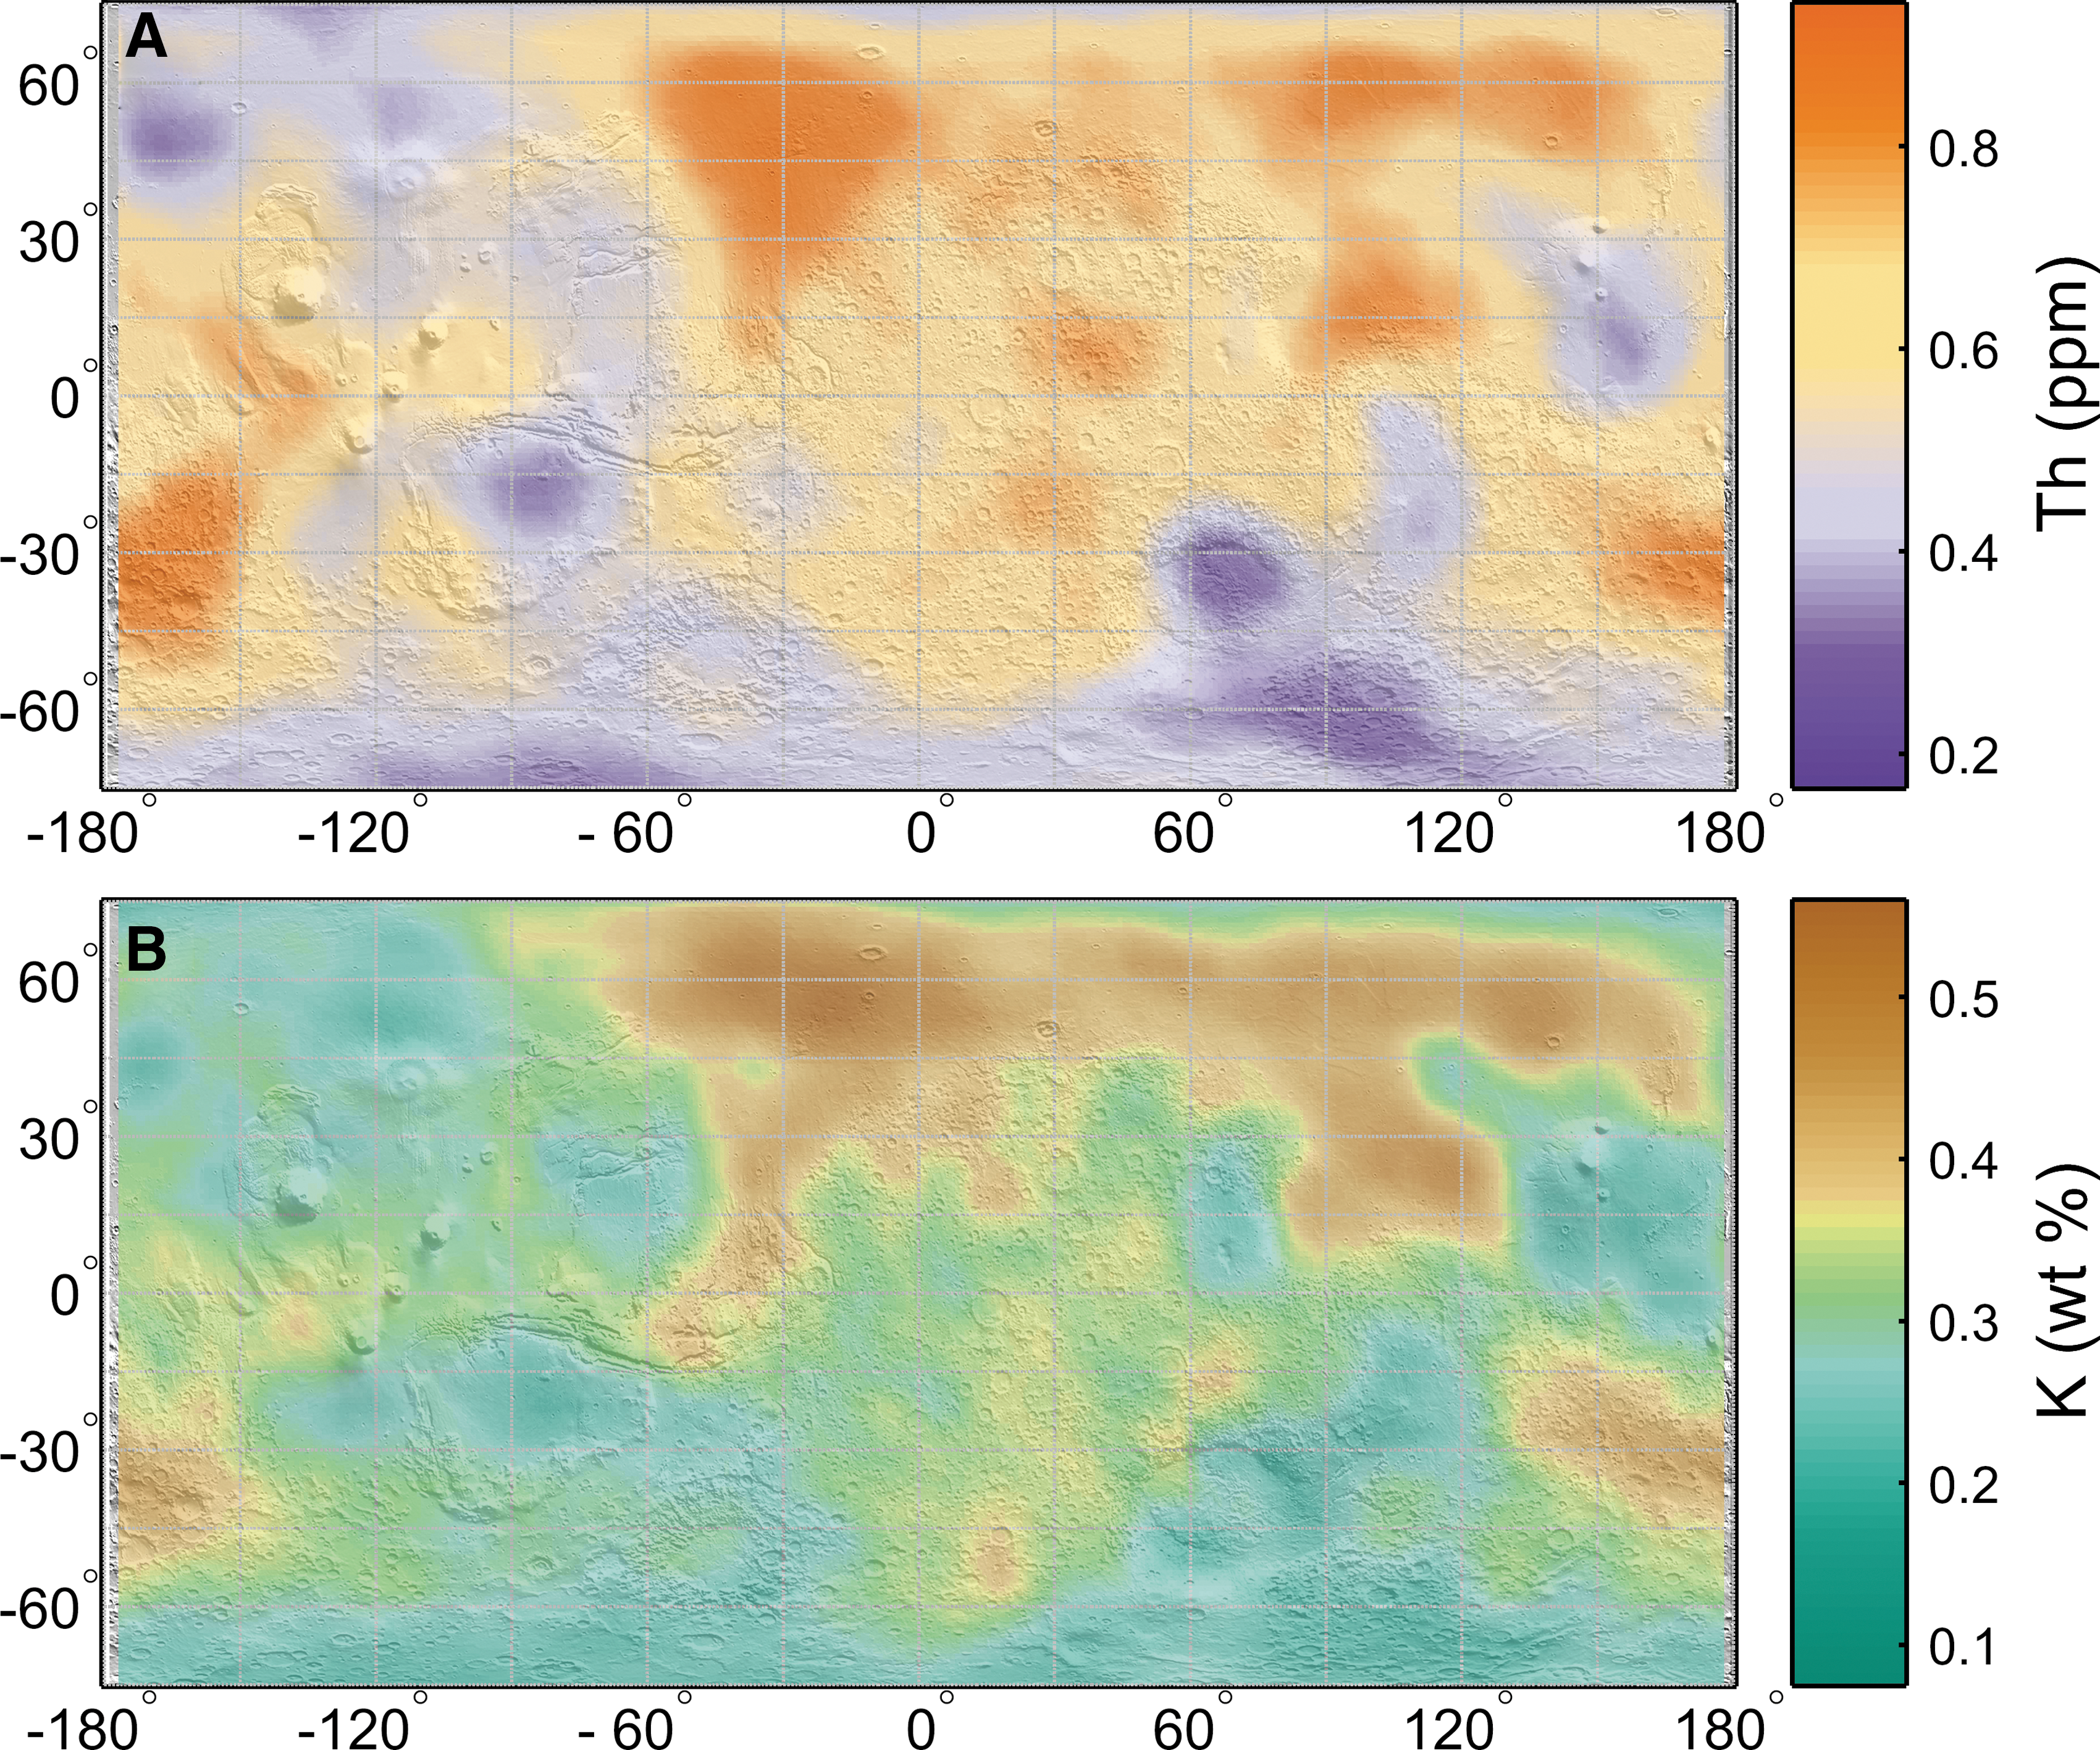
Radionuclide concentrations.
Radionuclide concentrations vary with lithology. There is evidence on Mars for a global dust unit with relatively constant basaltic mineralogy (Yen et al., 2005). However, if this global unit is present, it is <10 cm thick since the martian surface does not have a constant radionuclide distribution as measured by GRS (Boynton et al., 2007).
2.4. Density
Density values are based on the range suggested by Baratoux et al. (2014) for martian crust. Baratoux et al. (2014) based their calculations of density on GRS surface element measurements, major element chemistry of martian meteorites, and chemical analysis of martian igneous rocks by rovers. They argue that the basaltic component of the martian crust has a density >3100 kg/m3, which is higher than previously thought (Baratoux et al., 2014; Zharkov and Gudkova, 2016). In our calculations, we use density of 3350 kg/m3 which is the peak value calculated using the CIPW (Cross, Iddings, Pirsson, and Washington) norm on GRS chemical maps (Baratoux et al., 2014). While this density is representative of martian basalt, it is also similar to values used in sediment transport models for Mars which use grain density values of 3400 km/m3 (Kleinhans, 2005; Hoke et al., 2014).
2.5. G-values
We calculate H2 production rates using pure water G-values (Table 3). These G-values are well constrained for each type of radiation. For both our models, we assume constant G-values for the energy ranges of radiation in this study (<5.8 MeV). G-values depend on linear energy transfer (LET), the energy absorbed by the medium normalized to distance (−dE/dx). However, G(H2) appears to plateau at a LET value of ∼150 keV/μm, which corresponds to a 5 MeV α-particle (Crumière et al., 2013). Therefore, at high LET values of α-particles in this study, there is minimal effect on the G-value. We did not find any work specifically on the effect of β-particle LET, therefore we assume yields to be constant for G β(H2) as well. The G(H2) values we use in our calculations provide a minimum estimate of H2 production because specific minerals (e.g., Kumagai et al., 2013) and/or brines (Kelm and Bohnert, 2004; Kumagai et al., 2013) can increase H2 yields. In Section 3.4, we further discuss potential effects of minerals and brine on G-values and H2 production rates. As mentioned previously, our calculations normalize the final radiolytic H2 production values to the total volume of water, presented in units of nanomolar H2 per year (nM/year).
Essehli et al. (2011).
Kohan et al. (2013).
3. Results
As we mentioned previously, fracture width and porosity affect water-volume-normalized H2 production rate (nM/year), principally because radioactive element concentrations in water are typically much lower than those in rock. We assume that concentrations of U, Th, and K in martian water are equivalent to those in seawater. These concentrations are so low that we do not include them in our calculations (Pilson, 2012). Volcanic rocks have a range of fracture widths. In fractured rock, with a constant radioisotope composition, microfractures have the highest H2 production rates per volume of water (Table 2) (Dzaugis et al., 2016). Production rates in a 1 μm-wide fracture are more than two orders of magnitude higher than those in a 10 cm-wide fracture (Table 2). H2 production rates (nM/year) in sediment at 5% porosity are ∼6.4 times higher than those at 80% porosity (Table 2). Production rates in low-porosity, fine-grained sediments are higher than those in fractured rock. At any given site, H2 production rate in sediment with ∼60% porosity is similar to the rate in microfractured rock.
H2 production rates for water-saturated lithologies with radionuclide concentrations equal to our 11 sites are summarized in Table 2. Calculated H2 production rates are within a factor of 2 of each other, given constant physical conditions, and the GRS radioisotope compositions of the original eight potential Mars 2020 landing sites. We also calculated uncertainties for H2 production, based on reported one-sigma uncertainty, the estimated standard error associated with the smoothed GRS radionuclide data (Boynton et al., 2007). The relative uncertainty for most sites ranges from 5% to 8%, although Promethei Terra and the Northern Pole have uncertainties closer to 15% (Supplementary Tables S5 and S6).
Mawrth Vallis, an ancient channel, has the highest rates of the landing sites, while SW Melas basin rates are ∼1.6 times lower (Table 2). The production rates for the three sites still under consideration for the Mars 2020 mission (Jezero Crater, NE Syrtis Major, and Columbia Hills), which have the next highest rates, are within 7% of each other. Across the 11 sites in this study, calculated production rates vary by a factor of ∼6. This range includes the likely low-biased radionuclide concentrations at latitudes >75°N due to the presence of ice. If ice-covered regions are excluded, the range is ∼3.5-fold.
Acidalia Planitia, in the northern highlands, has the highest production rates due to its high radioisotope abundances (Table 2). Fine-grained sediments with 5% porosity have rates of 1.2 nM/year, whereas microfractured rock has a H2 production rate of 0.35 nM/year, assuming the same composition at a depth where water is now present or was present in the past. Between 75°N and 75°S, the radioisotope composition of Promethei Terra has the lowest calculated rates: 0.33 nM/year for 5% porosity sediment and 0.10 nM/year for 1 μm-wide fractures. Including polar regions, H2 production rates may be as low as 0.21 nM/year in 5% porosity sediment and 0.061 nM/year in 1 μm-wide fractures (Table 2).
4. Discussion
In the following sections, we discuss martian H2 production rates and assess how much life might be supported by radiolysis. We then compare martian and terrestrial rates. Because we assume water saturation, the calculated rates do not hold for present surface conditions at these sites. Instead, they correspond to rates for ancient (wet-surface) Mars and present-day wet subsurface environments with the same radioisotope compositions and physical properties used in our calculations.
Previous studies identified the potential for chemolithotrophic life in the martian subsurface due to the likely presence of liquid water and the production of reduced chemicals (primarily H2 through serpentinization of ultramafic rock) (Mancinelli, 2000; Ehlmann et al., 2010; McCollom and Seewald, 2013). Most production of H2 by serpentinization is limited to temperatures of 150°C to 315°C (McCollom and Bach, 2009). In contrast, radiolytic H2 production is more ubiquitous, occurring wherever water or ice is in contact with rock or sediment.
4.1. H2 production rates at eight proposed landing sites
Calculated production rates for water-saturated lithologies are all within a factor of 2 for the eight landing sites. The relative uncertainties in production rates are similar, ∼7%, at these sites (Supplementary Tables S5 and S6). These uncertainty estimates include the reported uncertainty of GRS radionuclide data. Of the three sites currently under consideration for the Mars 2020 mission, radionuclide concentrations characteristic of Columbia Hills lead to H2 production rates that are slightly higher than those at the other two sites. However, considering the uncertainty of the GRS measurements at these three sites, the three values are indistinguishable from each other (Supplementary Tables S5 and S6). Of the other five sites previously under consideration for Mars 2020, the radioisotope concentrations of Mawrth Vallis yield the highest production rates and the concentrations of SW Melas yield the lowest rates (Table 2). For fine-grained sediment with 5% porosity, Mawrth Vallis production approaches 1 nM/year. The highest rates based on the fractured rock model are three to four times lower.
If radiolytic H2 supported life on the ancient martian surface, water-saturated sediment or rock with the radioisotope content of Mawrth Vallis could have supported 1.6 times as many cells in the same volume of water as water-saturated sediment or rock with the radioisotope composition of Melas basin (assuming the same physical properties at Mawrth Vallis and SW Melas). Larger variations in the number of cells may have occurred if the dominant sediment and/or rock at the sites differed in porosity and fracture width, and/or varied in radionuclide concentration on distance scales shorter than the GRS footprints. The physical properties of each location, that is, porosity and fracture geometry, lead to order-of-magnitude variations in H2 production. A variety of geological formations likely occur at each of the 11 sites, leading to variations in porosity, fracture width, radionuclide concentrations, and consequently, radiolytic H2 production rates.
4.2. Total range of radiolytic H2 production rates
Calculated H2 production rates based on surface martian radioisotope concentrations differ by a factor of ∼6 when ice-covered regions are included (Table 2). The distribution of H2 production is principally driven by U and Th series nuclide distributions (Fig. 1) since both decay series produce α-radiation, which carries the most energy and generates the most H2 per MeV absorbed. U (238U+235U) decay series activity and 232Th decay series activity, respectively, are responsible for 49–53% and 39–42% of calculated H2 production for each site, while 40K decay contributes only 4–11%.
The largest production rate, 1.2 nM/year for 5% sediment porosity, is associated with Acidalia Planitia in the northern highlands due to this area's high radionuclide abundance (Fig. 2 and Table 2). Acidalia Planitia contains plains of eolian deposits, as well as cone and dome structures possibly formed by mud volcanism, hot spring/geysers, or lava flows (Farrand et al., 2005). If mud volcanism was responsible for the cones, relatively unaltered sediment from depth was transported to the surface. This once-fluid-rich material could contain biomarkers (Farrand et al., 2005; Oehler and Allen, 2010). In general, the northern highlands are enriched in K and Th (Fig. 2). This region contains andesite, basaltic andesite, or weathered basalt (Bandfield, 2000; Wyatt and McSween, 2002). Basaltic lava flows at Tharsis Montes and Olympus Mons shield volcanoes have below average K and Th concentrations.
Just as radionuclide-enriched regions yield the maximum calculated H2 production rate, radionuclide-depleted regions yield the minimum rate (Fig. 2). Between 75°N and 75°S, Promethei Terra yields the lowest calculated rate, 0.33 nM/year for 5% porosity sediment (Table 2). Promethei Terra consists of interbedded volcanic rock and impact breccia. There is evidence that both fluvial and glacial processes shaped the terrain of Promethei Terra. The landscape of Promethei Terra was also shaped by the impact that formed the Hellas basin (Ivanov et al., 2010). The radioisotope composition of the large impact basin, Hellas Planitia, also yields a low calculated H2 production rate: 0.44 nM/year for 5% porosity sediment (note there is high uncertainty in GRS measurements in Hellas Planitia, resulting in ∼17% relative uncertainty of the H2 production rate).
The calculated production rates for Mars' northernmost latitudes (e.g., 0.21 nM/year for 5% porosity sediment) are lower than those associated with Promethei Terra, which has higher radionuclide concentrations (Table 1). As previously mentioned, the measured concentrations are likely biased by the permanent ice cap. Despite the bias toward low values for this region covered by water ice and dust (Bibring et al., 2004), calculated H2 production can reach rates higher than those derived for ice-free regions of Mars; the maximum rate calculated for sediment of the ice-capped area is ∼0.6 nM/year. This comparison suggests that there may be locally high H2 generation rates within or under the polar ice caps. However, H2 G-values for ice are about half of those for liquid water used in our study (Table 3). G(H2) values for α-, β-, and γ-radiation in ice at temperatures of 77 K are 0.7, 0.3, and 0.1 molecules H2/100 eV, respectively (Johnson and Quickenden, 1997).
4.3. Comparison with terrestrial H2 production rates
Calculated H2 production rates for martian microfractured rock overlap with calculated rates in Earth's basaltic seafloor. In the upper 100 m of South Pacific basalt, production rates range from ∼0.02 to 0.6 nM/year (Dzaugis et al., 2016). Calculated martian production rates for water-saturated low-porosity sediment with the radioisotope composition of the Mars 2020 sites generally exceed those of South Pacific basement basalt. Rates for water-saturated, high-porosity martian sediment (≥35%) and water-filled martian microfractures (1 μm wide) are comparable with South Pacific basalt rates. Rates for larger water-filled martian fractures (1 cm wide and 10 cm wide) are generally one to two orders of magnitude lower than South Pacific basalt rates (compare with Dzaugis et al., 2016).
Radiolytic H2 has been suggested to be the dominant electron donor in Earth's subseafloor basalt older than 10 Ma (Türke et al., 2015; Dzaugis et al., 2016). On Earth, microbes have been isolated from subseafloor basalt as old as ∼71 Ma (Sylvan et al., 2015).
Although these data from Earth are intriguing in their implications for life on Mars, we do not yet have enough information to definitively calculate how much biomass consumption of radiolytic H2 might support on Mars. For example, the Gibbs energy of martian H2 consumption is not yet known, because we do not know in situ concentrations of H2 or relevant oxidants.
4.4. Enhanced H2 production
The martian rates we calculate are based on bulk GRS measurements for the 11 locations. At finer spatial scales, radiolytic H2 production rates may locally be much higher or lower, as the distribution of radionuclides is not homogeneous throughout all sediment and basalt. In Earth's oceanic crust, Türke et al. (2015) calculated radiolytic H2 production within palagonite, altered basaltic glass enriched in radionuclides and containing ∼14–38 wt % H2O (Pauly et al., 2011). This combination of high radionuclides and water content can result in high H2 production rates. Türke et al. (2015) calculated H2 accumulation rates in palagonite basalt samples taken from North Pond Area, ridge flack of the Mid-Atlantic Ridge, using radiolysis models based on Blair et al. (2007) and Lin et al. (2005a). Their calculated rates are between 0.15 and 1.75 nM/year in the rocks' intergranular water. Given fluid flow and estimates of H2 concentrations at North Pond, Türke et al. (2015) calculate that radiolytic H2 can accumulate to levels high enough in the ridge flank to support hydrogentrophic life.
On Mars, there is abundant evidence of the presence of hydrated silicate and sulfate minerals that may provide habitable environments for microorganisms (Ehlmann et al., 2009). Hygroscopic sulfate salts have also been detected in martian soils (Smith et al., 2014). Through deliquescence, these salts can produce saturated brines with very low freezing points (Davila et al., 2010; Al Soudi et al., 2017). If the hygroscopic sulfate salts contain radionuclides, this may produce another habitable microenvironment for microorganisms that obtain energy from sulfate reduction by H2. Microscale variation aside, the mean rates in bulk wet martian sediment and microfractures are capable of supporting microbial life.
H2 yields may locally be higher than those we have calculated, because some minerals catalyze radiolytic H2 production. For example, mordenite, a zeolite mineral, increases G(H2) values for γ-radiation relative to pure water by up to a factor of ∼3 (Kumagai et al., 2013). There is spectral evidence of zeolite minerals on Mars' surface (Ruff, 2004; Ehlmann et al., 2009).
Bromine-enriched brine also catalyzes radiolytic H2 production, relative to pure water; LaVerne et al. (2009) experimentally showed that Br-saturated solutions have higher G(H2) values for γ radiation than pure water. The martian surface contains evidence of past and present brines (Rao et al., 2005; Martínez and Renno, 2013). Known Br concentrations on Mars are generally low (ppm) (Rao et al., 2005); however, if Br-rich brines occur or occurred anywhere on Mars, they locally enhance (or enhanced) radiolytic H2 production.
5. Conclusion
Calculated radiolytic H2 production rates (nM/year) vary by a factor of 2 for water-saturated sediment or rock with the radioisotope concentrations of sites currently or previously under consideration as the Mars 2020 landing site. The highest calculated rates are for material with the radioisotope concentrations of Acidalia Planitia (where surface materials are enriched in U and Th).
Calculated rates for wet low-porosity martian sediment consistently equal or exceed rates previously calculated for South Pacific basement basalt. Rates for microfractured rock (with 1 μm-wide fractures) and sediment with >35% porosity at the Mars 2020 sites match the low-end of rates calculated for South Pacific basement basalt. In short, radiolytic H2 production rates in wet martian sediment and microfractured rock are comparable with rates in terrestrial regions known to harbor microbial life. Consequently, local variation in radiolytic H2 production of the ancient wet martian surface will be fruitful to consider during final selection and exploration of the Mars 2020 landing site.
Footnotes
Acknowledgments
We thank the National Aeronautics and Space Administration (Grant NNX12AD65G) and the U.S. National Science Foundation (through the Center for Dark Energy Biosphere Investigations; Grant NSF-OCE-0939564) for funding this study. This is C-DEBI contribution 388.
Author Disclosure Statement
No competing financial interests exist.
Abbreviations Used
Associate Editor: Christopher McKay
References
Supplementary Material
Please find the following supplemental material available below.
For Open Access articles published under a Creative Commons License, all supplemental material carries the same license as the article it is associated with.
For non-Open Access articles published, all supplemental material carries a non-exclusive license, and permission requests for re-use of supplemental material or any part of supplemental material shall be sent directly to the copyright owner as specified in the copyright notice associated with the article.
