




Abstract
A laboratory experiment is suggested in which conditions similar to those in the plume ejecta from Enceladus and, perhaps, Europa are established. With the use of infrared spectroscopy and polarimetry, the experiment might identify possible biomarkers in differential measurements of water from the open ocean, hydrothermal vents, and abiotic water samples. Should the experiment succeed, large telescopes could be used to acquire sensitive infrared spectra of the plumes of Enceladus and Europa, as the satellites transit the bright planetary disks. The extreme technical challenges encountered in so doing are similar to those of solar imaging spectropolarimetry. The desired signals are buried in noisy data in the presence of seeing-induced image motion and a changing natural source. Some differential measurements used for solar spectropolarimetry can achieve signal-to-noise ratios of 105 even in the presence of systematic errors 2 orders of magnitude larger. We review the techniques and likelihood of success of such an observing campaign with some of the world's largest ground-based telescopes, as well as the long-anticipated James Webb Space Telescope. We discuss the relative merits of the new 4 m Daniel K. Inouye Solar Telescope, as well as the James Webb Space Telescope and larger ground-based observatories, for observing the satellites of giant planets. As seen from near Earth, transits of Europa occur regularly, but transits of Enceladus will begin again only in 2022. Key Words: Spectroscopy—Spectropolarimetry—Life origins. Astrobiology 17, 852–861.
1. Introduction
I
Enceladus has…a textbook-like list of those properties needed for life…[and] the ultimate free lunch: jets that spurt organic material into space. (Catling, 2013)
The remarkable story of discoveries about Enceladus by the Cassini mission and science teams can be found in the work of Spencer and Nimmo (2013), with post-2013 updates at a JPL webpage 1 . Several lines of evidence, including in situ sampling of the ejecta as well as imaging and spectral data, indicate that the plumes contain material similar to that found in hydrothermal vents in Earth's deep oceans (e.g., Hsu et al., 2015). To produce properties of some of the ejected rock grains from Enceladus, the water temperature would somewhere have to exceed ≈90°C. Cassini gas phase CH4/hydrocarbon abundance ratios 102 are compatible with abiotic sources. But these measurements do not reject some production by microorganisms found on Earth called methanogens (e.g., Catling, 2013), which, as extremophilic organisms in hydrothermal vent environments on Earth, produce CH4/hydrocarbon abundance ratios ≥103. This is simply because too little is known about the chemical history of Enceladus, and we know nothing about possible biochemical environments there. Europa has three reported episodes of emission of plumes from its interior (Roth et al., 2014; Sparks et al., 2016, 2017). Its plume emissions seem to be rare compared to Enceladus.
In the last four decades, research on hydrothermal vent environments has revealed diverse and abundant life-forms, living primarily on heat and chemistry. The possible importance of such colonies of non-photosynthetic life for originating all life on Earth has been widely discussed (e.g., Gold 1992, 1999; Catling, 2013). The hydrothermal vents are distributed along Earth's tectonic plate boundaries. Tectonic activity is frequently listed as a prerequisite for habitability of planets, continually bringing mineral-rich material to the surface. Some structures on the south polar surface of Enceladus have been described as “tectonic” (Spencer and Nimmo, 2013).
Two classes of vents host very different ecosystems. Most relevant to this paper are the old (at least 30,000 years), alkaline, 90°C vents, typified by the Lost City hydrothermal field (LCHF) (Brazelton et al., 2006; Porco et al., 2017). The vents efficiently release CH4 and H2, unlike their hotter (350°C), acidic “black smoker,” 100 × younger counterparts that produce CO2, H2S, and some metals. LCHF and black smoker vents support different life-forms. The LCHF ecosystems are believed to be appropriate to the jovian and saturnian satellites, but at this stage one should not reject out of hand the possible importance of the black smokers. In the black smoker ecosystems, microbial organism concentrations are some 104 to 105 times higher than nonventing regions. The LCHF contains of order 105 cells cm−3 in the LCHF, compared with the 3 × 10²¹ number density of water molecules. We cannot expect to detect directly such cells, but the number densities of much smaller biogenic molecules associated with such cellular life should be much larger.
It seems important to try to detect signs of life in the material ejected from both Enceladus and Europa by whatever means possible. Unfortunately, the earliest planned flyby and lander will not launch before 2022, even for Jupiter, pushing back encounters until after 2028. This paper addresses the question, Might we probe this organic material remotely and attempt to provide the first evidence for extraterrestrial, simple life? We will conclude, surprisingly, that we already have in place both the needed instrumentation and techniques to attempt such measurements. However, new laboratory work is also needed to mimic conditions of the water ejected by the satellites into space. So here we put forward a program of research that involves extremely high sensitivity imaging spectroscopy routinely used in solar work together with some of the most advanced telescope systems on the ground and in space to attempt such measurements.
Specifically, the ideas expounded here are to measure, differentially, the absorption spectrum of the plumes as each satellite transits the parent disk (Judge, 2016). Such measurements will record dips in the planetary light as both the opaque satellite and the plume material make their disk passages. Circumstances of the transits are listed in Table 1.
Data are standard sources, some computed using the JPL ephemeris and, for plumes, references in the text.
To proceed, we first look at similarities between the transit spectroscopy and solar spectropolarimetry. Then we propose laboratory work to discern whether spectral biosignatures exist in water sampled from diverse biological habitats in Earth's oceans. Lastly, we explore the feasibility of the proposed research using some of the world's largest telescopes.
2. Commonalities with Solar Spectropolarimetry
These ideas have a superficial similarity to work in the exploration of exoplanetary atmospheres; both use transits, and both seek weak signals against a very bright background. But there are significant technical differences: Firstly, exoplanet transits are spatially unresolved, but satellite transits must be spatially resolved in order to fill as much of each pixel with plumes. Secondly, satellite transits are subject to detrimental seeing-induced noise as images are blurred rapidly in time by Earth's atmosphere. Lastly, as the satellite/plume advances across the planetary disk, the background scene is changing in time.
All in all, the proposed observations of satellite transits have much more in common with solar work, in particular solar spectropolarimetry, than with the exoplanet transit work. Modern solar observations at visible and IR wavelengths are generally performed near the diffraction limit by using adaptive optics, image reconstruction techniques, and splitting light into both wavelength and polarization states. Several authors (e.g., Landi Degl'Innocenti, 2013; Judge, 2017) have recently reviewed the challenges facing modern solar spectropolarimetry.
The commonalities in the needs for transit spectroscopy and solar spectropolarimetry are as follows: • Both require very high signal-to-noise (S/N) ratios. In the solar case, information on the magnetic field is often encoded in signals as small as 10−4 of the measured intensity; in the plumes, the small optical depths and geometric sizes of plume material will lead to similarly small signals of interest. • The highest angular resolutions possible, close to diffraction limits, are needed in both cases. In the Sun, we try to resolve spatially intermittent magnetic fields interacting with plasma at the smallest scales possible, and Enceladus' plumes are a mere 0.016″ long, filling a small fraction of the area of the spectrograph slit. • The small physical scales and rapid changes of the Sun's magnetic field, and of the plumes and their transit across planetary features, both set limits on the largest acceptable exposure times (Table 1). • Rapid (≫1 Hz) variations in the seeing conditions present a serious problem. Adaptive optics (AO) must be brought to bear because the targets (e.g., sunspots on the Sun, satellites on the planet's disk) show structured objects that cover small angular areas.
One advantage presented by satellite plume observations is that, unlike the Sun, we can simply sum all exposures, because we seek an average spectrum. In contrast, modern solar data require integration times of at most seconds to avoid smearing dynamical phenomena of interest. This difference makes up, to some degree, for the much dimmer planetary surfaces.
3. Needed Laboratory Work
Transmission spectra of seawater should be obtained in the laboratory, between the atmospheric cutoff at 390 nm and, say, 10 μm, ideally with a resolution ≥104. High-intensity IR and visible light sources can be used to obtain transmission spectra through the expanded vapor.
To approach the very low density and pressure conditions at the plumes in space, a sample of liquid water might be made to expand into a vacuum. The number density of water molecules in the plumes can be estimated by using the scale lengths of Table 1 and measured column densities of 1.5 × 1016 cm−2 (Hansen et al., 2006). The observed columns (Hansen et al., 2006) are through the jetlike structures, which are of order a factor 10 smaller than the scale lengths in Table 1. Thus, with a path length of around 10 km for Enceladus, we find an average molecular density of water of
By most laboratory standards, this is a very low density. By using a sample of, say, 0.1 cm3 of liquid water, which contains ≈6 × 1023 × 0.1/18≈3 × 1021 molecules, densities inside a vacuum chamber of volume
Assuming adiabatic expansion with an exponent of 5/3, the final pressure would approach 0.003 dyne cm−2 (a “high vacuum” at p = 3 × 10⁻⁹ atmospheres), which would probably require multistage pumping with an ion-gauge measurement. The temperature of the vapor in the experiment would be 0.006 K, the mean speed of H2O molecules 170 cm s−1. With a gas-kinetic cross section of order 10−15 cm2, we find a collisional mean free path of 0.3 cm and a collision time of 0.002 s. For isothermal expansion, the collision time would be reduced to 10−5 s and the pressure increased to 10−4 atmospheres. The isothermal and adiabatic approximations represent the limits of short and long energy exchange times, respectively. In both cases the transmission spectra should be similar, since we will be far from sampling optically thick material. The higher number density (≈3 × 1015 cm−3) of laboratory vapor can lead to changes in the spectra of large molecules via “collisions,” because the molecules are packed a factor of 50 closer in the laboratory than in plumes. It is appropriate, therefore, to vary the densities of the water molecules to look for systematic effects of collisions between any larger molecules and the water vapor substrate.
What kind of water ecosystems should be measured? Known oceanic ecosystems on Earth are based on only two sources of energy (e.g., McKay et al., 2008): sunlight and chemical energy, the second of which was recognized only in 1979 (Corliss et al., 1979). In the absence of sunlight, deep in the ocean there is abundant life deriving its energy from chemosynthesis.
The purpose of the laboratory work is therefore to discern whether such biosignatures appear detectable through spectroscopy, for we cannot judge from existing work what signatures might be present. We anticipate performing an experiment along the following lines. A sample of various sources of sea water and fresh water should be measured differentially against one another. These must include the following: (1) Water from several regions close to hydrothermal vents that are abundant in chemosynthetic life-forms, from both high-temperature (300°C) acidic (black smoker) and low-temperature (90°C) alkaline fumaroles, should be examined; (2) Normal seawater; (3) Water from land-surface geysers.
In all cases, differential measurements of the same water samples, but with large molecules and organisms removed (by physical and/or chemical means), should be made. The experiment might proceed as follows. A vacuum chamber equipped with a suitable window and with a volume of ≈1 m3 should be dried and pumped down to less than 10−9 atm. A cell containing water samples can be suddenly opened to the vacuum chamber. During this dynamical expansion and relaxation phase, time-resolved spectra should be obtained by using a grating IR spectrometer owing to the small dynamical times of less than a second. Spectra should be obtained prior to, and after, the rapid expansion phase to allow differential measurements. The experiment can be repeated until sufficient S/N ratios are achieved (≥104). Spectral sensitivity to different pressures and temperatures should be investigated. Finally, it might be that, with the helical handedness of many biomolecules, attempts at circular polarization measurements might be profitable. It is not inconceivable that such measurements will ultimately help us understand the overwhelming bias of life on Earth toward one chirality.
4. Calculations
Here, we show that the transit measurements proposed are feasible. The question of whether or not biosignatures can be detected depends critically on the outcome of the laboratory work and on acquisition of the highest possible S/N ratios of the planets. We proceed in a spirit of scientific exploration of the unknown, assuming that the laboratory work is successful. Here, we perform some order-of-magnitude calculations to assess the likelihood of success. We will present Enceladus in detail, showing the experiments to be worthwhile. The numbers in Tables 1 and 2 show that Europa is a far easier target, if it can be caught during a rare episode of ejection of matter.
Milliarcseconds.
Fehlmann et al. (2016).
The Strehl ratio is defined as the peak intensity of a point source divided by the peak intensity of the (theoretical) diffraction-limited point spread function (PSF). If the PSFs have a similar shape, then the rms seeing disk is of order the inverse of the Strehl ratio larger than diffraction.
Johnson et al. (2014).
van Dam et al. (2006).
Keszthelyi et al. (2016).
NIRSpec and NIRC-2 data are from instrument web pages,
Note that the 30 mas/s maximum slew rate for JWST at Jupiter corresponds to ≈110 km s−1 at the planet.
Figure 1 shows the geometry of transits for the two satellites, together with boxes that represent spatial pixels of angular size 0.05″ and 0.1″ that are representative of conditions under which observations appear possible (cf. Table 2). A balance must be struck between angular resolution and the need to detect plume absorption. While absorption cross sections are high at UV wavelengths, and diffraction-limited angular resolution is also high, UV photon fluxes are very low. Photon fluxes from scattered sunlight from the planetary atmospheres are 3 and 2 orders of magnitude lower at 0.15 and 0.2 μm compared with 2 μm, respectively (using reflectivities from the work of Morrissey et al., 1995). Estimates (below) of optical depths of even abundant species (such as CH4) in the plumes show that they will be small, τ≈10−3. The signals desired will be a fraction≈τ of the intensity. These signals will be diluted further because of the small apparent sizes of the plumes, which, for Enceladus, lie below the resolution of most instruments, and for Enceladus and Europa the detrimental effects of atmospheric seeing must be mitigated. A further difficulty for Enceladus is that the velocity of the transiting satellite limits integrations times to, at most, a few seconds (see Table 1), after which the plume intercepts a different part of the planetary surface and, hence, surface features behind it. All of these considerations point to optimal wavelengths between 0.5 and 5 μm to find a balance between brightness (which falls rapidly at shorter wavelengths) and angular resolution (diffraction reducing the resolution at longer wavelengths, as 0.24″ λ[μm]/D[m], D = telescope diameter in meters). In the calculations below, it can be seen that, even at the brightest parts of the spectrum of Saturn and Jupiter, we will be limited by photon noise. Observing between 0.5 and 5 μm means that we will be probing signatures of vibration-rotation modes of large molecules. This region contains, in principle, a variety of spectral biosignatures (e.g., Hand et al., 2009).
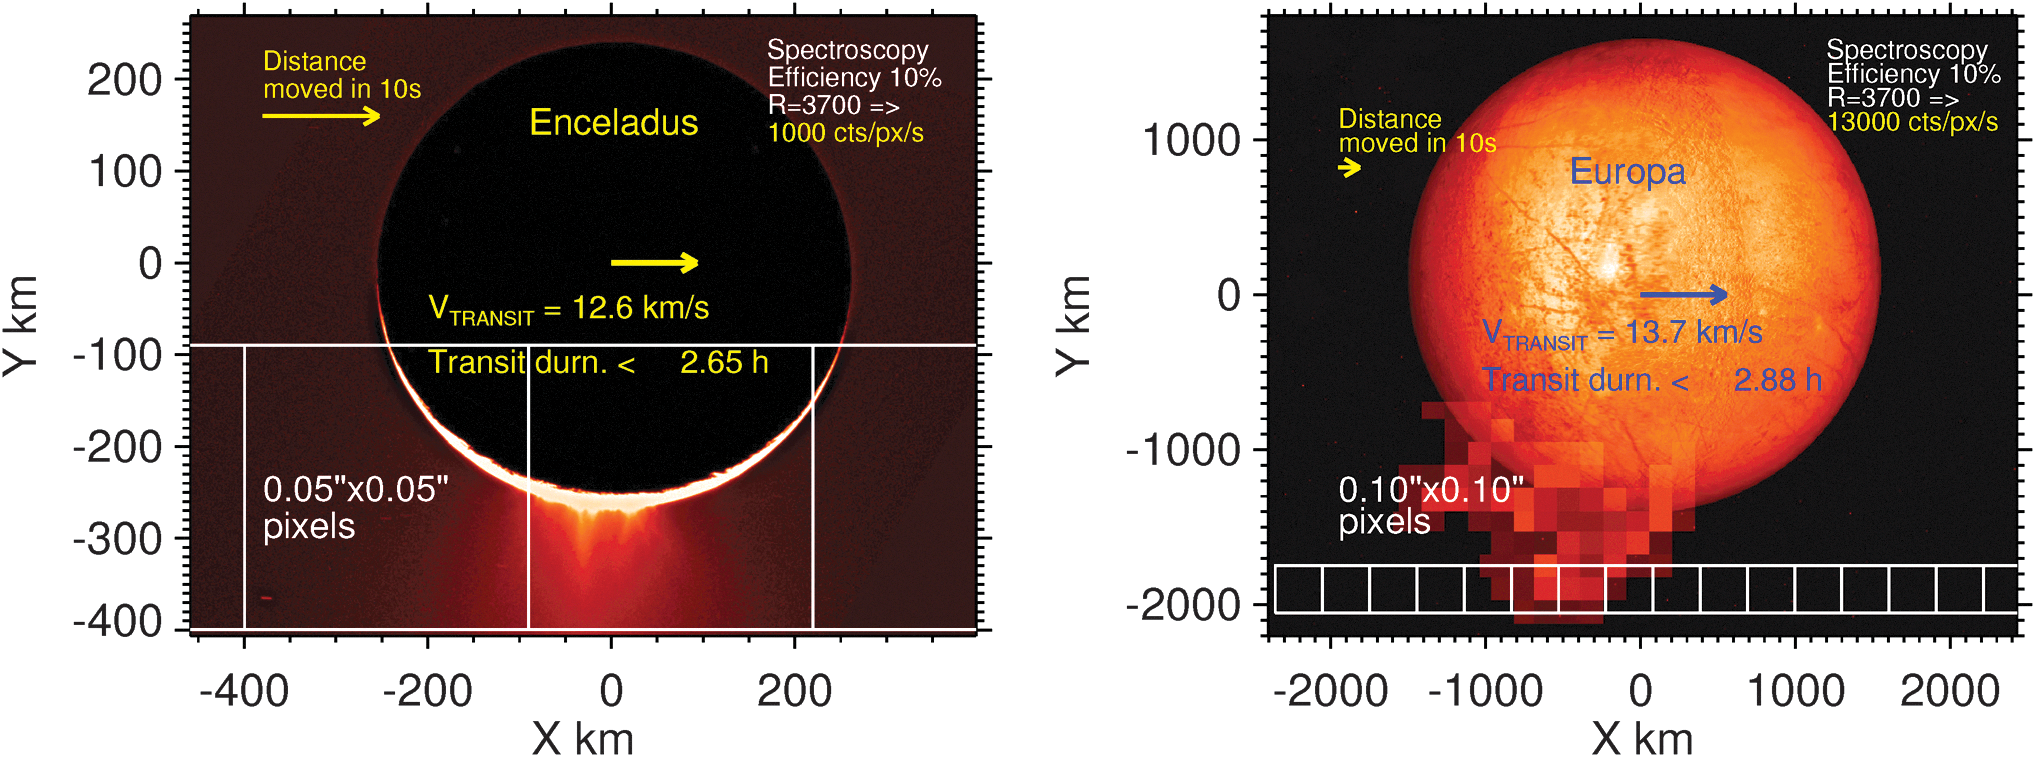
Images of Enceladus (left) and Europa (right) are superposed with data relevant to transits. The images are from NASA's websites.
5. Signal-to-Noise Estimates of Transmission Spectra for Enceladus
First, we compute the intensity (brightness) of Saturn between 0.5 and 5 microns, wavelengths at which instruments will operate in space (the James Webb Space Telescope, JWST) and on the ground (including the Daniel K. Inouye Solar Telescope, DKIST). Several well-known atmospheric transmission windows (the VRI and J-M astronomical bands) allow measurements of astronomical objects from the ground at these wavelengths. Assuming for simplicity that light scattered from Saturn's cloud decks is uniformly emitted outward into 2π steradians, the reflected (scattered) light intensity from the planetary surface is
where a
ν
is the planetary albedo at frequency ν, f
ν
is the flux density of solar radiation at Saturn (♄),
and where
The flux density from an area on the planet subtending a solid angle ω steradians at a telescope near Earth is simply ωI
ν
erg cm−2 s−1Hz−1. The flux density of photons is just ωI
ν
/hν ph cm−2 s−1Hz−1, so that for a telescope with an aperture of diameter
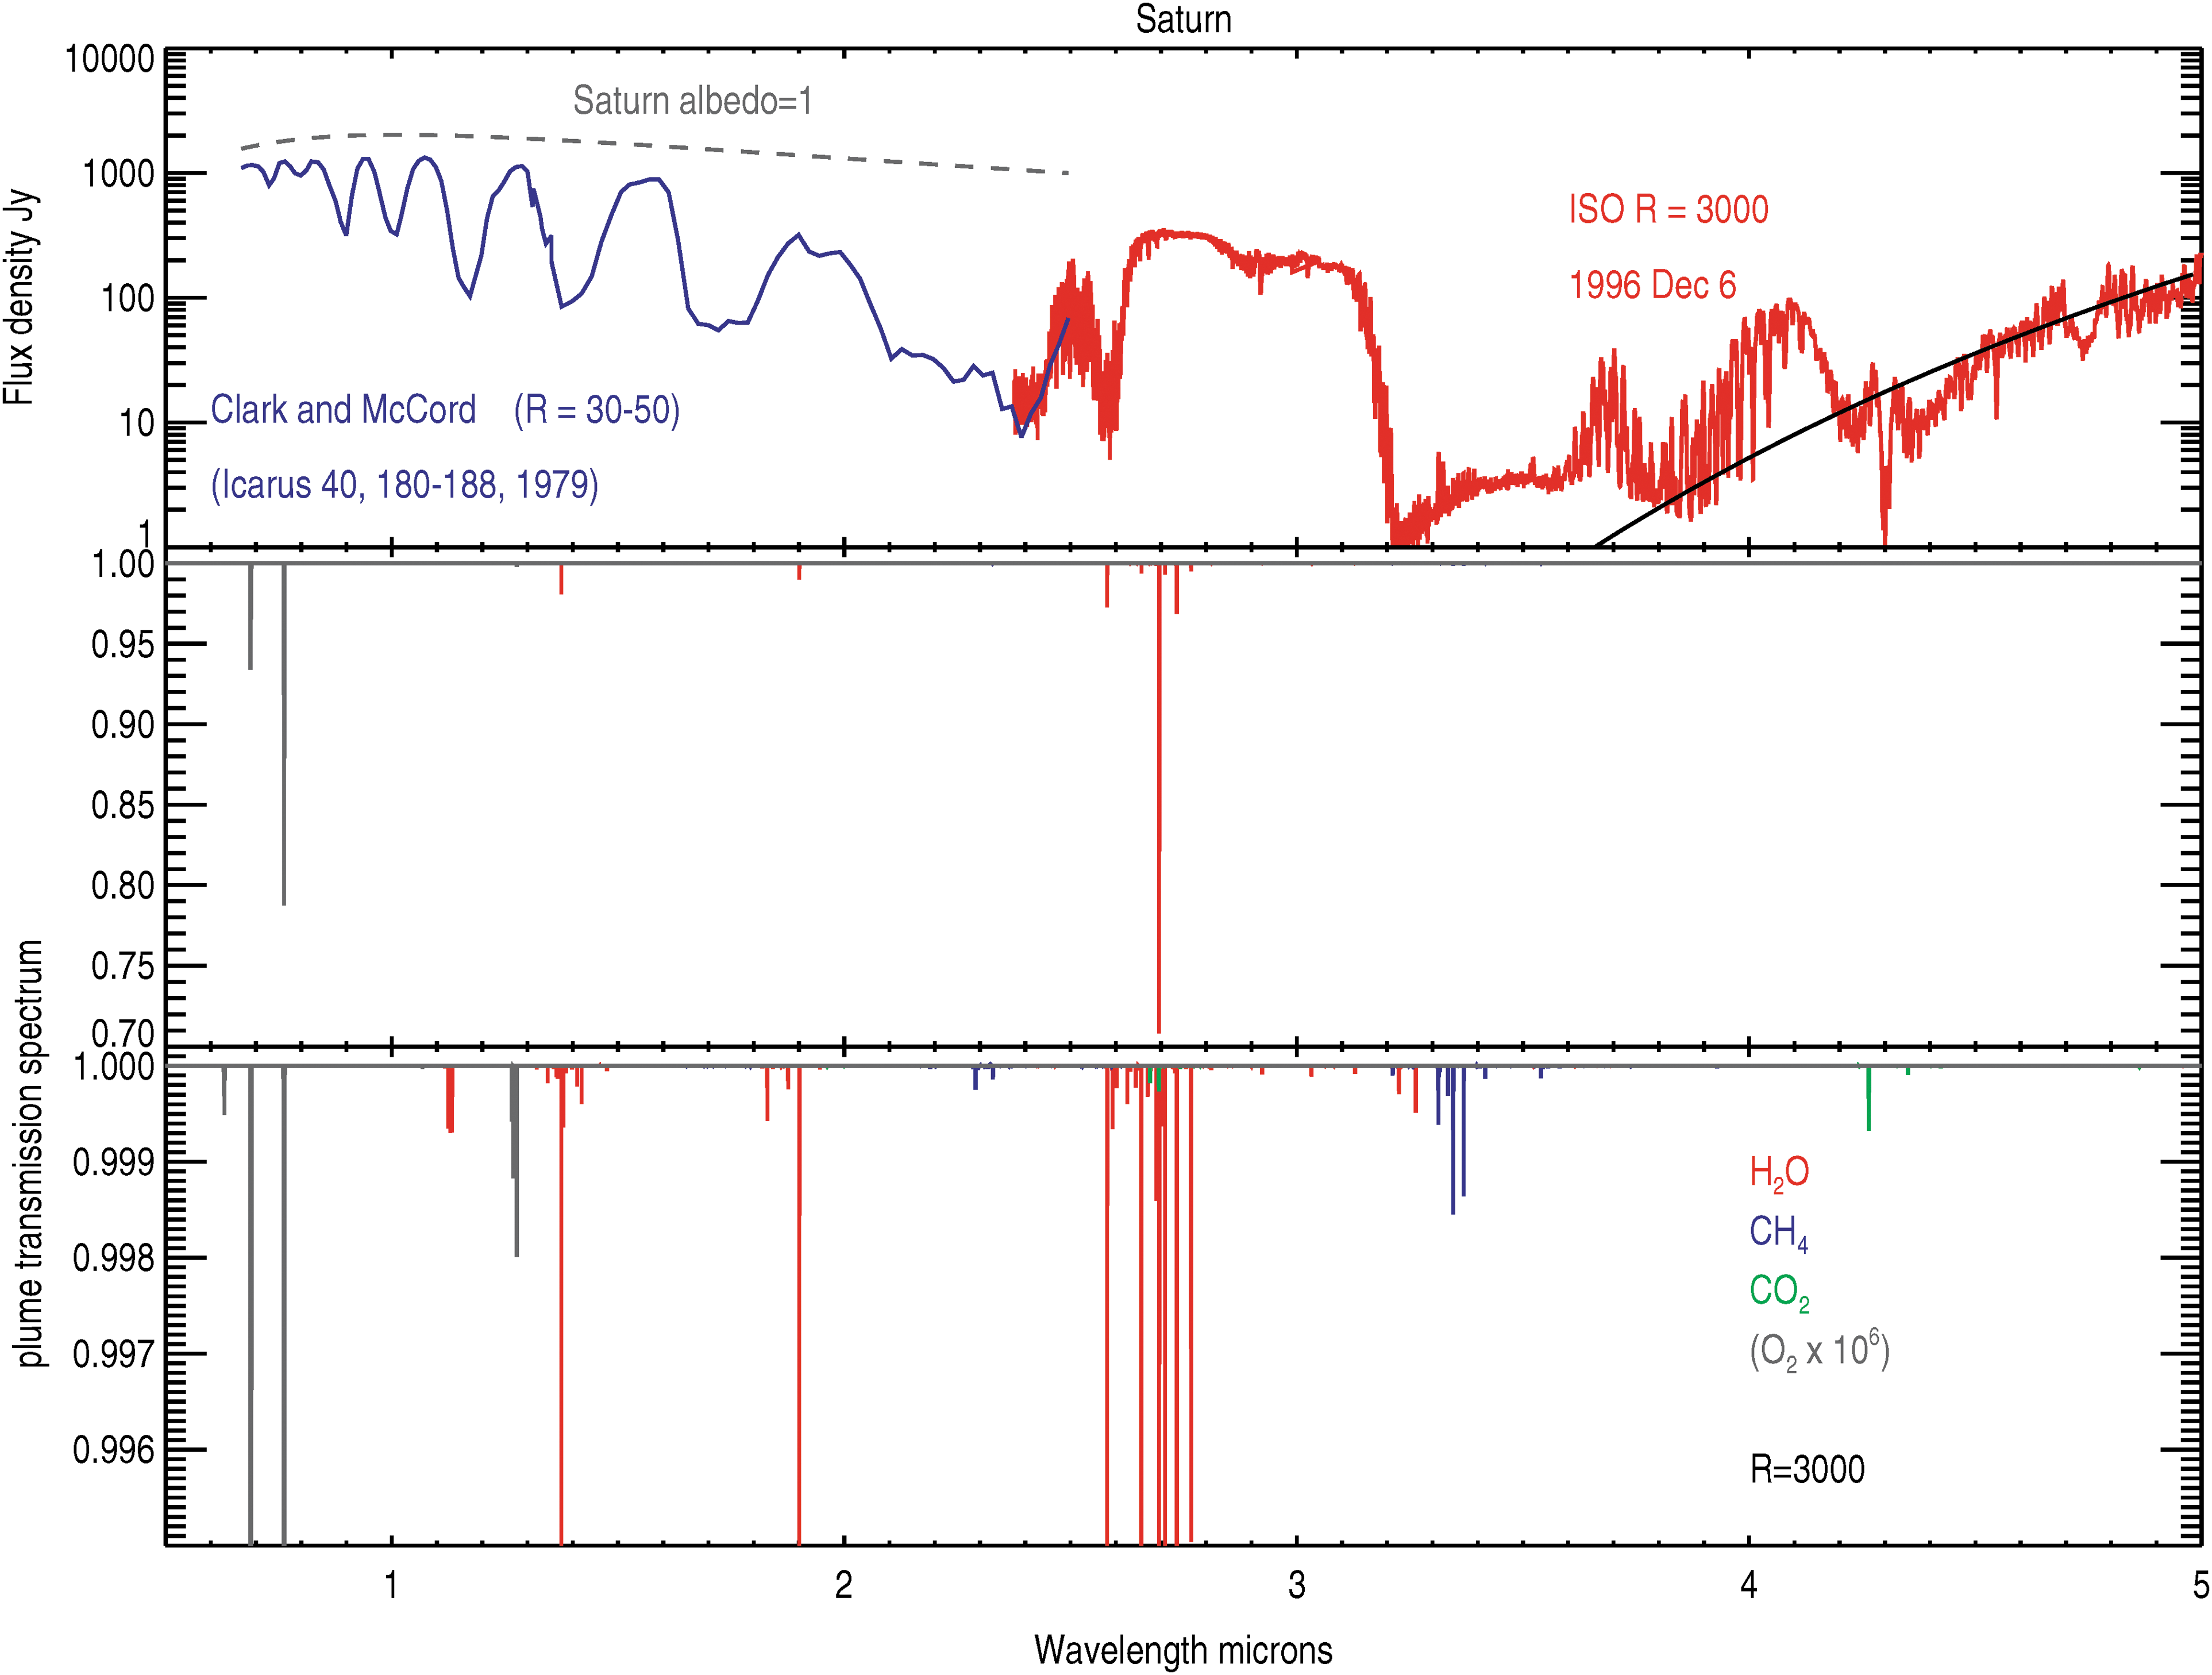
A composite visible-IR spectrum of Saturn is shown in the top panel. The dashed line shows the brightness of Saturn with a uniform albedo of 1, and the blue line shows a low spectral resolution IR spectrum from Clark and McCord (1979). The red curve shows a spectrum from the ISO satellite obtained from the ISO data archive which has a spectral resolution of about 3000. The solid black line is a blackbody flux spectrum at 174 K from Saturn. The lower panels show spectral transmission calculations for the plumes of Enceladus, scaled differently to reveal strong and weak transitions, computed using the HITRAN database (Rothman et al., 2013) using a spectral resolution of 3000. Other details of the calculations are given in the text.
It is clear because of the small size of plumes and their large distance that we must make observations close to the diffraction limit of visible and IR telescopes (Tables 1 and 2). At the diffraction limit, the angular size is close to
For a
so that the photon counting rate becomes simply
independent of the telescope aperture, where Px refers to each spatial pixel. Substituting for B
ν
in the Rayleigh-Jeans limit, we find
For Saturn, Δ♄ = 9.53 AU = 1.43 × 1014 cm. With
For a spectrograph observing Saturn with resolution ν/Δν =
For Jupiter (♃), the numerical constant of 4000 is simply Δ♄
2/Δ♃
2 = 3.4 times higher. It must also be remembered that Jupiter is closer to Earth (♁) so that potentially any plumes on Europa are far easier to resolve than on Enceladus, for a given
As stated above, the values of a ν are simply the ratio of the plotted spectra from the work of Clark and McCord (1979) and the ISO spectrum shown in Fig. 2 to the scaled Planck function to the dashed line, which varies as λ −2 at wavelengths longer than those plotted. The brightest “windows” of emission in Fig. 2 (broad peaks in the spectrum) all have a ν ≈0.3, and this value is adopted below, recognizing that other regions of the spectrum will be considerably dimmer.
While the upper panel of Fig. 2 represents the background source against which we might attempt to measure the transmission spectrum of the plumes of Enceladus, the lower panels show calculations of the expected transmission of light through the plumes. These calculations include just the abundant molecules found in mass spectrometry work by Waite et al. (2006): H2O, CH4, CO2, O2. All molecules were assumed to be in the gas phase. Hansen et al. (2006) showed that Enceladus' plumes are at least partly in the gas phase. We adopt the relative abundances from the work of Waite et al. (2006), H2O (91%), CH4 (1.6%), CO2 (3%), O2 (<1%). The H2O molecular column density was set to 1.5 × 1016 cm−2, determined from transmission spectra of the UV bright star γ Orionis during a flyby of Cassini in 2005, and the plume path length was set to the scale height of the observed plumes, 102 km (Hansen et al., 2006). The computed absorption depths of molecular lines are, as expected, roughly in proportion to the molecular abundances. We emphasize several features of Fig. 2. Firstly, the dominant absorbers leave plenty of spectral “room” for detection of other molecular species. Secondly, the emission spectrum from Saturn, while spectrally highly structured (Fig. 2), offers a bright background (>10 Jy) except for the gap between 3.4 and 4 μm. Thirdly, we see that many lines have absorption depths less than 0.001, even though these molecules have relative abundances by number exceeding 1%. To perform the proposed experiments, it is clear that we must achieve the highest possible signal-to-noise ratios. Any experiment should try to achieve a sensitivity of better than 10−4 of the brightness of the background spectrum of Saturn. This criterion implies acquiring at least 108 photons per spectral range of interest (it could be one spectral pixel or many pixels that all correspond to features discovered in the spectra of water samples on Earth, discussed below).
6. How to Achieve the Required Signal-to-Noise Ratios
The transit durations are several hours (Table 1). Using a ν ≈0.3, a system efficiency E≈0.3, we have 400 photons per spectral pixel Sx per spatial pixel Px per second. This applies to an imaging system critically sampling the diffraction limit, something that is undesirable in solar work owing to limited exposure times on the same solar scene (Landi Degl'Innocenti, 2013; Judge, 2017) but is not a problem here as it is only the background scene that is varying during orbital motion. In one transit, this system will accumulate 3 × 10⁶ photons per Sx and per Px. Given the very small angular sizes of the target plumes, we must avoid binning spatially. We might bin n S Sx pixels; then we would acquire 3 × 10⁶ n S photons per spectral region of interest per transit. Thus, one transit will require n S > 36 to acquire 108 photons per spectral element. This can be achieved with a spectral resolution R≈80, for example. By observing 10 consecutive transits, one could accumulate 109 photons under the same telescope/instrument configuration. The success or failure of this spectral measurement can then be seen to depend critically on the presence of broad features in the samples from the laboratory spectrum.
Thus, photon counting statistics limit the achievable S/N ratios to the extent that a spectral resolution of 80 appears insufficient, which can only be determined by performing the laboratory experiment. It is likely that systematic errors induced through residual image motions, inaccurate flat-fields and dark currents, instrumental secular changes in sensitivity, and other instrumental factors will, if uncorrected, limit a set of measurements to far larger systematic noise errors. This is where experience in observational solar physics can help, for ground-based solar data are plagued with similar issues. One of the major problems involves intrinsic and seeing-induced image motion of bright, extended objects, which introduces spurious time-dependent signals from neighboring pixels into the data. Such problems are absent from unresolved sources such as stars, which with care can achieve sensitivities of 105 by deep integrations and co-addition of many spectral lines (Bagnulo et al., 2009). Yet S/N ratios on the order of 5 × 10³ can be routinely obtained for the Sun (Collados et al., 2007), sometimes approaching 105 (Gandorfer et al., 2004), even in the presence of rapid image motions. These sensitivities are achieved by using a combination of all or some of the following: (1) differential techniques, including split optical beams, beam switching; (2) rapid data acquisition; (3) adaptive optics.
Figure 3 shows an example of how differential measurements might achieve the needed S/N for the case of transits of Enceladus. While Saturn is over 200 times the diameter of Enceladus, modern telescope systems with AO can correct seeing-influenced images down to rms errors of around 30 mas (the unfilled circle shows a 30 mas radius superposed on the image). The dashed boxes show a 1σ excursion of seeing-induced motions corrected by a good AO system. During an exposure of the spectrograph of order 1–10 s, light will enter each of the “pixels” shown from a random distribution of such excursions. Now, we consider how we might attempt to reach the highest S/N ratios with such measurements.
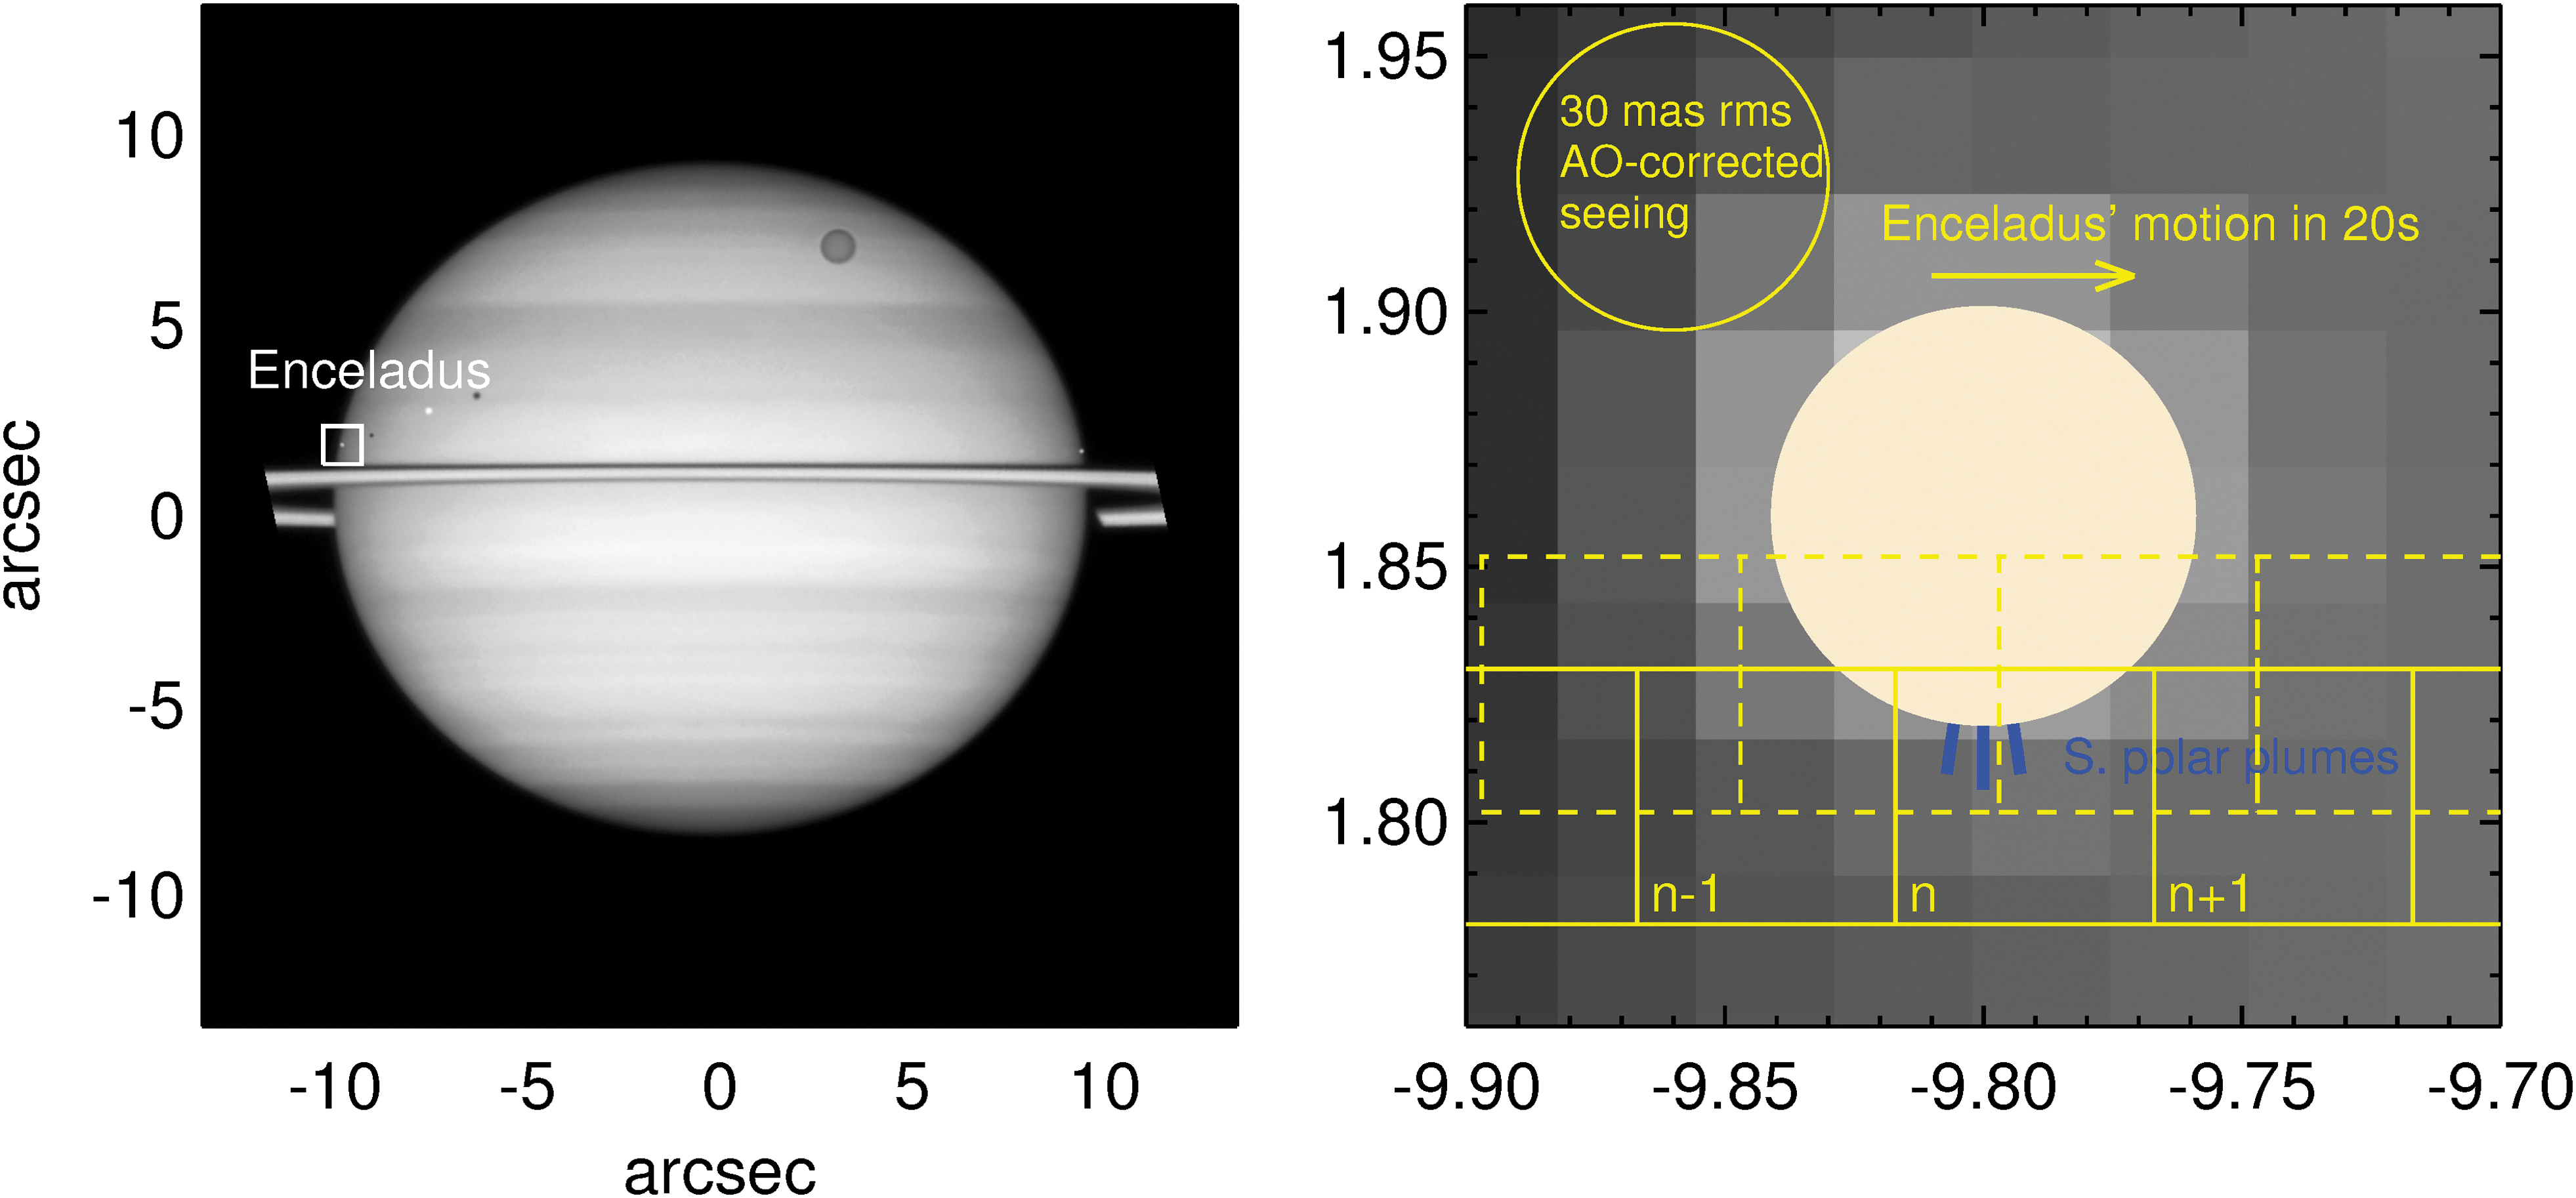
An image of Saturn obtained by the Hubble Space Telescope is shown on the left, acquired on February 24, 2009, and obtained from NASA's APOD website (
We wish to recover the absorption spectra of the south polar plumes that occupy a small area of pixels in Fig. 3. We will assume that plumes are present during the entire duration of the transit. Now, pixel n − 1 has already been exposed to Saturn's light through the plumes, some Δt≈25 s or so earlier than the image shows, for pixels of size 0.05 arcsec. Pixel n is, at the time shown, exposed to the plumes, and pixel n + 1 has yet to be exposed to the plumes. The time scale of 25 s is important for several reasons. On this timescale, we can assume that the underlying light emission by Saturn remains constant; it is modified only by Saturn's rotation of its cloud belts at the latitude observed. Close to the equator, Saturn's rotation period is about 10 h and 14 min. Close to the center of Saturn's disk the cloud decks rotate at roughly 1.6 km s−1, almost 8 times slower than the orbital velocity of Enceladus across the disk, corresponding to ≈2.6 × 10⁻⁴ arcsec per second, relative to the system's barycenter when the system is at opposition. For simplicity of exposition here, we treat Saturn as unchanging during exposures of order 25 s or so. (Of course, such corrections will be applied in any final analysis.) Then, for each spectral pixel, assuming Saturn's brightness itself is unchanging, and the instrument is stable, we find that the counts
where
Subtracting dark currents and dividing these two equations we obtain the ratio of the plume intensity to the non-plume intensity, for the same region of the planet simply as follows:
independent of the gains of each spectral pixel. This manipulation is a trick similar to that used to obtain very high S/N ratios in stellar spectropolarimetry (Bagnulo et al., 2009), to avoid dealing with gain corrections. With ≈450 such differential measurements for a full transit, we get, as before with
It seems clear that, sacrificing spectral resolution, and assuming that AO can produce imaging quality with rms seeing of around 30 mas, the differential measurements represented by the scheme shown in Fig. 3 and in Eq. 13 can get close (≈ 2000) to the desired S/N ratios (≥104) for Enceladus, for just one transit. These techniques are standard in both solar and stellar spectropolarimetry. It should be noted that Enceladus is especially challenging owing to its distance, and relatively small size, which means that modern telescopes cannot resolve the “plumes.” The plume spectra are therefore diluted further by the ratio of the fractional areas of the plume material in each pixel (see Fig. 3 for a general idea). In every technical sense, Europa is a far easier target; the surface brightness of Jupiter is larger, the documented plumes are higher, and Europa regularly transits Jupiter's disk. S/N ratios for Jupiter and Europa are larger by a factor of 3.4 (Eq. 10) and another order of magnitude because the Europa plumes should fill far more of each spatial pixel. Yet its eruptive events appear rare; they are less-well documented. Catling's “free lunch” (Catling, 2013) has its limits.
7. A Comparison of Observatories
In Table 2, we compare relevant IR capabilities of three observatories. Both the JWST and DKIST telescopes are under construction, while Keck telescopes have been in operation since 1993. DKIST is included because, being primarily a solar telescope, it is likely to have less pressure for nighttime observations, and because it has interesting capabilities. In particular, the AO system is designed to vary on a resolved bright source, not on point sources, and it is designed to do full Stokes polarimetry. Enceladus has one of the brightest surfaces in the Solar System and will likely be brighter than Saturn's disk at the wavelengths considered. One disadvantage of DKIST is the relatively high spectral dispersion of the first-light instrument CRYO-NIRSP, which reduces photon fluxes per pixel. But on the other hand, it is also a coronagraph, which makes it attractive for different kinds of observations of giant planet moons. For example, in Section 4.2 in the work of Keszthelyi et al. (2016), the authors note the need for observations with low stray light while certain moons enter the shadow of their host planet, always very close to the planet itself as seen from Earth.
We first consider the ground-based observatories. Referring again to Fig. 3 and Table 2, it is easy to see that the spectrum I
plume will contain light from Enceladus' surface during each integration as the residual seeing excursions move the sky image in and out of the spectrograph pixels. For observations from the ground, this contribution must be corrected. Quantifying the contributions to noise is a (relatively) straightforward issue once the brightness gradients between the various objects in the seeing disk are quantified (Lites, 1987; Judge et al., 2004). and if the seeing power spectrum is available. Calculations would need to be done if the laboratory experiment is to succeed. One major advantage of the transit scenario instead of solar observations is that one can observe Enceladus directly above the limb of the planet prior to, and after, transit to determine the spectral nature of this contribution. Clearly, observations from space, for example, from the upcoming JWST, can remove seeing-induced contamination when the spacecraft jitter is small enough. The JWST stability requirement (<3.7 mas) and NIRSpec focal plane geometric distortions (<10 mas) (Dorner et al., 2016) are sufficient to acquire high-quality plume spectra. However, JWST is not ideally suited to such observations, essentially because it was designed for observing much fainter objects, and the pixels under-sample the diffraction limit at the shortest IR wavelengths. This has two obvious consequences: (1) the pixel sizes of the instruments are larger than the plumes, and (2) the larger pixels collect more light, which leads to saturation of the detectors at least for imaging of Jupiter and Saturn's disks. By design, the saturation limits of the NIRSpec spectrometer on JWST, operating at its highest dispersion of
Other observatories have been examined in addition to these examples. The CRIRES spectrometer at the one of the VLT telescopes (
In conclusion, it seems that observatories exist, and will soon come into operation, which can in principle investigate the transmission spectra of plumes of Enceladus. Any plumes detected again on Europa would be far easier targets, should Europa emit additional plumes.
8. Conclusions
This paper demonstrates the feasibility of making interesting measurements of plumes erupting from the surface of Enceladus and perhaps Europa. Astronomical and laboratory experiments can, and should, be performed to try to detect signatures of biological products in the transmission spectra during transits as Enceladus crosses the bright disk of Saturn. The NIRSpec instrument on JWST can obtain very high quality differential spectra between 1 and 5 μm, but it has rather large pixels that will dilute the signals of plume material. Ground-based measurements will face the problem of dilution of signals by residual seeing motions on scales larger than the plumes of Enceladus. The situation is different at Jupiter, where any plumes present on Europa are of a much larger physical scale and easier to detect spectroscopically. The problem is, of course, that Europa clearly erupts rarely.
Lastly, since Enceladus' plumes supply Saturn's E ring with material, then similar work when the E ring is close to being “edge-on” but visibly separate from the more massive rings would seem worthwhile. The polarization and perhaps coronagraphic credentials of DKIST might be used to advantage in such observations, as well as observations of giant planet satellites that are in the host planet's shadow. In situations where the desired target lies very close to the very bright planetary disk (Keszthelyi et al., 2016), coronagraphy might be particularly valuable.
Footnotes
Acknowledgments
I am grateful to Wenxian Li for her comments and interest in the work presented here. The two anonymous referees greatly helped improve the paper, and the author thanks Carolyn Porco for her thoughts and encouragement.
Abbreviations Used
1
2