
Abstract
Estimates of the time at which life arose on Earth make use of two types of evidence. First, astrophysical and geophysical studies provide a timescale for the formation of Earth and the Moon, for large impact events on early Earth, and for the cooling of the early magma ocean. From this evidence, we can deduce a habitability boundary, which is the earliest point at which Earth became habitable. Second, biosignatures in geological samples, including microfossils, stromatolites, and chemical isotope ratios, provide evidence for when life was actually present. From these observations we can deduce a biosignature boundary, which is the earliest point at which there is clear evidence that life existed. Studies with molecular phylogenetics and records of the changing level of oxygen in the atmosphere give additional information that helps to determine the biosignature boundary. Here, we review the data from a wide range of disciplines to summarize current information on the timings of these two boundaries. The habitability boundary could be as early as 4.5 Ga, the earliest possible estimate of the time at which Earth had a stable crust and hydrosphere, or as late as 3.9 Ga, the end of the period of heavy meteorite bombardment. The lack of consensus on whether there was a late heavy meteorite bombardment that was significant enough to prevent life is the largest uncertainty in estimating the time of the habitability boundary. The biosignature boundary is more closely constrained. Evidence from carbon isotope ratios and stromatolite fossils both point to a time close to 3.7 Ga. Life must have emerged in the interval between these two boundaries. The time taken for life to appear could, therefore, be within 200 Myr or as long as 800 Myr. Key Words: Origin of life—Astrobiology—Habitability—Biosignatures—Geochemistry—Early Earth. Astrobiology 18, 343–364.
1. Introduction
W
The window during which the origin of life must have occurred is demarcated by inner and outer time boundaries. We call the outer boundary the habitability boundary. This is our estimate of the time at which Earth first became habitable for life. We call the inner boundary the biosignature boundary. This is the time of the earliest convincing evidence of life in the form of fossil and/or chemical biosignatures. In this review, we aim to bring together the many different lines of evidence that allow us to estimate the times of the two boundaries. The biosignature boundary has been reviewed by Schopf (2006) and Buick (2007). The habitability boundary has been reviewed by Zahnle et al. (2007). More recently, information pertaining to both boundaries was reviewed in a textbook by Gargaud et al. (2012). They concluded that life emerged on Earth at an uncertain date between 4.3 and 2.7 Ga. Here, we bring the latest astrophysical constraints and biological signatures together to more precisely constrain this time interval for the origin of life. This review considers more recent data that reframe the entire argument for when life emerged since the previous reviews on this topic. Much of the relevant information on the timing of the origin comes from astrophysics, planetary science, geology, and paleontology. Here, we aim to present these results in a way that is accessible to the broad scientific community.
In his review of the RNA World hypothesis for the origin of life, Joyce (2002) illustrated the timeline of events pertaining to the origin of life on Earth, and this has been widely used by various scientific communities. In an attempt to produce a similarly useful summary, we have illustrated the evidence reviewed in this article in a similar way in Figure 1, emphasizing the astrophysical evidence that leads to positioning the habitability boundary and the biological evidence that leads to positioning the biosignature boundary. Table 1 gives further information and citations of the events included in Figure 1.
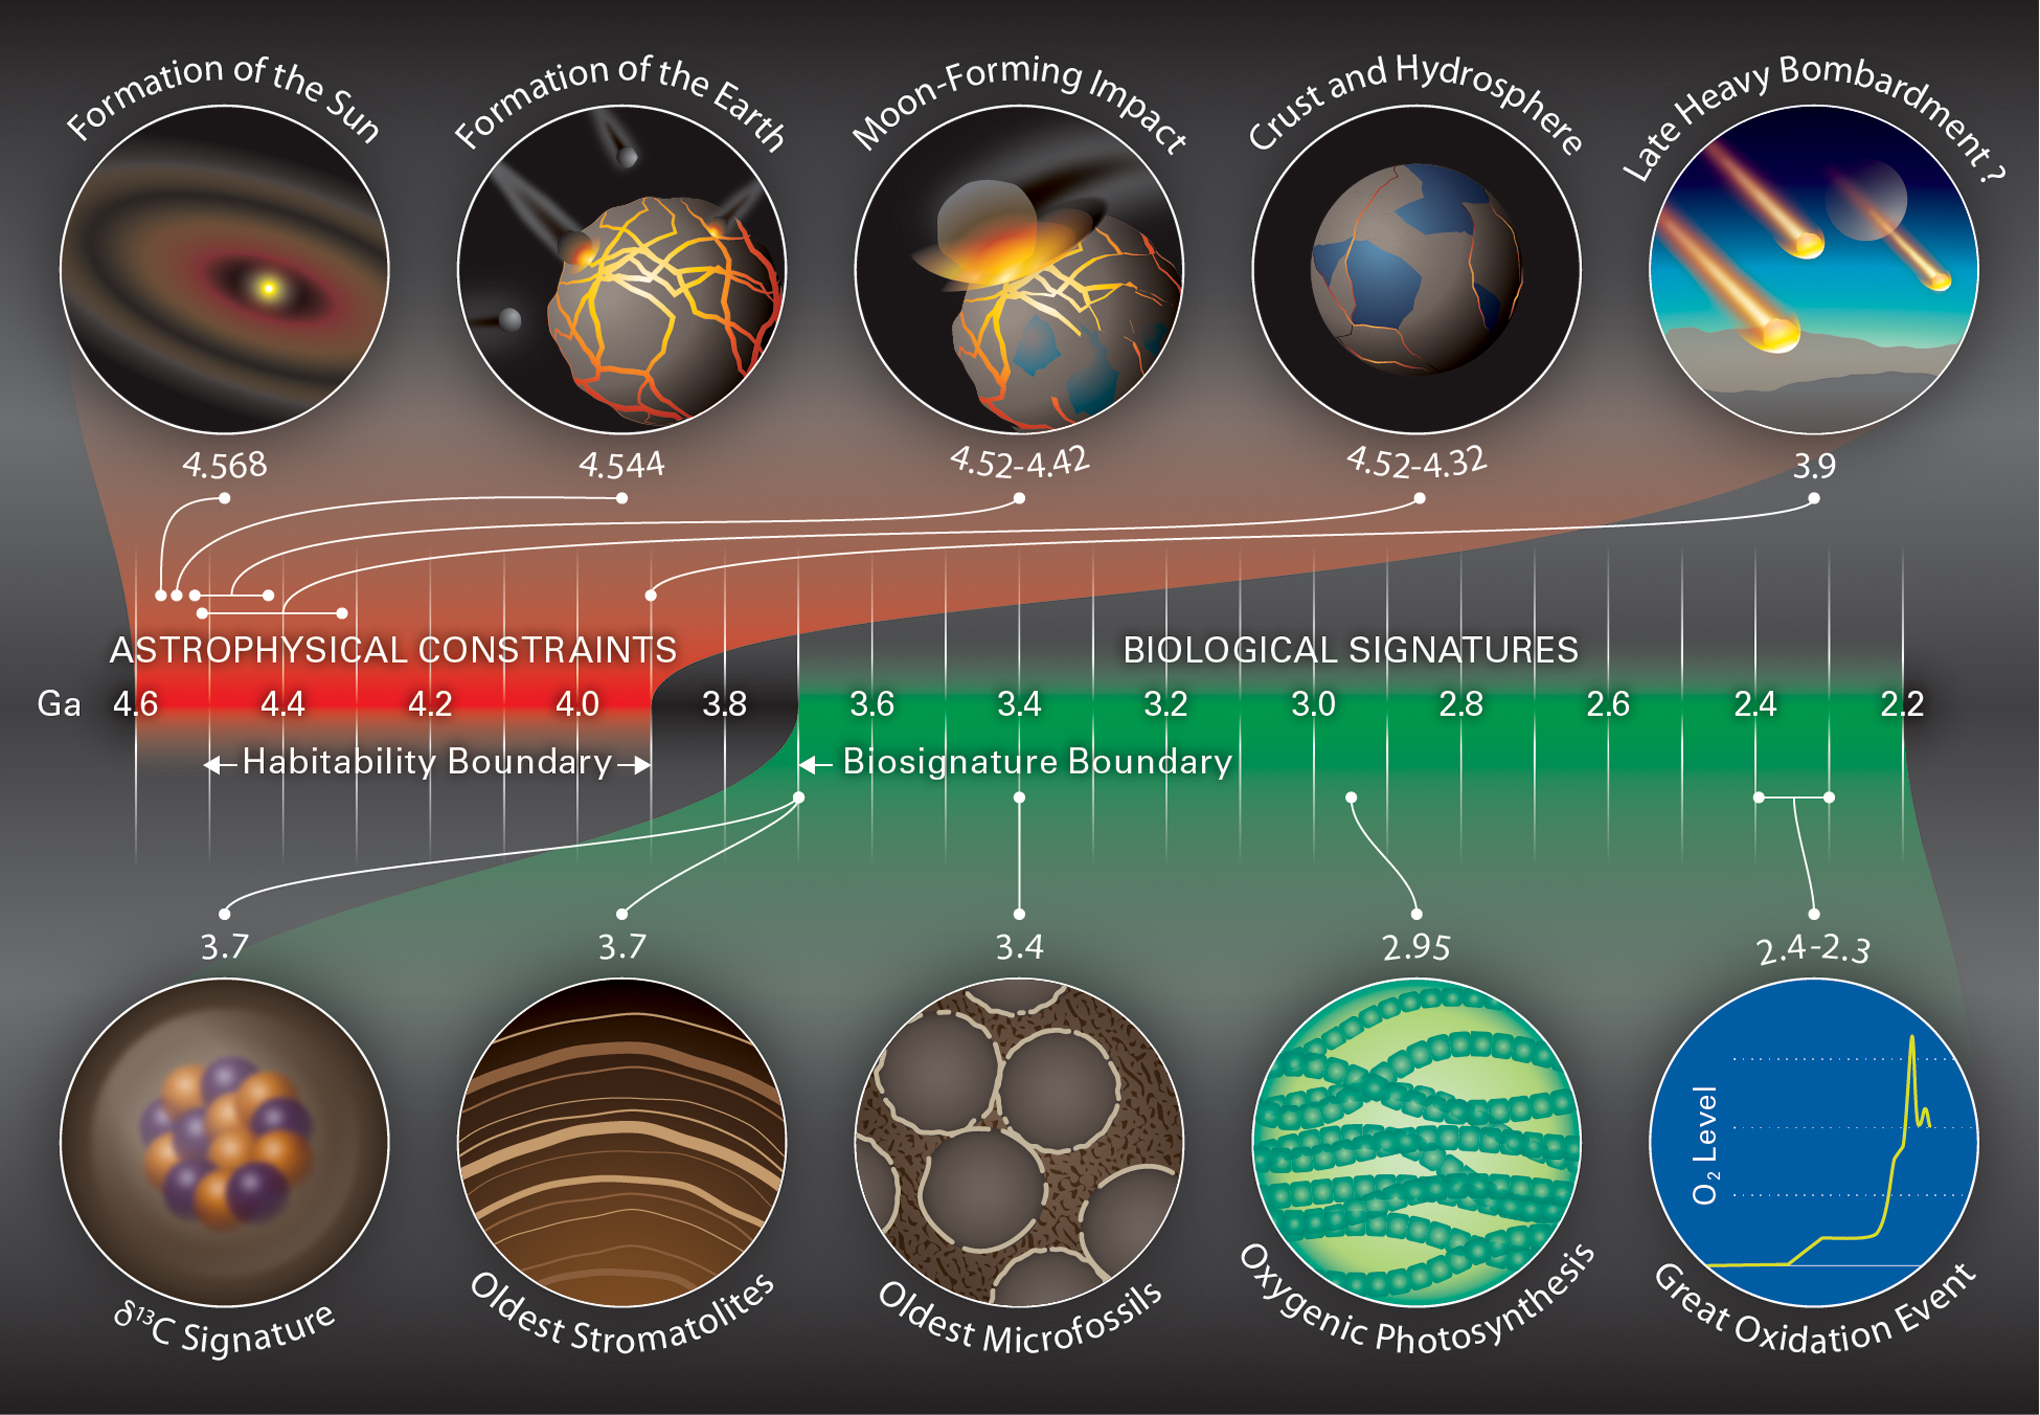
Timeline that illustrates the astrophysical constraints constraining the time of the habitability boundary and the biological signatures constraining the time of the biosignature boundary. Uncertainties about whether there was a LHB mean that the position of the habitability boundary is still poorly constrained, whereas the evidence for the biosignature boundary is beginning to converge. LHB, Late Heavy Bombardment.
CAIs = calcium–aluminum-rich inclusions; MIF = mass-independent fractionation.
We begin with the astrophysical constraints on the habitability boundary, and gather the data on the age of the Solar System, Earth, and Moon, and the radiative cooling time of Earth's liquid magma-covered surface. The habitability boundary is mainly constrained by the time at which liquid water could exist on the planet's surface. Liquid water would have been a requirement for the emergence of the kind of life that exists on Earth today. Water is often considered as a requirement for habitability because of its unique role as a universal solvent, which is why NASA has invoked a “follow the water” strategy toward searching for extraterrestrial life. We, therefore, discuss the theories of cooling of Earth's surface and atmosphere after major impact events, as these make predictions about the time at which a liquid ocean could have formed. One catastrophic impact is the collision that created the Moon, but other large impacts may have continued for a much longer period, and may have also “reset the clock” as far as habitability is concerned. The rate at which major impacts died away during the early history of the solar system and the debate about whether there was an LHB phase with a high incidence of impacts are, therefore, very relevant to the timing of the outer boundary. Independent evidence for the outer boundary comes from the geological record. The existence of certain minerals that form in the presence of water also gives constraints on the time by which a liquid ocean must have formed.
When we consider the biosignature boundary, the most direct evidence for the existence of life on Earth comes from the presence of fossils. These may be in the form of microfossils (i.e., remnants of life at the level of individual cells) or macrofossils, in particular stromatolites, which are layered structures thought to be created by photosynthetic microorganisms. The interpretation of microfossils has been controversial, and we discuss whether some of the earliest samples claimed to be microfossils are in fact of nonbiological origin. However, the timing of the biosignature boundary does not depend too much on the uncertainty around microfossils, because indirect evidence for the presence of life in the form of carbon isotopic signatures precedes most potential microfossil ages. Furthermore, stromatolite samples are known with fairly similar dates to the earliest microfossils, and the most recently proposed stromatolite samples also go as far back as the isotopic signatures.
Another form of evidence for the existence of life comes from the increase in the level of atmospheric oxygen due to the presence of photosynthetic organisms. Atmospheric oxygen is measured through geological time by using sulfur and molybdenum isotopes and transition metals in sedimentary rocks. Although a major increase in oxygen at the time of the Great Oxidation Event (GOE) (around 2.4–2.3 Ga) is well documented, it is considerably later than the likely time for the origin of life. Evidence for traces of oxygen at 2.95 Ga suggests that oxygenic photosynthesis was operating quite early. This provides constraints on the time of the inner boundary that are compatible with evidence from stromatolites.
From this consolidated research, given the uncertainty in the way the LHB unfolded, we present two possible windows for the emergence of life, confined by the two boundaries discussed in this article. To our knowledge, this is the first time such a consolidation of literature has been attempted with this goal in mind.
2. Formation of the Solar System
2.1. Formation of the Sun and the protoplanetary disk
Observations done with a variety of telescopes (e.g., the Hubble Space telescope, the Atacama Large Millimeter Array, and the Submillimeter Array) show that dusty, gaseous “protoplanetary” disks exist around all young stars (Andrews et al., 2010, 2016; Dutrey et al., 2014). The gas phase in such disks lasts 1–10 million years so Jupiter-mass planets must have formed within that time (e.g., review by Dutrey et al., 2014). It was during this time that the central stars assembled by accreting material from these surrounding disks. Rocky planets were assembled somewhat later from collisions between the left-over planetesimals and sub-Mars-sized objects in the now gas-free disk (Righter and O'Brien, 2011). Our solar system likely formed in this way. It all begins within dense molecular clouds in space, where even denser regions called “cores” about 0.3 light-years across form (Krumholz, 2008). These cores cool and eventually collapse under their own gravity to form stars. And because they started with some nonzero angular momentum, the system collapses into a disk out of which forming stars accrete their gas (McKee and Ostriker, 2007; Krumholz, 2008).
The age of the Solar System can be defined as the time in which the first solid grains formed in the nebular disk around our protosun (Bouvier and Wadhwa, 2010). The oldest material in the Solar System is found within chondritic meteorites, which is the most common type of meteorite found on Earth. These meteorites are rocky and undifferentiated, which is to say, their meteorite parent bodies (i.e., 100 km-sized, rocky bodies known as planetesimals) never reached high enough temperatures to melt internally. Most of the meteorites that end up on the surface of Earth are just fragments of planetesimals that were left over from the process of planet formation. The estimate of our Solar System's age is 4.568 billion years old (Bouvier and Wadhwa, 2010), and comes from the 207Pb–206Pb isotopic dating of the oldest material within these meteorites, the so-called calcium–aluminum-rich inclusions (CAIs). 207Pb and 206Pb are the final decay products of decay chains that begin with 235U and 238U, whose half-lives are ∼0.7 and ∼4.47 Gyr, respectively. CAIs are submillimeter-to-centimeter-sized grains that are thought to be among the earliest solids to have formed in the protoplanetary disk. This is due to the fact that they form mostly from oxides and silicates of calcium, aluminum, magnesium, and titanium, which condense at high temperatures, and, therefore, would be among the first solids to form every where in the warm early disk (MacPherson et al., 2005).
2.2. Formation of Earth
The earliest that life could have appeared was soon after Earth's formation. Therefore, we can slide the outer boundary for the emergence of life inward from 4.568 Ga to the age that Earth formed out of planetesimals in the protoplanetary disk.
Planetary differentiation is a fundamental concept when it comes to dating the formation of Earth. The internal composition of Earth varies at different depths due to the tendency of higher density fluids to sink under gravity (and similarly, the tendency of lower density fluids to float). During planetary accretion, the kinetic energies deposited by impacts, and the gravitational energies released from the settling of metals to the core, cause significant melting (Wood et al., 2006). The compositions of Earth's layers are, therefore, influenced by the cooling rate. This is what makes hafnium–tungsten (182Hf–182W) isotopic dating a useful tool for estimating the formation age of rocky planets in our Solar System. Tungsten is a moderate siderophile (i.e., tends to bond with metallic iron and sink to the core), whereas Hf is a lithophile (i.e., tends to bond with oxygen, forming compounds that do not sink to the core) (Zahnle et al., 2007). 182Hf also decays to 182W with a half-life of ∼9 Myr (Zahnle et al., 2007). Now, if planetary accretion and differentiation ceased before all the planet's 182Hf decayed into 182W, one would find positive 182W abundances in the primitive silicate mantle. This means one can estimate how long the planet was accreting, melting, and differentiating materials by measuring the abundance of 182W in samples of the primitive mantle. Based on models comparing the tungsten isotopic data measured in meteorites against those of the bulk silicate Earth (BSE) (i.e., the primitive mantle), the time for Earth to reach 63% completion is 11 ± 1 Myr, and to reach 90% completion is 24 Myr (Yin et al., 2002). These estimates push the outer boundary of the emergence of life on Earth to 4.544 Ga (when Earth had formed 90% of its mass), but several other factors shift the boundary further than this.
2.3. Formation of the Moon
It is hypothesized that the Moon formed from a giant collision between a planetary embryo (named Theia) and the proto-Earth (Touboul et al., 2007, 2009; Halliday, 2008; Canup, 2012; Ćuk and Stewart, 2012; Reufer et al., 2012; Jacobson et al., 2014; Young et al., 2016; Barboni et al., 2017). This is made evident by the nearly identical isotopic compositions of the Moon and Earth, suggesting that a vigorous mixing of materials occurred between the two bodies (Young et al., 2016). Computer simulations show how this might have occurred (Canup, 2012; Ćuk and Stewart, 2012; Reufer et al., 2012). The nearly identical isotopic signatures also suggest that the Moon was the last giant impact experienced by Earth. The formation of the Moon, therefore, sets the initial conditions for the early Earth environment.
Similar to the BSE samples, tungsten isotopic abundances were measured for lunar mantle material that was collected as part of the Apollo program and compared with meteoritic values. Models based on these comparisons estimate a date of Moon formation to be 62+90 −10 Myr after the formation of the Solar System (Touboul et al., 2007, 2009). Halliday (2008) used Sr isotopes of lunar rocks to constrain the Rb–Sr age of the Moon to 87 ± 13 Myr after the Solar System formed. Rb–Sr dating is based on the isotopic decay of 87Rb to 87Sr, which has a half-life of 48.8 Gyr. Most recently, Barboni et al. (2017) coupled U–Pb and Hf isotopes from lunar zircons to develop a two-stage model age for the Moon, constraining its formation to 58 ± 10 Myr after the formation of the Solar System. Lunar zircons are robust against isotopic disturbances from post-Moon formation impacts, making this model one of the most precise to date (Barboni et al., 2017).
Another line of evidence from astrophysical simulations confirms the results from isotopic dating. Jacobson et al. (2014) used dynamic simulations involving many small particles interacting under their own gravity to estimate the Moon formation age. By running several simulations beginning from a disk of planetesimals and planetary embryos, Jacobson et al. (2014) found a clear statistical correlation between the time of the last giant impact (i.e., embryo–embryo collision) and the subsequent accreted mass for Earth-like planets. They then compared the best estimate of Earth's late-accreted mass inferred from highly siderophile element abundances in Earth's mantle (e.g., rhenium, osmium, iridium, and ruthenium) relative to those in chondritic meteorites to estimate the time of the last giant impact on Earth. Based on this analysis, Jacobson et al. (2014) estimated the time of the Moon-forming impact to be 95 ± 32 Myr after the formation of the Solar System. This result agrees with the results from isotopic data by Touboul et al. (2007, 2009), Halliday (2008), and Barboni et al. (2017). By making no preference between the three isotopic analyses or the dynamic simulations as methods to estimate the Moon formation age, we can slide the outer boundary for the emergence of life farther inwards, to 4.416–4.52 Ga.
3. Habitability of Earth
3.1. Radiative cooling of the magma ocean
The energy deposited by the Moon-forming impact melted the proto-Earth's mantle and caused a global magma ocean (Touboul et al., 2007; Jacobson et al., 2014). Hydrodynamic (i.e., fluid flow) simulations of Moon-forming impacts on the nearly fully formed Earth show postimpact mantle temperatures in excess of 7000 K (Canup, 2004). Any solid mantle that survived the impact would have likely sunk down to the hot core and then melted (Zahnle et al., 2007). At this stage, Earth had accreted the majority of its material and began to cool. The atmosphere of the newly melted Earth, composed of mostly rock vapor and silicate clouds, would have lasted through cooling for ∼1000 years (Zahnle et al., 2007). During this time, silicates would condense and rain down onto the Hadean Earth's surface at a rate of a meter per day (Zahnle et al., 2007). As Earth's surface continued to cool, large temperature differences were created between both the surface and the interior, and the atmosphere and the surface, which initiated convection cycles (Zahnle et al., 2007; Lebrun et al., 2013; Monteux et al., 2016). Convection would promote cooling by continually bringing mantle gases to the surface where they can then rise to the top of the silicate clouds and radiate (Zahnle et al., 2007). This means that the magma mantle was likely devoid of gases after cooling. Once the early Earth had cooled enough for the silicate clouds to rain out, the early atmosphere would have been composed of the remaining volatiles that were outgassed during convection cooling. For ∼0.02–100 Myr, this hot atmosphere would have lived above a deep magma ocean (Zahnle et al., 2007; Lebrun et al., 2013; Monteux et al., 2016). Thermal blanketing by the hot atmosphere and the surface temperature of the magma ocean would have determined the rate at which Earth radiatively cooled. The cooler the surface and thicker the atmosphere, the more effective the thermal blanket. To understand this, imagine a hot surface heating up the atmosphere, causing it to puff out. By increasing the volume of the atmosphere, the atmospheric density decreases. Only the top of the atmosphere—where pressures are less than a few 10ths of a bar—radiates into space (Kasting, 1988), thus by expanding the volume of the top of the atmosphere, more radiation can escape. As the surface cools, the atmosphere cools and contracts, decreasing the volume of the top of the atmosphere, allowing the thermal blanket to trap in more radiation. When the surface of Earth dropped to some temperature below ∼1800 K, a constant, inefficient rate of cooling began (Zahnle et al., 2007; Lebrun et al., 2013).
Tidal heating by the Moon would have also played a role in maintaining the magma ocean (Zahnle et al., 2007; Lebrun et al., 2013). Tidal heating is the result of the different strengths of the Moon's gravitational force on the near versus far sides of Earth. These forces are large for two bodies orbiting close to one another. For example, the Moon orbits Earth at a distance of ∼100 Moon diameters, and the highest tides on Earth reach up to about 12.2 m. Tidal forces can cause a spherical body to stretch into an oblate spheroid, which compresses and restretches to adjust for rotation and orbit. This stretching and compressing cause friction between solids in the body, which generates heat and allows the solids to melt. The strongest source of friction would be in materials that are solid, but nearly melting (Zahnle et al., 2007). Since the Moon formed, Earth's tides have been transferring angular momentum from Earth's spin to the Moon's orbit (Ćuk et al., 2016). Over time, this has slowed Earth's rotation, and expanded of the Moon's orbit (Ćuk et al., 2016), which means during the Hadean, tidal forces were stronger and Earth's tides fluctuated more rapidly (Lathe, 2004). For about the first 1.4 million years after Moon formation, tidal forces were strong enough to aid in prolonging Earth's magma ocean (Zahnle et al., 2007). During this time, tidal heating would have generated about the same to one order of magnitude less heat than absorbed sunlight, and two to three orders of magnitude more heat than radioisotopes (Zahnle et al., 2007).
Calculations by Monteux et al. (2016), Lebrun et al. (2013), and Zahnle et al. (2007) have shown that the Hadean Earth would have maintained a magma ocean, and remained above the boiling point of water for ∼0.02–100 Myr. These calculations consider a variety of effects, including convective heat transport, radiative cooling, absorbed sunlight, water's solubility in liquid basalt, and tidal heating. Once the magma ocean solidified, water condensed and rained down to the solid surface at ∼1 m per year (Zahnle et al., 2007) forming Earth's oceans in just a few thousand years. The outer boundary for the emergence of life can, therefore, be moved inwards, to when Earth was cool enough to maintain liquid water on a solid crust. This would be between 4.316 and 4.52 Ga if we consider the range in Moon formation ages and take no preference to whether cooling was efficient (20 kyr) or inefficient (100 Myr).
3.2. Evidence of a continental crust
Zircons (ZrSiO4) are minerals that crystallize from melts, and, due to their durability, represent the oldest preserved terrestrial material. Because zircons have U–Pb ages as old as 4.404 ± 0.008 Ga (Wilde et al., 2001), they can be used to glean insight about the Hadean environment. Samples of 4.01- to 4.37-Gyr-old zircons, representing pieces of the Hadean crust, have been isotopically compared with the BSE in attempts to estimate the time at which Earth's crust solidified (Harrison et al., 2005). The main idea behind this technique is that the formation of a continental crust temporarily halts elemental differentiation, freezing in the ratio of Hf isotopes in the solid crust (and zircons) at that time (Amelin et al., 1999; Harrison et al., 2005). However, since the continental crust is continuously remelted and recycled into the mantle, elemental differentiation continues at a slower rate even after crust has formed, leading to an increasingly depleted mantle. For this reason, we would expect that more recent zircons, formed in the upper mantle, would be more depleted in 176Hf/177Hf than zircons that formed from an older, less depleted mantle.
One difficulty with this approach is that the Hf isotope composition varies due to the radioactive decay of 176Lu to 176Hf. Zircons are useful in this matter since they incorporate a relatively minute amount of Lu; therefore, the effect of radiogenic decay on zircon Hf abundances can be considered negligible (Amelin et al., 1999). By characterizing the deviation of 176Hf/177Hf in zircons of various ages to that of the BSE, it is possible to determine whether the 176Hf/177Hf values follow a trend that is consistent with zircon formation from a slowly depleting mantle reservoir. Large negative 176Hf/177Hf deviations increasing in time are consistent with the formation of a continental crust. Large positive 176Hf/177Hf deviations in contrast suggest that the zircons were derived from reservoirs with high Lu/Hf ratios, which, upon 176Lu decay to 176Hf, enrich any forming zircons in Hf. Harrison et al. (2005) measured large positive and negative 176Hf/177Hf deviations from the BSE in zircons with ages as old as 4.37 Ga. However, temporal extrapolations of these results that align with today's rock record suggest that a major differentiation event took place between 4.4 and 4.5 Ga followed by continental crust growth and recycling. Since the Moon-forming impact that melted Earth's surface likely occurred between 4.416 and 4.52 Ga, the zircon isotopic analysis performed by Harrison et al. (2005) is consistent with the ∼0.02–100 Myr magma ocean solidification times calculated by Monteux et al. (2016), Lebrun et al. (2013), and Zahnle et al. (2007).
3.3. Snowball Earth?
As Earth's mantle solidified and subduction of crustal plates began to occur, CO2 would have been removed from the atmosphere due to its high reactivity with silicates (Sleep and Zahnle, 2001), and subducted into Earth's crust. If CO2 subduction occurred early, it could have continued to remove CO2 from the atmosphere until the partial pressure was well <1 bar, which is about the pressure required to maintain a clement climate on Earth. However, there is still no consensus as to when these plate tectonic processes began (Shirey et al., 2008; Ernst et al., 2016; Maruyama et al., 2017). Ernst et al. (2016) argued that Earth's surface was covered by crustal platelets by 4.4 Ga, and that episodic deep mantle- and plume-driven subduction began as early as 4.4–4.0 Ga. They reason that the terrestrial heat budget requires overturn of platelets during that time, since conduction is much less efficient than convection–advection at transferring heat. Maruyama et al. (2017) argued that an intense period of meteoritic bombardment at 4.37–4.20 Ga initiated plate tectonics on Earth by delivering water (a lubricant) and thickening the crust with lower viscosity material. Finally, Shirey et al. (2008) argued that the drastic change in trace element compositions in rocks starting at ∼3.9 Ga suggests the initiation of subduction occurred around this time. Consequently, because there is no guarantee that tectonic processes existed during the Hadean, the following discussion about a “Snowball Earth” is purely speculative.
Given that CO2 subduction led to a Hadean atmosphere much <1 bar, Earth would not benefit from solar radiative heat retention due to the greenhouse effect. Moreover, proceeding the solidification of the magma ocean, geothermal heat was likely insignificant to Earth's climate (Zahnle et al., 2007). Finally, the Sun would have been only ∼70–75% as luminous as it is today, leading to an effective Earth surface temperature of <230 K (Sagan and Mullen, 1972; Zahnle et al., 2007; Feulner, 2012). As a result, Earth's oceans would have frozen over and Earth would be in a perpetual winter until degassing of CO2 from the crust built up pressure in the atmosphere. If CO2 subduction was a quick process, the vastly changing surface conditions may have disrupted the processes of initiating life. If life began through some kind of RNA World, as seems likely (Neveu et al., 2013; Higgs and Lehman, 2015), such a frozen environment may have been advantageous. In fact, Attwater et al. (2013) experimentally formed RNA polymerase ribozymes in ice, which were capable of catalyzing templated RNA synthesis at temperatures as low as −19°C. However, if the temperature of the Snowball Earth was much colder than −19°C, large molecules embedded in the ice would cease to move, and the RNA world would be halted or slowed.
The Snowball Earth could have undergone periodic, or permanent melting due to large impactors. Sleep (2010) estimates that it takes an impactor larger than ∼300 km to boil part of the ocean, and that a few objects of this size probably impacted the Hadean Earth after the Moon-forming impact. However, this prediction is based on the statistics of small numbers, and it is also possible there were zero impactors of this size (Sleep, 2010). Slightly smaller impactors, similar to the largest lunar impactor (∼200 km), would have been more likely to impact the early Earth, and would have also warmed its surface.
Large impactors can also contribute to the loss of an atmosphere through atmospheric stripping (Quintana et al., 2016). However, N-body simulations show that it takes energies comparable with the Moon-forming impact to strip half an Earth atmosphere (Quintana et al., 2016). Nothing bigger than ∼1/12 the size of Theia impacted Earth after the Moon-forming impact (Sleep, 2010); therefore, subduction may have been a more important driver of atmospheric loss leading to a potential Snowball Earth.
The main evidence against the occurrence of a Snowball Earth is in the zircon record. The 4.0- to 4.35-Gyr-old zircon formation temperatures (∼644–801°C) suggest at least a portion of Earth maintained above freezing temperatures during this time (Watson and Harrison, 2005). Moreover, 3.91–4.40-Gyr-old zircons enriched in 18O would likely require a high level of water–rock interaction, possibly resulting from the presence of Earth oceans at 4.4–3.9 Ga (Mojzsis et al., 2001; Peck et al., 2001; Wilde et al., 2001; Valley et al., 2002; Cavosie et al., 2005). However, the possibility remains that these zircons formed in a subsurface ocean below an icy crust. Evidence of surface water on the Hadean Earth is discussed further below in the next section.
3.4. Evidence of surface water
There are three stable isotopes of oxygen: 16O is the most common, followed by 18O and then 17O. Zircon crystals preserve the 18O/16O ratio inherited from its magmatic source. δ18O is a measure of the 18O/16O ratio with respect to the standard (see Eq. 1 hereunder for a mathematical description). If a zircon formed from magma that was in equilibrium with the primitive mantle, it will have a very narrow range of 18O/16O ratios. Specifically, this range is δ18O =5.3 ± 0.3‰ (Cavosie et al., 2005; Valley et al., 2005). Low temperature liquid water–rock interactions lead to the preferential partitioning of 18O into minerals, because the bonds formed by 18O in minerals are stronger than those formed by 16O (Bindeman, 2008). Therefore, if a zircon formed from magma whose parent rock had prolonged contact with low temperature H2O, the water–rock interactions will have enriched the parent rock in heavy oxygen (Mojzsis et al., 2001; Cavosie et al., 2005; Valley et al., 2005). It is possible that closed-system crystallization processes can enrich the δ18O of melts by a maximum of ∼1‰; therefore, only δ18O zircon values >6.5‰ are interpreted as evidence of liquid water interacting with a solid crust (Valley et al., 2005).
δ18O values >6.5‰ have been measured in 3.91–4.40 Ga zircons, and have been interpreted as evidence for surface water on the Hadean Earth as early as 4.4 Ga (Mojzsis et al., 2001; Peck et al., 2001; Wilde et al., 2001; Valley et al., 2002; Cavosie et al., 2005). Liquid water was, therefore, likely present consistently throughout the Hadean eon.
Evidence of liquid surface water from the zircon record is consistent with the habitability boundary constrained thus far (4.316–4.52 Ga). Because there are no discovered zircons with ages older than 4.4 Ga, this technique cannot determine whether surface water was present on Earth before that time.
3.5. The Late Heavy Bombardment
A short and intense bombardment of asteroids and comets may have occurred on the early Earth at around 3.9 Ga. This hypothesis is termed the LHB, or the late lunar cataclysm. The occurrence of the LHB, and, therefore, its role in the origin of life, remains contentious. The strongest evidence for the LHB came from data taken by the Apollo program. 40Ar–39Ar isotopes have been used to date the lunar basins, which were formed by large asteroid impacts at 3.85 Ga (Imbrium), 3.89 Ga (Serenitatis), 3.91 Ga (Crisium), and 3.92 Ga (Nectaris) (Ryder et al., 2000). These basin dates are supportive of a cluster of 100 km-sized asteroid impacts around 3.9 Ga. Furthermore, because the probability of asteroid impacts decreases with increasing impactor size, the Moon was likely also struck by hundreds of 10 km-sized asteroids at that time (Wilhelms et al., 1987). Given that Earth has a gravitational cross section 20 times the size of the Moon, it was likely bombarded by 20 times as many asteroids, some of which would have been much bigger than the biggest to have impacted the Moon.
However, this interpretation is controversial, as these basins could have also formed from asteroid impacts that made up the tail end of a more sustained, declining bombardment (Zahnle et al., 2007). In fact, results from the Lunar Reconnaissance Orbiter suggest that the impact melts collected from the Serenitatis basin may be ejecta from the Imbrium basin-forming impact (Spudis et al., 2011), meaning Serenitatis could be much older than traditionally thought. Furthermore, Boehnke and Harrison (2016) developed a physical model of 40Ar diffusion in Apollo samples, and found that 40Ar/39Ar basin age histograms tend to show illusory LHB-type episodes under monotonically declining impacts. Therefore, lunar magmatism and Ar overprinting from subsequent impacts may cause us to misinterpret the cluster of lunar basin ages as a single lunar cataclysm.
Evidence for a sustained, declining bombardment dating back to the accretion of the Moon is, however, lacking. For example, the lack of impact-melted lunar samples dating before ∼3.92 Ga does not support a sustained bombardment (Ryder et al., 2000). This may, however, be due to the fact that impact glasses would shatter into smaller pieces gradually with time, given a sustained lunar bombardment (Zellner and Delano, 2015). Lunar meteorites recovered from Antarctica also have ages no older than 3.92 Ga, which supports the concept of a short intense bombardment period (Cohen et al., 2000). There is, however, another possible explanation, which is that a bias is introduced in sampling Antarctic meteorites; strong rocks near the surface of the Moon that can survive an impact, be ejected toward Earth, and survive atmospheric entry are rare and only become rarer with age (Zahnle et al., 2007).
Astrophysical simulations also support the occurrence of an LHB. In the Nice model of the formation of the Solar System (Gomes et al., 2005; Morbidelli et al., 2005; Tsiganis et al., 2005), as a result of gravitational interactions with the planetesimal disk, the giant planets begin to migrate inwards or outwards. This planetary migration leads to a 1:2 mean motion resonance between Jupiter and Saturn (i.e., Saturn's period becomes twice that of Jupiter's), which forces the orbits of Neptune and Uranus to destabilize into eccentric ellipses, allowing these planets to cross through the planetesimal disk sitting at least 1–1.5 AU beyond Neptune's orbit. The crossing of the ice giants into the planetesimal disk gravitationally disperses the planetesimals, causing many of them to be sent on Earth- and Moon-impacting trajectories. After this LHB, which occurs ∼450–850 million years after the formation of the Solar System (Gomes et al., 2005; Bottke et al., 2012), the giant planets settle into separations, eccentricities, and inclinations similar to their observational values (Tsiganis et al., 2005; Morbidelli et al., 2007). The Nice model also correctly explains the orbital distribution and total mass of the Trojan asteroids (Morbidelli et al., 2005).
In Table 2, we summarize the main pieces of evidence that generally support either the LHB or a sustained declining bombardment on the early Earth. All things considered, there is insufficient evidence to reject the occurrence of an LHB; however, more lunar research is required before a consensus in the field can be reached. Four possible models for the late lunar bombardment are illustrated in Figure 2, which are calibrated to the crater counts and surface ages at the Apollo landing sites (figure reproduced from Zahnle et al., 2007).
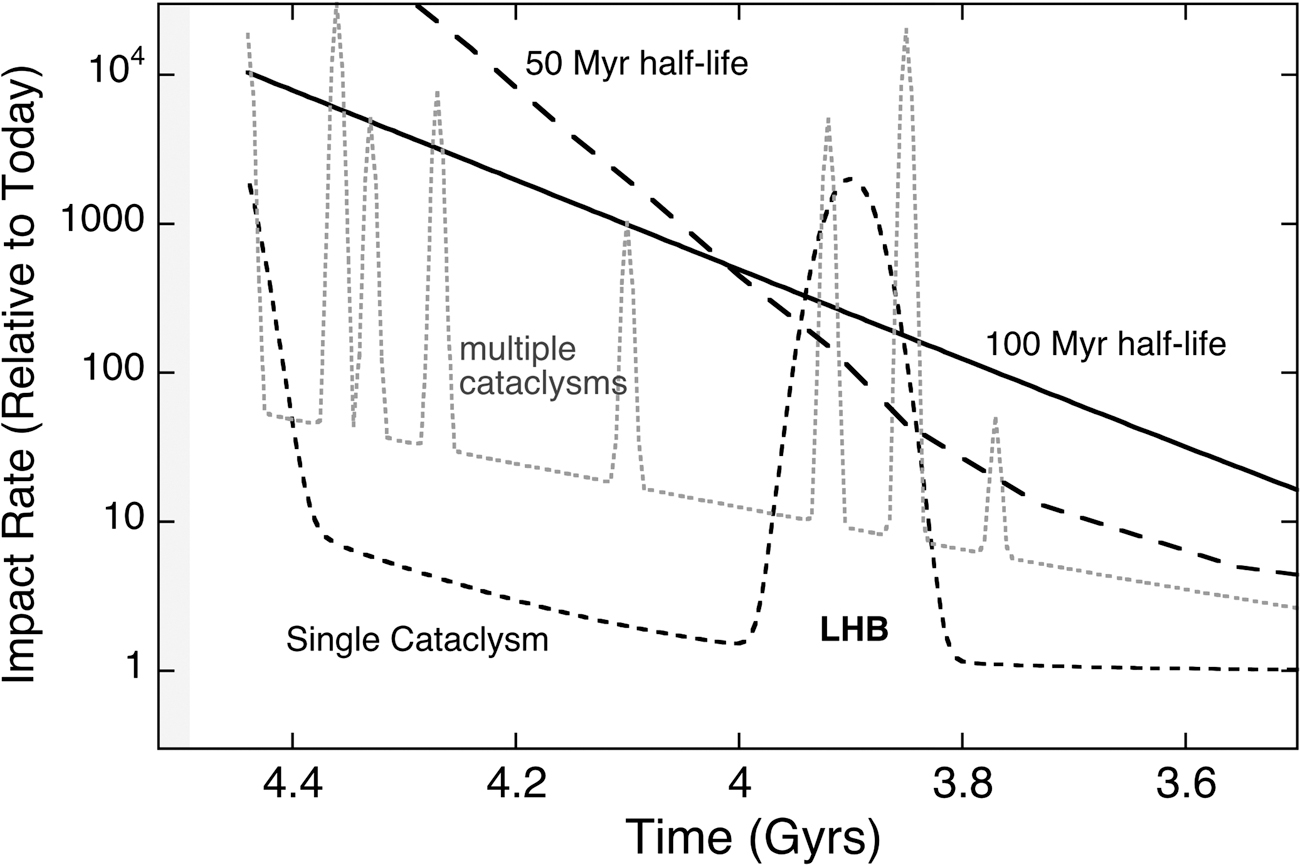
Four possible scenarios for the LHB, calibrated to crater counts and surface ages at the Apollo landing sites. All scenarios except the 50 Myr half-life model are supported by the available data. Reprinted by permission from Springer Nature: Zahnle et al. (2007).
LHB = Late Heavy Bombardment.
The bombardment of the early Earth with asteroids and comets could have had both positive and negative effects with respect to the emergence of life. If CO2 subduction was efficient during the Hadean eon, asteroidal and cometary impacts on the early Earth could have helped maintain the atmospheric pressure necessary for a clement temperature by releasing CO2 into the atmosphere. However, weathering of the ejecta from such impacts also removes CO2 from the atmosphere (Sleep and Zahnle, 2001), possibly much more efficiently than CO2 is released by impacts (Charnay et al., 2017). Impacts could have also delivered or even produced the essential organics required for the emergence of life, for example, nucleobases, amino acids, and carboxylic acids (Chyba and Sagan, 1992; Callahan et al., 2011; Burton et al., 2012; Pizzarello et al., 2012; Martins et al., 2013; Cobb and Pudritz, 2014; Pearce and Pudritz, 2015). In contrast, asteroidal and cometary impacts could have also hindered the progress of evolving prelife molecules or destroyed existing life (Zellner, 2017).
Abramov et al. (2013) developed a thermal model for global bombardments to study how significant Earth's crustal melting would have been due to the occurrence of the LHB. Their model, which considered shock heating, impact melt generation, uplift, and ejecta heating, predicted that about 5–10% of Earth's surface area would have been covered by >1 km deep impact melt sheets after the LHB. This suggests that living organisms could have potentially survived the event if they inhabited a portion of the surface that remained relatively unscathed. But what if the LHB was just the tail end of a sustained, declining bombardment? Given this scenario, a higher proportion of the crust would have melted from 4.5 to 3.9 Ga than would have during an LHB; however, it is unclear how much greater this proportion would be. The existence of zircons that formed from melts with ages from 3.91 to 4.40 Ga confirms that Earth's crust experienced periodic melting throughout this period, but more importantly, since remelting of the crust would have likely age-reset the zircons at that location (Abramov et al., 2013), at least some crust likely did not remelt from 4.4 to 3.9 Ga.
If there was an LHB and it completely sterilized the planet of any evolving life and prelife molecules (nucleotide monomers, dimers, trimers, etc.), the habitability boundary of the emergence of life is ∼3.9 Ga. Otherwise, if asteroid impacts at or before 3.9 Ga had no negative bearing on the emergence of life, the outer boundary remains at 4.316–4.52 Ga, corresponding to the uncertainty in the date by which Earth's magma ocean cooled and a hydrosphere formed.
4. The Fossil Record
4.1. Microfossils
It has been said that the only true consensus for a date by which life definitely existed on Earth is in the bacterial fossils found within the Gunflint Formation of Ontario, dated at 1.9 Ga (Moorbath, 2005; Wacey et al., 2011). Brasier et al. (2015), a prominent challenger of the oldest microfossils, reaffirmed this, calling the Gunflint chert a benchmark for the analysis of early fossil preservation. Two key components of the Gunflint microfossil consensus are that (1) these microfossils have three-dimensional round-walled compartments, a.k.a., cell lumina, and (2) the walls are composed of carbonaceous (kerogenous) matter (Schopf et al., 2007; Igisu et al., 2009). These two traits above others have become critical evidence in establishing the authenticity of microfossils (Schopf and Kudryavtsev, 2012). However, authentic microfossils are also backed by other more common indicators such as the presence of a variety of specimens ranging from relatively well preserved to partially or completely degraded (Schopf et al., 2010). For a complete list of microfossil indicators, see Wacey (2009).
It has been argued by many that microfossils have been discovered within carbonaceous cherts (i.e., the fine-grained silica-rich sedimentary rocks) and sandstones in Western Australia (Schopf and Packer, 1987; Schopf, 1993; Rasmussen, 2000; Ueno et al., 2001; Kiyokawa et al., 2006; Westall et al., 2006a; Glikson et al., 2008; Wacey et al., 2011; Sugitani et al., 2013; Hickman-Lewis et al., 2016), within ferruginous sedimentary rocks in Northern Quebec (Dodd et al., 2017), and within pillow lavas, siliciclastic deposits (noncarbonate, almost exclusively silica-bearing sedimentary rocks), and cherts in South Africa (Knoll and Barghoorn, 1977; Walsh and Lowe, 1985; Walsh, 1992; Westall et al., 2001, 2006b; Furnes et al., 2004; Javaux et al., 2010) that range in diameter from ∼0.1 to 289 μm. The rocks in the formations hosting these possible microfossils have U–Pb dates of ∼3.20–3.77 Ga. (For a more complete review of potential microfossils, including those younger than 3.2 Ga, see Schirrmeister et al., 2016.) These potential microfossils come in many morphologies: spiral, branched, thread-like, disk, spheroidal, cylindrical, tubular, and filamentary. We present a summary of the authenticity of these potential microfossils in Table 3.
The difficulty in determining the authenticity of microfossils is that there are abiotic processes that can lead to similar structures (Brasier et al., 2002, 2015; García-Ruiz et al., 2003; Sugitani et al., 2007; Wacey, 2009; French and Blake, 2016). Brasier et al. (2002) reinterpreted the potential microfossils discovered in the Apex Basalt of Western Australia (Schopf and Packer, 1987; Schopf, 1993) as being secondary artifacts formed by amorphous graphite reorganized in the form of filaments within multiple generations of hydrothermal chert breccia veins and volcanic glass. These potential microfossils showed similar morphologies to structures within rocks that were hydrothermally altered or completely melted, which questions a biological origin of the possible microfossil morphologies (Brasier et al., 2002). To show this, Brasier et al. (2002) compared these potential microfossils with several similar structures produced in both the clasts (fragments) and matrix of hydrothermally altered chert beds, within glass rims of volcanic shards, and in the associated chalcedony (i.e., milky quartz) matrix of the felsic tuffs (i.e., igneous rocks, rich in elements producing feldspar, fused from smaller grains by heat). These potential microfossil structures (Schopf and Packer, 1987; Schopf, 1993) are also generally isolated, irregularly distributed, and randomly oriented in several generations of hydrothermally altered formations. This is unlike typical cyanobacteria, in which the trichomes (hair-like outgrowths) of such organisms commonly cluster together in layers, often with a specific orientation relative to rock bedding (Brasier et al., 2002).
Furthermore, García-Ruiz et al. (2003) demonstrated the abiotic formation of noncrystallographic, curved, helical morphologies, similar to these same potential microfossils (Schopf and Packer, 1987; Schopf, 1993). García-Ruiz et al. (2003) grew filamentous materials out of barium salt in alkaline sodium silicate solutions under alkaline, mildly hydrothermal conditions. These initial materials and conditions, though uncommon on Earth today, are geochemically plausible during Archean times (García-Ruiz, 1998). French and Blake (2016) similarly found a plausible abiotic formation mechanism for microfossils by examining submarine glasses from the western North Atlantic Ocean. By combining petrographic and electron microscopic observations with theoretical models of radiation damage from uranium and thorium decay, French and Blake (2016) found that tubular and granular microfossils can be formed by preferential seawater corrosion of damage trails left by fission fragments.
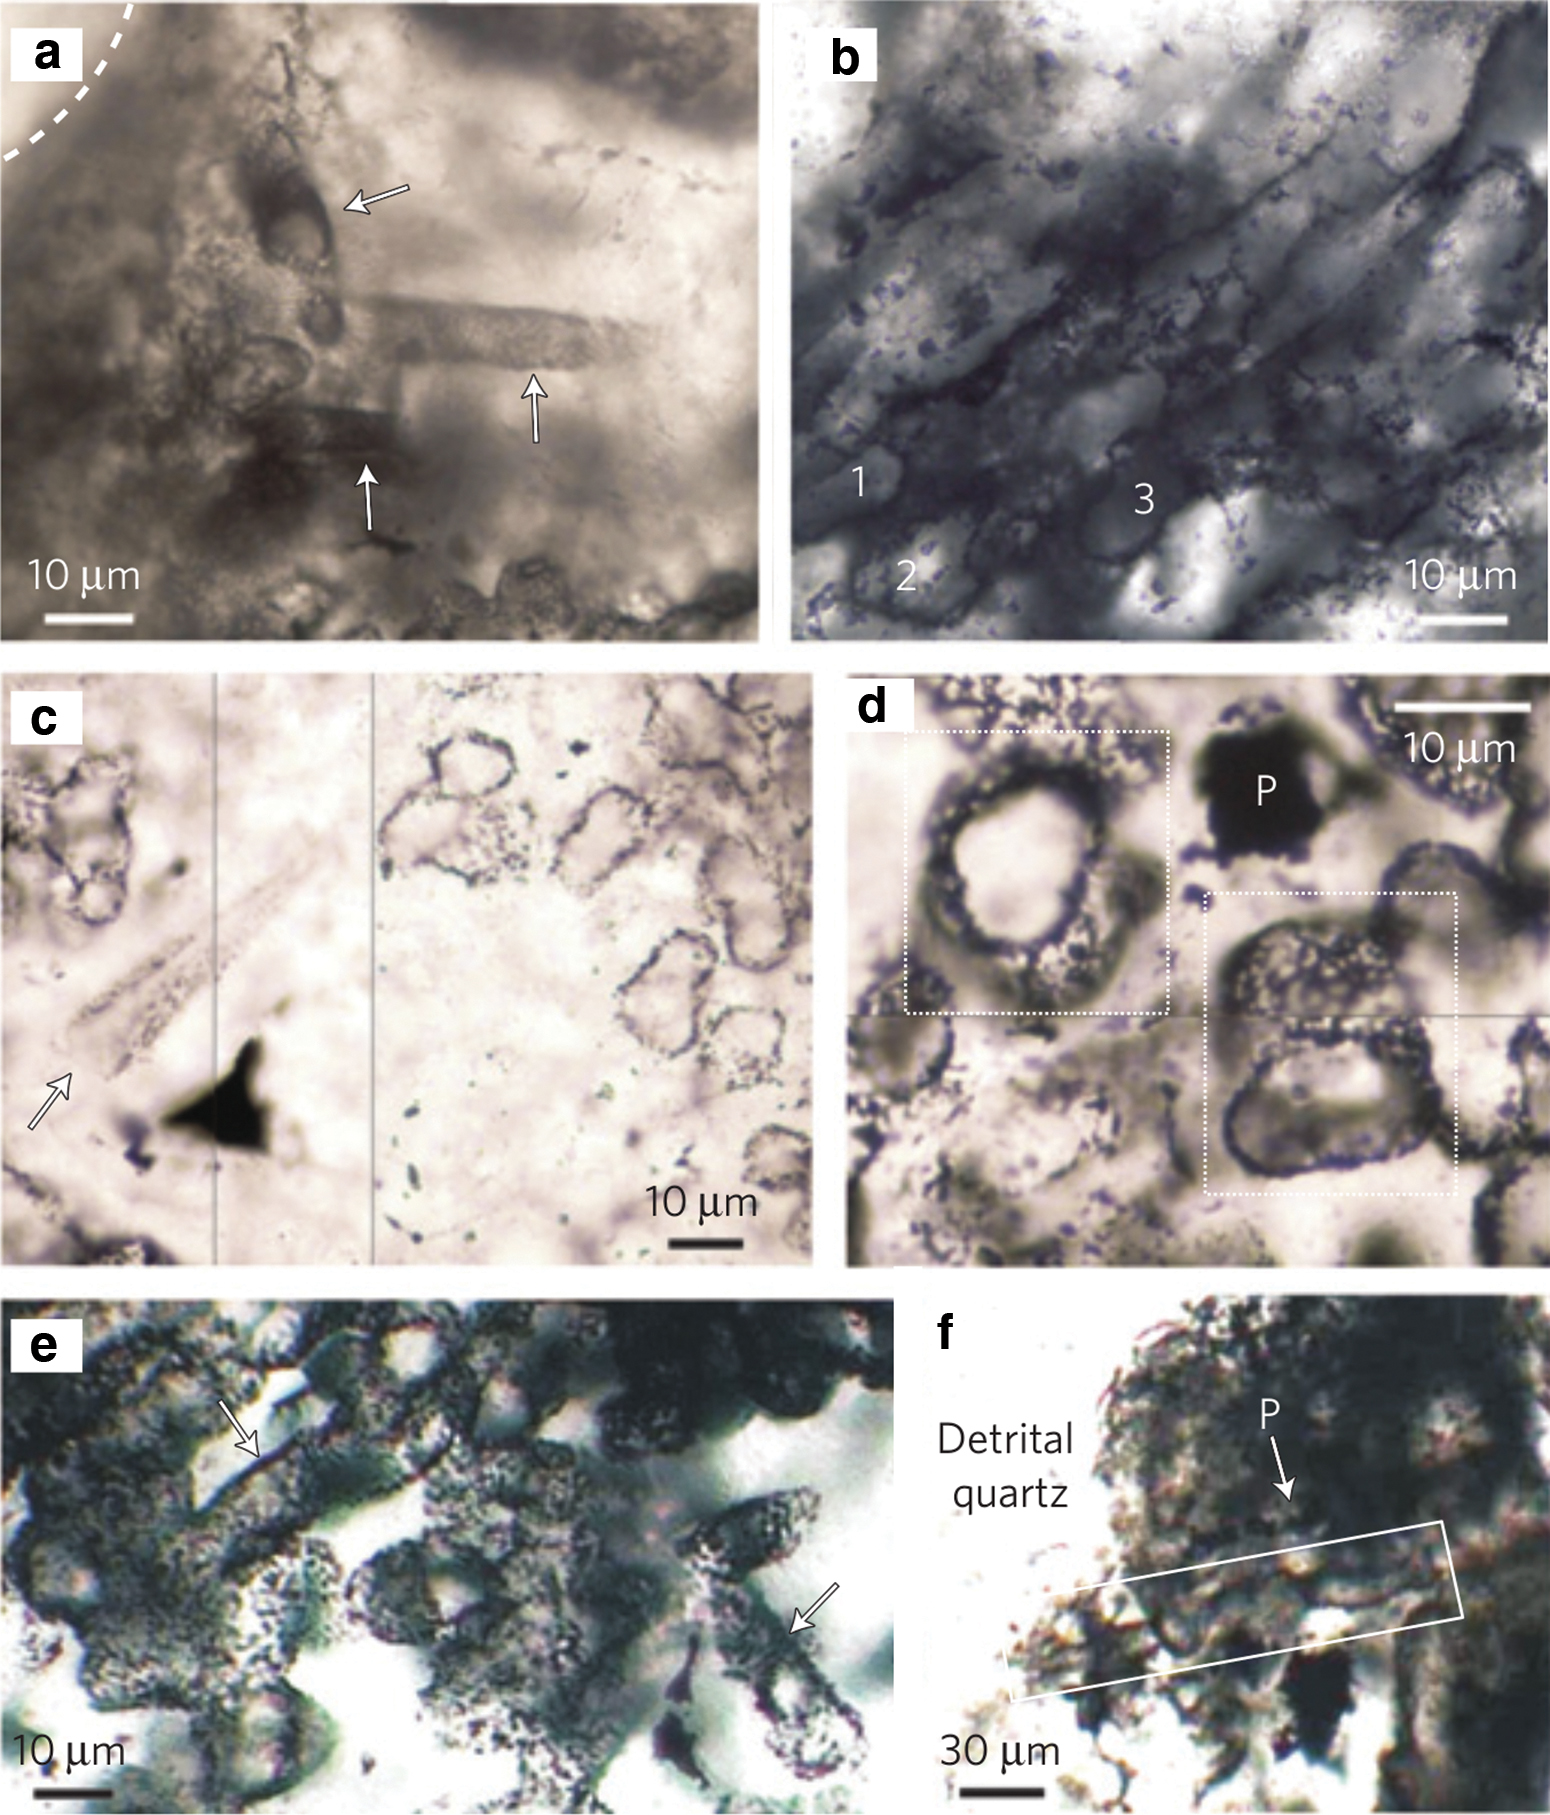
Given the circumstances, it is difficult to be certain of a biological origin for microfossils without evidence for cell lumina and carbonaceous cell walls. The most recent studies have used state-of-the-art analysis techniques including laser Raman microspectroscopy, secondary ion mass spectrometry, and transmission electron microscopy (TEM) to confirm these two traits. The oldest microfossils to meet these criteria are 3.2 Gyr old (Javaux et al., 2010) and 3.4 Gyr old (Wacey et al., 2011). In Figure 3, optical photomicrographs of several hollow, tubular microfossils from the 3.4-Gyr-old Strelley Pool Chert are displayed (figure from Wacey et al., 2011). The closely packed tubular microfossils in images (b), (d), and (e) were interpreted by Wacey et al. (2011) to be much like the cells of prokaryotes within modern biofilms.
The 3.46-Gyr-old microfossil-like structures in the Apex chert were confirmed by De Gregorio et al. (2009) to meet one of the two traits required for establishing authenticity (i.e., carbonaceous cell walls). However, Brasier et al. (2015) examined thin slices of these microfossils with TEM and found that at high spatial resolution, instead of cell lumina, the potential microfossils actually have a complex, incoherent spiky morphology, which is evidently formed by filaments of clay crystals coated with iron and carbon. This analysis led them to the conclusion that the multiple clay minerals within the thin slices are entirely compatible with chemistry in high temperature hydrothermal settings.
Lastly, although the recently discovered filamentary and tubular microfossil-like structures in the >3.77-Gyr-old Nuvvuagittuq belt co-occur with carbonaceous material (Dodd et al., 2017), they do not exhibit carbonaceous cell walls and there is no evidence of cell lumina. Therefore, these structures do not meet the most critical traits for establishing microfossil authenticity.
In light of all this evidence, in Figure 1, we date the oldest microfossils as 3.4 Ga, which matches the oldest microfossils exhibiting cell lumina and carbonaceous cell walls (Wacey et al., 2011). We now discuss the stromatolite macrofossils, which are also useful in constraining the biosignature boundary.
4.2. Stromatolites
The word “stromatolite” in Greek literally means layered rock. In general, stromatolites are layered, sheet-like, accretionary structures created by or resembling those created by microbial mats of microorganisms such as cyanobacteria. The suite of microbes that form stromatolites live in a biofilm bound by mucus or other adhesives that microbes produce. When photosynthetic microorganisms at the top of the mat get covered in naturally accumulating sedimentary grains and silt, and microbiologically induced carbonate precipitates, they migrate upwards toward the light. This creates a new microbial mat layer, with a calcium carbonate-cemented layer of sedimentary rock and silt left behind (McNamara and Awramik, 1992; Altermann et al., 2006). Over thousands of years, layer upon layer of this combination of sedimentary rock, silt, and carbonate builds up. These preserved structures are stromatolites.
The oldest stromatolite-like structures were recently discovered in the 3.7-Gyr-old Isua supracrustal belt (ISB) in Greenland (Nutman et al., 2016). A photograph of these stromatolites along with the interpretation by Nutman et al. (2016) and a comparison with similar, 2.03-Gyr-old stromatolites, are shown in Figure 4. Previous to this discovery, the oldest widely accepted stromatolites were found in the Strelley Pool Chert (Allwood et al., 2006), the contact between the Strelley Pool Chert and Panorama Formation (Hoffman, 1999), and the Dresser Formation (Noffke et al., 2013) in Western Australia. Rocks from these locations are U–Pb dated at ca. 3.43, 3.45, and 3.48 Ga, respectively. Most recently, Djokic et al. (2017) also discovered exceptionally well-preserved stromatolites in the 3.48-Gyr-old Dresser Formation. Nutman et al. (2016) deduced that the 3.7-Gyr-old stromatolite forms match some of those discovered in the 3.43-Gyr-old Strelley Pool Chert and the 2.03-Gyr-old Wooly Dolomite, implying a biological origin. Since the oldest stromatolites do not contain any fossil microbes, many assume that they are of biological origin due to morphological comparisons with modern, biological stromatolites (Grotzinger and Rothman, 1996). Some key morphological indicators are wrinkly sequences of small-scale fine layers in cone, mat, peak, and dome shapes and microbe-bound ripples in carbonate sand (Allwood et al., 2006; Van Kranendonk, 2011; Nutman et al., 2016).
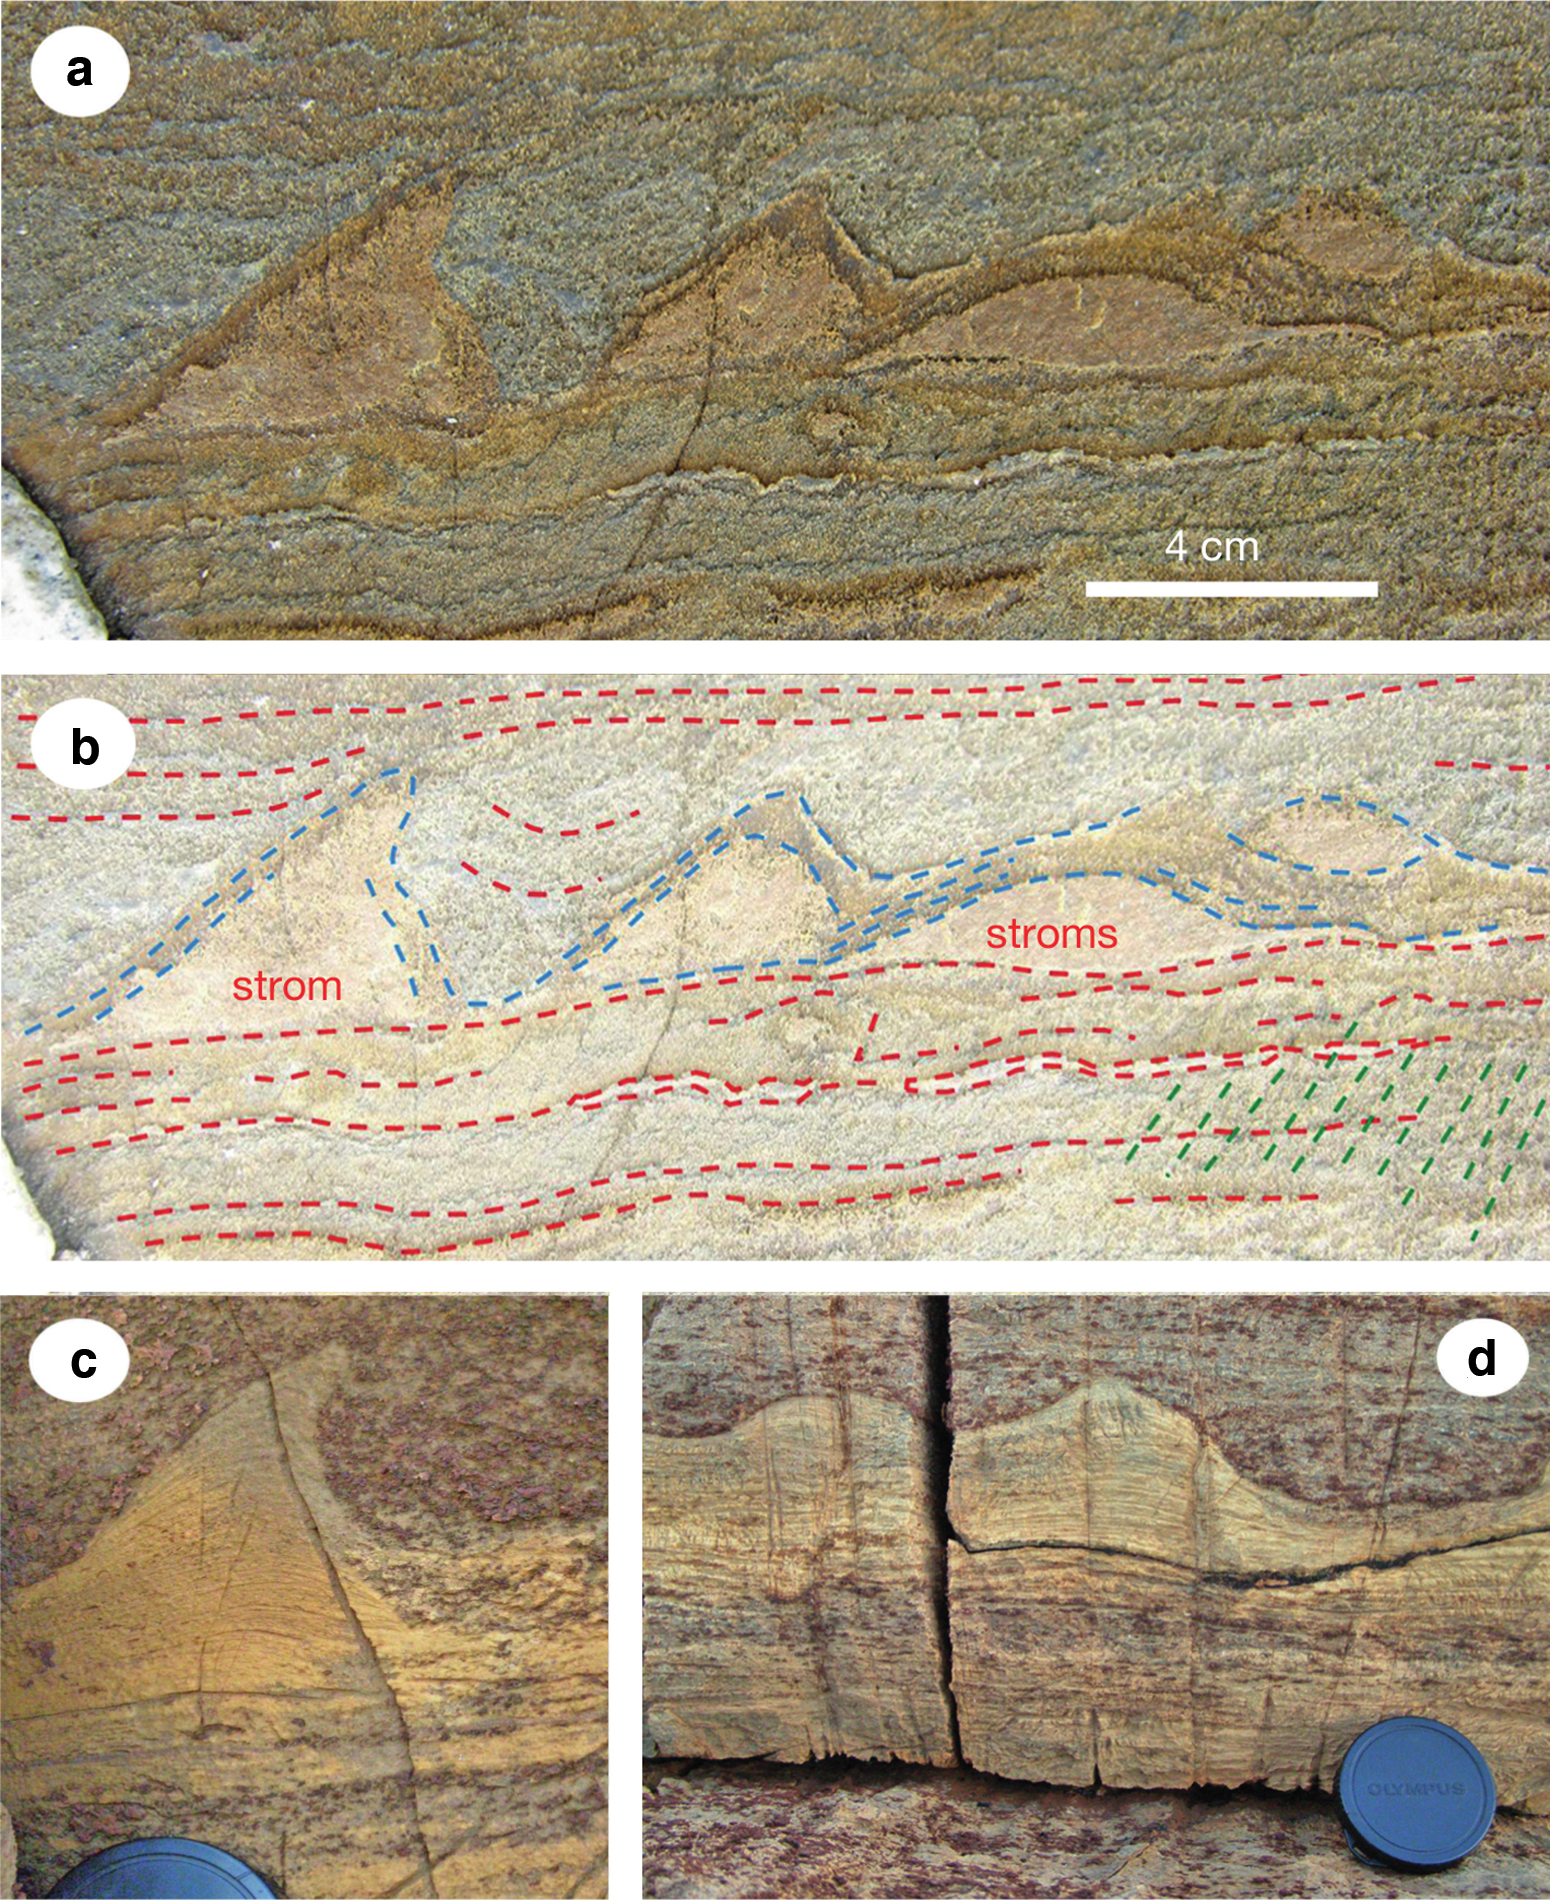
Just as with microfossils, there has also been some disagreement whether stromatolite rock formations are of biological origin. For example, Grotzinger and Rothman (1996) deduce that these surfaces can be grown from chemical precipitation, diffusive rearrangement of suspended sediment, and uncorrelated random noise. Others defend that the distinct morphological attributes of stromatolites are inconsistent with purely mechanical deposition (Allwood et al., 2006; Nutman et al., 2016). For example, unlike crusts formed by mechanical deposition, the peaks of the 3.7 Ga stromatolite structures are inclined and asymmetrical, both dome- and peak-shaped structures are observed together, and there are no irregular projections normal to the growth surface (Fig. 4).
Nonmorphological factors also indicate a biological origin of the oldest stromatolites. For example, there is a great diversity of stromatolites in the same location that all resemble known microbial mats, and none resemble any known structure formed abiotically (Allwood et al., 2006). This is consistent with the ecologically controlled growth of an Archean microbial reef (Allwood et al., 2006). These stromatolites also exist in a location where the shoreline moved inward and deposited carbonates; a location where microbial mats exist today (Peterffy et al., 2016). There is also an absence of ancient stromatolites in deep waters, where photosynthetic organisms would not have had enough light to exist in microbial mats (Allwood et al., 2006). Altogether, the evidence that stromatolites are true biological fossils seems fairly strong.
With all of this evidence in hand, we are confident in pushing the biosignature boundary for the emergence of life outwards to the date of the oldest stromatolites, at 3.7 Ga.
5. Isotopic Signatures
5.1. Signatures for the presence of oxygen
Observations of sulfur and molybdenum isotopes and transition metals in ancient sedimentary rocks indicate that there was a so-called GOE around 2.4–2.3 Ga. The GOE is widely believed to have been produced by photosynthetic cyanobacteria (Buick, 2008; Sessions et al., 2009; Grula, 2010; Planavsky et al., 2014). Photosynthetic organisms were producing oxygen before the GOE; however, it is argued that at 2.4–2.3 Ga, Earth's surface became oxidized to the point wherein O2 became more stable in the atmosphere than competing reduced gases (Zahnle et al., 2013). UV photodissociation of water vapor can produce O2 abiotically; however, unless one of the products of such a reaction is immediately removed, they will recombine to form water vapor (van Andel, 1994). Furthermore, water vapor would have been present in the atmosphere throughout the Hadean and Archean eons (see Section 3), and there is no known reason for the O2 produced through this mechanism to start building up around 2.4–2.3 Ga. This argument can also be used to explain why the photodissociation of atmospheric CO2 (Lu et al., 2014) is unlikely to have caused the GOE. Hence, the existence of O2 in the early atmosphere implies a rapid rate of creation of O2 by life that keeps the atmosphere out of equilibrium.
The fluctuations in atmospheric oxygen over geological timescales can be tracked by fluctuations in sulfur and molybdenum isotopes (Kaufmann et al., 2007; Planavsky et al., 2014) and enrichment of transition metals (e.g., chromium, molybdenum, and rhenium) in the geological record (Anbar et al., 2007). Sulfur isotopes are said to undergo mass-independent fractionation (MIF) under anoxic conditions. However, the term “MIF” can be misleading, as fractionation of sulfur isotopes is always dependent on the mass of the isotopes. Literally, MIF just means that the isotopic signatures do not obey the standard mass-dependent relationship (i.e., δ33S–0.515δ34S; δ36S–1.91δ34S) (Farquhar et al., 2000; Pavlov and Kasting, 2002). The reason for this deviation from the standard isotopic relationship in anoxic environments is that when sulfur rains out of the atmosphere or is deposited onto the surface, it does so in a variety of different oxidation states—leaving a variety of isotopic signatures in the sediments into which sulfur gets incorporated. In an oxygen atmosphere, even one as low as 10−5 times the present atmospheric level of O2, the clear majority of sulfur gets oxidized to H2SO4, which homogenizes the sulfur isotopes to match the standard mass-dependent relationship (Pavlov and Kasting, 2002). Therefore, measuring such isotopes in old bioelemental sediments can be used to infer the oxygenation history of ancient seawater (Pufahl and Hiatt, 2012). An accumulation of redox-sensitive transition metals in sedimentary rocks also signifies a necessity of oxygen in the early Earth seawater that deposited such rocks (Anbar et al., 2007). For example, molybdenum, which currently exists in bodies of water as the unreactive molybdate ion (MoO4 2−), accumulates through oxidative weathering of molydenum-bearing sulfide minerals in crustal rocks. Under anoxic conditions, molybdenum would instead be retained by these sulfide minerals and, therefore, would not accumulate in the oceans and be deposited into sediments (Anbar et al., 2007).
MIF disappears completely from the geological record before 2.4–2.3 Ga, providing the tightest constraint on the GOE (Sessions et al., 2009). A shift in sulfur isotopes (Kaufmann et al., 2007) and an enrichment of transition metals (Anbar et al., 2007) in 2.5-Gyr-old samples of shale from Mount MacRae in Western Australia indicate a presence of atmospheric oxygen even before the GOE. Moreover, Planavsky et al. (2014) measured a large fractionation of molybdenum isotopes in 2.95-Gyr-old rocks from the Sinqeni Formation in South Africa. In this case, however, molybdenum is used as a proxy for manganese (II), which requires free dissolved O2 to be oxidized. Planavsky et al. (2014) inferred from these results that oxygen produced through photosynthesis began to accumulate in shallow marine settings at 2.95 Ga.
This is the kind of environment where we would expect stromatolites to grow, and as we saw in section 4.2, evidence for stromatolites goes back to 3.7 Ga, about three-quarters of a billion years before the O2 signature is seen. These dates do not seem inconsistent to us. Stromatolites are presumed to be formed by photosynthetic bacteria, and modern stromatolites contain cyanobacteria that carry out oxygenic photosynthesis. However, there are several other groups of bacteria that carry out nonoxygenic photosynthesis (see Section 6). The earliest stromatolites might have been formed by bacteria such as these, or it may simply be that oxygenic photosynthesizers were present but oxygen sinks (e.g., organic matter and iron) near Earth's surface at this time efficiently removed atmospheric O2 (Zahnle et al., 2013). Thus, the evidence from O2-dependent isotopic signatures seems to fit with that from the fossil record, but it does not push the biosignature boundary further back from what is known from stromatolites. In contrast, carbon isotope biosignatures extend further back in time and are currently a key piece of evidence that constrains the biosignature boundary, as we now discuss.
5.2. Carbon isotope biosignatures
Almost all rocks older than 3.6 Gyr, deposited just above the basement of the crust, underwent high-grade metamorphism (i.e., changed in mineral assemblage and structure due to high temperatures and pressures). Therefore, fossils from before 3.6 Ga are very unlikely to be preserved (which makes the 3.7-Gyr-old stromatolite discovery both remarkable and potentially controversial). This means, typically, evidence for life beyond 3.6 Ga must include a geochemical component (Rosing, 1999).
One isotope commonly used to infer evidence of biological activity is 13C. 13C is a stable isotope of carbon, and makes up ∼1.1% of the natural carbon on Earth. The rest of the carbon is in the form of 12C, with only trace amounts existing of the short-lived radioactive 14C.
Two pioneering studies performed by Nier and Gulbransen (1939) and Murphey and Nier (1941) discovered that converting inorganic carbon to biological matter through biochemical reactions leads to an obvious fractionation of 12C and 13C. Subsequent works determined that photosynthetic reaction pathways discriminate against 13C because of its heavier mass. In general, isotopically light molecules are more mobile and tend to have greater velocities than their heavier counterparts (White and Irvine, 1998). As a result, not only does 13C diffuse slower than 12C through membranes, but also certain enzymes fix lighter carbon faster, for example, rubulose 1,5-bisphosphate carboxylase and pyruvate dehydrogenase (DeNiro and Epstein, 1977; White and Irvine, 1998; Subbarao and Johansen, 2001). However, not all enzymes prefer light carbon, for example, phosphoenolpyruvate carboxylase does not discriminate between 12C and 13C (Subbarao and Johansen, 2001). Because of discriminatory enzymes, molecules produced by living organisms are preferentially composed of light carbon, whereas heavy carbon is retained in the surface reservoir (mostly in the form of marine bicarbonate) (Schidlowski, 1988). It is unknown when these discriminatory enzymes were incorporated into life; therefore, there may be a limit to the earliest organisms that can be detected by using carbon isotopes.
The variable δ13C is used to determine how depleted or enriched a sample is in 13C (similarly to the δ18O variable from Eq. 1). δ13C is calculated as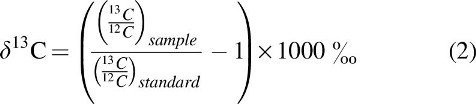
A comparison of the δ13C values of major groups of plants and autotrophic microbes, and inorganic carbon of the surface environment (CO2, HCO3 −, and CO3 2−) are displayed in Figure 5 (figure from Schirrmeister et al., 2016). A negative δ13C value corresponds to a sample depleted in 13C (or enriched in 12C) with respect to the inorganic, oxidized carbon sources.
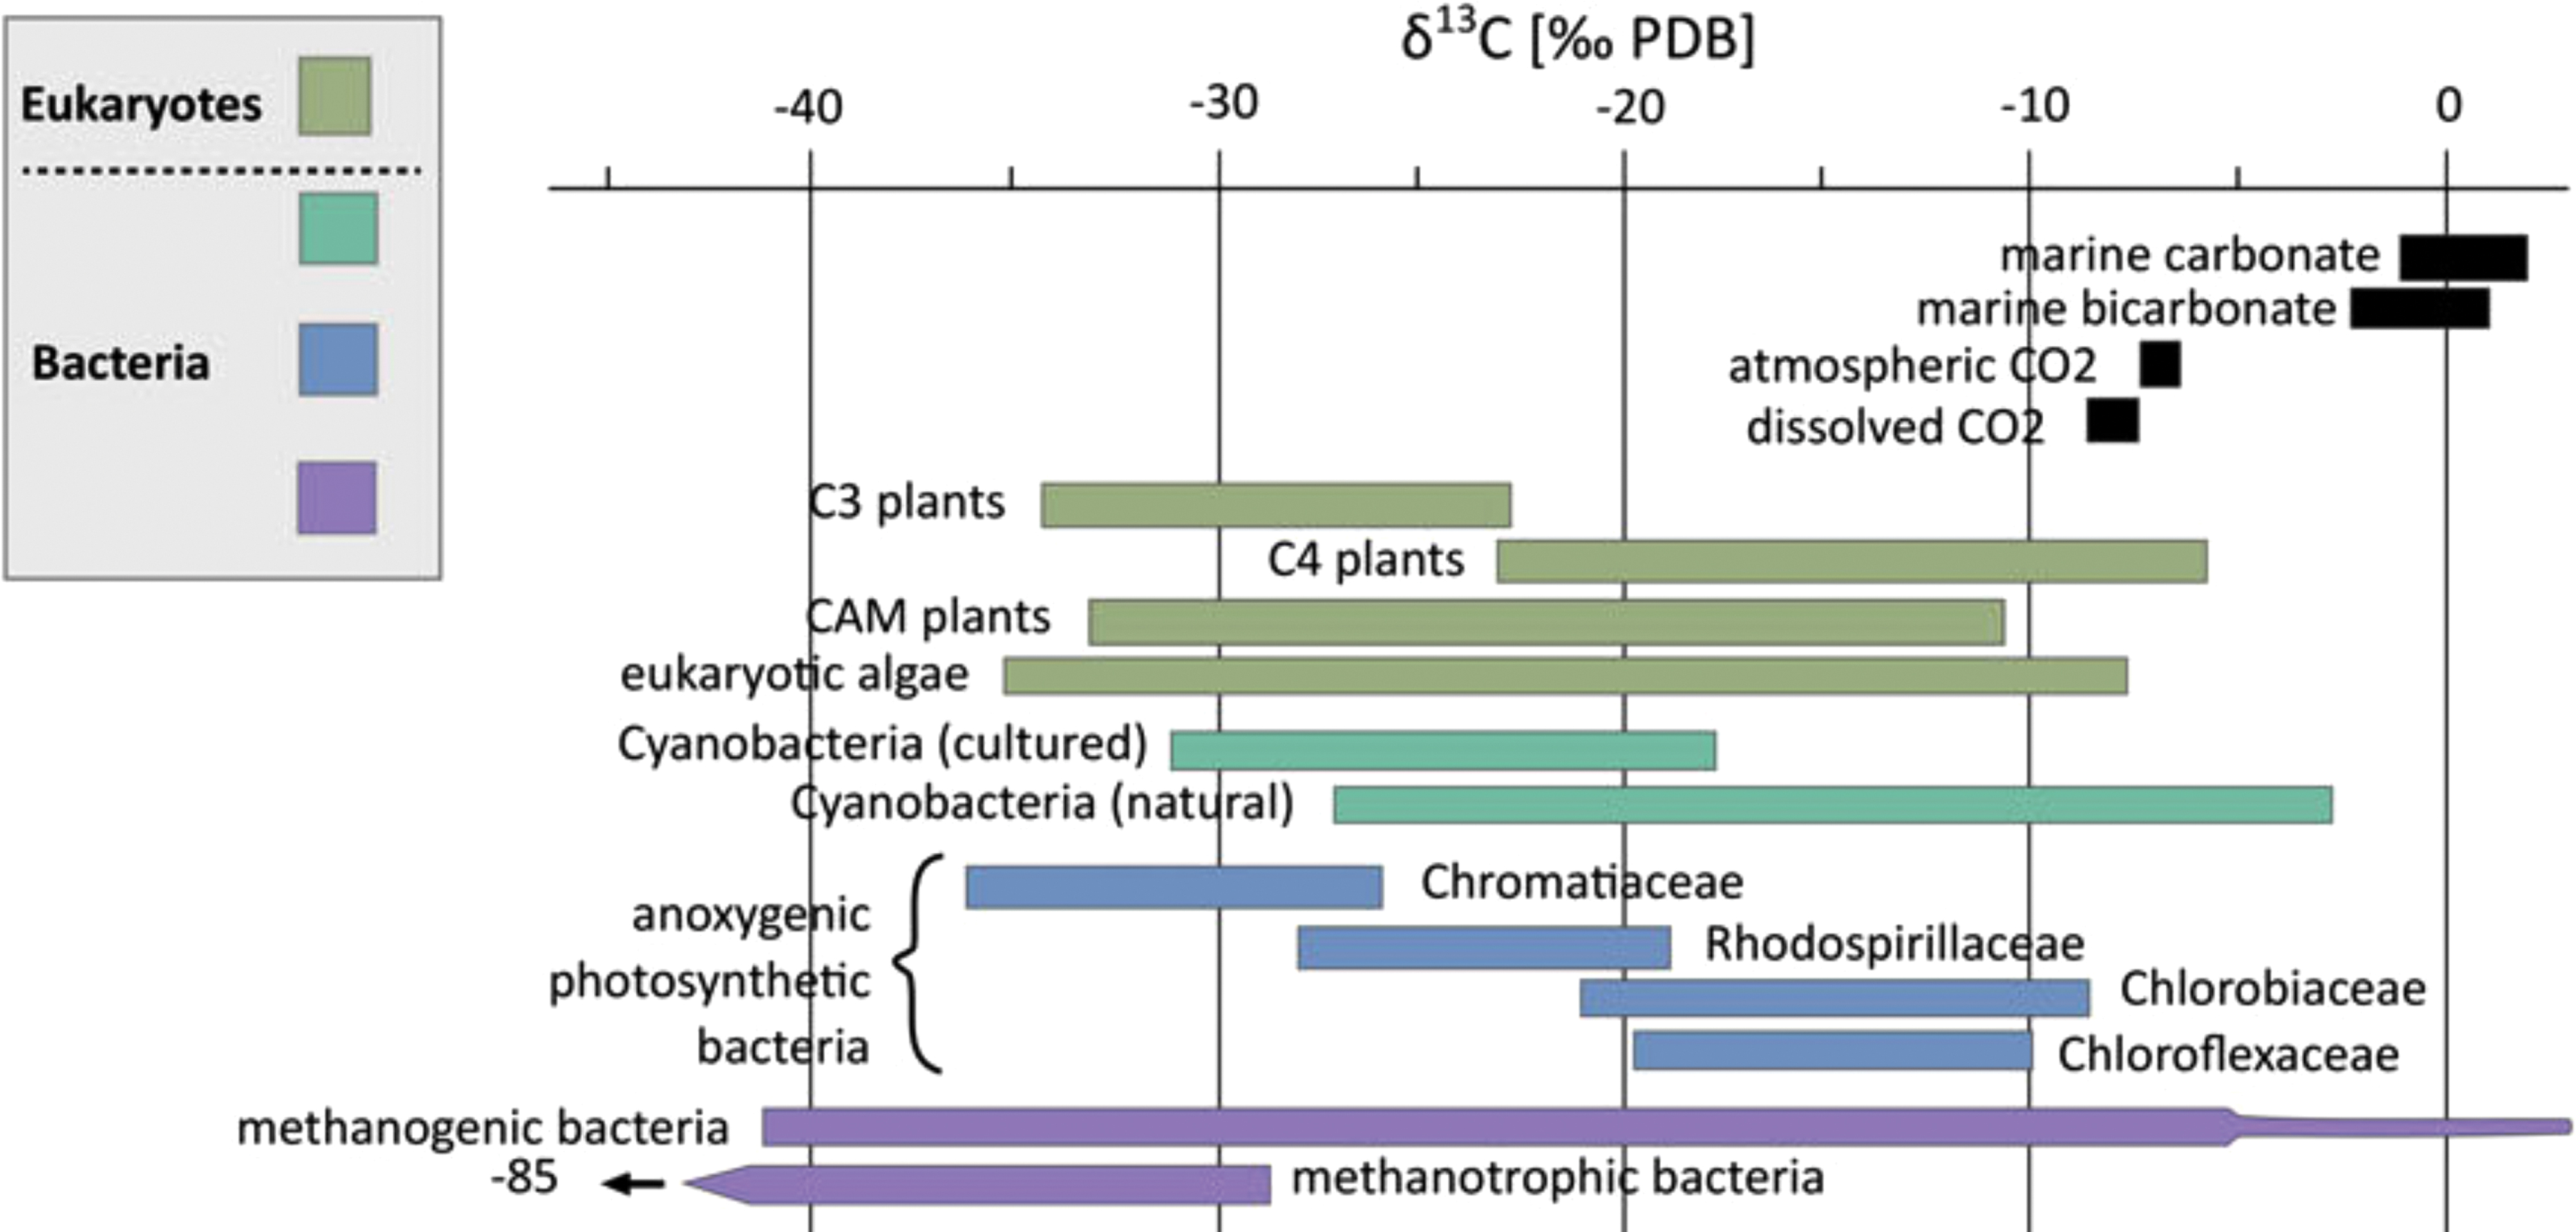
Isotopic carbon composition of various major groups of plants, protists, and bacteria compared with those of CO2, HCO3 −, and CO3 2− in the surface environment. Negative δ13C values correspond to 13C depletion relative to the PDB standard. The positive extremes for methanogens were from experiments of cultures that were placed in conditions irrelevant to natural populations. CAM, Crassulacean acid metabolism; PDB, Pee Dee Belemnite. Reprinted by permission from Cambridge University Press: Schirrmeister et al. (2016).
Because molecules produced by modern living organisms are preferentially light in carbon, measuring highly negative δ13C values in organic matter within rocks of sedimentary origin is suggestive of biological activity at the U–Pb date at which the rocks are aged. A sedimentary origin is an essential prerequisite for interpreting δ13C signatures to be biologically reduced, because there are abiotic mechanisms for reducing δ13C in rocks that are of nonsedimentary origin, and because a sedimentary origin provides evidence for a liquid water biosphere in a habitable temperature range. This is in contrast to rocks of metasomatic origin, which were formed by hot hydrothermal fluids reacting with rocks originally deposited by metamorphic or igneous fluids. Graphite, for example, is either formed by the metamorphism of carbon-rich sedimentary rocks or from the precipitation of carbon-bearing fluids or melts (Luque et al., 2014). There are several high-temperature abiotic mechanisms that could produce light δ13C in rocks of nonsedimentary origin, including (1) disproportionation of ferrous carbonates (van Zuilen et al., 2002), (2) decarbonation (the removal of CO2) during metamorphism accompanied by a Rayleigh distillation process or serpentinization (i.e., the addition of water into the crystalline structure of rock minerals) (Fedo and Whitehouse, 2002), (3) Fischer–Tropsch reactions (McCollom and Seewald, 2007), (4) diffusive fractionation (Mueller et al., 2014), and (5) degassing of basalts (Shilobreeva et al., 2011).
By sampling the δ13C value of graphite globules from sedimentary rocks from the ISB in west Greenland, dated at >3.7 Ga, Rosing (1999) deduced that they were biologically reduced. The low δ13C values within the globules (approximately −19‰) are within the range of reduced C compositions from photosynthetic bacteria (i.e., approximately −10‰ to −36‰; Fig. 5). The same ∼3.7-Gyr-old graphite globules were geochemically analyzed by Ohtomo et al. (2014) to confirm whether they were of sedimentary origin, or instead deposited by metamorphic or igneous fluids. Using Raman spectroscopy, it was determined that the rocks containing the graphite globules were formed from marine sediments that were depleted in 13C at the time of their deposition. Furthermore, through the use of a TEM, it was seen that the graphite globules are nanoscale polygonal and tube-like grains, which is unlike the flaky morphology of abiotic graphite in carbonate veins. Even more so, the graphite globules exhibited distorted crystal structures and disordered stacking of graphene, which is consistent with the thermochemical decomposition and pressurization of organics during metamorphism. Therefore, the analysis by Ohtomo et al. (2014) supports the claim by Rosing (1999) that the ∼3.7-Gyr-old graphite globules are of biological origin.
Grassineau et al. (2006) measured similarly low δ13C values (approximately −18.4‰ to −14.7‰) within samples obtained from a sedimentary outcrop in the >3.7-Gyr-old ISB, and stated that these samples might record biological activity as early as 3.8 Ga. However, due to two high-grade metamorphic events in this outcrop at ∼3.74 Ga, metamorphic alteration could have overprinted the δ13C values within these samples. This means that the low δ13C values in these samples could be a result of high temperature processes rather than the burial of organic matter.
Schidlowski (1988) and Mojzsis et al. (1996) measured mean δ13C values of approximately −13‰ to −37‰ in deposits of kerogen and grains of apatite from what they interpreted as banded iron formations (BIFs) in the ISB (U–Pb dated to be 3.8 and 3.85 Ga). BIFs are ∼4280–545 Ma layered sedimentary rocks, whose successive layers contain high abundances (20–40%) of iron (Mloszewska et al., 2011, 2013). Both abiotic and biotic sources of the iron precipitate have been suggested; however, iron-oxidizing bacteria have been gaining in popularity over the past decade as they can explain iron oxidation in anoxic environments (Smith, 2015). The δ13C purported BIF signatures were initially interpreted to be evidence for early life at 3.8 and 3.85 Ga. However, Fedo and Whitehouse (2002) and van Zuilen et al. (2002) challenged this interpretation by examining the claim that the purported BIF, from which the 3.8- and 3.85-Gyr-old samples of δ13C were obtained (Schidlowski, 1988; Mojzsis et al., 1996), came from sedimentary rocks, chemically precipitated by seawater. They deduced, for various geological, petrological, and geochemical reasons, that the purported BIF rocks were most likely once metasomatic and igneous, and thus could have been reduced in carbon by one of the abiotic mechanisms already listed. In addition, these previously molten rocks do not provide evidence for a habitable environment, and thus are unlikely to have hosted life.
Papineau et al. (2011) measured δ13C values from −18.2‰ to −26.8‰ in graphite within the 3.75- to 4.28-Gyr-old Nuvvuagittuq BIF in northern Canada. These δ13C signatures may point to a biological origin for this carbon. However, the 13C-depleted graphite was deposited by hydrothermal or metamorphic fluids after peak metamorphism of the BIF (Papineau et al., 2011; Mloszewska et al., 2013); therefore, it could also have been reduced by one of the abiotic mechanisms already listed. Furthermore, it is uncertain whether this graphite is indigenous to the 3.75- to 4.28-Gyr-old rocks, as it has not undergone the same metamorphic history as the sedimentary host rock (Papineau et al., 2011; Mloszewska et al., 2013).
Finally, preserved graphite encased in 4.1- and 4.25-Gyr-old zircon crystals from Jack Hills, Western Australia, has been discovered to have particularly low δ13C values (Nemchin et al., 2008; Bell et al., 2015). Although both studies could not rule out abiogenic sources, the simplest interpretation may be that the graphite represents organic carbon present at 4.1 and 4.25 Ga. Watson and Harrison (2005) used a thermometer based on titanium content (a “zircon thermometer”) to measure the melt temperatures for 54 Jack Hills zircons, and found that they ranged from 644°C to 801°C. At such high formation temperatures, the low δ13C value in the enclosed graphite could result from any of the five abiotic mechanisms already listed.
With the determination of a likely nonsedimentary origin for the oldest graphite samples already described (those with ages >3.75 Ga), along with several suggested abiotic mechanisms causing their low δ13C values, evidence is not strong for the existence of life before 3.7 Ga in Earth's history.
There is also one universal potential abiotic source for low δ13C values in all old rock samples. This source is carbonaceous meteorites, whose δ13C contents range from +68‰ to −60‰ (Bell et al., 2015). If the rock and graphite samples obtained in the ISB are actually fragments of early meteorite impacts, it is possible, given the meteorite fragments are on the low side of their δ13C range, that the samples are not indicative of biological activity at all. However, this possibility is more likely for rock samples older than ∼3.8 Ga, when the possible LHB (or the sustained, declining bombardment) tapered off (Fig. 2). Furthermore, nearly all carbonaceous meteorites contain chondrules (previously molten spherical grains), which are not described to be present near the 3.7-Gyr-old sedimentary rock samples analyzed by Rosing (1999) and Ohtomo et al. (2014).
In Table 4, we summarize biogenicity of the δ13C signatures in the isotopic studies already described. The general agreement of the sedimentary origin and biological reduction of 13C in the ∼3.7-Gyr-old graphite globules from Rosing (1999) and Ohtomo et al. (2014) makes us confident in maintaining the biosignature boundary for the emergence of life at 3.7 Ga, as we already concluded from the recently proposed stromatolites in Section 4.2. Although some isotopic evidence may suggest that life existed as early as 3.8 Ga (Grassineau et al., 2006), due to the large uncertainty in dates for the sampled outcrop (3.7–3.8 Ga) and the possible metamorphic overprinting of their rock samples at ∼3.74 Ga, we are cautious to extend the inner boundary past 3.7 Ga.
BIF = banded iron formation; ISB = Isua supracrustal belt.
6. Molecular Evolution and Phylogenetics
Another branch of evidence that can provide information about early evolutionary events on Earth is molecular phylogenetics: the use of gene sequences to determine evolutionary relationships among groups of organisms. Important early work on phylogenetics used ribosomal RNA (rRNA), which is one of the few kinds of genes found in all cellular organisms that can be reliably aligned even for the most divergent sequences. Woese and Fox (1977) found that rRNA sequences formed three divergent groups, and thus established the idea that there are three domains of life: bacteria, archaea, and eukaryotes. It was also proposed early on, by using sequences of pairs of paralogous genes that arose by gene duplication before the last common ancestor of the three domains, that the root of the tree of life lies on the bacterial branch (Gogarten et al., 1989; Iwabe et al., 1989). This implied that the fundamental split in the tree of life is the division between bacteria and archaea, with eukaryotes arising as a sister group to archaea at a later stage. It has since become apparent that the origin of eukaryotes involves a fusion between a bacterial and an archaeal ancestor. Ideas of endosymbiosis were proposed very early on (Merezhkovsky, 1909; Margulis, 1970), and whole-genome analysis in recent years has made it clear that eukaryotes possess many genes that are of bacterial origin as well as archaeal origin (Koonin and Yutin, 2014; Lopez-Garcia and Moreira, 2015). Nevertheless, the slowly evolving, highly conserved genes related to the gene–protein translation process show greater similarity between eukaryotes and archaea. This is consistent with a scenario in which the root of the translation-related genes lies on the bacterial branch, as originally proposed, and in which other genes were transferred at a later date to the ancestral eukaryote by endosymbiosis. Recent work (Williams et al., 2013; Furukawa et al., 2017) suggests that eukaryotes arose from within the archaea, not as a sister group. This means that archaea are paraphyletic, and that archaea and eukaryotes should be classed together as a single domain.
The last universal common ancestor of cellular organisms (LUCA) is the earliest point of division among prokaryotic lineages. Studies of early duplicating paralogues (Gogarten et al., 1989; Iwabe et al., 1989) suggest that this earliest division lies between the bacterial and archaeal domain, although an earlier division among lineages of bacteria may also be possible. At what time did this occur? Estimates of dates from phylogenetic trees require some kind of molecular clock assumption, that is, that mutations occur at a constant rate, so that the number of mutations by which two gene sequences differ is a straightforward function of the time since the species diverged. Geological evidence for species is then used as calibration points to place specific nodes of the tree into geological time. The dates of other points in the tree are then estimated consistently with these calibration points. Sheridan et al. (2003) used rRNA sequences to create a phylogenetic tree of major archaeal and bacterial groups, and used a calibration point of 2.65 Ga for the origin of cyanobacteria, based on the detection of 2-methylhopanoids in sedimentary rocks of this age (Summons et al., 1999). They estimated a time of 4.29 Ga for the LUCA and 3.46 Ga for both the earliest branch point within Archaea and the earliest branch point within Bacteria. These dates are consistent with other types of evidence that we already discussed. If stromatolites go back to 3.7 Ga, then there must have been a diversity of mat-forming organisms by then. Phylogenetic methods cannot give information before the root of the tree; therefore, the 4.29 Ga time estimate for the LUCA is the earliest point accessible from phylogenetics, and the origin of life must be before that. This point is consistent with the estimate of when Earth became habitable after the Moon-forming event (roughly 4.52–4.32 Ga) under the assumption that the LHB did not completely sterilize Earth at a later date.
It should be realized, however, that there is a large margin for uncertainty in dates derived from molecular clocks, especially when pushing back these methods to the earliest points on the evolutionary tree. The rate of evolution varies substantially between organisms and between genes in the same organism, and these things can be accounted for, to some extent, in estimates of dates (Rambaut and Bromham, 1998; Drummond et al., 2006). However, these more sophisticated methods have not yet been attempted for estimating the age of the LUCA, as far as we are aware.
Evolutionary studies of photosynthetic bacteria are particularly relevant to determining the biosignature boundary date because (1) stromatolites are formed by photosynthetic bacteria, (2) low δ13C signatures are taken as an indication of the existence of photosynthetic organisms that use CO2 from the air, and (3) the rise of O2 in the atmosphere is thought to derive from photosynthesis. Oxygenic photosynthesis today is carried out by cyanobacteria, and by plants and algae that contain chloroplasts derived from cyanobacteria. The date for the incorporation of plastids into eukaryotic cells is somewhere between 2.1 and 1.2 Ga, depending on which group of fossils is taken to be the earliest eukaryotic algae (McFadden, 2014). This date is substantially later than the origin of cyanobacteria.
Bacteria performing anoxygenic photosynthesis almost certainly existed before cyanobacteria. Bacteria capable of anoxygenic photosynthesis include species from the following phyla: Chloroflexi, Chlorobi, Firmicutes, Proteobacteria, Gemmatimonadetes, Acidobacteria, and possibly Actinobacteria (Rubrobacter). Gupta (2013) has studied molecular signatures for these different phyla and concludes that Chloroflexi were the earliest lineage in which photosynthetic ability was fully developed. Chloroflexi are filamentous bacteria, similar to the fossil organisms found in stromatolites. They carry out anoxygenic photosynthesis and could correspond to very early phototrophic microbial communities observed at 3.4 Ga (Olson, 2006; Tice and Lowe, 2006). Olson (2006) also discusses the geological evidence for the emergence of cyanobacteria carrying out oxygenic photosynthesis by 2.8 Ga, close to the calibration point used by Sheridan et al. (2003) already discussed. The emergence of the Chloroflexi group was estimated as 3.1 Ga by Sheridan et al. (2003), which fits reasonably with the scenario aforementioned. As we noted in Section 5.1, the dramatic rise in atmospheric oxygen occurring at the GOE, around 2.4–2.3 Ga, seems to be somewhat after the first appearance of cyanobacteria.
Now that many whole genomes have been sequenced for prokaryotic organisms, the process of genome evolution can be studied. Phylogenies for thousands of gene families have now been mapped to Earth's geological timeline by using models of gene gain and loss and horizontal transfer (David and Alm, 2011). This shows that there was a period of innovation of new gene families in the Archean eon between about 3.3 and 2.8 Ga, which corresponds to a period of diversification among prokaryotic lineages. Several time calibration points were used. They chose to set the date for the LUCA as <3.85 Ga, based on carbon isotope evidence for the earliest life that we already discussed (Mojzsis et al., 1996; Rosing, 1999). They were also able to follow the change in frequency of genes involved in pathways linked to molecular oxygen, which occurs over the period during which the oxygen level increases in the atmosphere.
Overall, although molecular phylogenetic methods are perhaps not the most reliable way to estimate dates, the molecular studies seem to be consistent and to add some further support to the conclusions derived from geological evidence.
7. Discussion: How Quickly Did Life Emerge on Earth?
The timeline that illustrates the essential measurements and the resulting constraints on the emergence of life is shown in Figure 1. Earth formed ∼24 Myr after the first solids condensed in the Solar System (the latter of which occurred at ∼4.568 Ga). The impact of Theia with the proto-Earth ∼28–128 Myr after that led to the complete melting of Earth's surface and the formation of the Moon. Finally, Earth's magma ocean cooled to form a solid surface, leading to a potentially habitable world another ∼0.02–100 Myr later. The absolute earliest Earth that could have been habitable is, therefore, ∼4.5 Ga. In contrast, the absolute latest Earth that could have been habitable is ∼3.9 Ga, as the habitability boundary depends strongly on whether life could emerge during a sustained, declining asteroid bombardment, or survive the potential LHB.
Once life emerged, the first solid imprints of its existence appear in 3.7-Gyr-old rocks of sedimentary origin in a location that is exposed today in southwest Greenland. The imprints of life at 3.7 Ga come in two forms: (1) graphite globules formed out of sedimentary rock that included the remains of organisms with biologically depleted δ13C signatures and (2) fossilized stromatolite-like structures that formed from photosynthetic organisms in microbial mats. At 3.43–3.48 Ga, more photosynthetic organisms left behind their fossilized imprint in the form of stromatolites. And at 3.4 Ga, the first spheroidal/ellipsoidal and tubular single-celled organisms imprinted their shapes into the geological record. The rise in atmospheric oxygen due to oxygenic photosynthetic organisms did not begin to leave an imprint in the rock record until 2.95 Ga. This is when oxygenic photosynthesizers likely began to accumulate in shallow marine settings. Finally, at 2.4–2.3 Ga, the oxygen levels in the atmosphere rose in a GOE as oxygenic photosynthesizers proliferated and oxygen sinks near Earth's surface became saturated.
There is a large range for the outer boundary for the origin of life (4.5–3.9 Ga). Thus, to analyze this time frame, we explore two cases. (1) Asteroidal impacts on the Hadean Earth did not postpone or reset the origin of life. (2) Asteroidal impacts continuously postponed the emergence of life, or, specifically in the case of the LHB, reset the entire process. This removes the necessity to debate which scenario for asteroid bombardment occurred on the early Earth and focuses instead on how asteroid impact frequency may affect the process of forming life.
In case 1, life emerged in the wide time frame of 4.5–3.7 Ga. The outer boundary in this case is based on the earliest estimate for the Moon-forming impact, around 4.516 Ga, followed by efficient radiative cooling to clement temperatures (taking ∼0.02–16 Myr). Based on the consolidated evidence in this review, this case represents the widest, and, therefore, the most conservative time interval for the origin of life. In this case, it would have taken ∼800 million years to go from a habitable world to a population of organisms that can imprint their δ13C signature in rocks and form domical stromatolite-like structures. Eight hundred million years is a short period, astronomically speaking, but a long period, evolutionarily speaking. In an RNA world setting (Neveu et al., 2013), life emerged through the Darwinian evolution of chemically produced RNA molecules (Pearce et al., 2017). If this process—beginning with prebiotic chemistry and ending at the LUCA—took 800 million years, perhaps life could be a rare occurrence. After all, 800 million years is 15% of the time our planet has to be habitable (assuming our oceans boil away due to the greenhouse effect in 1 Gyr; Goldblatt et al., 2013).
In case 2, life emerged in the shorter time interval of 3.9–3.7 Ga. This is the narrow time frame scenario, which assumes that either the LHB wiped clean any life or prelife molecules that emerged before 3.9 Ga or that asteroid impacts were too disruptive for life to emerge during a sustained, declining bombardment period from 4.5 to 3.9 Ga.
Given these two cases, if life emerged on a timescale of <800 million years, does this say anything about ubiquity of life on habitable planets throughout the Universe? In truth, we cannot make this conclusion, as Earth is a sample size of n = 1. In other words, there is a strong selection bias in estimating the probability of life emerging elsewhere in the Universe. Indeed, it has been argued that if intelligent life requires a great deal of time to evolve, Earth may be a rare planet, on which life got started unusually early (Carter, 1983).
So, is the oldest evidence of life yet to be found? Have all sedimentary rocks older than 3.7 Ga been melted into magma? Have we reached our limit for using δ13C signatures and need to develop a different technique to find evidence for earlier life? Because biosignatures are detected in the oldest preserved sedimentary rocks, we know that life existed before their formation time. And although the 3.8 and 3.85 Ga rock samples from Isua Greenland are not of sedimentary origins, and, therefore, their low δ13C content could be explained by high-temperature, abiotic processes (Fedo and Whitehouse, 2002), do they still hint at the existence of life at this time? Perhaps an advancement in techniques will ultimately distinguish the low δ13C values in these samples from the known abiotic mechanisms.
Based on the recent activity in the research fields of biogenic isotopes, stromatolites, and microfossils (Noffke et al., 2013; Sugitani et al., 2013; Ohtomo et al., 2014; Planavsky et al., 2014; Brasier et al., 2015; Hickman-Lewis et al., 2016; Nutman et al., 2016; Djokic et al., 2017; Dodd et al., 2017), it would seem that researchers are still actively looking for older pieces of evidence of life's existence on Earth. If a high level of interest sustains in these fields, it would not be surprising to see the 3.7 Ga biosignature boundary being pushed to earlier dates in the next decade. However, it is also possible that in the same time, abiotic processes will be revealed to explain both the stromatolite morphologies and the low δ13C values in old rocks of sedimentary origin.
Whether the LHB occurred has not yet reached consensus. Researchers are still asking whether a single cataclysm occurred (Zellner and Delano, 2015), and more evidence will be needed to sway the consensus in either direction. Planet formation theorists are actively improving models for the formation of our solar system (Jacobson et al., 2014; Raymond and Morbidelli, 2014), which could eventually constrain the inward and outward migration of Jupiter to better understand the likelihood of a late lunar cataclysm being caused by such an event.
Finally, many researchers such as Rugheimer et al. (2015), Mollière et al. (2015), Hu and Seager (2014), and Kaltenegger et al. (2013) have been improving atmospheric models, which may someday be sophisticated enough to include CO2 subduction and degassing from meteorites. These models could better constrain the cooling time for Earth's magma mantle, and the likelihood of Earth losing all of its atmosphere and freezing over.
As a final thought, we note that even the shorter 200-million-year time frame is very much longer than the life times of individual biomolecules. A key step for the origin of life is the creation of an autocatalytic, self-replicating chemical system. We envisage a “searching and waiting period” in which chemical synthesis generates and explores a diversity of random, nonfunctional biopolymer sequences, until a rare event occurs that establishes a stable small group of replicators. Our understanding of molecular evolution, the nature of the earliest replicators, and the environment in which they existed is not good enough to make a first-principles prediction of how long a search period would have been required. The time interval between the habitability and biosignature boundaries, which we have been considering in this article, tells us some information about how long the search period might have been, but it should be remembered that the time resolution of our biological and geochemical records is poor, and there remains the possibility that the search and wait period could have been much less than 200 million years. The initiation of life may be considered as a rare event on a biochemical and evolutionary timescale, and at the same time very rapid on the scale of planetary lifetimes. A key goal of the field of astrobiology and the origin of life is to estimate the average searching and waiting period on habitable planets, and hence to be able to give reliable estimates of the frequency of life on other worlds.
Footnotes
Acknowledgments
We are grateful to two anonymous referees whose reports helped considerably to clarify the text. We are especially grateful to Allyson Brady, Greg Slater, and Radhey Gupta for their invaluable comments on the various topics in this review. We thank Steve Janzen—at McMaster Media Resources—for his superb work in rendering ![]() . This work was supported by the NSERC discovery grants of P.G.H. and R.E.P. Finally, B.K.D.P. was supported by an NSERC Canada graduate scholarship (CGS-M) and an Ontario graduate scholarship (OGS).
. This work was supported by the NSERC discovery grants of P.G.H. and R.E.P. Finally, B.K.D.P. was supported by an NSERC Canada graduate scholarship (CGS-M) and an Ontario graduate scholarship (OGS).
Author Disclosure Statement
No competing financial interests exist.