
Abstract
The Mars 2020 mission will analyze samples in situ and identify any that could have preserved biosignatures in ancient habitable environments for later return to Earth. Highest priority targeted samples include aqueously formed sedimentary lithologies. On Earth, such lithologies can contain fossil biosignatures as aromatic carbon (kerogen). In this study, we analyzed nonextracted kerogen in a diverse suite of natural, complex samples using colocated UV excitation (266 nm) time-gated (UV-TG) Raman and laser-induced fluorescence spectroscopies. We interrogated kerogen and its host matrix in samples to (1) explore the capabilities of UV-TG Raman and fluorescence spectroscopies for detecting kerogen in high-priority targets in the search for possible biosignatures on Mars; (2) assess the effectiveness of time gating and UV laser wavelength in reducing fluorescence in Raman spectra; and (3) identify sample-specific issues that could challenge rover-based identifications of kerogen using UV-TG Raman spectroscopy. We found that ungated UV Raman spectroscopy is suited to identify diagnostic kerogen Raman bands without interfering fluorescence and that UV fluorescence spectroscopy is suited to identify kerogen. These results highlight the value of combining colocated Raman and fluorescence spectroscopies, similar to those obtainable by SHERLOC on Mars 2020, to strengthen the confidence of kerogen detection as a potential biosignature in complex natural samples. Key Words: Raman spectroscopy—Laser-induced fluorescence spectroscopy—Mars Sample Return—Mars 2020 mission—Kerogen—Biosignatures. Astrobiology 18, 431–453.
1. Introduction
1.1. Searching for biosignatures in martian samples
T
To meet mission goals, there is a need to assess the ability of in situ techniques selected for the instrument payload to identify the best samples through realistic terrestrial analog studies. To maximize the chances of finding biosignatures in collected samples, it is crucial to develop a strategy for in situ selection of samples, based on their contextual association with past habitable environments and potential to preserve biosignatures (Farmer and Des Marais, 1999; Farmer, 2012).
The largest pool of organic matter on Earth is sedimentary reduced organic carbon (Farmer and Des Marais, 1999). After burial, this carbon undergoes degradation (e.g., thermal maturation) and alteration into complex mixtures of macromolecular amorphous and aromatic carbon, primarily as polycyclic aromatic hydrocarbons (PAHs), known as kerogen. The initial composition, structure, and thermal maturation pathway will define the aromaticity and final makeup of the kerogen. For example, low thermal maturity kerogen is typically composed of long chain aliphatic hydrocarbons. See Marshall et al. (2010) for a review of how terrestrial organic matter matures to kerogen. On Earth, kerogen represents ∼1016 tons of C compared with ∼1012 tons as living biomass (Vandenbroucke and Largeau, 2007).
Although there are nonbiological sources for kerogen (Section 1.2), given biogenic kerogen's abundance on Earth, one might expect it to be the likeliest biosignature detectable in solid samples on Mars (although Mars 2020 instruments will search for organics from other biosignature sources as well).
Terrestrial kerogen is commonly captured and preserved in aqueous lithologies, such as silica (chert), carbonates, sulfates, and mudstones, all of which have been detected on Mars. Chert is a dense, highly silicified, fine-grained sedimentary rock, whose dense crystalline structure resists chemical weathering (McIlreath and Morrow, 1990). Its prolonged residence time in the crust makes it one of the most common lithotypes in which microbiota are preserved in the Precambrian record on Earth (Farmer and Des Marais, 1999). Chert, its precursor opaline silica, and a low-pressure, high-temperature polymorph, tridymite, have all been detected recently at Mars rover landing sites (Skok et al., 2010; Ruff et al., 2011; Morris et al., 2016).
Carbonates such as calcite (CaCO3) and magnesite (MgCO3) are also common host minerals for Earth's Precambrian fossil record (Farmer and Des Marais, 1999). Carbonates have been detected on Mars both from orbit (Ehlmann et al., 2008b) and from the surface (Madden et al., 2004; Morris et al., 2010).
Gypsum (CaSO4·H2O), another common lithotype for preserving kerogenous microfossils, is considered a promising target in the search for past life on Mars (Schopf et al., 2012). Gypsum and other hydrated sulfates have been observed both from orbit (Bibring et al., 2006; Glotch and Rogers, 2007) and in situ (Squyres et al., 2004, 2012; Glotch et al., 2006) as components of soils and evaporite deposits.
Fine-grained mudstones, particularly those that contain hydrated aluminum phyllosilicates (clays), have a high potential for capturing and preserving organic matter (Farmer and Des Marais, 1999; Ehlmann et al., 2008a). On Earth, organic compounds adsorb as molecular monolayers on clay surfaces. Clays, including smectites, have been identified on Mars from orbit (Ehlmann et al., 2008a; Noe Dobrea et al., 2012) and by the Mars Science Laboratory rover (Vaniman et al., 2014; Bristow et al., 2015). Furthermore, all of these lithotypes have been identified in martian meteorites (Bridges and Grady, 2000; Bridges et al., 2001; Steele et al., 2007, 2012a, 2012b).
The above lithotypes have long been considered high-priority targets in the search for a martian fossil record (Farmer and Des Marais, 1999; Schopf et al., 2012) if such a record exists. Kerogen has not been detected on Mars, but it exemplifies one possible biosignature to search for at the landing site selected for Mars 2020. For this study, we selected seven diverse terrestrial samples (Table 1) that make up some of the most common lithotypes on Earth to preserve kerogen. These samples were analyzed with UV time-gated (UV-TG) Raman and fluorescence spectroscopies.
Bolded phases indicate the most abundant phase and also the main kerogen preservation phase.
Phases suspected based on microscopy observations whose definitive identities remain unconfirmed by other techniques.
Visible to near infrared reflectance spectroscopy confirmed the presence of hematite, goethite, and lepidocrocite after microscopy suggested their presence (Shkolyar and Farmer, in revision) but did not provide abundances.
1.2. Biosignature searches with Raman spectroscopy
Raman spectroscopy was selected for Mars 2020 to identify potential biosignatures and their mineral context in situ to help inform decisions in selecting samples for caching. Raman spectroscopy is a light-scattering, vibrational spectroscopy technique that is well suited for this task. First, it allows the identification of both organic and inorganic compounds (including minerals), even when present together. Second, unlike similar in situ techniques, Raman spectroscopy is not destructive to samples (with low laser energy density). In addition, the technique requires no sample preparation, although surface grinding (e.g., using the Rock Abrasion Tool; Gorevan et al., 2003) optimizes the Raman signal by reducing sample topography as well as removing surface weathering rinds.
In a Raman spectrum, kerogen is identified by two bands that represent the vibrational modes of macromolecular sp2 carbon, whether or not they are biogenic. With visible laser wavelength excitation (λex), these spectral features consist of a D band, or disordered lattice stretching mode of aromatic carbon at ∼1350 cm−1, and an in-plane C═C stretching mode, the G band, present between 1560 and ∼1600 cm−1 (Ferrari and Robertson, 2001; Pasteris and Wopenka, 2003; Marshall et al., 2010).
Additional features of lower intensity may also be present at ∼2450, ∼2695, ∼2735, ∼2920–2940, and ∼3248 cm−1, representing second-order modes of first-order bands that result from overtone or combination scattering, structural ordering, and potential C-H stretching modes associated with kerogen and carbon (Pasteris and Wopenka, 2003; Ferrari and Robertson, 2004; Czaja et al., 2009; Marshall et al., 2010). D and G bands can be a convolution of multiple additional bands (Czaja et al., 2009; Marshall et al., 2010).
When interrogated with UV λex, these compounds display slightly different Raman vibrational modes due to enhanced cross sections of these organic vibrational modes (Section 1.3). With UV λex, the region between 1100 and 1500 cm−1 can consist of many convolved bands, attributable to C═C “breathing modes” in ringed structures such as PAHs, sometimes interlinked by polyene chains (Czaja et al., 2009; Abbey et al., 2017). In the UV, the D band (which can peak between 1296 and 1401 cm−1; Abbey et al., 2017) arises only when sp2 carbon sites are in disordered rings and is absent when those sites are highly graphitic or present in chains of rings (Ferrari and Robertson, 2001).
Raman spectroscopy has long been used to assess the biogenicity of organic and inorganic materials. For example, extant endolithic biomarkers (Dickensheets et al., 2000; Jorge-Villar and Edwards, 2013 and references therein), putative kerogenous microfossils in ∼3.5 Ga cherts (Brasier et al., 2002; Schopf et al., 2002; Marshall et al., 2011), and graphitic carbon in ∼3.87 Ga samples (Papineau et al., 2011; Bell et al., 2015) have been examined by using Raman spectroscopy with laser excitation wavelengths between 488 and 1064 nm. Raman spectroscopy has also been used, with 532 nm laser excitation, to identify D and G bands in abiotic macromolecular carbon (MMC) in many martian meteorites (Steele et al., 2012a, 2012b, 2016).
These analyses emphasize that the use of Raman spectroscopy for the detection of D or G bands of biogenic kerogen can be similar to its use for the detection of those of disordered, nonbiogenic MMC, and therefore, Raman detections of D and G bands alone do not establish biogenicity (Brasier et al., 2002; Pasteris and Wopenka, 2003; Marshall et al., 2010; Bower et al., 2013).
By extension, on Mars, the detection of D and G bands in a Raman spectrum would be evidence of aromatic carbon, but it would not distinguish biogenic kerogen from abiotic MMC. Instead, it would indicate a compelling potential biosignature and favor sample caching. After Earth return, detailed chemical and biogenicity analyses would be needed.
To make the best caching decisions, it will be essential to understand the geological (e.g., microtextural and geochemical) context in which organics are preserved, a primary recommendation of the Mars 2020 Science Definition Team (Mustard et al., 2013). Raman spectroscopy can provide this needed context, particularly when combined with microscale imaging and fluorescence spectroscopy, as demonstrated in this study.
1.3. Fluorescence in the Raman spectrum
Raman spectroscopy is challenged by interfering background fluorescence, a type of luminescence often several orders of magnitude stronger than the Raman scattering signal. Fluorescence occurs when an incident photon is absorbed by a molecule or species, exciting it to a higher electronic state. The molecule then relaxes back to the ground state, emitting a photon. Many minerals and organics exhibit fluorescence that can conceal their Raman signatures. Background fluorescence has been shown to hamper the identification of minerals (Bartholomew, 2012), kerogen and its components (Marshall et al., 2006, 2010; Schopf et al., 2012), and other biosignatures targeted for Mars (Dickensheets et al., 2000), both in the laboratory and when using field-deployed Raman systems (Jehlicka et al., 2010).
Furthermore, the design of Raman systems does not often engage the challenges of natural geological materials (e.g., Bartholomew, 2012, 2014). In prioritizing samples for Mars Sample Return (MSR) based on Raman spectra, false negative conclusions about the value of a sample for caching may occur if collected background fluorescence hides relevant Raman bands that indicate potential biosignatures (e.g., those described in Section 1.2).
Strategies to mitigate fluorescence signals in Raman spectra include (1) tuning the excitation wavelength to the UV, where it is in resonance with the targeted substance (Asher, 1993; Frosch et al., 2007), (2) using a confocal Raman setup (Brasier et al., 2002; Schopf et al., 2002; Fries and Steele, 2010; Bower et al., 2016), (3) using shifted-excitation Raman difference system (Shreve et al., 1992), or (4) using time-gated Raman spectroscopy. Here, we explore time gating and UV excitation.
Time gating uses pulsed laser excitation and gated detection (i.e., detection of only those photons scattered or emitted in temporal proximity to the laser pulse) to capture the instantaneous Raman-scattered photons and “gate out” (exclude) the longer lifetime fluorescence signal in the time domain (Fig. 1; Martyshkin et al., 2004; Gaft and Nagli, 2009). In contrast, with continuous wave (CW) Raman spectroscopy, the laser continuously irradiates the sample without laser pulsing or gating.
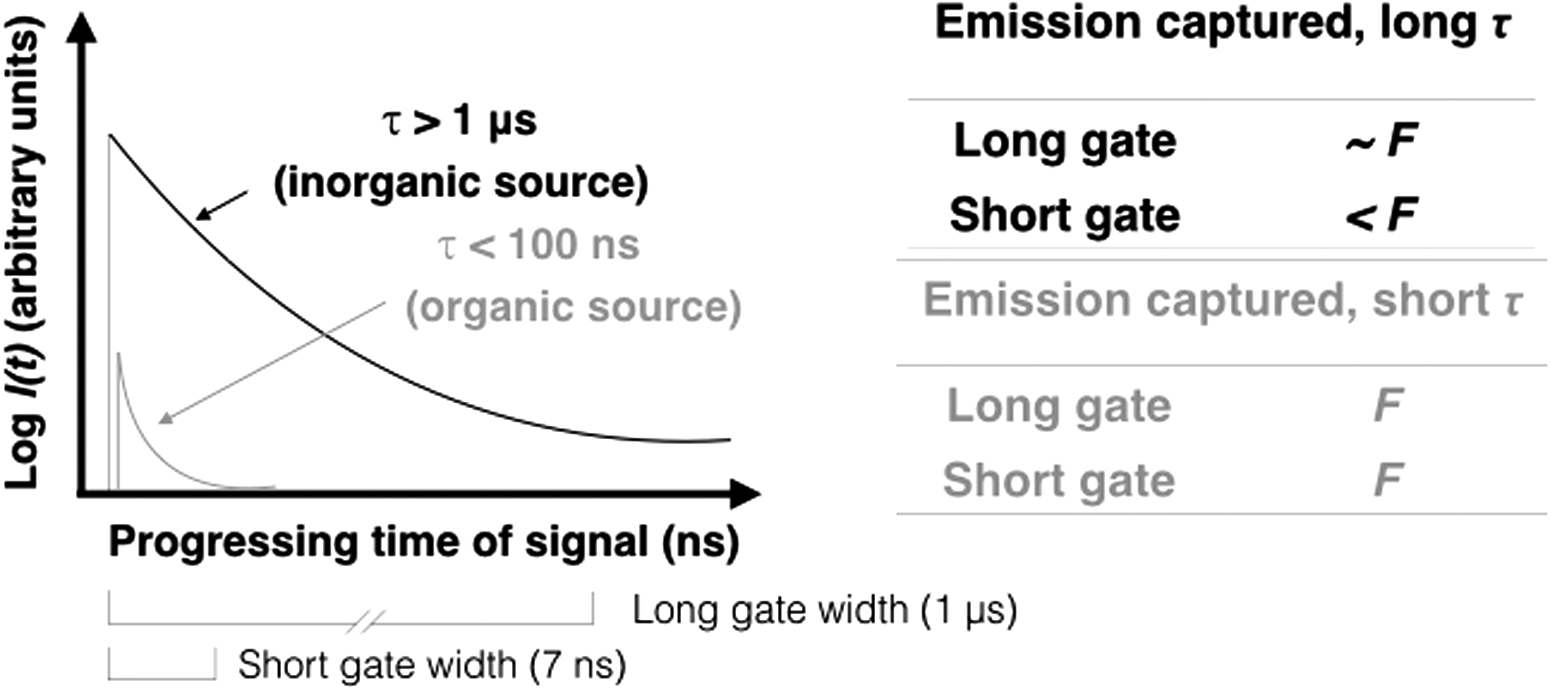
Principles of time-resolved fluorescence. Fluorescence emission I(t) decays exponentially for a single excited state. F is the arbitrary fluorescence emission of a sample after interaction with one laser pulse, shown as a function of detector time gate width. Inorganic materials emit long-lifetime (τ) fluorescence (black curve); a long gate captures almost the full emission (∼F), but a shorter gate captures less than the full emission (<F). Organics emit short τ fluorescence (gray curve); both long and short gates would capture the majority of a signal (F). The gate widths shown are those used in our experimental setup.
Another fluorescence reduction strategy explored here is the λ ex in the UV, which has two advantages. First, a UV λ ex causes Raman and fluorescence signals to become energetically separated (Tarcea et al., 2007). Second, depending on the wavelength and targeted compound, a UV λ ex can induce resonance within electronic bands of certain classes of organics (Hug et al., 2005; Marshall et al., 2010 and references therein), including complex organics such as kerogen (Czaja et al., 2009). Resonances can increase scattering efficiency by orders of magnitude, allowing organic detection limits from ppm (Beegle et al., 2015; Abbey et al., 2017) to ppb levels (Storrie-Lombardi et al., 2001). However, this also means that signals from trace organic contaminants on the surface, which may have a similar structure to kerogen (i.e., containing PAHs), can also be amplified (Ray et al., 2000; Ferrari and Robertson, 2001).
1.4. Fluorescence spectroscopy
Fluorescence can provide useful information when a dedicated spectrometer collects laser-induced fluorescence spectra. Collected in this way, the fluorescence phenomenon can be used to one's advantage in organic analysis. When examined in the temporal domain, the fluorescence intensity I(t) decays over time t as I(t) = I0 e−t/τ , where decay lifetimes, τ (which represents the time a fluorophore will remain in an excited state), can help determine whether fluorescence originates from inorganic or organic sources (Fig. 1).
Fluorescence originating from inorganic sources, such as lattice defects, trace metals, or rare-Earth impurities, typically has a τ >1 μs, whereas fluorescence originating from organic fluorophores typically has τ ≲ 100 ns (Sharma et al., 2003; Bozlee et al., 2005; Misra et al., 2016). Kerogen biogenicity cannot be definitively established with Raman spectroscopy alone (Pasteris and Wopenka, 2003; Marshall et al., 2010), but colocated gated UV Raman and fluorescence data sets can be obtained on a microscale location on a sample, where kerogen candidates have been previously targeted with imaging analyses, as done here, to enhance the confidence of kerogen identification.
1.5. Raman spectroscopy on Mars rovers
To date, neither Raman nor laser-induced fluorescence spectroscopy instruments have flown on a space mission. The Mars 2020 rover will include two of the first flown Raman and fluorescence instruments to identify and cache samples containing potential organic biosignatures. One is the Scanning Habitable Environments with Raman & Luminescence for Organics & Chemicals (SHERLOC), an arm-mounted resonance Raman (810 to >3600 cm−1) and fluorescence (250–360 nm) spectrometer, with a deep-UV 248.6 nm pulsed laser source (Beegle et al., 2015). The other is SuperCam, an integrated suite of four instruments that include a stand-off spectrometer and a microimager. SuperCam will have a pulsed laser with time-gated (≲100 ns) excitation at 532 nm for Raman (50–4400 cm−1) and fluorescence (534–850 nm) measurements (Clegg et al., 2015).
Although this study aims to inform data interpretations that may be made with SHERLOC, there are many differences between our UV Raman and fluorescence system and SHERLOC (e.g., spot sizes, spatial and spectral resolutions, and fluorescence collection ranges).
Another Raman system is being planned for ExoMars, which is a European Space Agency rover also planned to launch in 2020. The ExoMars Raman laser spectrometer is planned to be the first CW 532-nm Raman system flown and will be designed to perform in situ analyses to search for potential biosignatures (Bost et al., 2015), if any are detected and analyzed.
1.6. Objectives of this study
The rapidly approaching Mars 2020 mission brings about a crucial need to better understand the capabilities of Raman and fluorescence instruments to identify biosignatures in realistic, natural, and complex Mars analog samples. Recent work has demonstrated the capabilities of UV Raman and fluorescence instruments for biosignature detection on Mars (e.g., Smith et al., 2014), including those that form the foundation of the SHERLOC instrument (Beegle et al., 2014, 2015, 2016; Abbey et al., 2017) and the foundation of the UV system used here (Eshelman et al., 2014, 2015; Skulinova et al., 2014). However, these previous studies investigated synthetic, pure, or extracted and concentrated organics, or mineral powders spiked with organic molecules, and they do not take into account complex interactions of mixed-phase, fossilized organics interacting with their host matrix, as found in nature.
Others have examined natural, although extant and labile, biosignatures with Raman spectroscopy (e.g., Dickensheets et al., 2000; Jorge-Villar and Edwards, 2013) and UV time-resolved fluorescence techniques (e.g., Misra et al., 2016). However, surface conditions on Mars are unlikely to support extant life. Evidence for past life, if it existed, will likely be found as fossilized biosignatures in ancient sedimentary rocks as is the case for the record of life preserved in Precambrian rocks on Earth (Farmer and Des Marais, 1999). The Mars 2020 rover payload may have the best chances of encountering and analyzing biosignatures found as fossilized, complex, macromolecular compounds preserved within a host mineral (as detailed in Section 1.1).
In this study, we explored biosignature detection strategies using UV-TG Raman and fluorescence instruments that produce data sets on nonextracted, naturally preserved kerogen in a diverse suite of challenging field-collected samples similar to rock types targeted in the search for a potential martian fossil record, if one exists (Section 1.1). Here, we analyze a suite of such samples (Table 1) using a nanosecond-pulsed, combined UV Raman and fluorescence system. Our study goals were to: (1) explore the capabilities of UV-TG Raman and fluorescence spectroscopies for detecting naturally preserved kerogen in well-characterized, complex samples; (2) assess the effectiveness of time gating and UV laser λex in reducing fluorescence in Raman spectra of kerogen and host minerals; and (3) identify sample-specific issues that could challenge rover-based identifications of kerogen using UV Raman spectroscopy.
2. Materials and Methods
Seven samples were selected to represent a broad range of depositional environments, ages, and diagenetic histories. Sample collection localities, ages, and compositions are summarized in Table 1. All samples contained natural, nonextracted kerogen of diverse maturities and modes of preservation within host rock matrices, and exhibited diverse ranges of fluorescence.
Samples included a hydrothermal chert, silicified shale, carbonate-cemented marine sandstone, laminated sulfate–carbonate evaporite, lacustrine stromatolitic limestone, lacustrine micritic carbonate, and clay- and magnesite-rich evaporitic mudstone. Each sample was prepared as petrographic thin sections (for light microscopy and visible Raman spectroscopy), powders (for X-ray powder diffraction [XRPD]), and rock chips (for UV-TG Raman/fluorescence spectroscopy).
All samples were first characterized with microscopy, visible CW Raman spectroscopy, and XRPD. Next, spatially colocated UV-TG Raman and fluorescence spectra were obtained on the same candidate kerogen grains (precisely targeted with microscopic imaging) and mineral matrix regions, as SHERLOC may do on Mars (Beegle et al., 2015). See Supplementary Fig. S1 (Supplementary Data are available at
2.1. Petrographic microscopy
Thin section microscopy was undertaken to understand microtextures, diagenesis (postdepositional alteration processes), and mineralogy of samples (and was subsequently confirmed by other techniques). Sample paragenesis (time-ordered sequence of environmental processes and temporal relationships among phases) was also reconstructed. Thin sections were imaged with a Nikon Eclipse E600 POL polarizing light microscope and an Optronix camera system. Photomicrographs of representative areas of interest in each sample were obtained under transmitted (plane-polarized and cross-polarized) and reflected light. Standard (30-μm thick) uncovered petrographic thin sections of all samples were vacuum embedded in epoxy (nonfluorescent EPOTEK 301). Thin sections were prepared by Spectrum Petrographics, Inc.
One inch rock chips were obtained by breaking off chunks from larger samples to expose fresh interior surfaces. Chips could only be imaged under reflected light for UV-TG Raman and fluorescence analyses.
For preliminary identifications, we searched for candidate kerogen grains (∼10s of microns in size) in regions likely to preserve kerogen (e.g., darker laminae where kerogen is often concentrated; Section 3). Alternating between optical illumination settings (plane- vs. cross-polarized light; transmitted vs. reflected light) was necessary to identify candidate kerogen grains (e.g., kerogen and Fe oxides are opaque in plane-polarized or cross-polarized light, but Fe oxides are distinguishable based on their reflectivity in reflected light).
Markers were adhered onto thin section and rock chip surfaces to indicate the precise locations of targeted kerogen as well as mineral regions for further analyses. This marker approach allowed us to successfully locate the same microscale features for Raman spectroscopy analyses. We then documented major and minor mineral components, representative microtextures, and cross-cutting relationships. Raman and XRPD were used to refine mineral identifications that were predicted by using microscopy.
2.2. Visible CW Raman spectroscopy
We used a visible CW Raman spectrometer at ASU's Center for Solid State Science to obtain point spectra of candidate kerogen grains and minerals in situ. This system is neither optimized for planetary applications nor intended to be compared with the UV Raman instrument described here. Rather, this system was used to understand the 532 nm laser-induced background fluorescence behavior of kerogen and its host matrix in preparation for UV-TG Raman analyses, with the understanding that Raman and fluorescence signals overlap in the visible and become energetically separated with UV λex (Tarcea et al., 2007).
This CW Raman system comprises a 532 nm Coherent Sapphire SF laser source and a Princeton Instruments liquid nitrogen cooled charge-coupled device (CCD) detector and Acton 300i spectrograph. The laser was focused onto the sample by using a 50X APO Mitutoyo objective. The Raman signal was collected through an Acton 300i spectrograph (1200 lines/mm grating) onto a Princeton Instruments liquid nitrogen cooled CCD. The system had a spectral resolution of ∼2 cm−1, spatial resolution of ∼0.5 μm, and an acquisition window from 70 to 2000 cm−1.
Raman point spectra were acquired on previously targeted candidate kerogen grains and mineral matrices (Section 2.1). A built-in transmitted light microscope was used to locate previously targeted regions of interest (shown in Figs. 3 –9 with the green laser spot on regions interrogated). The Raman laser spot (<5 μm diameter) was manually focused on the sample surface. Spectra were acquired over a range of integration times, power settings, and depths below the thin section surface to obtain spectra that minimized fluorescence and maximized signal to noise (S/N) ratios as well as spectral band visibility. Acquisitions ranged from one to twenty 10- to 15-s integrations at low energies of 0.75 to 6 mW power (or ∼7.6 × 10³ to ∼6.1 × 10⁴ W/cm2) for each analysis (or higher where noted). Sampling depths were ∼1 to 20 μm below thin section surfaces.
Raman shift positions were calibrated with a cyclohexane standard. No spectral postprocessing was applied to Raman spectra to highlight fluorescence contributions to the total signal. Minerals were identified with CrystalSleuth database (Downs, 2006).
For Raman analyses, care was taken to avoid contamination. Contamination could arise from thin section epoxy; however, no spectral features from epoxy were seen (Supplementary Fig. S2). Contamination arising from marker adhesive was mitigated by cleaning each thin section (but not rock chips) with 95% ethanol and distilled water. In addition, the micron-scale imaging resolution of the Raman optical imaging system allowed us to ensure that the laser spot did not overlap with the adhered markers.
2.3. Visible CW confocal Raman imaging spectroscopy
To elucidate the nature, size, and distribution of organics in one representative sample, we performed Raman imaging on the stromatolitic limestone sample chip (Fig. 6C–G).
For this analysis, we used a customized WITec α-scanning near-field optical microscope incorporating confocal Raman spectroscopic imaging, because it provides exceptional spatial (micrometer scale) and spectral resolution (Bower et al., 2016) and reduces the much more intense fluorescence signal through the confocal optics used (Fries and Steele, 2010). This instrument is capable of collecting either single spectra or 2D micro-Raman maps. Maps of organic distributions on the stromatolite surface were generated by using a frequency-doubled solid-state YAG laser (532 nm) operating at 0.01–5 mW output power through a 600 lines/mm grating onto an Andor EMCCD chip. Spectra (with an acquisition range from 0 to 3600 cm−1) were taken at each pixel with an integration time of 2 s per pixel at 3 μm step sizes. Data processing was performed with WITec Control Four 4.1 software.
2.4. X-ray powder diffraction
For XRPD analyses, bulk powdered samples were obtained for each sample for confirmation of mineralogy determined by the mentioned analyses. (Kerogen cannot be identified with XRPD.) Bulk sample fractions were chipped, crushed, ground with a quartz mortar and pestle, and sieved to <150 μm. A Siemens D5000 X-ray Diffractometer with a Ni-filtered Cu radiation source was used to identify minerals in bulk sample powders. Powders were scanned from 5° to 81.759° with a step size of 0.016°. Operating conditions were 40 kV at 30 mA using CuKα (λ α1 = 1.5060 Å; λ α2 = 1.54439 Å) with an 8-s dwell time, for an analysis time of 12 h per sample. Background subtraction and mineral identifications were performed with the JADE™ version 9 (Materials Data, Inc.), with the International Centre for Diffraction Data database.
2.5. UV-TG Raman and fluorescence spectroscopies
UV radiation absorption by thin section components (glass slides and embedding epoxy) significantly weakens the Raman signal. Therefore, we used flat rock chips for UV-TG Raman and fluorescence analyses. Sample surfaces were ground flat with aluminum oxide abrasive paper (400 grit; Northon St. Gobain Premium) to reduce surface organic contamination for all but the hardest samples (chert and silicified shale). Microscopy confirmed that no abrasive paper contaminants were present on the ground sample surfaces. Abraded rock surfaces represent an analogous sample preparation to what will be possible on Mars when using a rock abrasion tool (Gorevan et al., 2003).
For each sample, four data sets were obtained on the same microscale spot in samples with pretargeted candidate kerogen grains and mineral matrix regions: (1) Raman spectrum, long gate (to mimic a nongated, CW 266 nm Raman system); (2) Raman spectrum, short gate (to assess the effectiveness of gating for fluorescence reduction); (3) fluorescence spectrum, long gate; and (4) fluorescence spectrum, short gate.
Short and long gate widths were 7 ns and 1 μs, respectively, determined by using a powdered gypsum tablet standard. Even though organic fluorescence can take up to 100 ns to decay (Fig. 1), we chose a short gate of 7 ns to discriminate between organic and mineral fluorescence; in our samples, the majority of the long-lived fluorescence was rejected and most short-lived fluorescence was emitted in the first 7 ns (Fig. 11B, F). A gate delay (which coordinates opening the gate with the arrival of the laser pulse by applying an electronic delay after receiving the external trigger signal; Eshelman et al., 2015) of 2 ns was applied to short gate measurements. A total of 12,000 accumulations were acquired for all data with an exposure time (when the CCD is exposed while pulses are accumulated) of 0.05 s.
For each acquisition, a background spectrum (with the input from the laser to the sample blocked) was acquired, followed by an alanine standard for calibration, and then point spectra of regions in each sample.
Spectra were obtained with a pulsed, 266 nm laser wavelength excitation Raman combined with a laser-induced fluorescence system with a gated, intensified CCD detector. The laser spot size was ∼25 × ∼35 μm. A flat field correction was performed with an NIST deuterium lamp standard to remove CCD and edge filter irregularities. Raman spectra were acquired with a 2400 lines/mm grating, allowing a spectral range of 286–3805 cm−1. For fluorescence measurements, the Raman spectrometer grating was interchanged with a 300 lines/mm grating, allowing an acquisition range of 268–528 nm. The laser was pulsed at 5 kHz with a pulse energy of 1.6 μJ, resulting in a fluence of ∼0.2 J/cm2 (2.3 × 10⁵ W/cm2). Other system details were provided by Eshelman et al. (2015). No postprocessing was applied to Raman spectra to highlight the low fluorescence contributions to the total signal.
To quantify the effect of gating on fluorescence reduction with UV-TG Raman spectroscopy, we obtained time-resolved fluorescence spectra and associated fluorescence decay curves of selected samples. (See Section 3.9 and Fig. 11 for details.) Fluorescence spectra were obtained at increasing gate delays by accumulating a fluorescence signal and incrementing the gate delay by 0.1 ns steps. This allowed spectra to be obtained in the intensity I, time t, and wavelength λ domains. Spectra were acquired with a gate width of 3 ns, 40 accumulations per spectrum, and an exposure time of 0.05 s.
All data sets were also acquired on the following mineral standards (without sterile handling): synthetic silica sand (Barco 49, 99.7% SiO2), natural gypsum (Sigma Aldrich lot #SLBC4109V), natural dolomite (Wards research grade 49-5871 Selasvann, Norway), and natural calcite (Wards research grade, 49-5860 Chihuahua, Mexico). For a kerogen standard, 1 mg of extracted natural kerogen (94% carbon) was obtained, courtesy of R. Summons and E. Matys (Massachusetts Institute of Technology).
3. Results
3.1. Archean hydrothermal chert, Strelley Pool Formation, Pilbara, Australia
The Strelley Pool Formation is a stratiform limestone-chert sequence that hosts the oldest known coniform stromatolites likely deposited in a shallow marine environment during the Archaean (Lowe, 1980; Hofmann et al., 1999; Van Kranendonk et al., 2003; Allwood et al., 2006). Our sample was collected from a vein of black chert part of a younger dike system that cross cuts the Strelley Pool Formation at the Trendall locality.
Optical microscopy showed a quartz matrix surrounding abundant particulate grains, whose black color and absence of reflectivity are consistent with kerogen. These grains were found mostly within regions of microcrystalline (<20 μm grains) quartz; conversely, zones of coarser grained megaquartz (>20 μm grains) showed a lower abundance of those grains (Fig. 2A).
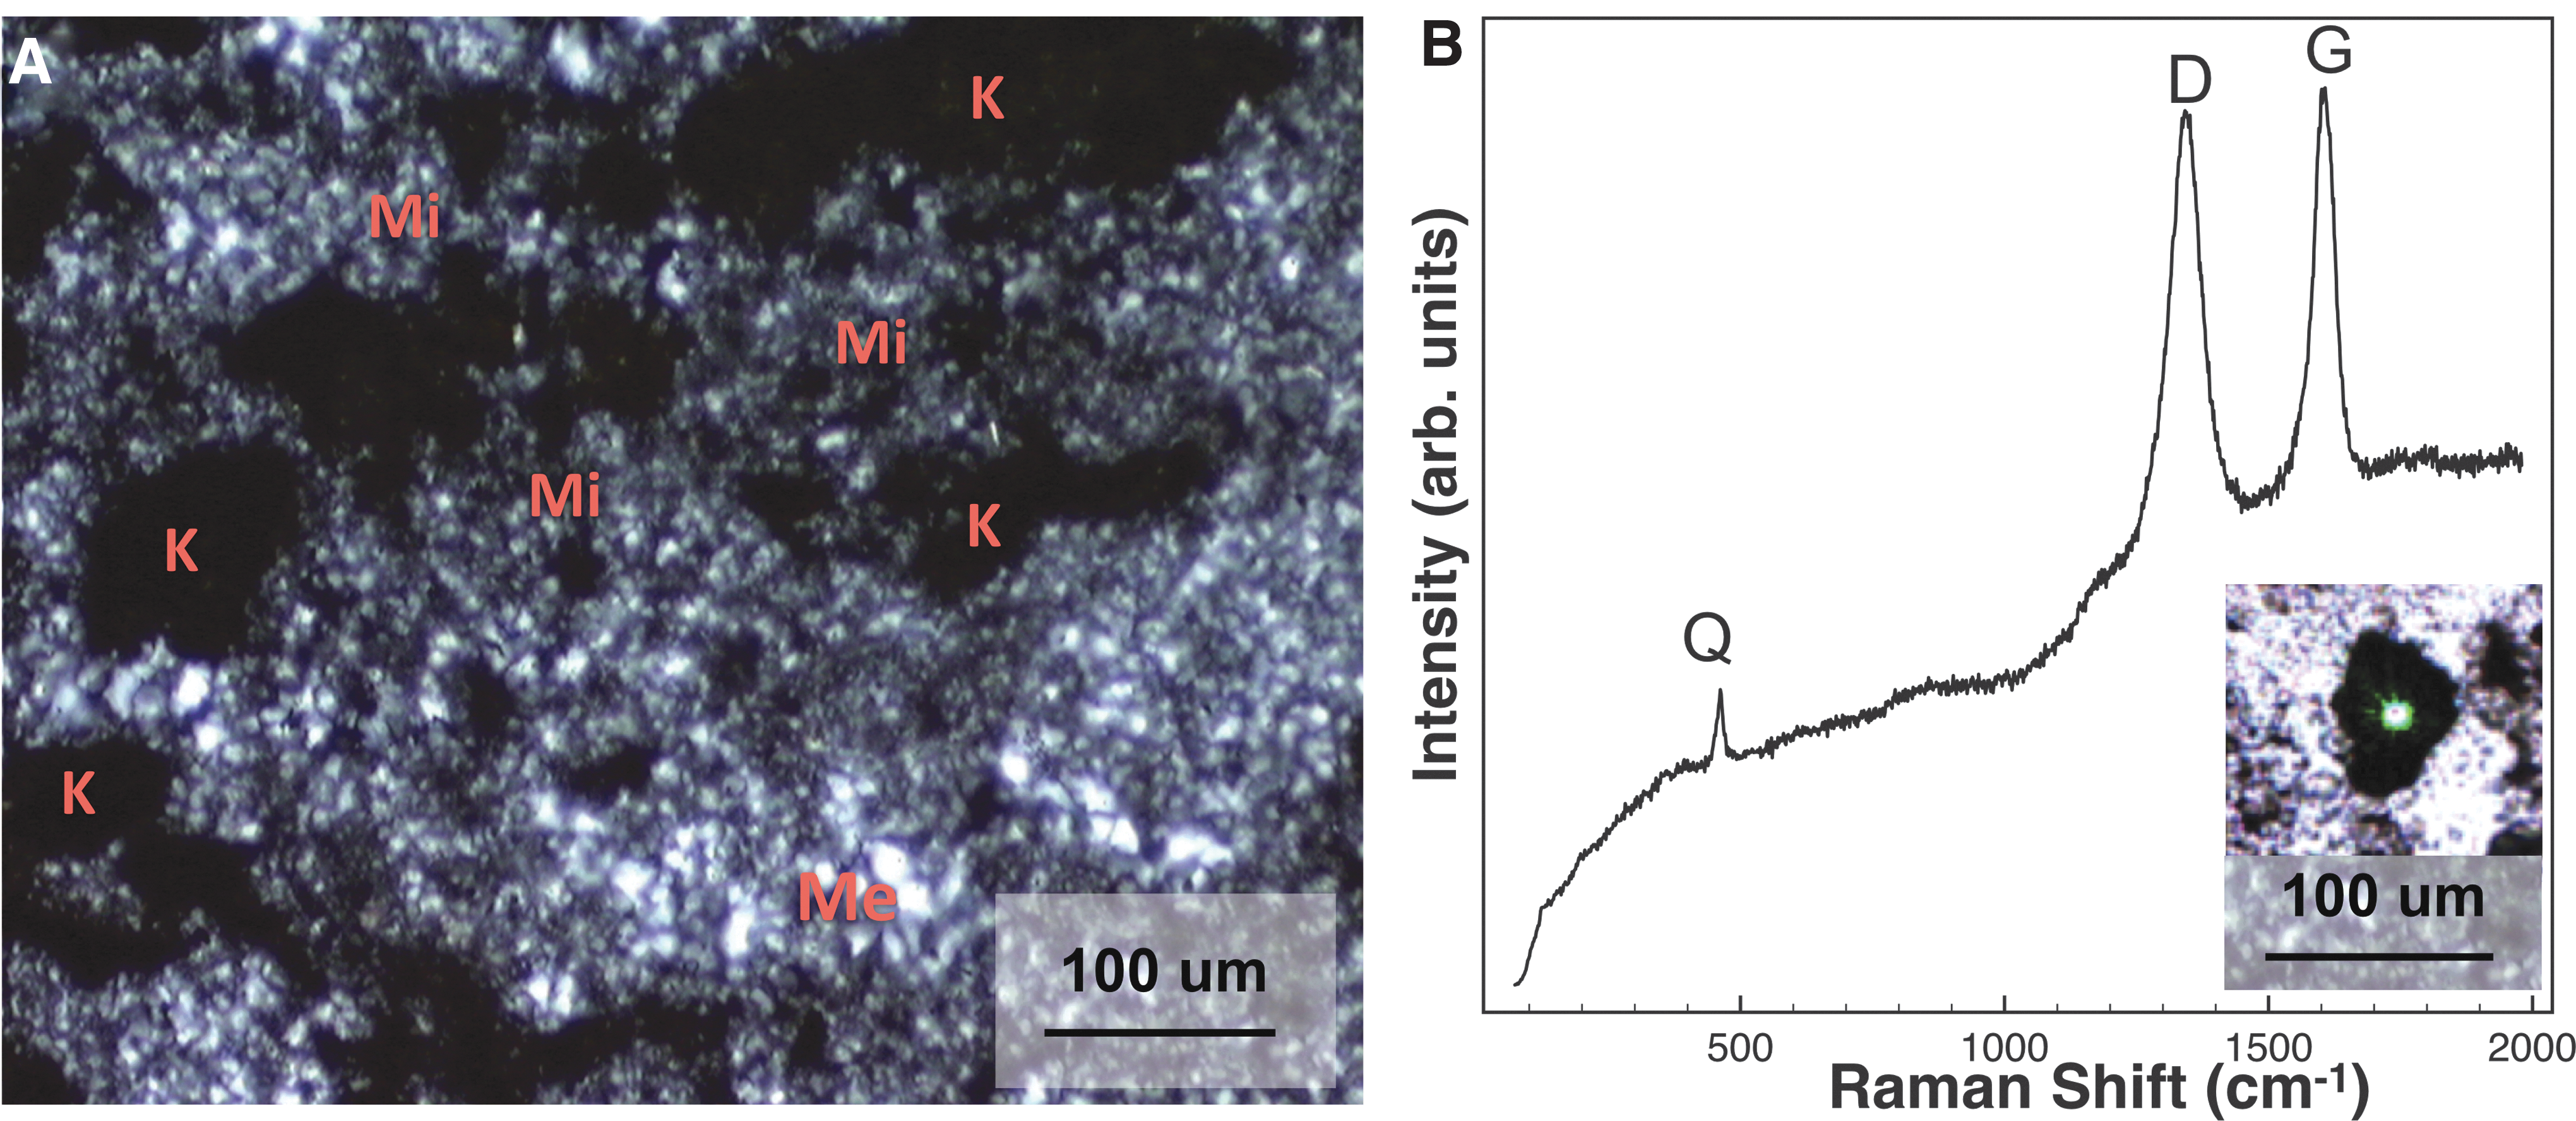
Characterization of the hydrothermal chert.
The presence of kerogen and quartz was confirmed by visible CW Raman spectroscopy: both were easily detectable due to the low overall fluorescence of this sample (Fig. 2B). Our average CW Raman D and G band positions (1345 and 1602 cm−1) are consistent with those of Bower et al. (2013) who obtained similar average D and G band positions for abundant kerogen found in samples collected from the same locality (1342 and 1602 cm−1). Our CW Raman data on this sample's kerogen are also consistent with Bower et al. (2013) and Allwood et al. (2006) who concluded that kerogen found in their Strelley Pool samples indicates high thermal maturity (Supplementary Fig. S3). Supplementary Fig. S4 also shows the CW Raman spectrum of this sample, where it can be seen stacked for comparison with the other less mature samples we studied. Other observed minor phases, with tentative identifications, are listed in Table 1.
3.2. Tertiary silicified shale, Wind Mt. Mine, Gerlach, Nevada
The Wind Mt. mine exposes a fine-grained silicified shale, which experienced intense geothermal activity associated with pervasive silicification and the emplacement of epithermal gold deposits (Wood, 1991; Eneva et al., 2011).
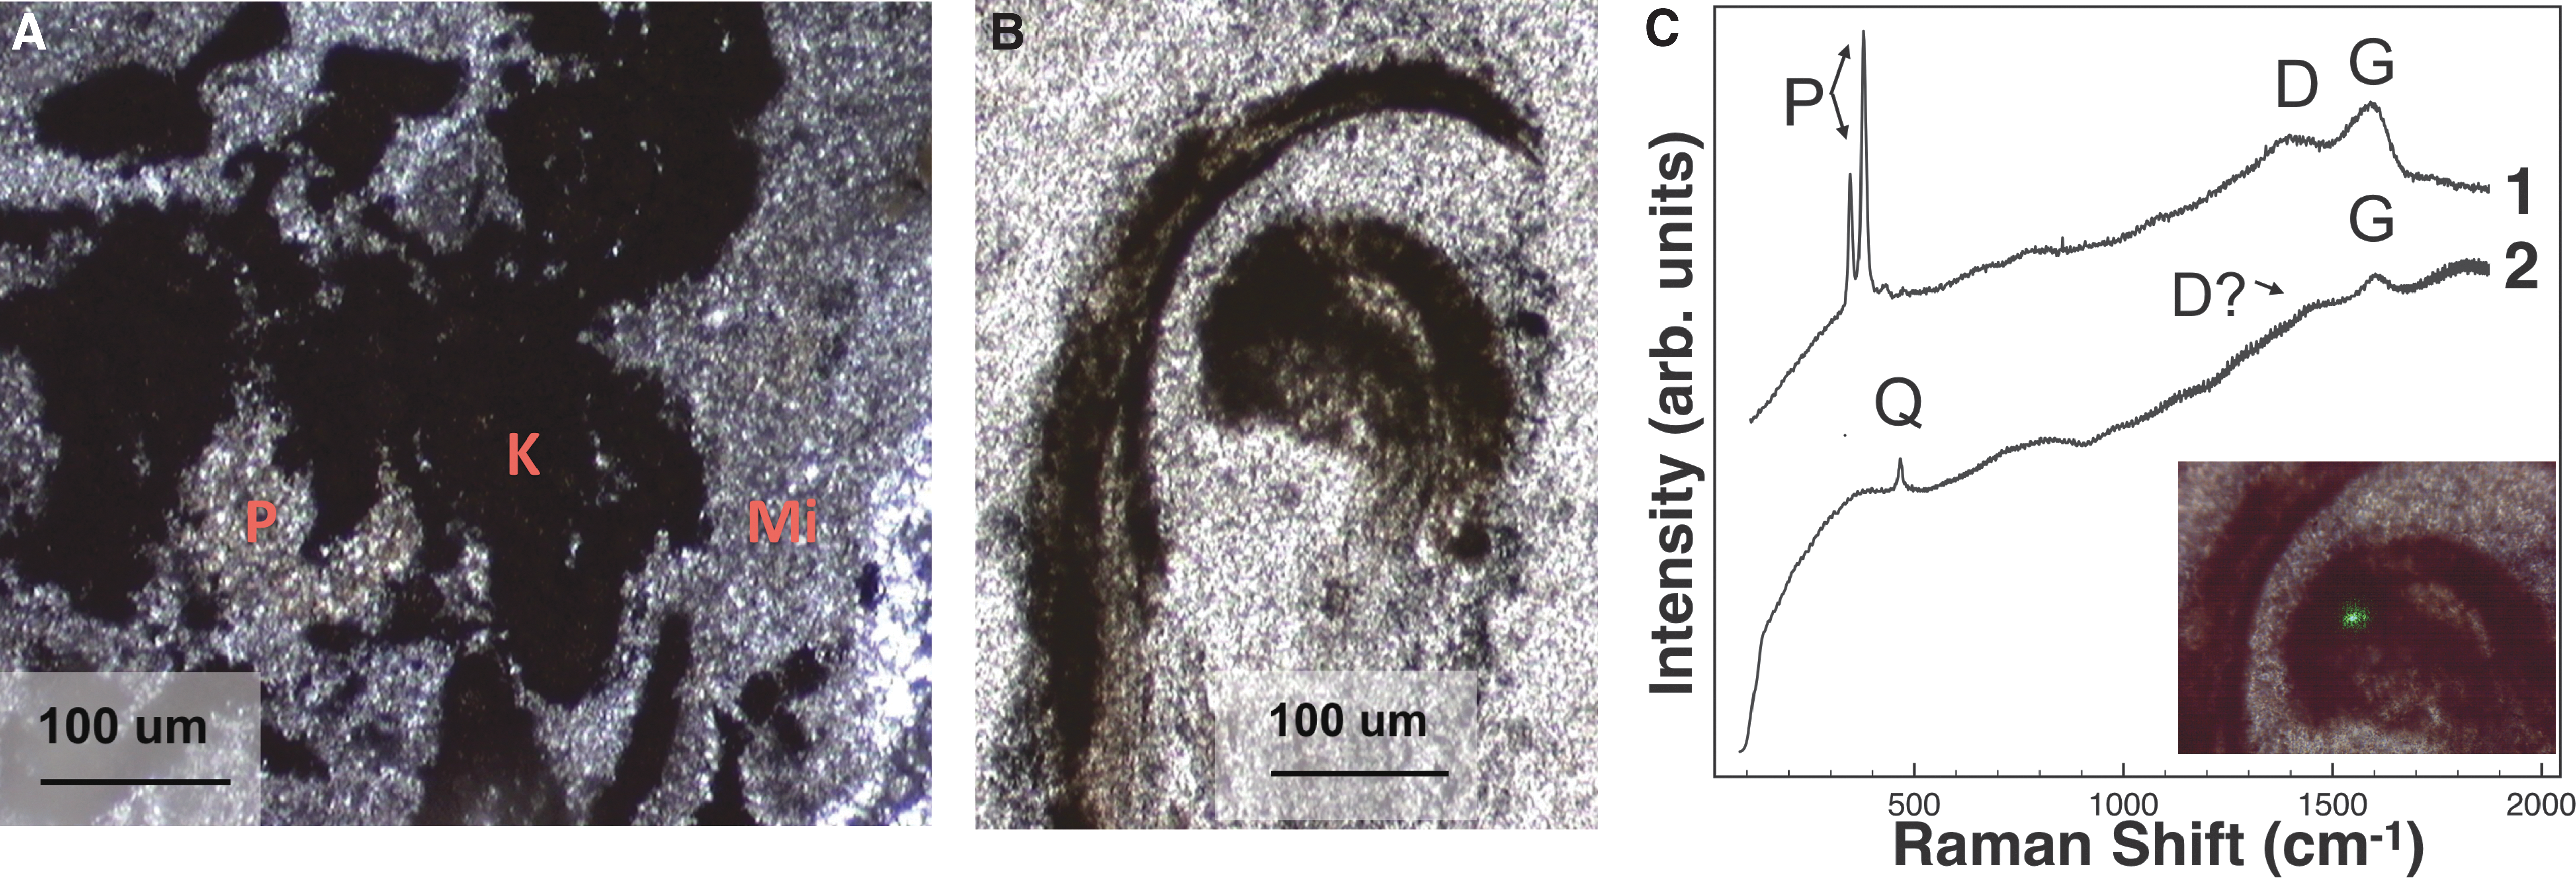
Microtextural analysis with microscopy revealed a fine-grained mudstone/shale matrix and microcrystalline quartz (Fig. 3A), consistent with an interpretation that quartz was a later-stage diagenetic replacement. Quartz was detected by using all techniques (Fig. 3; Table 1). Microscopy, along with Raman data, showed abundant dark opaque particulate grains within the quartz matrix (Figs. 3A and 4C) interpreted to be candidate kerogen regions, as well as morphologically distinct regions, suspected to be permineralized fossil plant fragments (Fig. 3B). In sample chips, light-colored kerogenous regions were preserved within gray-colored quartz (Fig. 10F). Sulfide minerals such as pyrite (FeS2) were also identified with microscopy and CW Raman spectroscopy, often associated with kerogen (Fig. 3A, C, Table 1). In visible CW Raman spectra, kerogen and quartz displayed moderate fluorescence (Fig. 3C).
Characterization of the silicified shale.
Characterization of the marine sandstone.
3.3. Upper Cambrian carbonate-cemented marine sandstone, Alum Formation, Öland, Sweden
This sample was collected from a shale interbed within a carbonate-cemented, quartzo-feldspathic sandstone of the Upper Cambrian Alum Formation (Table 1; Maeda et al., 2011).
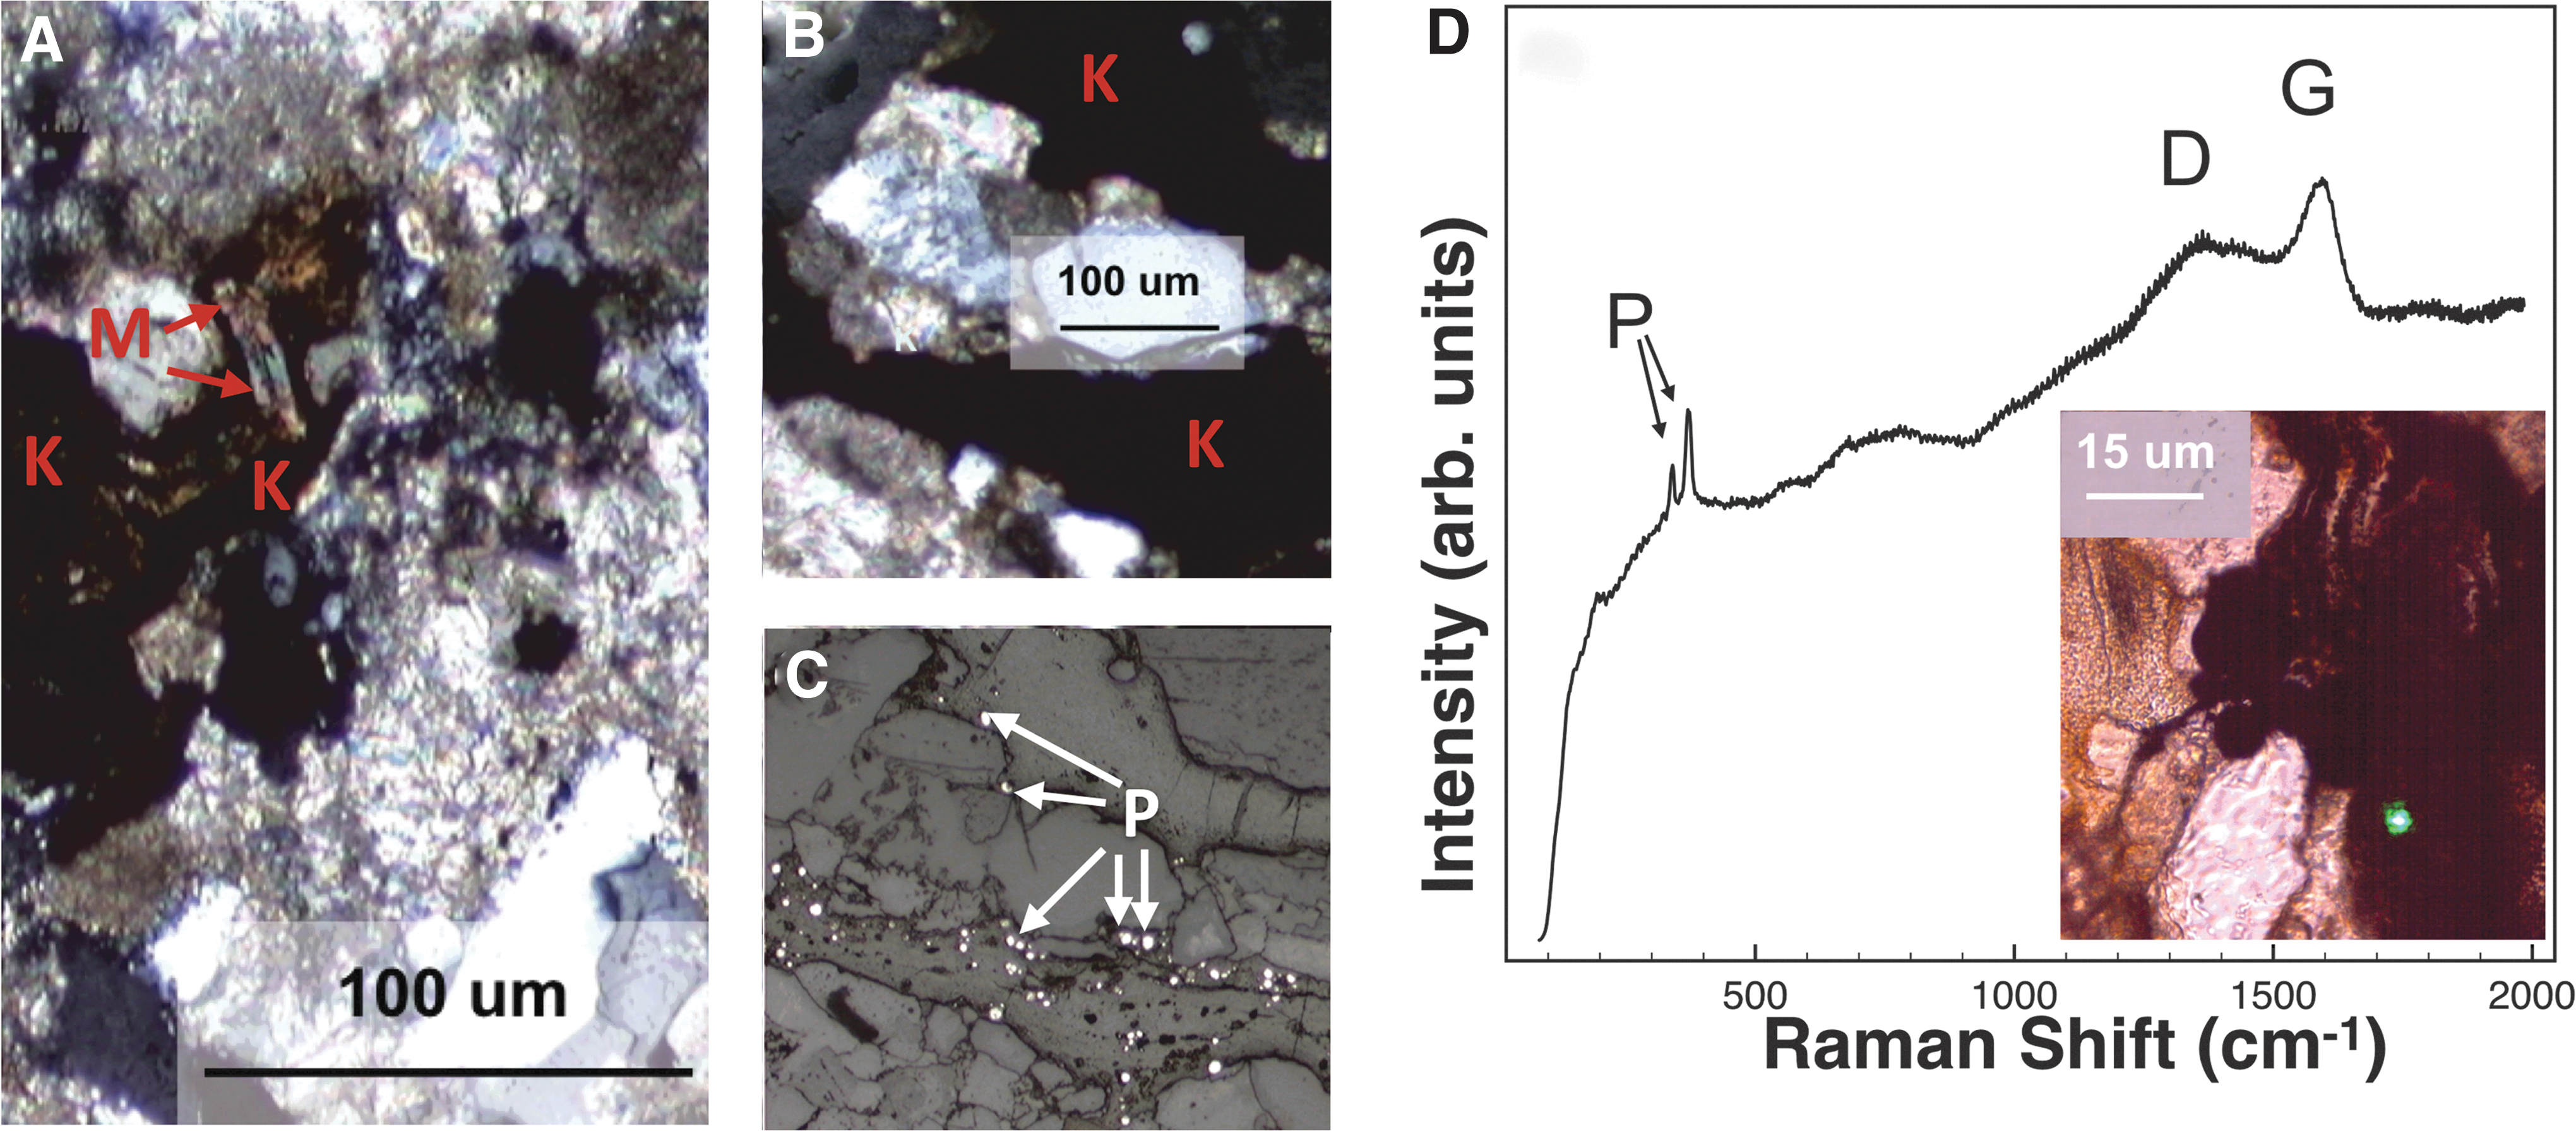
Microscopy and Raman analyses revealed dolomite cement and phyllosilicates (e.g., platy micas; Table 1), sometimes deformed (Fig. 4A), probably by compaction, and often associated with abundant, often large kerogen grains. Pyrite was usually associated with kerogen (Fig. 4C, D) and occurred as framboids, which in some cases is biomediated (Popa et al., 2004). Well-preserved fossils are known in this formation (Muller et al., 2009), consistent with our observations. Kerogen and the matrix both displayed moderately high fluorescence under visible CW Raman spectroscopy, necessitating high laser powers for spectral features to be seen with this technique (Fig. 4D). This is because high laser powers (in this sample, 12 mW, increased from previous attempts at 6 mW and below) prolonged exposure and burned away (photoquenched) the source of the fluorescence (Bozlee et al., 2005). This allowed Raman detection.
3.4. Permian sulfate evaporite, Castile Formation, Delaware Basin, Texas
Castile Formation deep-water evaporites were deposited in the Delaware Basin during the late Permian. Deposits consist of light-toned layers of primary anhydrite (CaSO4), alternating with dark-toned primary carbonates that nucleated in the water column, and settled to the bottom of the basin to form laminated (varved) sulfate–carbonate deposits (Anderson et al., 1972). Exposure to groundwater caused anhydrite to form gypsum and resulted in compressional folding of laminae (Scholle et al., 1992). Dark laminae are composed of fine-grained, organic-rich carbonate mud (micrite), containing both dolomite and calcite (Fig. 5 and Table 1). Lighter laminae are dominated by coarser euhedral sulfate (gypsum and anhydrite) crystals (Fig. 5; Table 1).
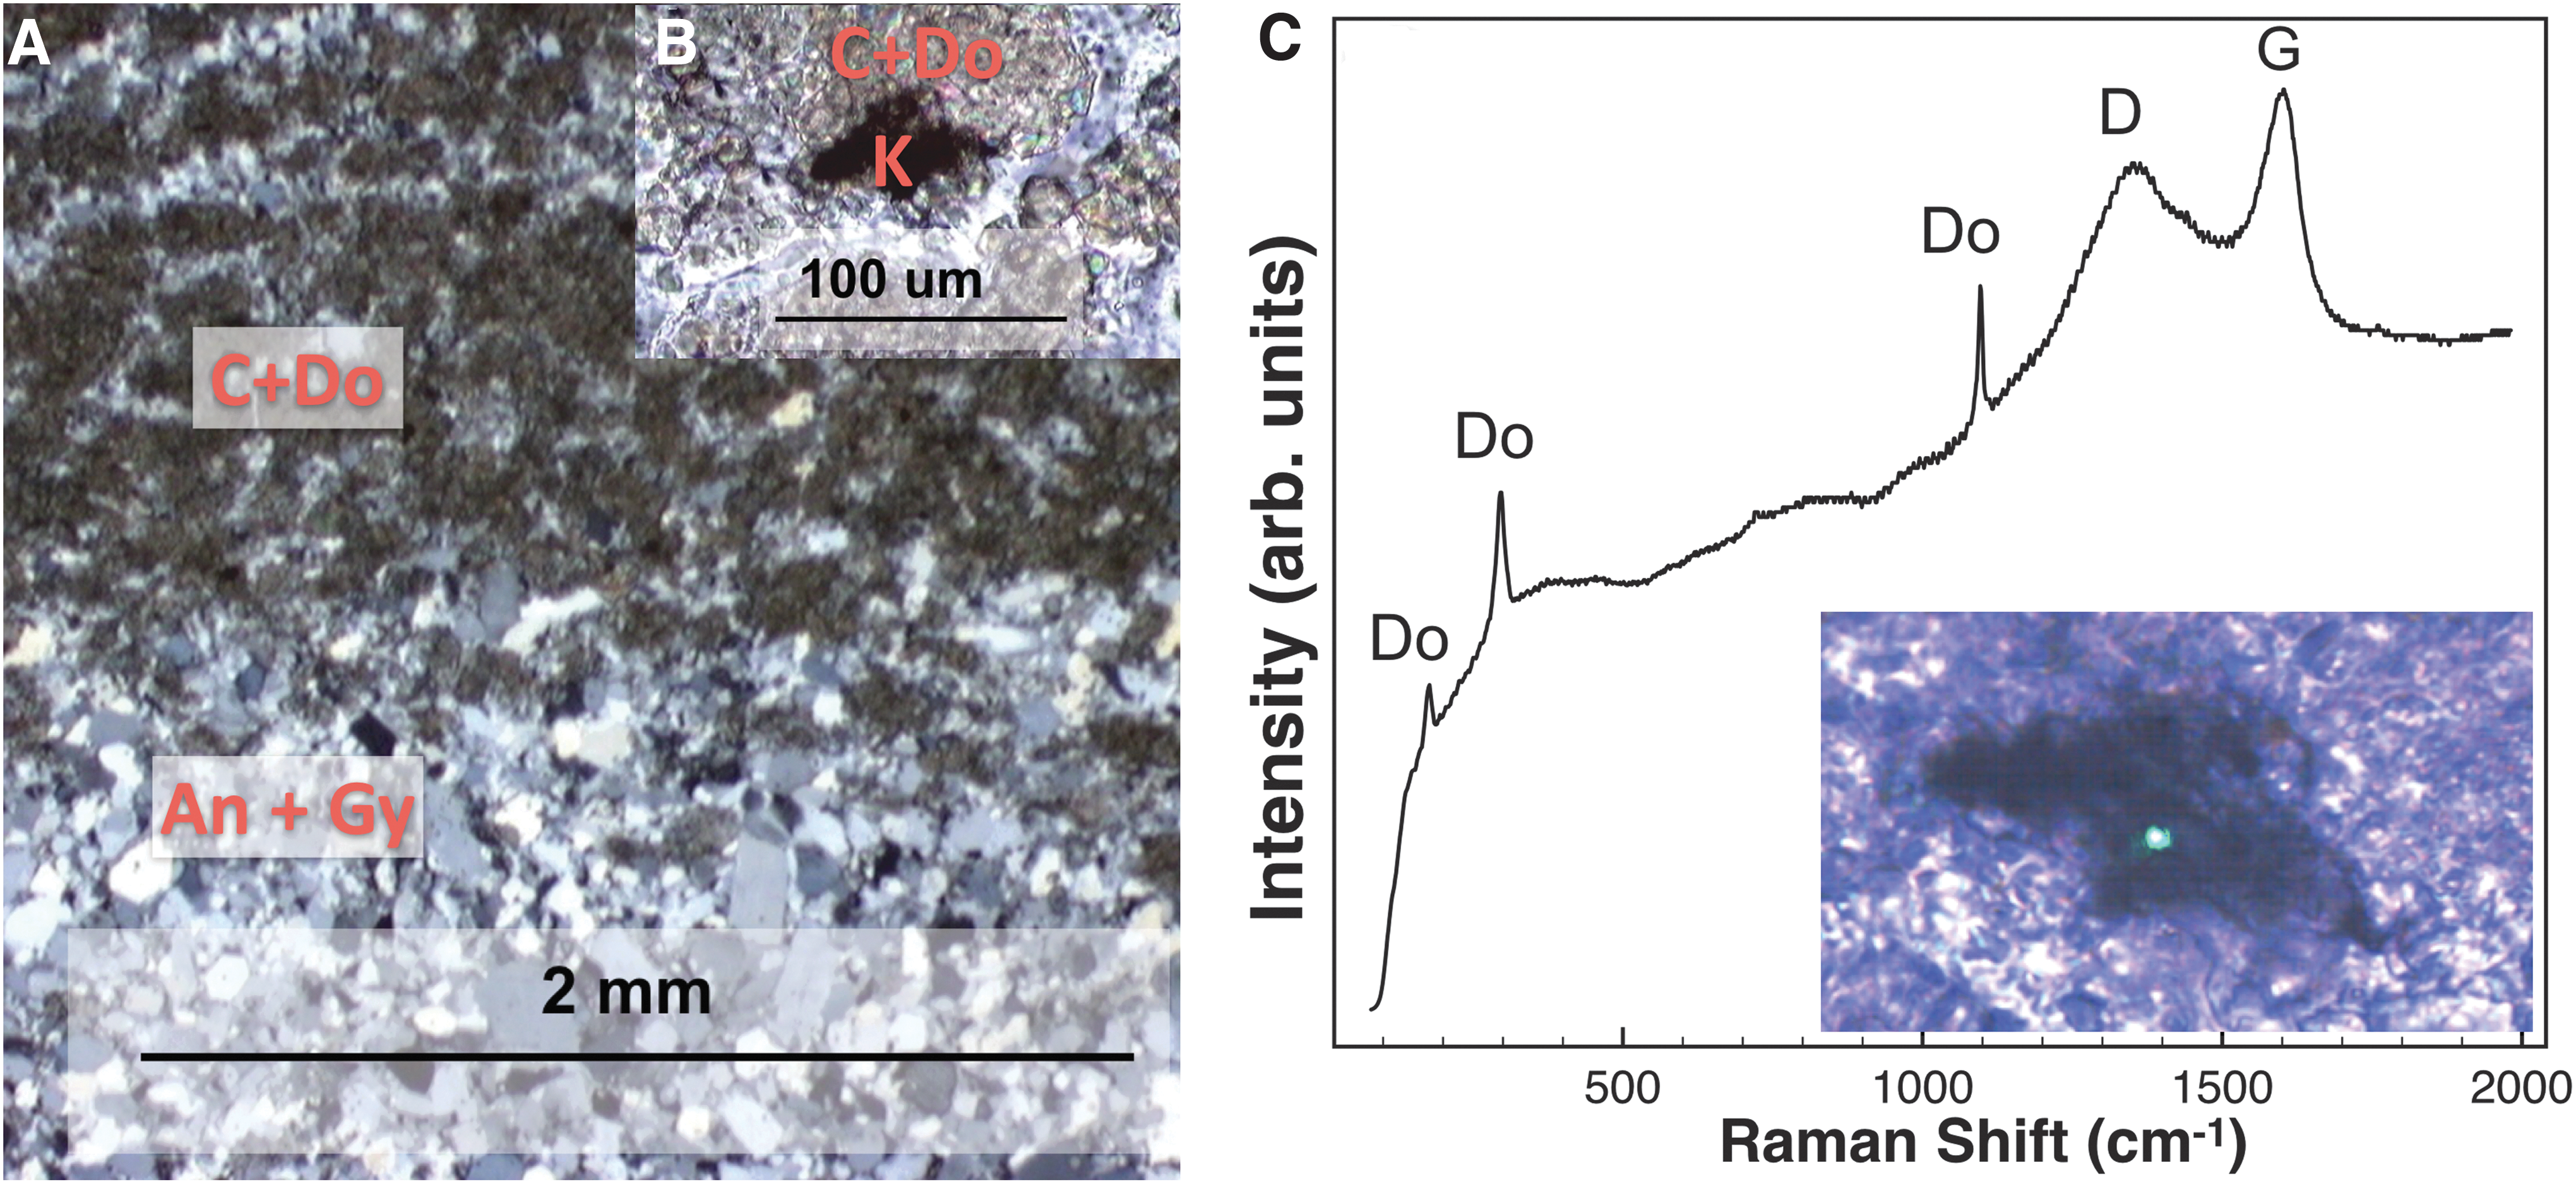
Characterization of the sulfate evaporite.
Microscopy analyses revealed that dark particulate grains, consistent with kerogen, occurred abundantly in dark carbonate-rich laminae (Figs. 5C and 10B), consistent with previous descriptions of organic-rich carbonate laminations in the Castile Formation (Anderson et al., 1972). Kerogen and matrix minerals were detected with visible CW Raman spectra, despite generally high background fluorescence (Fig. 5C), often requiring high powers (up to 6 mW) to induce photoquenching (Bozlee et al., 2005).
3.5. Holocene stromatolitic limestone (carbonate), Walker Lake, Nevada
The sample analyzed was collected from a high stand terrace along the western shoreline of Walker Lake (Osborne et al., 1982). It consists of alternating dark (kerogen-rich) and light laminae (mostly calcite; Table 1), as seen under microscopy (Figs. 6A and 10G) and confirmed by Raman analyses (Fig. 6B).
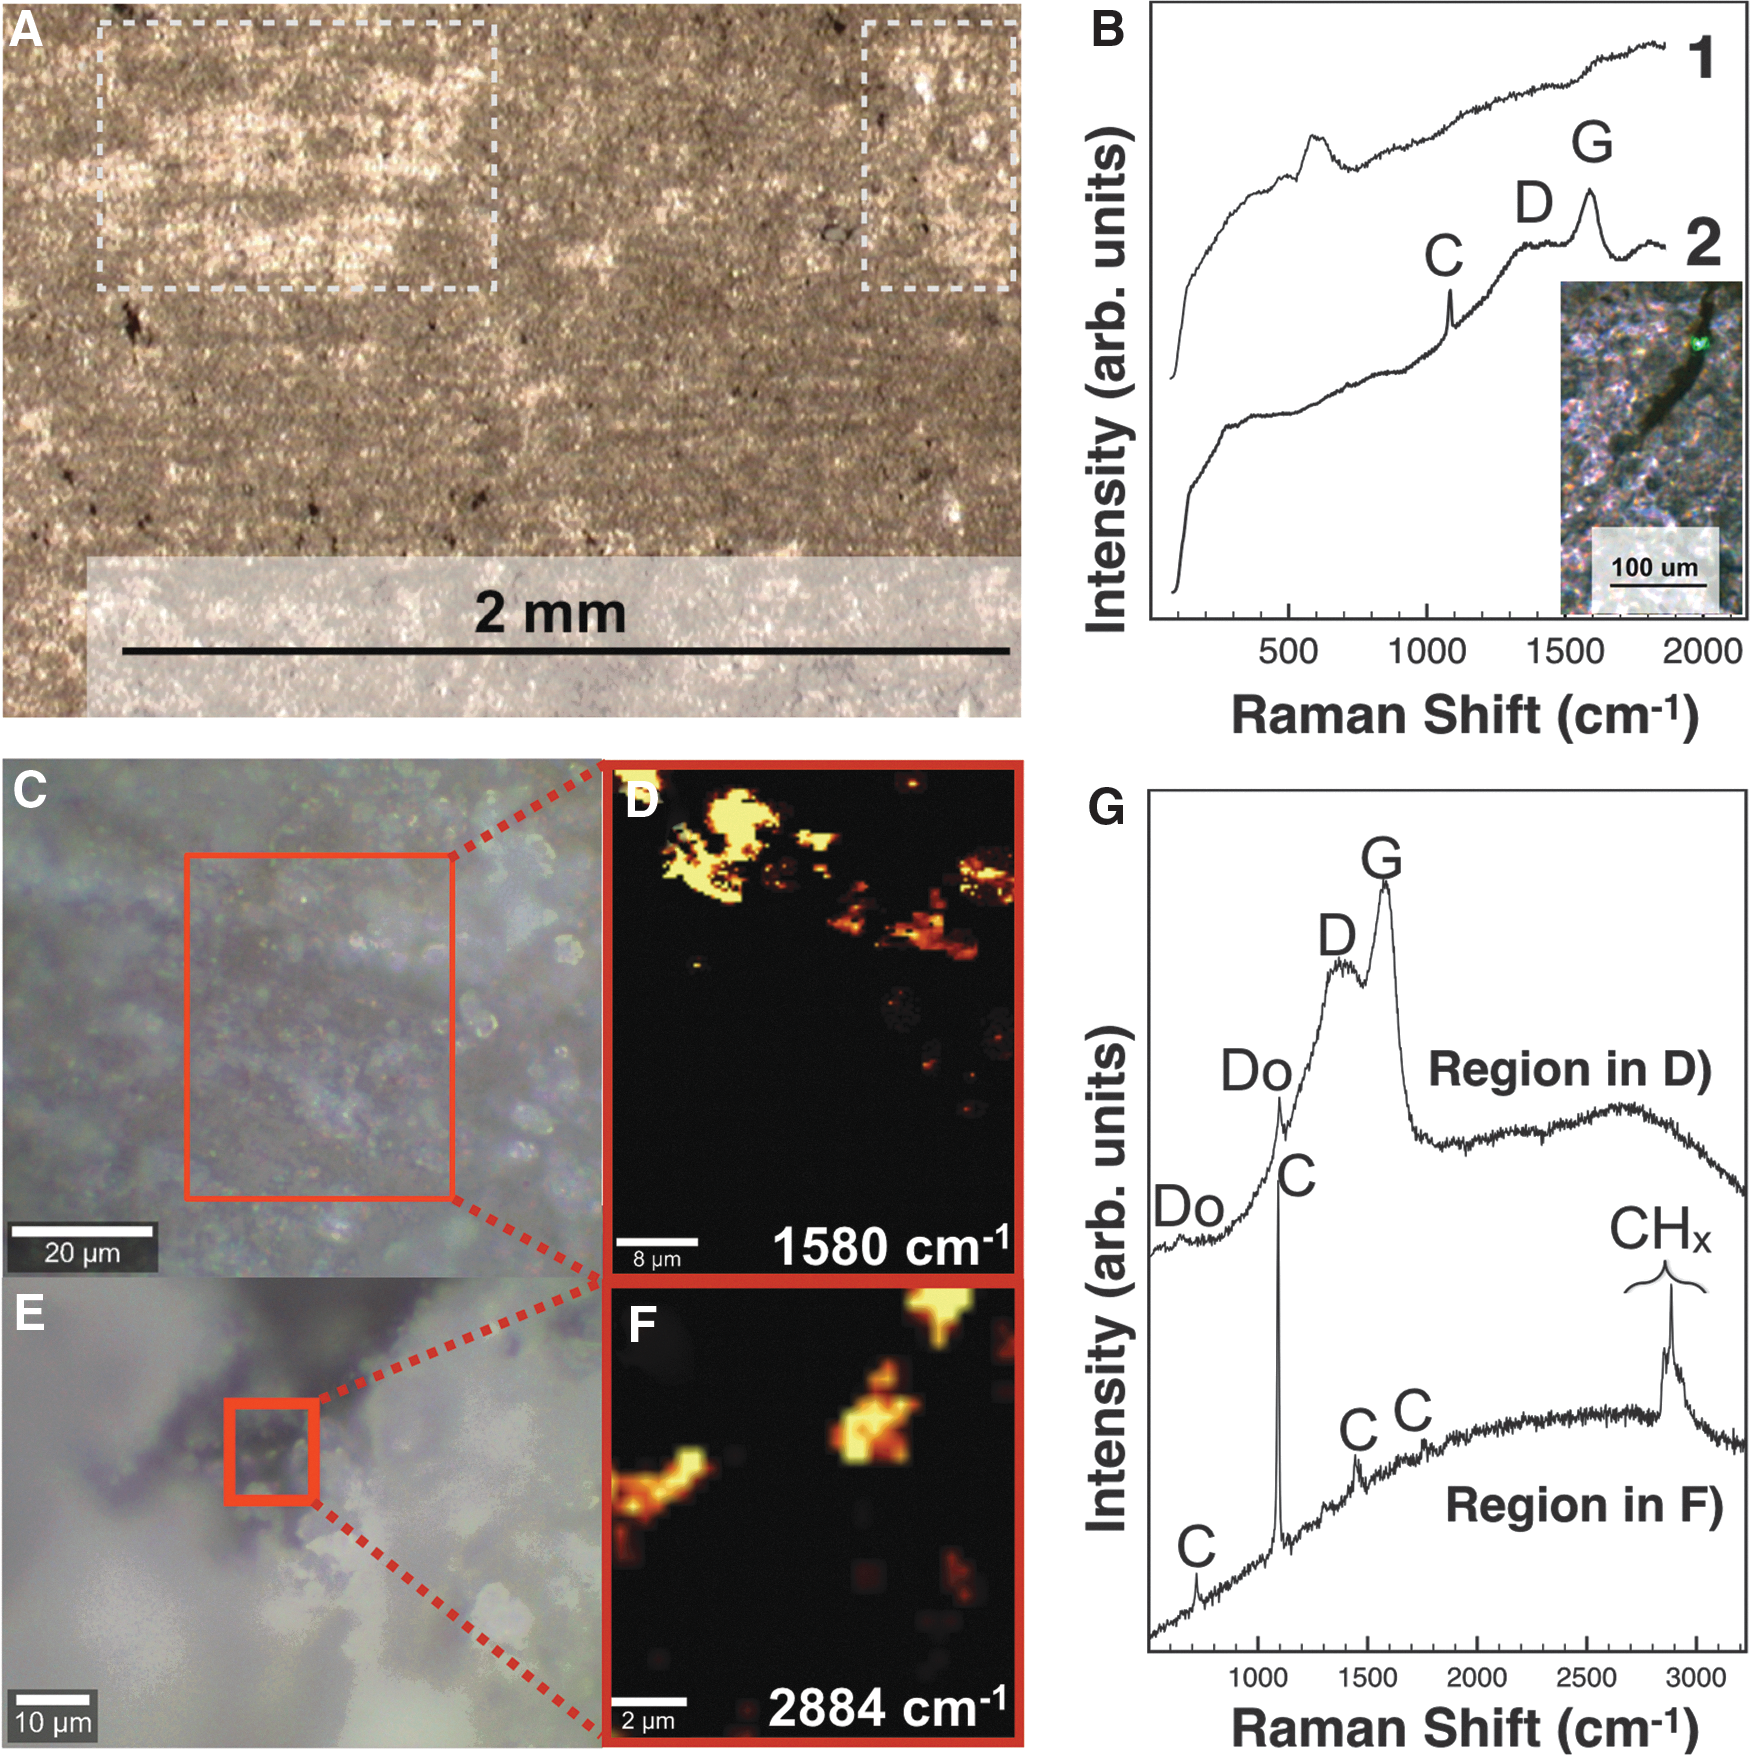
Characterization of the stromatolitic limestone.
Dark laminae contained abundant opaque candidate kerogen grains as both irregular patchy aggregates and morphologically distinct filaments (Fig. 6B), consistent with previous descriptions of filamentous algae commonly observed in carbonate-rich layers of this sample (Osborne et al., 1982). Detrital grains of quartz and plagioclase feldspar were also present (Table 1). Kerogen and calcite both appeared highly fluorescent in visible CW Raman spectra. With a low laser power setting (1.3 mW), fluorescence often swamped the Raman signal (Fig. 6B spectrum 1). Laser powers were increased from 1 to 6, 12, and finally 28 mW, which photoquenched the fluorescence (Bozlee et al., 2005) and produced the clearest spectra with calcite and D and G bands (Fig. 6B).
To more fully understand the nature, size, and distribution of kerogen and other organics in this sample (detailed in Section 4.1), we performed confocal Raman imaging spectroscopy (CRIS) on a sample chip of the stromatolitic limestone (Fig. 6C–G). We identified two categories of organics dispersed throughout the matrix, including abundant kerogen present at spatial scales of ∼10 microns to submicrons. Second, less mature organics were indicated by CH2 and CH3 stretch bands at similar scales. The latter bands correspond to many possible organic functional groups that are less thermally altered and physically compacted than kerogen, including microfossil cell wall structures (Socrates, 2004; Marshall et al., 2006).
3.6. Eocene lacustrine carbonate, Green River Formation, Wyoming
The Green River Formation consists of several members having different compositions (e.g., Surdam and Stanley, 1979). The sample analyzed here is from a lacustrine limestone member, formed by precipitation of fine-grained (micritic) carbonate. The carbonate unit precipitated as calcite and dolomite within the water column and settled to the lake bottom (Desborough, 1978).
We observed both microscopic particulate kerogen (Fig. 7A) and macroscopic well-preserved fossils (not analyzed here). Kerogen is dispersed throughout a carbonate-rich matrix, mainly as calcite and dolomite (Table 1). This description is consistent with previous descriptions of abundant and diverse organics (kerogen, coals, more immature algal and mollusk remains, etc.) found in carbonate-rich members of this formation (Surdam and Stanley, 1979). In visible CW Raman spectra, high fluorescence prevented the detection of the carbonate matrix (Fig. 7B spectrum 1) but not kerogen preserved within it (Fig. 7B spectrum 2).
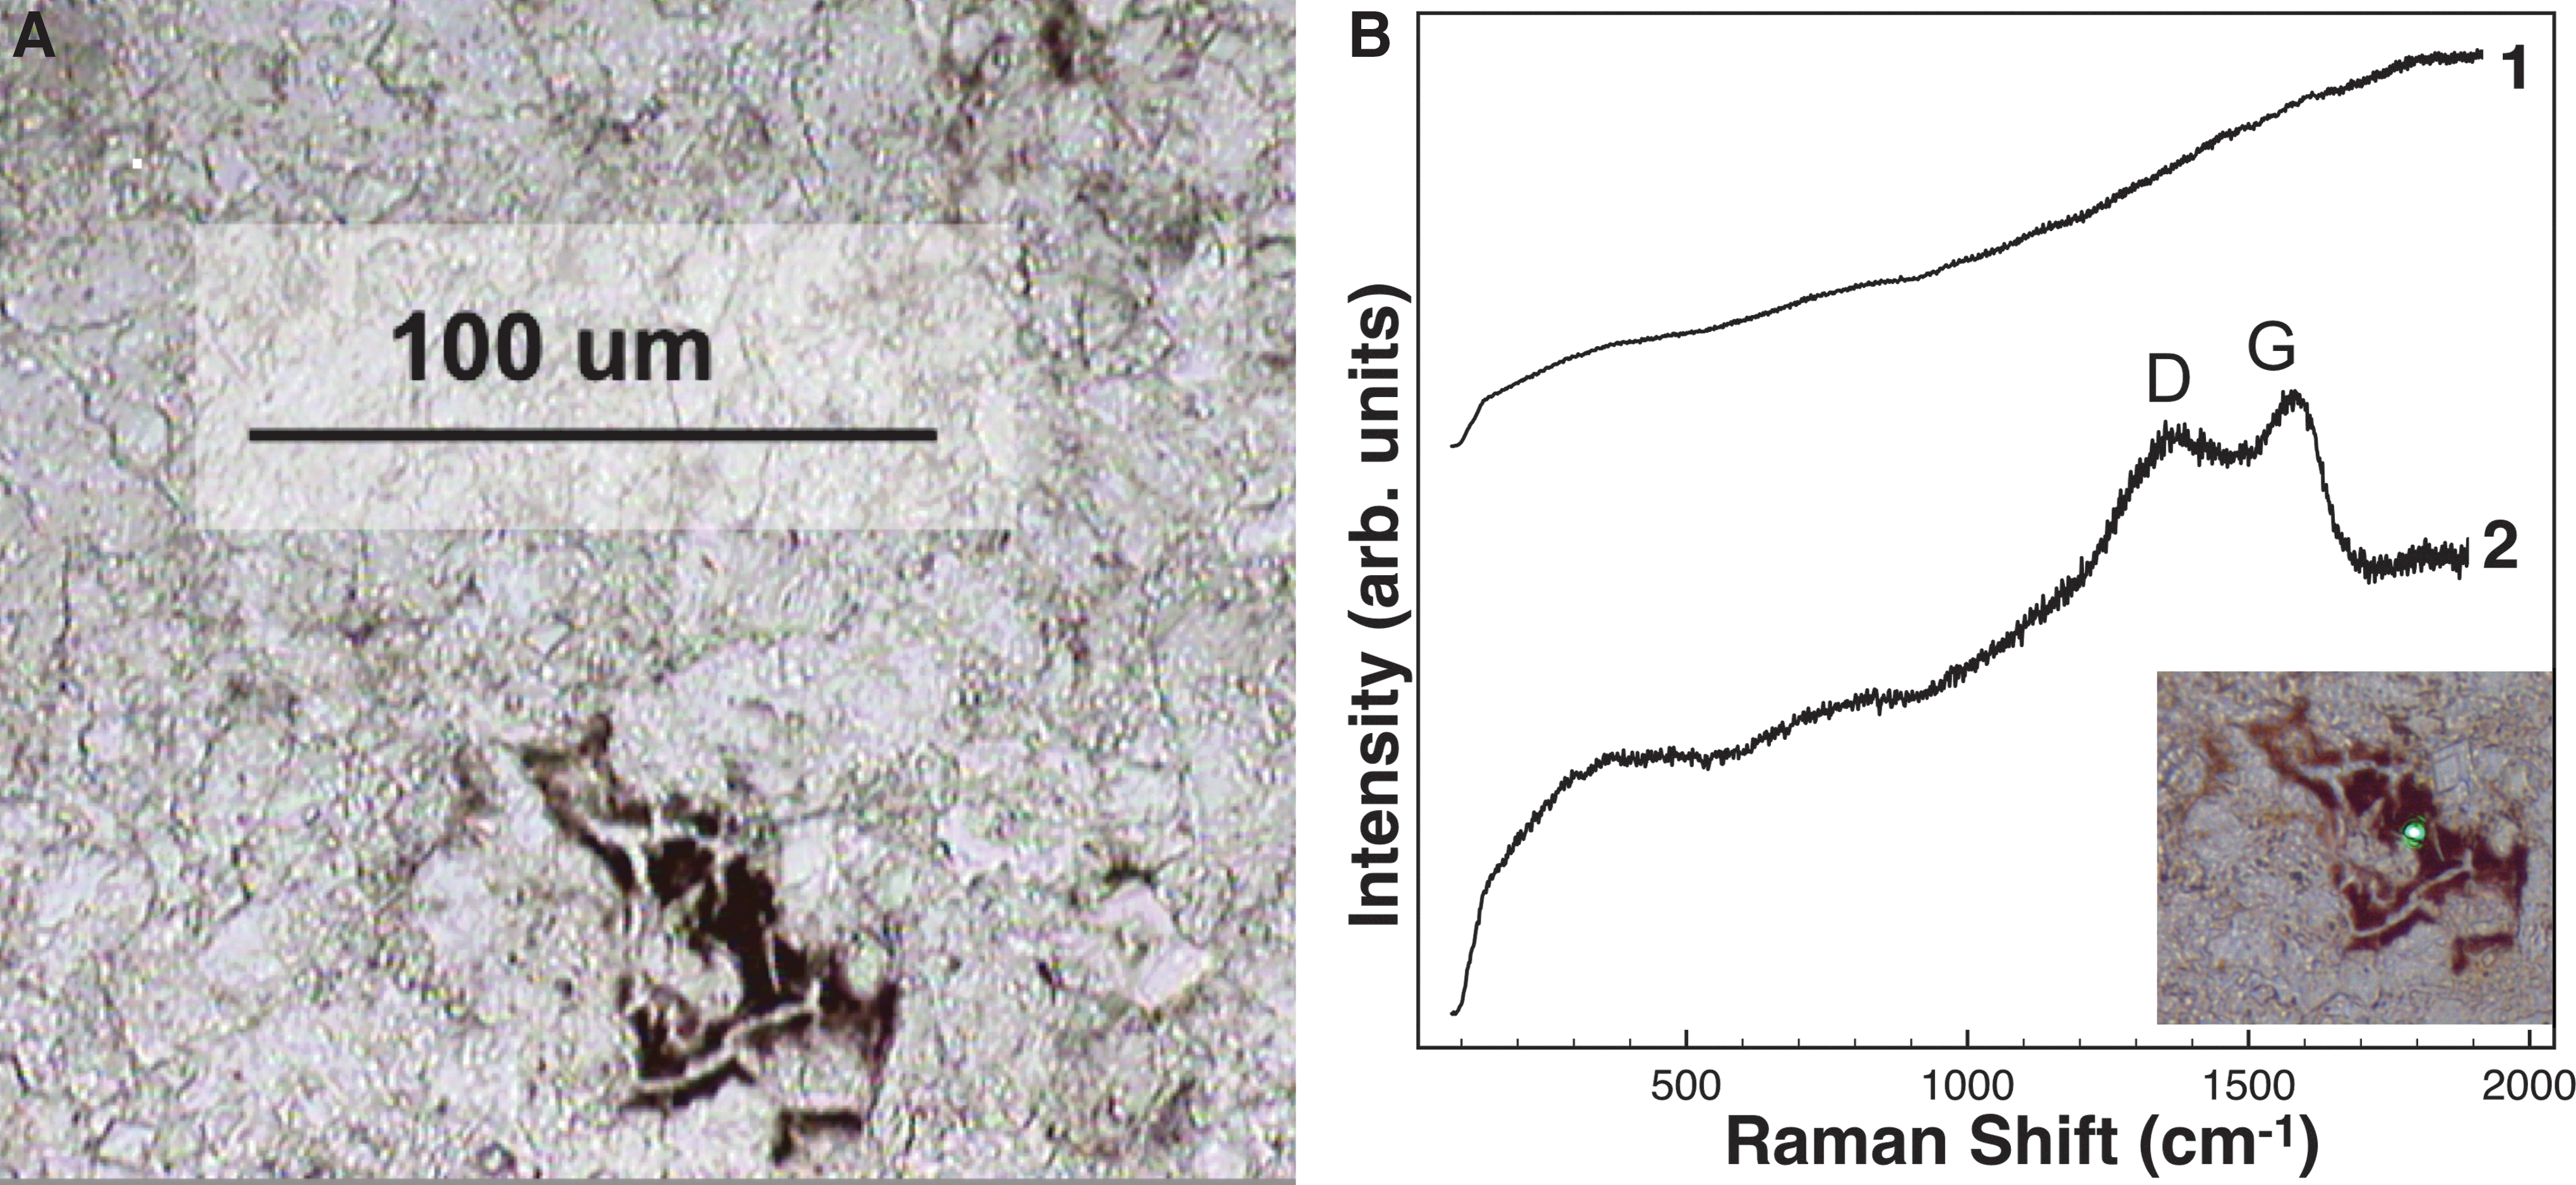
Characterization of the lacustrine carbonate.
3.7. Miocene–Pliocene evaporitic mudstone, Verde Basin, AZ
This clay-rich playa evaporite was deposited within the Verde Basin during the Miocene–Pliocene. The evaporitic playa mudstone sequence was followed by the formation of a perennial lake during the Pliocene with the deposition of basin-wide lacustrine carbonate sediments (Bressler and Butler, 1978; Nations et al., 1981). The mudstone is cemented primarily by carbonate (as magnesite) and fine-grained clays, especially smectites (Fe- or Mg-rich saponite and montmorillonite), as confirmed with XRPD (Table 1).
Microscopy revealed other phyllosilicates, present as detrital grains, along with a variety of other abundant coarse angular grains and evaporite phases present (Fig. 8A, B and Table 1). Thin section microscopy revealed the presence of clasts with rust-colored alteration rims, suspected to be iron-rich phases, and dark grains in moderate abundance scattered throughout the matrix (Fig. 8C), interpreted as kerogen candidates. Other phases with optical properties consistent with iron oxides were also seen abundantly with microscopy and identified as hematite with CW Raman analyses (Fig. 8D spectrum 2) and as goethite and lepidocrocite as identified with other techniques (Table 1). XRPD did not identify any iron phases (Table 1).

Characterization of the evaporitic mudstone. Plane-polarized light photomicrographs of the fine-grained matrix, showing
Fossils have been noted in Verde Formation but not in the sequences we sampled (Wadell, 1972). In our analyses, all CW visible Raman spectra of candidate kerogen grains and the mudstone matrix were overwhelmed by fluorescence, regardless of the acquisition setting (Fig. 8D).
3.8. UV-TG Raman results
UV-TG Raman spectra of kerogen and matrix areas in samples are shown in Fig. 9, along with kerogen and mineral standards for comparison. In the chert sample, UV-TG Raman spectroscopy of candidate kerogen regions revealed quartz (at 465 cm−1 and less intense bands at 809, 1084, and 1171 cm−1) along with an intense G band (1586 cm−1), plus a convolution of two second-order bands spanning ∼2900 to ∼3300 cm−1 and centered at ∼3100 cm−1 (Fig. 9A spectrum 1).

Representative UV-TG Raman spectra of samples and standards.
The lack of the D band in UV Raman spectroscopy is attributed to the sample's high thermal maturation, which caused highly graphitic (Ferrari and Robertson, 2001) and thermally mature (Bower et al., 2013) carbon in that sample, which can be seen as the intense G band (see Section 1.2 for details).
The organic bands of the chert's spectrum are comparable with those of the kerogen standard (Fig. 9A spectrum 2), including the second-order region at ∼2900 to ∼3300 cm−1 (Fig. 9A inset). Similarly, when candidate kerogen regions were interrogated in the silicified shale, the main quartz matrix band was identified, along with a G band (ranging from 1600 to 1609 cm−1 in spectra of this sample) and a broad D band spanning from ∼1200 to 1500 cm−1 (Fig. 9A spectrum 3). Short- and long-gated UV Raman interrogations of the same sample's matrix (Fig. 9B spectra 13–14) both revealed similar spectra: a G band and the main quartz band.
The marine sandstone revealed both G bands (spanning from 1586 to 1611 cm−1, respectively) and weaker D bands (centered at ∼1370 cm−1) in two different candidate kerogen regions. One region (pictured in Fig. 10D) captured dolomite (at 1098 cm−1) in the sampling volume (Fig. 9A spectrum 5), and the other revealed both D and G bands in both long- and short-gated spectra (Fig. 9B spectra 15–16). Fluorescence (especially >2000 cm−1) was higher in the region containing organics with dolomite captured in the sampling volume (Fig. 9A spectrum 5) than in the region containing kerogen features alone (Fig. 9B spectra 15 and 16).
Representative UV-TG fluorescence spectra of samples and standards.
In the stromatolite sample (Fig. 9A spectrum 7), UV-TG Raman spectroscopy revealed calcite (1086, 1430, and 1750 cm−1) and a G band (∼1606 cm−1), with moderate fluorescence visible past 2000 cm−1 in a candidate kerogen region. A tentative D band seemed to be masked by an overlapping 1430 cm−1 calcite band.
In contrast, in the lacustrine carbonate sample (Fig. 9A spectrum 8), the D band, although likely convolved with a sharp calcite band (“C+D”), was more clearly visible, along with second-order features in a targeted candidate kerogen grain. The G band was centered at 1594–1608 cm−1 in UV-TG Raman spectra of the lacustrine carbonate. Comparing long- and short-gated spectra of the lacustrine carbonate matrix (Fig. 9B spectra 11–12), fluorescence past 2000 cm−1 was slightly reduced with short gating and revealed a weak sharp calcite band at 1430 cm−1 and second-order kerogen bands at 2920 and 3250 cm−1 that were not seen with long gating.
In the sulfate evaporite sample (Fig. 9C), calcite (1086 cm−1) and/or gypsum (412, 493, 612, 672, 1008, and 1140 cm−1) could be identified when regions without kerogen within both laminae were interrogated (Figs. 10G and 9C spectra 17–21). With long gating (Fig. 9C spectrum 17), it was ambiguous whether the calcite band was present at 1750 cm−1, but with short gating, calcite was seen clearly (Fig. 9C spectrum 18). The G band was present in all cases (at 1590 cm−1), and the D and G bands appeared when a candidate kerogen grain (the same one pictured in Fig. 10E) was interrogated with UV-TG Raman spectroscopy (Fig. 9C spectrum 21).
The evaporitic mudstone was the only sample in which UV-TG Raman analyses did not yield any compositional information (Fig. 9A spectrum 10) when both matrix regions (shown in Fig. 10H) and suspected kerogen regions were targeted for analysis.
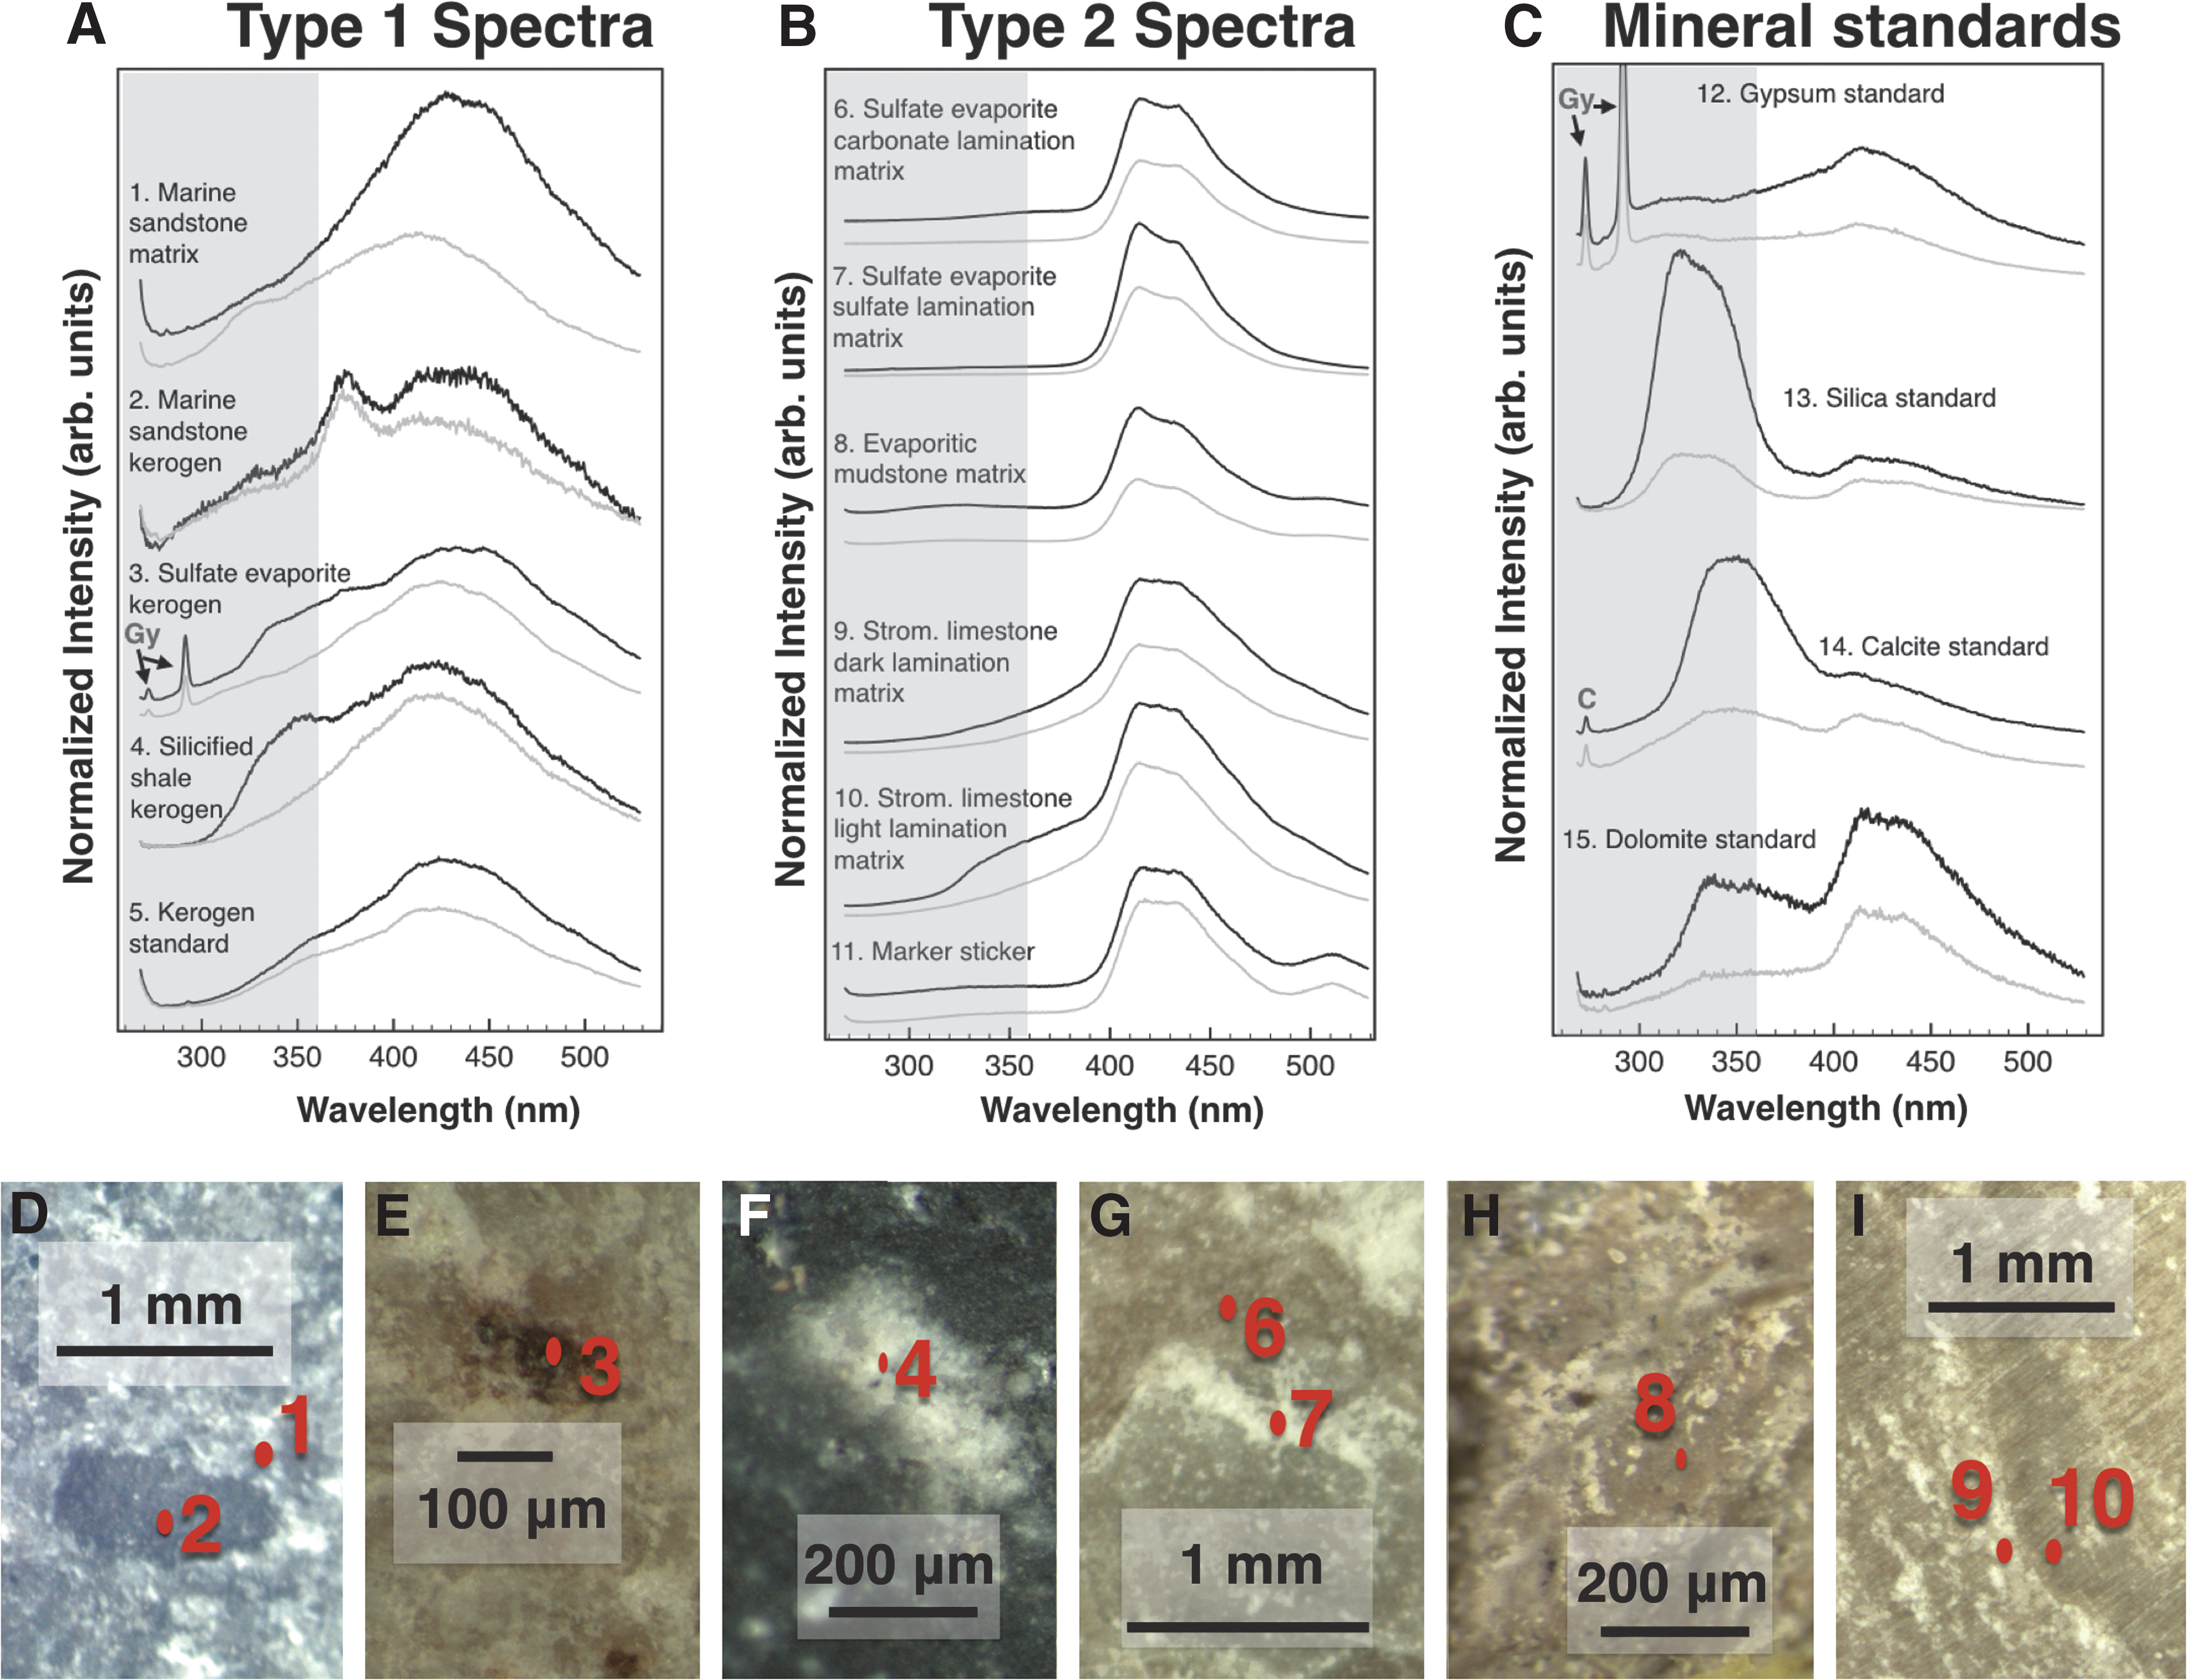
3.9. UV-TG fluorescence results
Short- and long-gated fluorescence spectra of kerogen and matrix areas, as well as kerogen and mineral standards, are shown in Fig. 10A–C. These spectra can be broadly grouped into two categories: Types 1 and 2.
Type 1 spectra (Fig. 10A, spectra 1–4), as well as the kerogen standard (spectrum 5), show a very broad feature (likely a convolution of multiple features) centered around ∼430 nm, spanning from ∼300 to >500 nm. These spectra were acquired on kerogen grains targeted with microscopy (Fig. 10D–F).
Type 2 fluorescence spectra (Fig. 10B, spectra 6–10) show a convolution of two or more bands between ∼400 and ∼500 nm, with peaks at ∼415 nm and slightly less intensely at ∼430 nm. These spectra were acquired in regions where kerogen was not targeted for analysis and not visible on the sample surface with microscopy. These spectra are distinctly different from Type 1 spectra (Fig. 10A). (Spectrum 1 in Fig. 10A is an exception; it was acquired on a matrix region of a highly kerogenous sample and is addressed in Section 4.1.) A spectrum acquired on a sticker marker (Fig. 10B, spectrum 11) displays features similar to Type 2 spectra with the addition of a feature at ∼515 nm.
We also acquired fluorescence spectra of mineral standards (Fig. 10C) reflecting the major matrix minerals in our samples. These spectra also display features at 415–430 nm, similar to Type 2 spectra, along with intense features <400 nm.
Other fluorescence features are visible with peaks at or <375 nm in both Types 1 and 2 spectra. Features at these wavelengths can have organic or inorganic sources with UV excitation (Abbey et al., 2017 and references therein). In this study, we only focus on features peaking between 400 and 450.
To quantify the effect of gating on fluorescence reduction with UV-TG Raman spectroscopy, time-resolved fluorescence spectra were obtained on the silicified and marine sandstones, both lamina types in the sulfate evaporite, the lacustrine carbonate, and three mineralogically diverse matrix regions of the stromatolitic limestone.
Our quantification method is illustrated in Fig. 11. For each sample, fluorescence spectra were obtained by using intensity I, time t, and wavelength λ parameters detailed in Section 2.5. For each sample, we selected a wavelength at which the spectral intensity had a local maximum at Imax >400 nm (Fig. 11A) and Imax <400 nm (Fig. 11D). The specific wavelength, identified by an asterisk in Fig. 11A and E, varied slightly across samples. At this wavelength, the (I, t, λ) data were “sliced” in the time domain to obtain the associated fluorescence decay curves I(t) (Fig. 11B, F). Next, we summed each decay curve to obtain the cumulative fluorescence signal, Ftot , and overlaid it on the cumulative Raman signal of a gypsum standard at the wavelength corresponding to the strongest Raman band, 1008 cm−1, or Rtot (Fig. 11C, G). We assume that Raman scattering is effectively instantaneous on the fluorescence time scales measured here, and, therefore, that any Raman signal of any sample would have the same temporal profile. This allowed the quantification of gating efficiency as Rtot /Ftot (Fig. 11D, H).
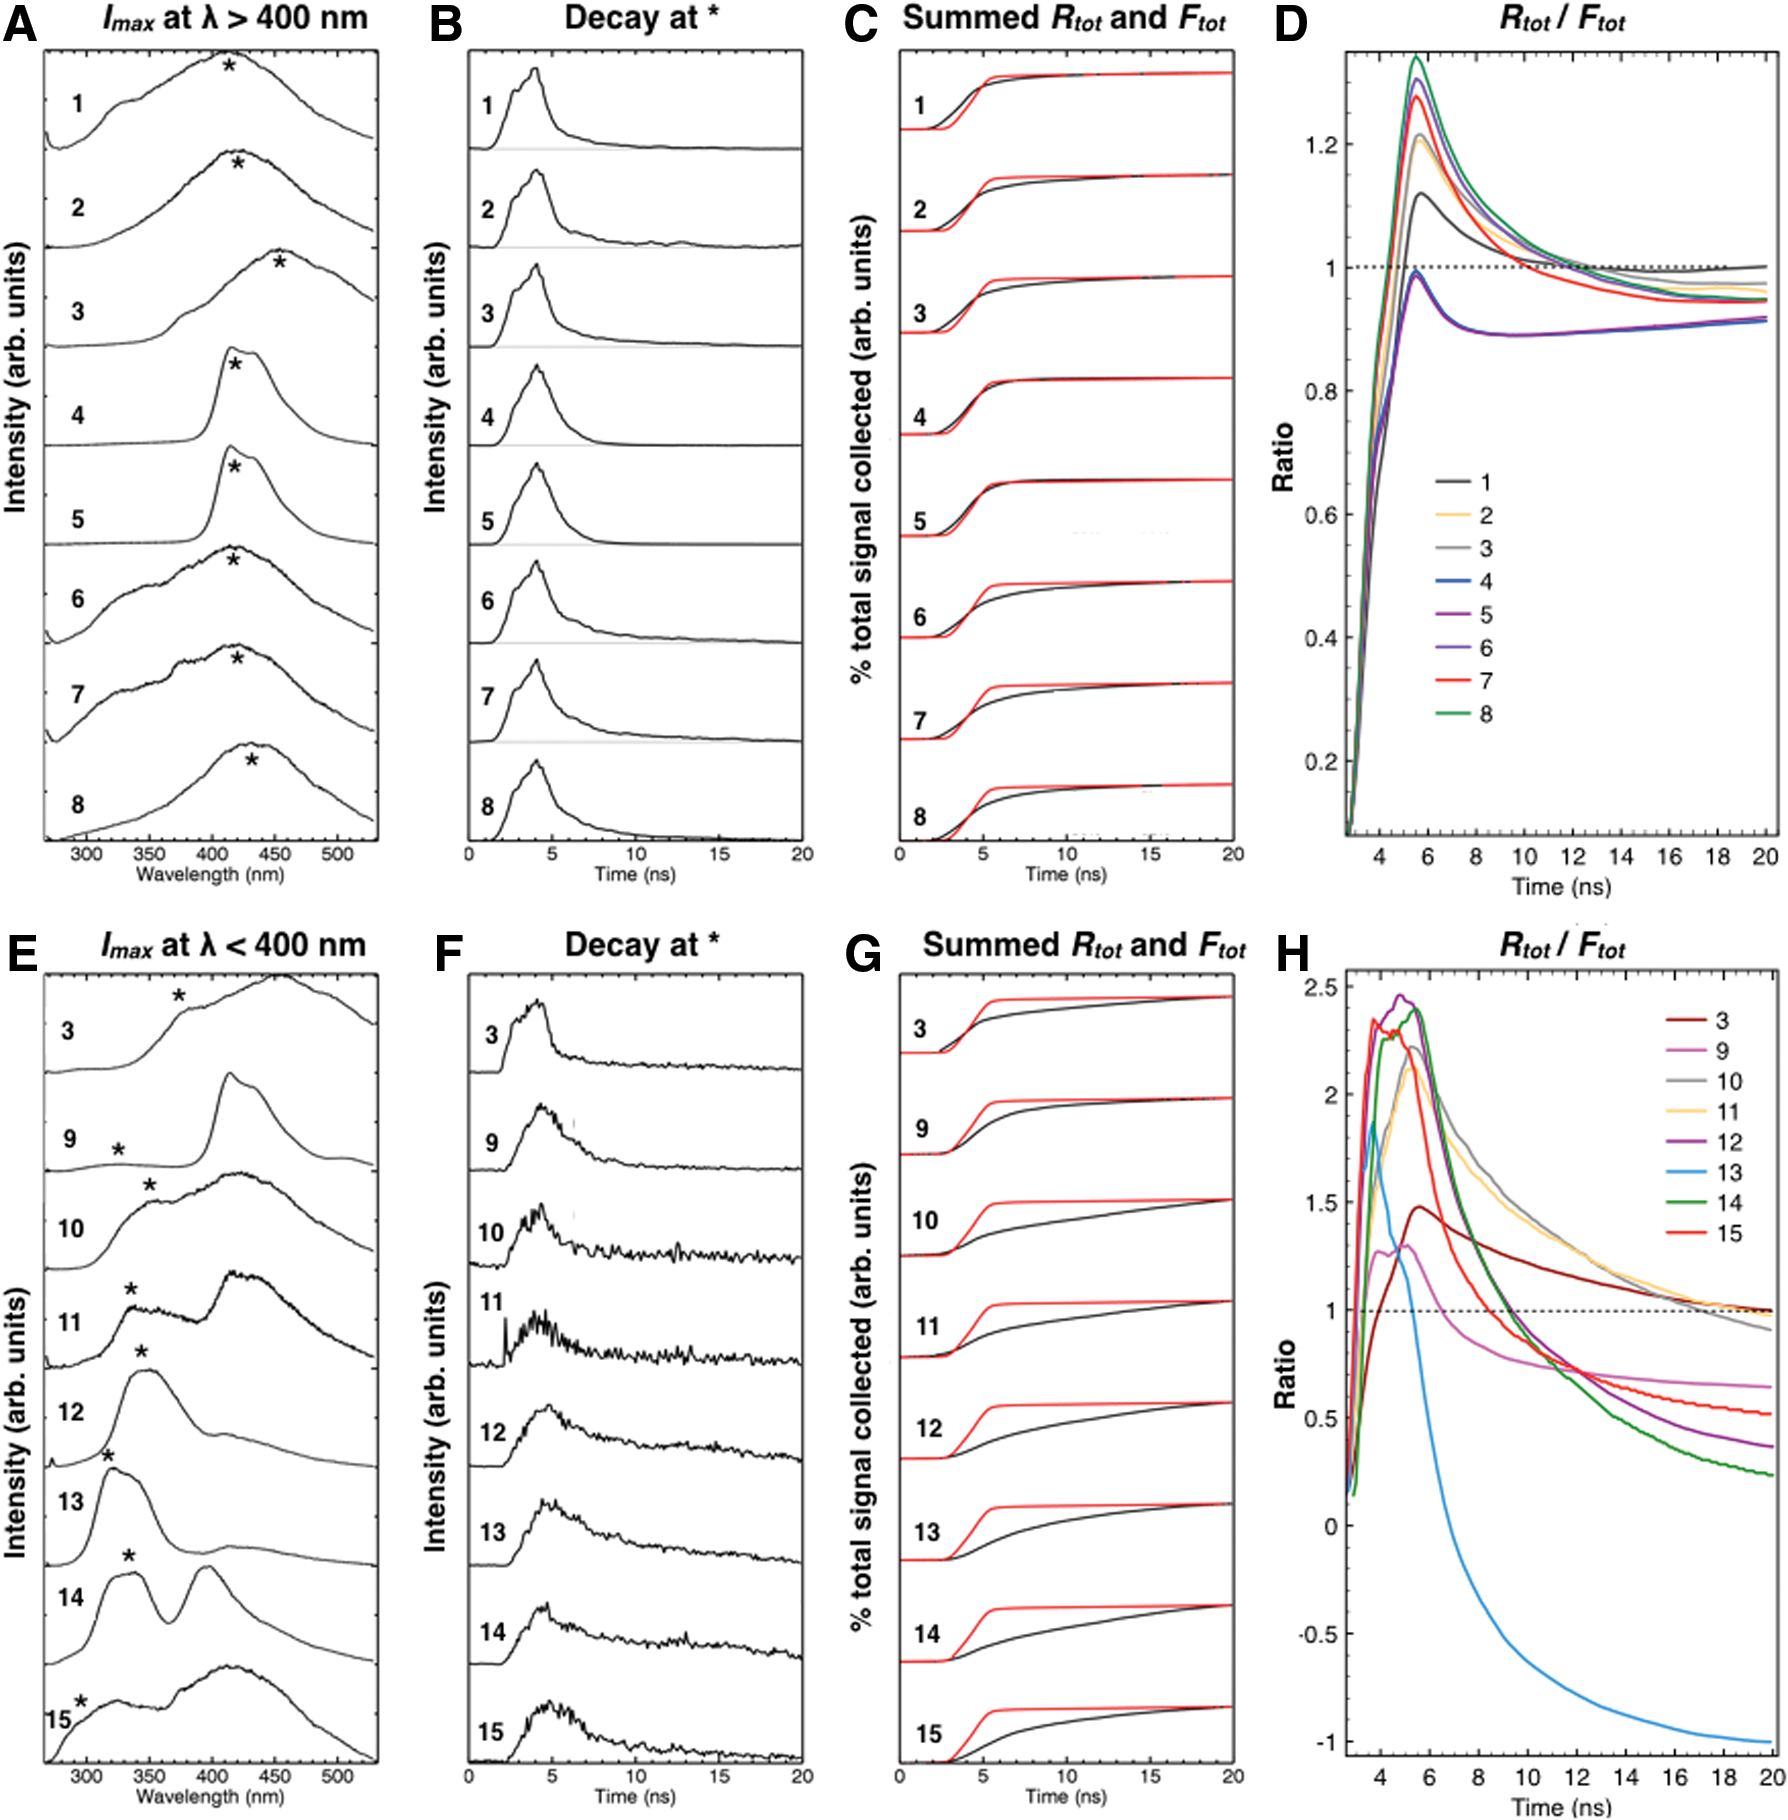
Quantification of gating effects on fluorescence reduction.
4. Discussion
4.1. Kerogen detection with combined UV-TG Raman and fluorescence data sets
Goal 1 of our study was to explore the capabilities of UV-TG Raman and fluorescence spectroscopies for detecting naturally preserved kerogen in our complex, natural samples as a potential biosignature. Our UV-TG Raman spectra reveal that vibrational bands diagnostic of various aromatic carbonaceous compounds, including kerogen, are visible for all samples except the evaporitic mudstone (Section 4.3).
UV-TG Raman spectra usually reveal both the D and G bands (whose peak centers varied across samples) present (e.g., Fig. 9 spectra 5, 15, 16, and 21), or only the G band present (e.g., Fig. 9 spectrum 1). The significance of G band peak variation and what it may reveal about carbon structure, maturity, and bonding have been discussed elsewhere (Ferrari and Robertson, 2001; Ferrari and Robertson, 2004; Allwood et al., 2006; Bower et al., 2013 and references therein). Additional weaker bands at 2900–3300 cm−1 are present in some spectra (e.g., Fig. 9 spectra 1, 8, and 12), commonly attributed to second-order bands of highly graphitic carbon or kerogen (Section 1.2). In other instances, the G band is present with a weak, ambiguous D band, sometimes masked by a weak 1430 cm−1 calcite band in calcite-rich samples (Fig. 9 spectra 7–8).
D and/or G bands (and second-order bands) were always detected on grains suspected to be kerogen based on prior microscopy, whereas when mineral standards were interrogated, these vibrational bands were always absent (e.g., Fig. 9 spectra 4, 6, 9). But why was a G band usually present when mineral matrices were interrogated? UV-TG Raman spectra did not enable us to distinguish C = C aromatic components in kerogen, other types of organics (e.g., trace intracrystalline organics in the matrix), even if they are also potential biosignatures, or similarly structured abiogenic contaminants (deposited on the sample surface).
Our confidence in identifying UV-TG Raman bands caused by kerogen was strengthened only after examining colocated UV-TG fluorescence data acquired on candidate regions preselected by microscopy. UV-TG fluorescence results reveal two broad types of fluorescence features in all samples (Fig. 10A, B), although there are additional variations across each type. Both types of fluorescence are interpreted to be organic because they are present in both long- and short-gated spectra, suggesting that their decay lifetimes are short and consistent with organic sources (Section 1.4).
We interpret Type 1 fluorescence features, combined with D, G, and/or second-order UV-TG Raman bands on colocated microscale regions, as being due to organics contained in kerogen, such as hydrogenated amorphous carbon compounds, primarily PAHs, for the following reasons.
First, Type 1 fluorescence spectral features were obtained on spots in which candidate kerogen regions were previously targeted with microscopy analyses (Fig. 10D–F).
Second, the ∼300–500 nm feature in Type 1 spectra has a comparable morphology with the kerogen standard (Fig. 10A spectrum 5), likely because kerogen contains a complex mixture of many PAHs, which commonly have fluorescence features peaking in the ∼300–500 nm range at λex = 266 nm (Apicella et al., 2004).
Third, these UV-TG Raman spectra are similar to spectra containing both D and G bands of kerogen-containing fossil ferns (Czaja et al., 2009), and to spectra of amorphous and hydrogenated amorphous carbon, which is compositionally similar to kerogen (Ferrari and Robertson, 2004), both at UV excitation (λ ex = 244 nm).
Type 1 spectra correspond to sample spots whose UV-TG Raman spectra contain both D and G bands. The chert is an exception, lacking the D band, but the presence of both a G band and second-order Raman bands is consistent with highly graphitic, thermally mature kerogen, common in that sample, and closely matches the Raman spectrum of the kerogen standard (compare Fig. 9 spectra 1 and 2). Another exception is one region in the marine sandstone matrix (Fig. 10A spectrum 1), where a kerogen spot not visible with microscopy was likely captured in the laser sampling volume.
Conversely, spots that revealed Type 2 spectra were usually associated with a weak G band in UV-TG Raman spectra and lacked a D band or second-order bands (Fig. 9 spectra 11–12, 17–20). The D band may have been present but undetectable in these cases since the G band was weak. We interpret Type 2 spectra and colocated UV-TG Raman spectra containing only G bands as caused by organics unassociated with our targeted biosignature (preserved kerogen) for two reasons. First, Type 2 fluorescence spectra (Fig. 10B) were obtained solely on matrix regions where kerogen was not visible with microscopy (Fig. 10G–I). Second, these spectra show a convolution of fluorescence features that significantly differ from those of the kerogen standard (Fig. 10A spectrum 5).
What is the origin of the organics revealing both Type 2 fluorescence and G bands in colocated UV-TG Raman spectra? We hypothesize that various micron-sized, thermally immature organic compounds were present in the mineral matrix of such samples and were undetectable at the resolution of our petrographic microscope or UV-TG Raman and fluorescence imaging systems (and unlikely to be detectable by a rover imager on Mars).
One possible source for these organics may be fulvic acids, a class of compounds often associated with carbonate nucleation (Van Beynen et al., 2001; Neuweiler et al., 2003). Fulvic acids can be the dominant organic fluorophore causing carbonate fluorescence and can produce spectral features that are similar to Type 2 features (Sierra et al., 1994; Neuweiler et al., 2003). It is notable that Type 2 features were visible mainly in carbonate-rich samples. This interpretation is also consistent with the fact that carbonate mineral standards (naturally derived dolomite and calcite; Fig. 10C) also contained weak Type 2 features.
In one carbonate sample displaying Type 2 fluorescence features, we performed CRIS to elucidate the nature, size, and distribution of organics it preserved. Two categories of micron to submicron-sized organics dispersed throughout the matrix were identified (Fig. 6C–G): (1) kerogen and (2) less mature organics corresponding to many possible organic functional groups, including microfossil cell wall structures (Socrates, 2004; Marshall et al., 2006). By extension, such organics can also exist in other samples.
Neither category is likely to be a surface contaminant, since the sample was abraded (Section 2.5) and since organics were seen uniformly distributed throughout the sample. Neither type of micron-scale feature would be resolvable with the petrographic microscope or the UV-TG system. These organics may be composed of a variety of organic species trapped into an intracrystalline organic fraction during mineral precipitation (e.g., Neuweiler et al., 2003). The ambiguous origin of Type 2 features further highlights that natural geological samples preserve complex biosignatures that are not as easy to identify as pure organics.
Our interpretations are consistent with previous reports of organics preserved in our samples. For instance, in Alum Formation marine sandstone, researchers have documented well-preserved fossils thought to originate from fossil arthropods (Muller et al., 2009), consistent with our observations of abundant and quite large kerogen grains (Fig. 10D) and kerogenous Type 1 spectra in this sample (Fig. 10A spectra 1–2). Verde Formation evaporites are generally fossil poor (Wadell, 1972), consistent with our observation of nonkerogenous Type 2 fluorescence in that sample (Fig. 10B spectrum 8). In the Castile Formation sulfate evaporite, the presence of kerogenous and nonkerogenous organics mainly in the carbonate laminae (Figs. 9C and 10B, spectrum 6, and Fig. 10A, spectrum 3) is consistent with the literature (Anderson et al., 1972), which suggests that this is due to phytoplankton production during the carbonate deposition season. This is also true in the Walker Lake stromatolitic limestone's carbonate laminae (Osborne et al., 1982) and consistent with our observations of kerogenous and nonkerogenous organics in that sample's carbonate laminae (Type 2 organics, Fig. 10B spectra 9–10; Fig. 6).
One could argue that thermally immature or disordered organics trapped in the mineral matrix underwent “kerogenization” under the UV laser beam to yield the graphitic, ordered G bands we detected. However, laser-induced alteration was unlikely with the laser energies we used in our UV-TG Raman analyses: it was not observed in our samples under microscopy postanalysis or in organic analyses when using previous prototypes of this instrument (Eshelman et al., 2014; Skulinova et al., 2014). One could also argue that Type 2 features were caused by organic-rich surface contaminants. We also deem this unlikely because most sample surfaces were abraded immediately before analysis (Section 2.5).
This work highlights the need for further studies to systematically characterize organics expected on Mars to inform UV Raman and fluorescence biosignature analyses. This includes contaminants (rocket fuel, cosmogenic organics, etc.) and diverse biosignatures beyond kerogen, in natural geological samples and at multiple scales. Our results also highlight the sensitivity of UV λex for detecting kerogen as well as other (e.g., intracrystalline) organics (i.e., Type 1 vs. Type 2 fluorescence spectra) preserved in natural geological samples, either of which may be potential biosignatures.
Additional evidence for the organic origin of Type 1 and 2 fluorescence features could come from fluorescence decay lifetimes of ≲100 ns (Sharma et al., 2003; Bozlee et al., 2005). Fluorescence decay lifetimes can be derived from our time-resolved fluorescence data (Fig. 11B, F and Supplementary Fig. S5).
We attempted to calculate decay lifetimes at peak wavelengths of both Type 1 and 2 features using the method of Eshelman et al. (2015). However, this method, which assumes that a single component caused the observed fluorescence, produced large uncertainties in our calculated results. This implies that Types 1 and 2 features are caused by multiple mixed components; accurate calculations would require multicomponent analysis that is beyond the scope of this study. This further emphasizes the complex nature of biosignatures in natural samples analyzed with UV spectroscopy methods, in contrast to simple idealized laboratory organics often used as Mars analogues.
4.2. Reducing fluorescence in Raman spectra
In CW Raman spectra, fluorescence often masked matrix mineral and/or kerogen features (e.g., Figs. 6B spectrum 1, 7B spectrum 1). In such cases, fluorescence could be reduced only through photoquenching with high laser power, in which case kerogen or matrix features became visible (e.g., Figs. 5C, 6B spectrum 2). However, we discourage the use of this method for CW Raman analysis, as it could alter the sample and lead to spurious interpretations (Marshall et al., 2010; Jorge-Villar and Edwards, 2013).
With UV-TG Raman spectroscopy, UV λ ex and gating were strategies to reduce fluorescence of kerogen and its host matrix; assessing these strategies was our study's second goal. Our results show that a UV-TG Raman system is suitable to detect the common diagnostic Raman bands associated with naturally preserved kerogen (Section 4.1) and the main vibrational band of its hosting mineral matrix (e.g., quartz, dolomite, calcite, and gypsum) in natural samples targeted on Mars; this is achievable without fluorescence interference <2000 cm−1, where diagnostic Raman bands occur.
What were the relative contributions of UV λ ex and gating in reducing fluorescence in Raman spectra? To isolate the effect of λ ex on fluorescence reduction, we acquired long-gated spectra with the UV Raman system to approximate a CW acquisition with UV λ ex. Long gating and λ ex = 266 nm allowed the identifications of the main matrix mineral (Fig. 9 spectra 11, 13, 17, 19) and kerogen peaks (Fig. 9 spectrum 15). Thus, λ ex = 266 nm mitigated fluorescence background in our Raman spectra <2000 cm−1. This result builds on previous successful detections of simple synthetic organics using the same UV-TG instrument (Eshelman et al., 2014). Additional work should seek to further understand the relationships between other biosignature types expected on Mars and Raman λ ex.
To isolate the effects of gating on fluorescence reduction, we performed two analyses: (1) comparisons of short- and long-gated spectra acquired on the same spots and (2) determination of gate lengths that maximize the Raman signal relative to fluorescence.
Compared with long-gated acquisitions on the same spots, short gating reduced fluorescence >2000 cm−1 (Fig. 9B, C). Short gating was not necessary to identify kerogen first-order bands, but it did enable the identification of an additional weak calcite band and second-order kerogen bands at >2900 cm−1 (Fig. 9; spectrum 12). Second-order bands are complementary but not essential to identify highly graphitic carbonaceous compounds that may or may not be biosignatures (since first-order bands are much more intense), neither in our samples nor on Mars.
To determine optimal gate lengths, we examined ratios of cumulated Raman signal, Rtot , to cumulated fluorescence signal, Ftot (detailed in Fig. 11). Results from this analysis suggest that the ratio is optimized (Rtot /Ftot > 1) at gating windows of 4 to 12 ns (Fig. 11D, H) where the amount of Raman signal is maximized relative to fluorescence signal collected. To build on this result, future studies could systematically quantify fluorescence reduction as a function of gate width to optimize development of laboratory or rover-based time-gated Raman systems.
Based on these analyses, and building on previous successes of UV-TG Raman detections of simple synthetic organics (Eshelman et al., 2014, 2015), we conclude that both gating and UV λ ex independently reduced fluorescence in our samples containing natural kerogen. Either (or both) strategies could enhance the potential of Raman spectroscopy to detect kerogen in similar lithologies likely to be targeted for analysis on Mars.
4.3. Sample-specific issue with UV Raman spectroscopy
The final goal of this study was to identify sample-specific issues, with UV Raman spectroscopy, that could challenge identifications and affect sample caching. One such issue arose with the evaporitic mudstone.
In the mudstone, visible CW Raman analyses of the matrix and kerogen were impeded by high fluorescence (Fig. 8D, spectrum 1). However, with UV-TG Raman spectroscopy, we did not observe significant fluorescence <2000 cm−1 (Fig. 9 spectrum 10). In this sample, no matrix mineral or organic vibrational bands were detected with UV-TG Raman spectroscopy. (It is notable that at least a weak G band was detectable in all other sample spectra, even when kerogen was not targeted.)
We hypothesize that the absence of Raman information in the mudstone is attributable to strong UV absorption near λ ex = 266 nm by transition metal (Fe in this sample) coordination complexes. The mudstone contains Fe-bearing phases, as suggested by microscopy (Fig. 8C) and confirmed by visible Raman spectroscopy (hematite, Fig. 8D, spectrum 2) and other techniques (Fe-rich saponite; Table 1). Such minerals commonly exhibit intense and broad charge transfer absorptions between 200 and 300 nm, especially around 240–260 nm (e.g., octahedrally coordinated Fe3+ transitions in hematite; Cloutis et al., 2008 and references therein).
UV absorption can occur in such phases even at abundances as low as 0.01% by weight (Cloutis et al., 2008). Our XRD analyses did not identify Fe oxides, suggesting that crystalline Fe-bearing phases (e.g., hematite) were present below the detection limit of ∼5% and that any other Fe phases were likely amorphous. Qualitative microscopy and visible Raman data on the evaporitic mudstone suggest that abundances of Fe-bearing phases were >0.01 bulk wt %.
In contrast, UV absorption did not hamper the identification of spectral features of the marine sandstone, although this sample contains glauconite and illite as possible Fe-bearing phases (Table 1). Perhaps this is due to different distributions and types of such phases in the sandstone, or to differences in Raman scattering cross-sections (Stopar et al., 2005).
4.4. Implications for Mars 2020
How does our study inform Mars 2020 rover interpretations? SHERLOC's UV Raman spectrometer is slated to have a range from 810 to >3600 cm−1. This would make it suitable to detect the common diagnostic Raman bands associated with aromatic carbonaceous compounds, if detected on Mars, such as kerogen (D and G bands), including weaker second-order features at 2400–3300 cm−1. However, SHERLOC will not be gated; thus our short-gated spectra (Fig. 9A–C gray spectra) are not directly analogous to what this instrument might observe on Mars. Our long-gated UV Raman results (Fig. 9B, C, black spectra), which mimic UV Raman ungated acquisitions, suggest that an ungated Raman spectrometer is suitable to detect kerogen, if detected on Mars.
Similarly, SHERLOC's fluorescence spectrometer will also be ungated and have a range from 250 to 360 nm. In our data, this region has been indicated in the gray zones in Fig. 10. Observing long-gated fluorescence spectra in our data (black spectra in Fig. 10) within these gray zones, we concluded that SHERLOC's fluorescence spectrometer would allow the UV edge of Type 1 fluorescence features to be visible, if detected. SHERLOC-like fluorescence spectroscopy systems have previously demonstrated UV edge detections of pure organic compounds (e.g., nucleic acids, and aromatics such as phenanthrene; Beegle et al., 2014; Beegle et al., 2015). In addition, SuperCam's fluorescence spectrometer may provide complementary information about the same features (in different excitation and emission ranges).
Success in identifying potential biosignatures on Mars will be enhanced by using multiple instruments that provide combined data sets at multiple spatial scales, within a well-defined geological context. Microscale imaging for geological context should be provided by Mars 2020's WATSON or SuperCam imagers, which will have a resolution of ∼10 s of μm down to 0.65 μm, comparable with Mars Science Laboratory's MAHLI and ChemCam imagers (Edgett et al., 2012; Wiens et al., 2014).
These microscale imaging contextual observations, together with the discovery of the Raman and fluorescence features discussed, could provide the strongest evidence for the presence of carbonaceous compounds if found on Mars. Such a discovery would call for further analyses using other payload instruments, and may warrant sample caching. We did not determine the precise composition of the components causing either organic spectral signature. This is consistent with a Mars-based scenario where caching decisions will not require knowledge of organic composition or provenance (such biogenicity analyses in cached samples will be performed on Earth).
In one of our samples, the evaporitic mudstone, our UV Raman analyses did not detect biosignatures or minerals (Fig. 9A spectrum 10). We hypothesized that this was caused by strong UV absorptions from transition metals (like Fe) near the laser's UV excitation wavelength (Section 4.3). Although Fe- and other transition metal-bearing minerals are widespread on Mars, many factors could affect the intensity and wavelength of their UV absorption (Cloutis et al., 2008 and references therein). These include the abundances of metals; their oxidation states, ion species, coordination environment, and metal–O covalency; grain size and distribution (as detrital grains, interlayer ions, on weathering rims, etc.). For example, Marshall and Marshall (2015) noted related issues with UV Raman detections of Mars analog sulfates rich in Fe, Cr, and Mn.
The systematic study of UV Raman detections of transition metal-bearing minerals and biosignatures preserved in transition metal-rich matrices remains to be explored. Since SHERLOC will have a λ ex in the range of these absorptions, we recommend a systematic exploration of this topic to understand how it might affect SHERLOC analyses. Such studies should examine how UV Raman detections of kerogen depend on the abundance and distribution of both biosignatures and transition metal phases in the matrix, consider absorption due to scales and mechanisms, and assess how instrument factors (i.e., power density and spot size differences) affect detection.
5. Conclusions
Using λ ex = 266 nm excitation time-gated (UV-TG) Raman and fluorescence spectroscopy systems, we investigated the identification of kerogen as a potential biosignature and its host mineral matrix in seven diverse natural geological field-collected samples. Our samples represent a broad range of depositional environments and lithologies and are considered high-priority astrobiology targets for Mars. Previous work has shown that Raman and fluorescence spectroscopy techniques can detect pure synthetic organics. Our results build on this to demonstrate the value of deep UV Raman and fluorescence spectroscopies for analyzing a suite of challenging, diverse, and high-priority Mars analog geological samples containing natural, nonextracted kerogen composed of complex mixtures of organic compounds.
We explored the capabilities of UV-TG Raman and fluorescence spectroscopies to detect kerogen as a potential biosignature in our samples. Our UV-TG Raman analyses revealed common diagnostic Raman bands associated with aromatic macromolecular carbonaceous compounds, along with the main vibrational bands of its preserving mineral matrix, without being impeded by fluorescence <2000 cm−1.
A G band indicative of aromatic carbon was detected in most UV-TG Raman spectra, even when not targeting kerogen. This confirmed the utility of the UV excitation wavelength for biosignature detection, but also demonstrated the potential for complications in sample caching decisions on Mars. The presence of D and/or G bands in Raman spectra on Mars would indicate the presence of either abiotic MMC or biogenic kerogen. Such a finding would indicate a potential biosignature and strongly favor caching for sample return. On Earth, detailed laboratory analyses would then be necessary to thoroughly assess its biogenicity.
UV-TG fluorescence analyses revealed that fluorescence from kerogen is detectable as a broad convolution of features between 300 and 500 nm (Type 1) and distinguishable from other (Type 2) organic fluorescence. Together, these data highlight the value of using colocated UV-TG Raman and fluorescence data sets on microscale targeted spots to strengthen the confidence of potential biosignature detection and inform sample caching decisions, without the need for precise compositional knowledge or the organic source. Such analysis would best be performed on Earth following MSR.
Our samples exhibited diverse levels of laser-induced fluorescence in visible CW Raman spectra, which often challenged identifications. We assessed the effectiveness of time gating and UV laser λex to reduce fluorescence in Raman spectra and found that the ability to identify kerogen and reduce fluorescence was enhanced by gating and UV excitation independently. Gate times of 4 to 12 ns maximized the Raman signal relative to fluorescence signals. Time gating enabled the detection of complementary but nonessential Raman bands in minerals and kerogen.
A sample-specific issue was revealed for one sample. In the evaporitic mudstone, UV absorption by certain mineral phases may have prevented the identification of mineral and organic features in UV Raman spectra. Further work is needed to understand how UV absorption by transition metals could challenge UV Raman analysis on Mars.
Overall, our results suggest that Mars 2020's SHERLOC, a combined ungated UV Raman/fluorescence spectrometer, may be suited to identify common diagnostic Raman bands and the UV edge of fluorescence features of complex nonextracted targeted kerogen grains in natural samples. In light of the rapidly approaching Mars 2020 launch, our results are intended to guide strategies for caching decisions. Beyond MSR, these results may inform future development of Raman and fluorescence instruments, guided by sample-dependent and science-driven considerations.
Footnotes
Acknowledgments
This work was supported, in part, by a NASA Astrobiology Institute (NAI) Early Career Collaboration Award, the NASA Mars exploration Program, and the Natural Sciences and Engineering Research Council of Canada (NSERC), and the Postdoctoral Fellowship at Carnegie Institution for Science. The use of facilities within the LeRoy Eyring Center for Solid State Science at Arizona State University is gratefully acknowledged. Emily Matys (MIT) is thanked for prompt assistance providing the kerogen standard. Marc Neveu (NASA HQ/USRA) is thanked for assistance with editing. Andrew Steele (Carnegie Institution for Science) is thanked for very helpful discussion and for assistance with the WITec Raman system. Two anonymous reviewers are thanked for their reviews that greatly improved this article.
Author Disclosure Statement
No competing financial interests exist.
Abbreviations Used
References
Supplementary Material
Please find the following supplemental material available below.
For Open Access articles published under a Creative Commons License, all supplemental material carries the same license as the article it is associated with.
For non-Open Access articles published, all supplemental material carries a non-exclusive license, and permission requests for re-use of supplemental material or any part of supplemental material shall be sent directly to the copyright owner as specified in the copyright notice associated with the article.