
Abstract
Sedimentological observations from the Paleoproterozoic Huronian Supergroup are suggested to mark the rise in atmospheric oxygen at that time, which is commonly known as the Great Oxidation Event (GOE) and typically coupled with a transition from mass-independent fractionation (MIF) to mass-dependent fractionation (MDF) of sulfur isotopes. An early in situ study of S three-isotopes across the Huronian Supergroup by Papineau et al. (2007) identified a weak MIF–MDF transition. However, the interpretation and stratigraphic placement of this transition is ambiguous. In this study, all four S isotopes were analyzed for the first time in two Huronian drill cores by secondary ion mass spectrometer (SIMS), and both Δ33S and Δ36S were calculated. Based on improved precision and detailed petrography, we reinterpret the dominance of pyrrhotite in the studied sections, which was previously proposed as “early authigenic” in origin, as resulting from regional metamorphism. Small but analytically resolvable nonzero values of Δ33S (from −0.07‰ to +0.38‰) and Δ36S (from −4.1‰ to +1.0‰) persist throughout the lower Huronian Supergroup. Neither pronounced MIF-S signals nor a MIF–MDF transition are seen in this study. Four scenarios are proposed for the genesis of small nonzero Δ33S and Δ36S values in the Huronian: homogenization by regional metamorphism, recycling from older pyrite, dilution by magmatic fluids, and the occurrence of MDF. We argue that the precise location of the MIF–MDF transition in the Huronian remains unsolved. This putative transition may have been erased by postdepositional processes in the lower Huronian Supergroup, or may be located in the upper Huronian Supergroup. Our study highlights the importance of integrated scanning electron microscopy and secondary ion mass spectrometry techniques in deep-time studies and suggests that different analytical methods (bulk vs. SIMS) and diagenetic history (primary vs. metamorphic) among different basins may have caused inconsistent interpretations of S isotope profiles of the GOE successions at a global scale. Key Words: Great Oxidation Event (GOE)—Secondary ion mass spectrometer (SIMS)—Paleoproterozoic—Sulfur isotopes—Mass independent fractionation (MIF). Astrobiology 18, 519–538.
1. Introduction
A
Sedimentological observations worldwide suggest that Earth witnessed the first rise in atmospheric oxygen at ∼2.3 Ga, commonly known as the Great Oxidation Event (GOE) (Holland, 1984; Kasting et al., 1992; Bekker et al., 2004; Hannah et al., 2004; Holland, 2006). This event has been widely inferred by a global sedimentological transition from the disappearance of oxygen-sensitive detrital minerals (e.g., pyrite, uraninite, and siderite) and the widespread appearance of hematite-rich red beds in the sedimentary record (Cloud, 1968; Roscoe, 1969, 1973; Rasmussen and Buick, 1999; Dutkiewicz et al., 2006; Farquhar et al., 2011; Johnson et al., 2014; Fischer et al., 2016). Coincidently, geochemical constraints based on sulfur three-isotopes of sedimentary authigenic pyrite reveal notable disappearance of mass-independent fractionation (MIF-S) in the Paleoproterozoic, followed by over 2 billion years characterized by mass-dependent fractionation (MDF-S) (Farquhar et al., 2000; Farquhar and Wing, 2003, 2005; Johnston, 2011; Ono, 2017). The discovery of the MIF–MDF transition is widely regarded as the smoking gun for the GOE (Kump, 2008).
The Huronian Supergroup in Canada (Figs. 1 and 2) is one of the most-studied Paleoproterozoic sedimentary records in the world and thus bears the potential to capture the GOE. Intensive studies have been conducted on the sedimentology (e.g., Wood, 1973; Young, 1991; Hill et al., 2016), geochronology (e.g., Krogh et al., 1984; Corfu and Andrews, 1986; Ketchum et al., 2013; Rasmussen et al., 2013), paleomagnetism (e.g., Williams and Schmidt, 1997), biomarkers (e.g., Dutkiewicz et al., 2006), and chemostratigraphy (e.g., Nesbitt and Young, 1982; Wing et al., 2002, 2004; Bekker and Kaufman, 2007; Papineau et al., 2007; Sekine et al., 2011a, 2011b; Goto et al., 2013) of the Huronian Supergroup.

Map showing the distribution of the Huronian Supergroup and other Paleoproterozoic successions in the Great Lakes area. The two studied drill cores (150–4, 156–1) are located ca. 10 km north of the city of Elliot Lake, Ontario, Canada. Modified from the work of Rasmussen et al. (2013).
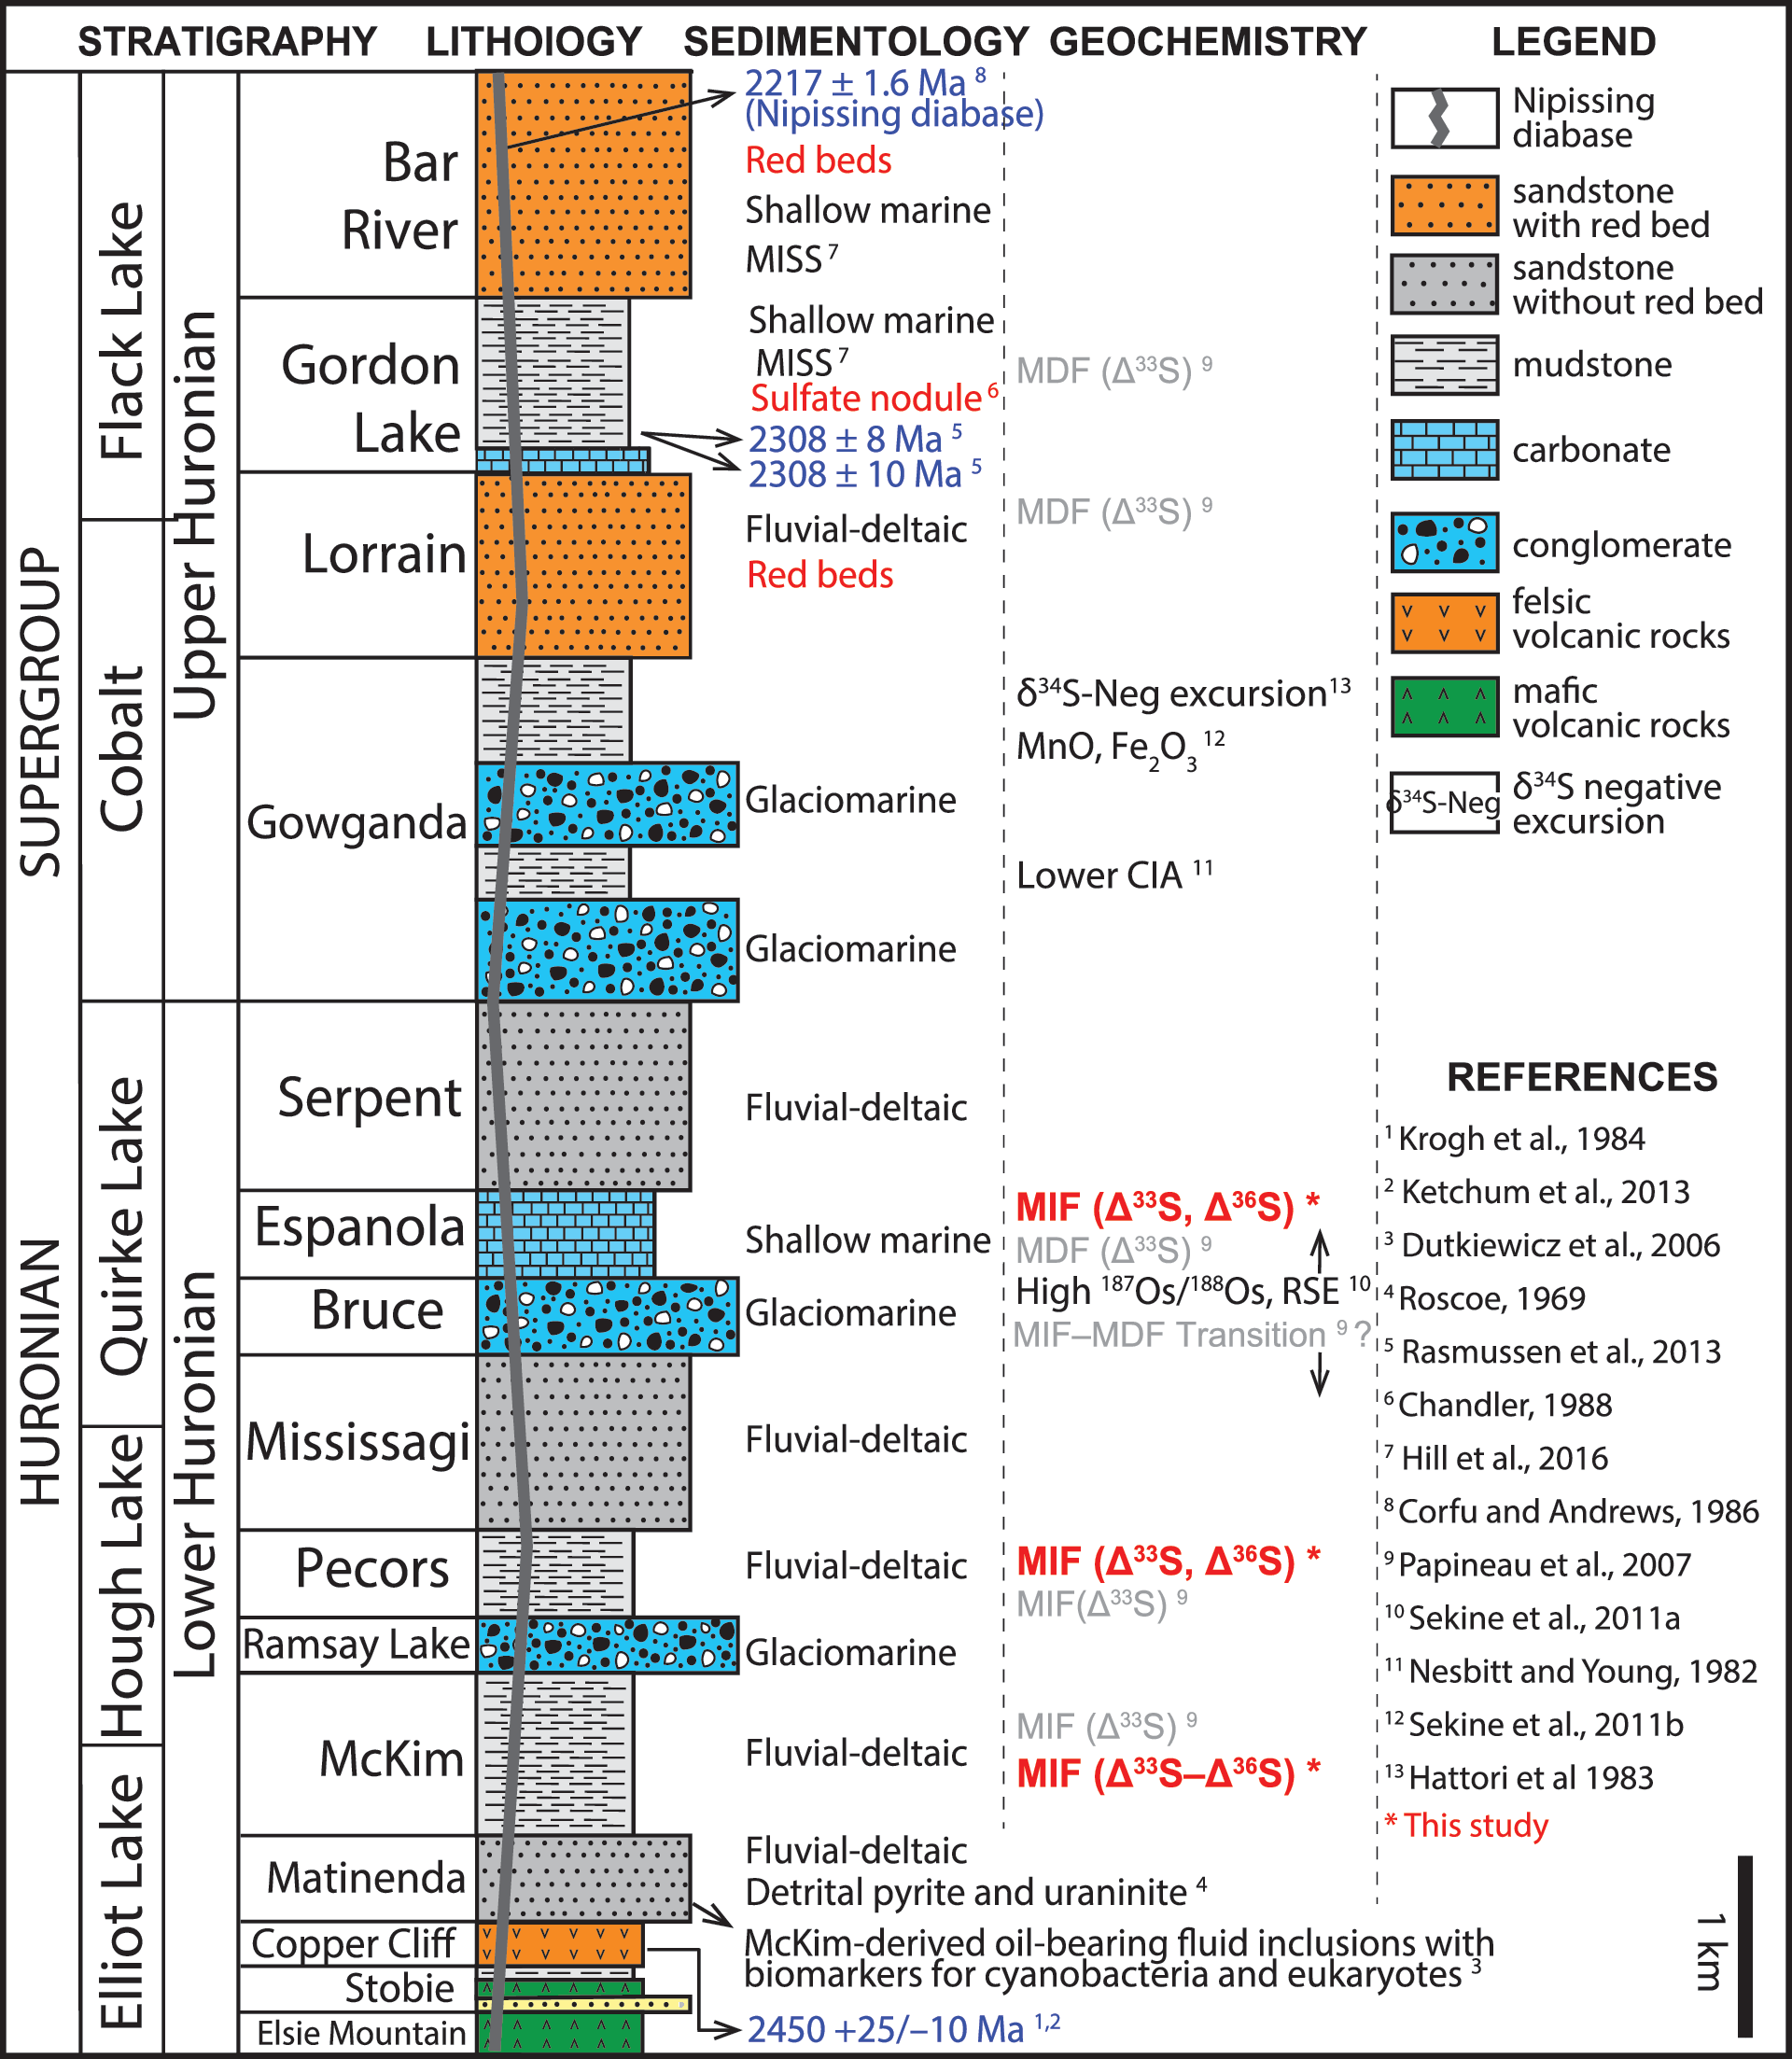
Integrated lithostratigraphy, sedimentology, and geochemical studies of the Huronian Supergroup. Lithostratigraphy modified after Young et al. (2001), Dutkiewicz et al. (2006), and Hill et al. (2016). Sedimentological observations include detrital pyrite and uraninite (Roscoe, 1969), oil-bearing fluid inclusions (Dutkiewicz et al., 2006), red beds (Roscoe, 1973), microbially induced sedimentary structures (Hill et al., 2016), and sulfate nodules (Chandler, 1988). Age constraints were measured from Nipissing diabase (Corfu and Andrews, 1986) and Copper Cliff Formation (Krogh et al., 1984; Ketchum et al., 2013). Geochemical data include sulfur isotopes (Hattori et al., 1983; Papineau et al., 2007), CIA (Nesbitt and Young, 1982), high initial 187Os/188Os and redox-sensitive elements (e.g., Mo, Re) (Sekine et al., 2011a), and MnO–Fe2O3 enrichment right after the Gowganda glaciation (Sekine et al., 2011b). Note that the previously proposed MIF–MDF transition (Papineau et al., 2007) has been reevaluated in this study. Abbreviations: CIA = chemical index of alteration; MDF = mass-dependent fractionation; MIF = mass-independent fractionation; MISS = microbially induced sedimentary structure; RSE = redox-sensitive elements.
Notably, a sulfur three-isotope study by secondary ion mass spectrometer (SIMS) was published showing mild MIF(Δ33S) signals in rocks deposited below the Bruce diamictite (McKim and Pecors Formations) and MDF(Δ33S) signals above the Bruce diamictite (in the Espanola Formation) (Papineau et al., 2007). This tantalizing but subtle shift in the Huronian Supergroup has been used to correlate and infer the global patterns of the GOE among other Paleoproterozoic successions worldwide (e.g., Papineau et al., 2007; Williford et al., 2011; Hoffman, 2013; Rasmussen et al., 2013; Gumsley et al., 2017).
However, the published Δ33S data from the Huronian Supergroup all fall within a narrow range of Δ33S = −0.25‰ to +0.25‰ (ca. ±0.23‰, precision reported as 2SD hereafter), except three data points (0.45‰, 0.51‰, and 0.88‰) that have been interpreted as critical MIF-S signals marking the end of the GOE (Papineau et al., 2007). The absence of a stronger MIF–MDF transition in the Huronian stands in strong contrast to other GOE sections where Δ33S values are up to +7‰ (Guo et al., 2009; Luo et al., 2016) and suggested the need for a more comprehensive study including Δ36S analysis.
Questions based on the published Δ33S record in Huronian sediments include the interpretation of faint MIF and MDF signals and thereby the location of MIF–MDF transition and of the GOE. (1) Might the small nonzero Δ33S values be an artifact of poorer analytical precision in early studies? (2) If real, are the small nonzero Δ33S values due to MIF? Alternatively, these small MIF signals might reflect remobilized compositions from an older MIF-bearing sulfur reservoir (e.g., Ulrich et al., 2011; Williford et al., 2011; Cabral et al., 2013; Reinhard et al., 2013), a period with diminished photochemical reaction in the atmospheric S cycle (Williford et al., 2011), or some other conditions that favor the production of a prolonged, muted Δ33S signature (e.g., Thomazo et al., 2009). (3) Does the weak MIF–MDF transition in the lower Huronian (Papineau et al., 2007) reflect variation in secular S isotope signals or values altered by regional metamorphism? It should be taken as cautionary that most published Huronian Δ33S data points can hardly be distinguished between MIF and MDF.
To answer these questions, we conducted a SEM–SIMS study that combines petrography and imaging with in situ S four-isotope study of the Huronian sulfide minerals by SIMS. Improved analytical precision of all four S isotopes was achieved with modifications of the SIMS detector system and analytical protocols (Ushikubo et al., 2014). Both Δ33S and Δ36S were determined for the first time by SIMS in the Huronian. Two of the previously studied drill cores of the Huronian Supergroup were analyzed to reevaluate the dynamics of biogeochemical S cycles and atmospheric oxygen evolution in this critical period.
2. Geological Background
The Huronian Supergroup is comprised of five groups: Elliot Lake, Hough Lake, Quirke Lake, Cobalt, and Flack Lake, in ascending stratigraphic order (Fig. 2). There are three distinct glacial diamictite deposits: Ramsay Lake, Bruce, and Gowganda Formations (Roscoe, 1969; Wood, 1973; Young, 1991, 2002; Melezhik et al., 2013).
The lower Huronian Supergroup includes basal detrital and volcanic rocks and the lower two suites of diamictite. The Matinenda Formation is deposited on an Archean unconformity surface and contains detrital pyrite (FeS2) and uraninite (UO2) in sandstones and conglomerates, which have been widely accepted as evidence for anoxic conditions during sediment transportation and deposition (Roscoe, 1969; Zhou et al., 2017). In addition, organic geochemistry studies on oil-bearing fluid inclusions in quartz of the Matinenda suggest hydrocarbons are derived from the overlying McKim Formation (Dutkiewicz et al., 2006). Going up section, the McKim and Pecors Formations straddle the Ramsay Lake diamictite and are both fluvial-deltaic facies mudstones. Above the Bruce diamictite, the Espanola Formation shows bedded carbonates likely deposited in a shallow marine environment.
The upper Huronian Supergroup starts with the glacial Gowganda diamictites. Above the uppermost Gowganda diamictite, hematite-rich red beds are found in the Lorrain Formation, the first appearance of oxidized sediments in this region and widely regarded as a sedimentological response to an oxidizing atmosphere (Roscoe, 1973). Sulfate nodules were found in the Gordon Lake Formation (Chandler, 1988), further suggesting the onset of oxidative weathering of pyrite. Red granitic clasts in the Gowganda tillites are frequently interpreted as the result of post-GOE weathering, but the timing of oxidative alteration is uncertain. Abundant microbially induced sedimentary structures have been identified in the Gordon Lake Formation and the overlying Bar River Formation, suggesting microbial colonization during deposition (Hill et al., 2016).
Geochronological constraints for the Huronian Supergroup include radiometric ages of zircons from the felsic volcanic rocks in the Copper Cliff Formation near the base of the supergroup (ca. 2.45 Ga) (Krogh et al., 1984; Ketchum et al., 2013) and U–Pb zircon ages (ca. 2.3 Ga) in the Gordon Lake Formation (Rasmussen et al., 2013). Concordant baddeleyite and rutile ages from the Nipissing diabase toward the top of this supergroup (ca. 2.22 Ga) provide a younger age constraint, consistent with zircon ages (Corfu and Andrews, 1986) (Fig. 2).
The maximum metamorphic grade for the Huronian Supergroup at the studied locations is lower greenschist facies (350°C), which probably occurred either during the Penokean orogeny (∼1.89–1.8 Ga) (Card, 1978; Young et al., 2001) or during the intrusion of the Nipissing diabase dike swarm at ca. 2.22 Ga (Mossman et al., 1993).
3. Materials and Methods
3.1. Sampling strategy
In this study, to help avoid detrital components, only marine facies (i.e., carbonate- or siltstone-dominated intervals) were selected for petrographic and geochemical analysis. The sampled intervals include the McKim Formation (marine siltstone), the Pecors Formation (marine siltstone), and the Espanola Formation (marine siltstone and limestone). Due to the large contribution by detrital/terrestrial sediments in siliciclastic facies (e.g., Ulrich et al., 2011; Zhou et al., 2017), the sandstone-dominated Mississagi and Serpent formations and the three diamictite intervals were avoided during sampling. A suite of 16 samples from two Huronian drill cores was analyzed for S four-isotopes by SIMS, including 11 samples from the Kerr-McGee drill core 150–4 (Supplement S2; Supplementary Data are available at
Several sulfide minerals have been found in the Huronian samples, which include pyrite, pyrrhotite, chalcopyrite, sphalerite, pentlandite, and cobaltite. Due to “orientation effects” that degrade accuracy for SIMS data in a few minerals (Kozdon et al., 2010; Kita et al., 2011), sphalerite was not considered for analysis in this study. Only grains of pyrite, pyrrhotite, and chalcopyrite, that have been shown not to have orientation effects, were analyzed by SIMS for S four-isotopes in this study. Most of the sulfide minerals are anhedral in shape, showing irregular morphology commonly intergrowing with chlorite and other silicate minerals (Fig. 3). SIMS samples were cast in round mounts with the UWPy-1 pyrite standard near the center of the 25 mm diameter, 5 mm thick mount. All analyzed minerals were imaged by scanning electron microscope (SEM) with back-scattered electrons (BSE) prior to SIMS analysis. Mineral chemistry was verified by SEM energy-dispersive spectrometry (EDS) and wavelength-dispersive electron-probe microanalysis (EPMA).

Back-scattered electron (BSE) images of the Huronian samples show close association between pyrrhotite (Po) and chlorite (Cht). Images B, D, F, H show the marked zones in images A, C, E, G, respectively. Sample depth: (
3.2. SIMS analysis
Sulfur four-isotope data were measured with a CAMECA IMS 1280 in the WiscSIMS (Wisconsin Secondary Ion Mass Spectrometer) Lab at the University of Wisconsin–Madison. Detailed methods can be found in previous publications (Valley and Kita, 2009; Kozdon et al., 2010; Williford et al., 2011, 2016; Ushikubo et al., 2014) and are only briefly described below.
Analysis of sulfur four-isotopes employed a 133Cs+ beam (∼5 nA) accelerated at 10 kV (impact energy = 20 kV). The beam size in this study is 20 μm. Samples were coated with 60 nm of gold, and a normal-incidence electron flood gun was used for charge compensation. Secondary ions of 32S-, 33S-, 34S-, and 36S- were detected simultaneously using four Faraday cup detectors with modified slits as described by Ushikubo et al. (2014). UWPy-1 (pyrite) was used as running standard with δ34S = 16.04 ± 0.18‰ CDT, Δ33S = −0.003 ± 0.009‰, and Δ36S = −0.21 ± 0.24‰ values analyzed by conventional gas source mass spectrometer (Ushikubo et al., 2014; Williford et al., 2016). The running standard is mounted in the center of each SIMS sample mount together with the unknown Huronian samples in order to closely monitor the running conditions during SIMS analysis. The raw isotope ratios were corrected for instrumental bias using mineral-specific lab standards: UWPy-1, Anderson pyrrhotite, and Trout Lake chalcopyrite (Crowe and Vaughan, 1996; Kozdon et al., 2010) (Supplement S1). Analytical spot-to-spot precisions are δ34S ± 0.39‰, Δ33S ± 0.04‰, and Δ36S ± 1.13‰ (2SD) based on the groups of eight bracketing UWPy-1 standard analyses during the SIMS session of Huronian samples (Supplement S4), which is comparable to what Ushikubo et al. (2014) reported in previous sessions (δ34S ± 0.23‰, Δ33S ± 0.05‰, Δ36S ± 0.86‰). UWPy-1 was analyzed a total of 157 times in this study (Supplement S4).
Each analysis consisted of 10 s for pre-sputtering, 80 s for centering of secondary ions in the field aperture, and 80 s for isotope measurement. Average count rates for 32S- confirmed the stability of individual analyses. A typical count rate of 32S- was ∼5 × 10⁹ counts per second for pyrrhotite and pyrite, and ∼6 × 10⁹ counts per second for chalcopyrite. To monitor the magnitude of interference from 32SH- on the 33S- signal, the 32SH- peak was measured by scanning the deflector located between the magnet and the Faraday cup detectors after each analysis (Williford et al., 2011). The ratio of the 32SH- tail at the 33S- peak position relative to the 32SH- peak (32SH- tail/32SH- peak) was determined to be ∼1 × 10⁻⁵, which was used to correct the contribution of the 32SH- tail signal to the 33S- peak. The contribution of 32SH- to the 33S- peak in all the spots is negligible (with corrections from 0.0001‰ to 0.001‰).
After SIMS analysis, gold coating of the samples was removed by chemical dissolution of gold with saturated aqueous solution of potassium iodide (Jones et al., 2012). Samples were recoated with 20 nm thickness of carbon, and each pit was investigated by SEM-SE for possible irregularities.
3.3. Sulfur four-isotope data correction
Sulfur isotope ratios are reported in standard per mil (‰) notation relative to Vienna Canyon Diablo Troilite (VCDT). Measured ratios of 34S/32S, 33S/32S, and 36S/32S were divided by VCDT values and calculated as “raw” δ-values: δ34Sraw, δ33Sraw, and δ36Sraw, respectively. The sulfur isotope ratios of VCDT used in the calculations are 34S/32S = 1/22.6436, 33S/32S = 1/126.948 (Ding et al., 2001), and a revised 36S/32S value of 1/6641 (Ushikubo et al., 2014) instead of 1/6515 (Ding et al., 2001). Correction for 32SH- contribution to the 33S- peak was applied at this step. In this study, UWPy-1 (Balmat pyrite) was used as the monitoring standard for all the samples.
Correction factors of the instrumental bias of δ34S for pyrite samples are calculated based on the S four-isotope values of UWPy-1 measured by conversion of powdered sample to SF6 and gas-source mass spectrometry (Ushikubo et al., 2014). Although only the UWPy-1 pyrite standard was mounted in the center of each SIMS sample, pyrrhotite and chalcopyrite standards in other standard mounts were also analyzed at the beginning of each session in order to constrain the instrumental bias between different sulfide minerals (Supplement S1). In addition, Rutan pyrite and Norilsk chalcopyrite were run as checks for accuracy. Relative bias between pyrrhotite and pyrite was calculated based on the offset between UWPy-1 pyrite standard and Anderson pyrrhotite standard. All the corrected data, together with the corresponding petrographic images by SEM, can be found in the online supplementary materials (Supplements S1–S4).
3.4. EPMA analysis
Major element concentrations of sulfide minerals, including pyrrhotite, chalcopyrite, sphalerite, pentlandite, pyrite, and cobaltite, were analyzed by EPMA for Fe, S, Co, Ni, Cu, Zn, and As concentrations using wavelength-dispersive crystal spectrometers. Before EPMA, each spot was investigated by SEM, BSE, and EDS. EPMA was performed with a CAMECA SXFive FE electron microprobe at 20 kV, 20 nA and 1 micron defocused beam, with Astimex sulfide as well as pure metal standards, using the Armstrong/Love-Scott matrix correction, with Probe for Windows software (Donovan et al., 2018) at the Eugene Cameron Electron Microprobe Lab, Department of Geoscience, University of Wisconsin–Madison.
4. Results
4.1. Petrographic observations
Detailed petrographic investigation reveals multiple sulfide minerals, including pyrite, pyrrhotite, chalcopyrite, pentlandite, sphalerite, and cobaltite in the studied samples (Figs. 3 –8; see Supplements S2–S4 for a complete log of isotope sample and standard analyses). EPMA data (Supplement S5) confirm the identification of these minerals.

Petrographic observations and elemental mapping of multiple sulfide minerals coexisting in the same view. (
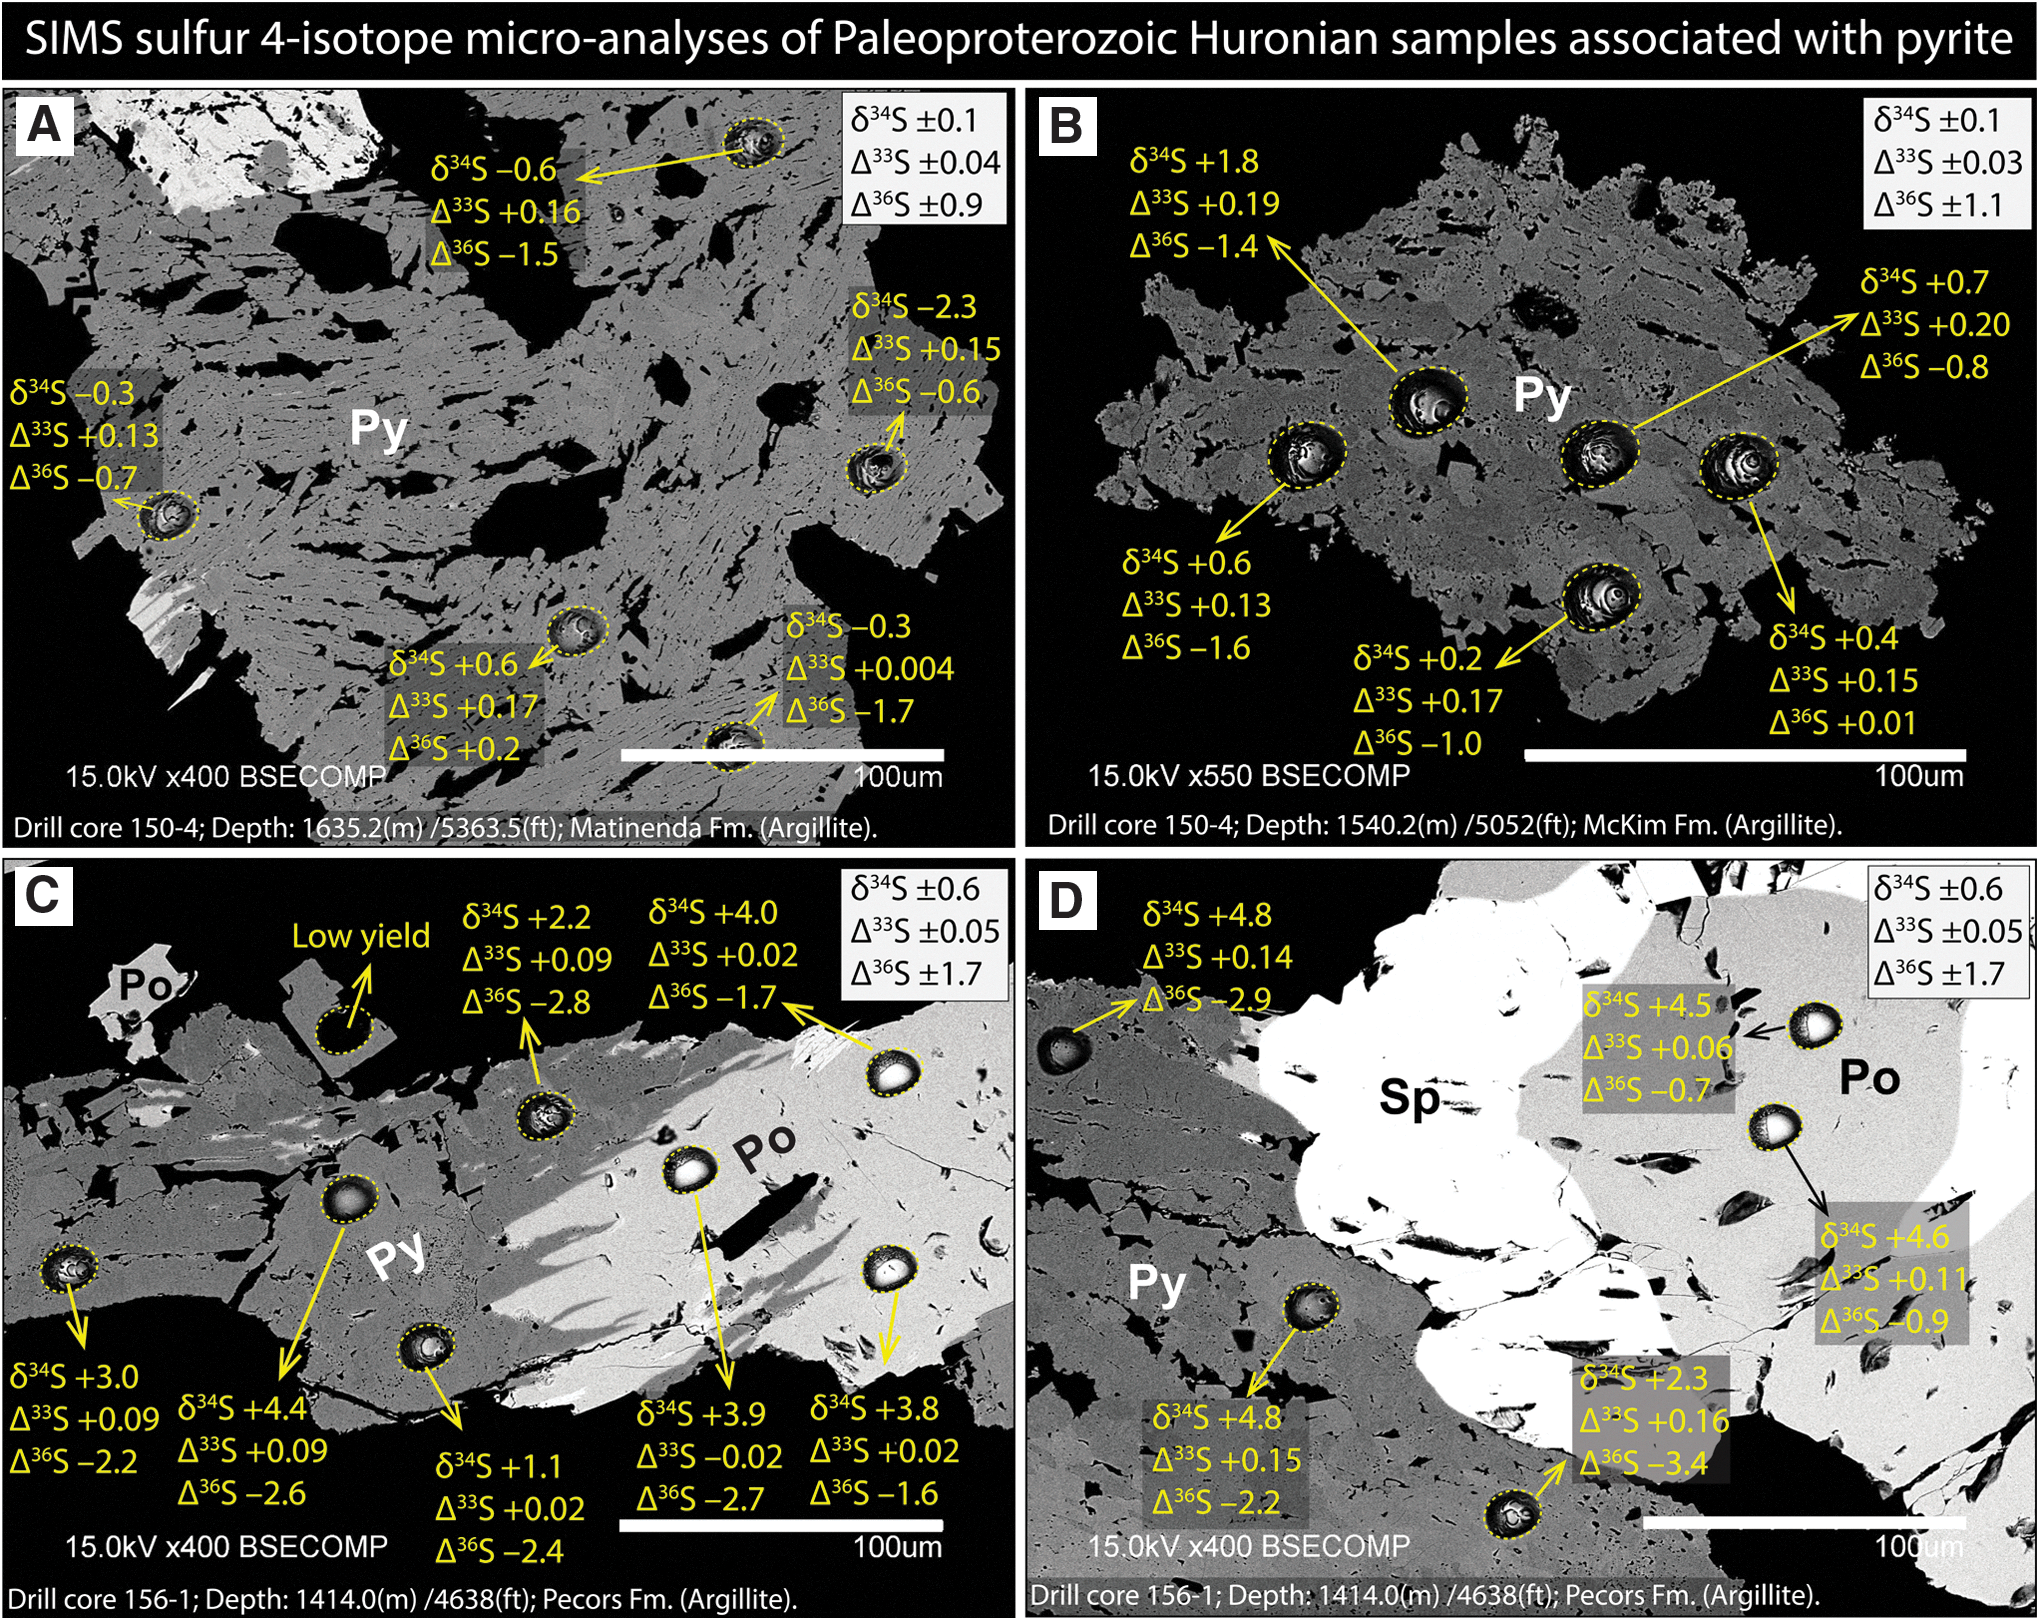
Back-scattered electron (BSE) images with SIMS sulfur isotope data of representative pyrite from the Kerr–McGee drill cores 150–4 and 156–1 of the Huronian Supergroup. Silicate matrix is black. Abbreviations: Po = pyrrhotite; Py = pyrite; Sp = sphalerite. The upper right of each figure shows precisions of δ34S, Δ33S, and Δ36S with two standard deviations. All data can be found in the online supplementary material.
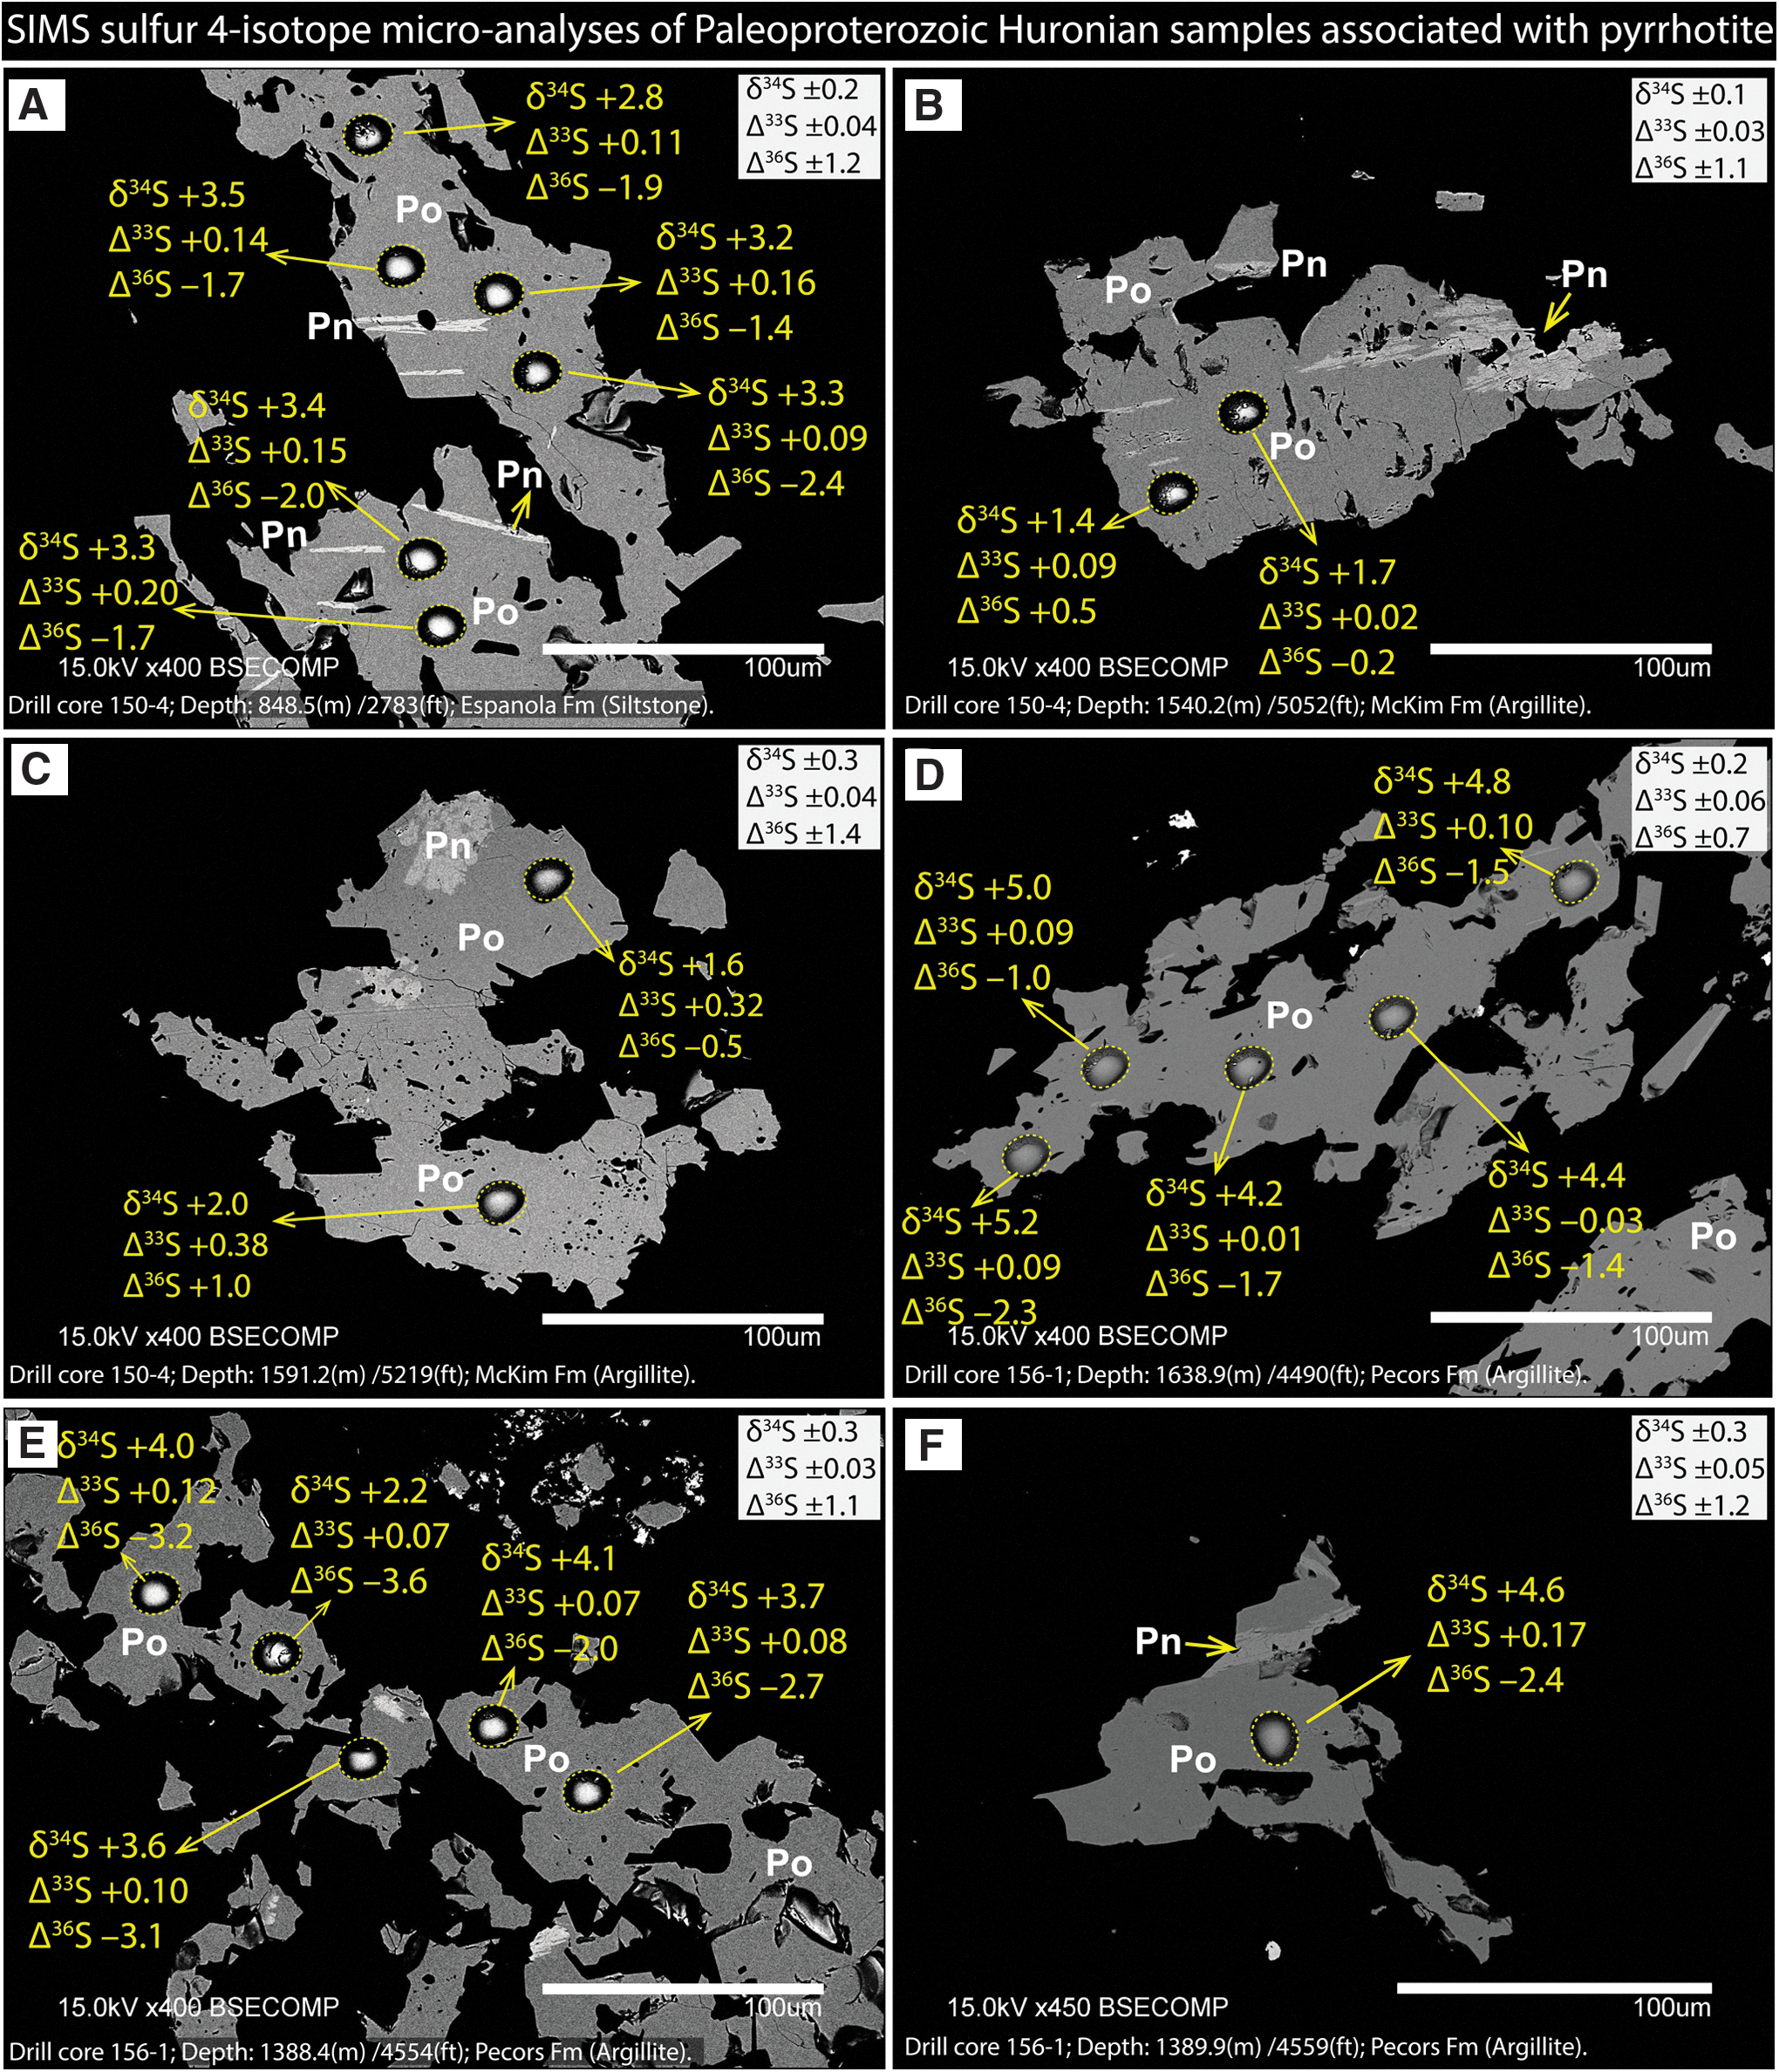
Back-scattered electron (BSE) images with SIMS sulfur isotope data of representative pyrrhotite from the Kerr–McGee drill cores 150–4 and 156–1 of the Huronian Supergroup. Silicate matrix is black. Abbreviations: Pn = pentlandite; Po = pyrrhotite. The upper right of each figure shows precisions of δ34S, Δ33S, and Δ36S with two standard deviations. All data can be found in the online supplementary material.

Back-scattered electron (BSE) and secondary electron (SE, in B) images with SIMS data of representative chalcopyrite from the Kerr–McGee drill cores 150–4 and 156–1 of the Huronian Supergroup. Silicate matrix is black. Abbreviations: Ccp = chalcopyrite; Pn = pentlandite; Po = pyrrhotite. The upper right of each figure shows precisions of δ34S, Δ33S, and Δ36S with two standard deviations. All data can be found in the online supplementary material.

Back-scattered electron (BSE) images of representative cobaltite. S isotope data are not provided for the cobaltite due to the lack of SIMS standards. Silicate matrix is black. Abbreviations: Cob = cobaltite; Pn = pentlandite; Po = pyrrhotite. The upper right of each figure shows precisions of δ34S, Δ33S, and Δ36S with two standard deviations. All data can be found in the online supplementary material.
Compared with other roughly time-equivalent strata that have been studied for S three- or four-isotopes (Guo et al., 2009; Williford et al., 2011; Luo et al., 2016), a distinct feature of the Huronian samples is the dominance of pyrrhotite as the main sulfide mineral. Both granular and elongated grains of pyrrhotite and subordinate pyrite were imaged and analyzed for multiple S isotopes. Elongate grains are typically aligned parallel to foliation and intergrown with chlorite (Fig. 3). Most of the pyrrhotite grains have fine pentlandite intergrowths or exsolution (Fig. 6). Cobaltite is also seen in a few samples; grains are mostly euhedral and cutting across the pyrrhotite (Fig. 8), suggesting a relatively late-stage mineralization.
4.2. SIMS S four-isotope results
Chemostratigraphic profiles of the Huronian Supergroup in Fig. 9 present all the new data measured by SIMS in this study. The δ34S profiles of both drill cores show mostly positive values from 0‰ to +5‰, except for a few slightly negative values in the McKim Formation of drill core 150–4 (Fig. 9A), and notably positive δ34S data of ca. +15‰ in chalcopyrite of the Espanola Formation of the drill core 156–1 (Fig. 9D). In drill core 150–4, Δ33S values of this study range from +0.004‰ to +0.38‰ (Fig. 9B), while in drill core 156–1, the Δ33S data range from −0.07‰ to +0.26‰ (Fig. 9E) (average 2SD = ±0.04‰ for an individual analysis). Compared with the earlier study (Papineau et al., 2007), we also simultaneously analyzed Δ36S. New Δ36S values analyzed from the same Huronian samples range from −4.1‰ to +1.0‰ in drill core 150–4 (Fig. 9C) and from −3.6‰ to +0.5‰ in drill core 156–1 (Fig. 9F) (average 2SD = ±1.13‰ for an individual analysis).
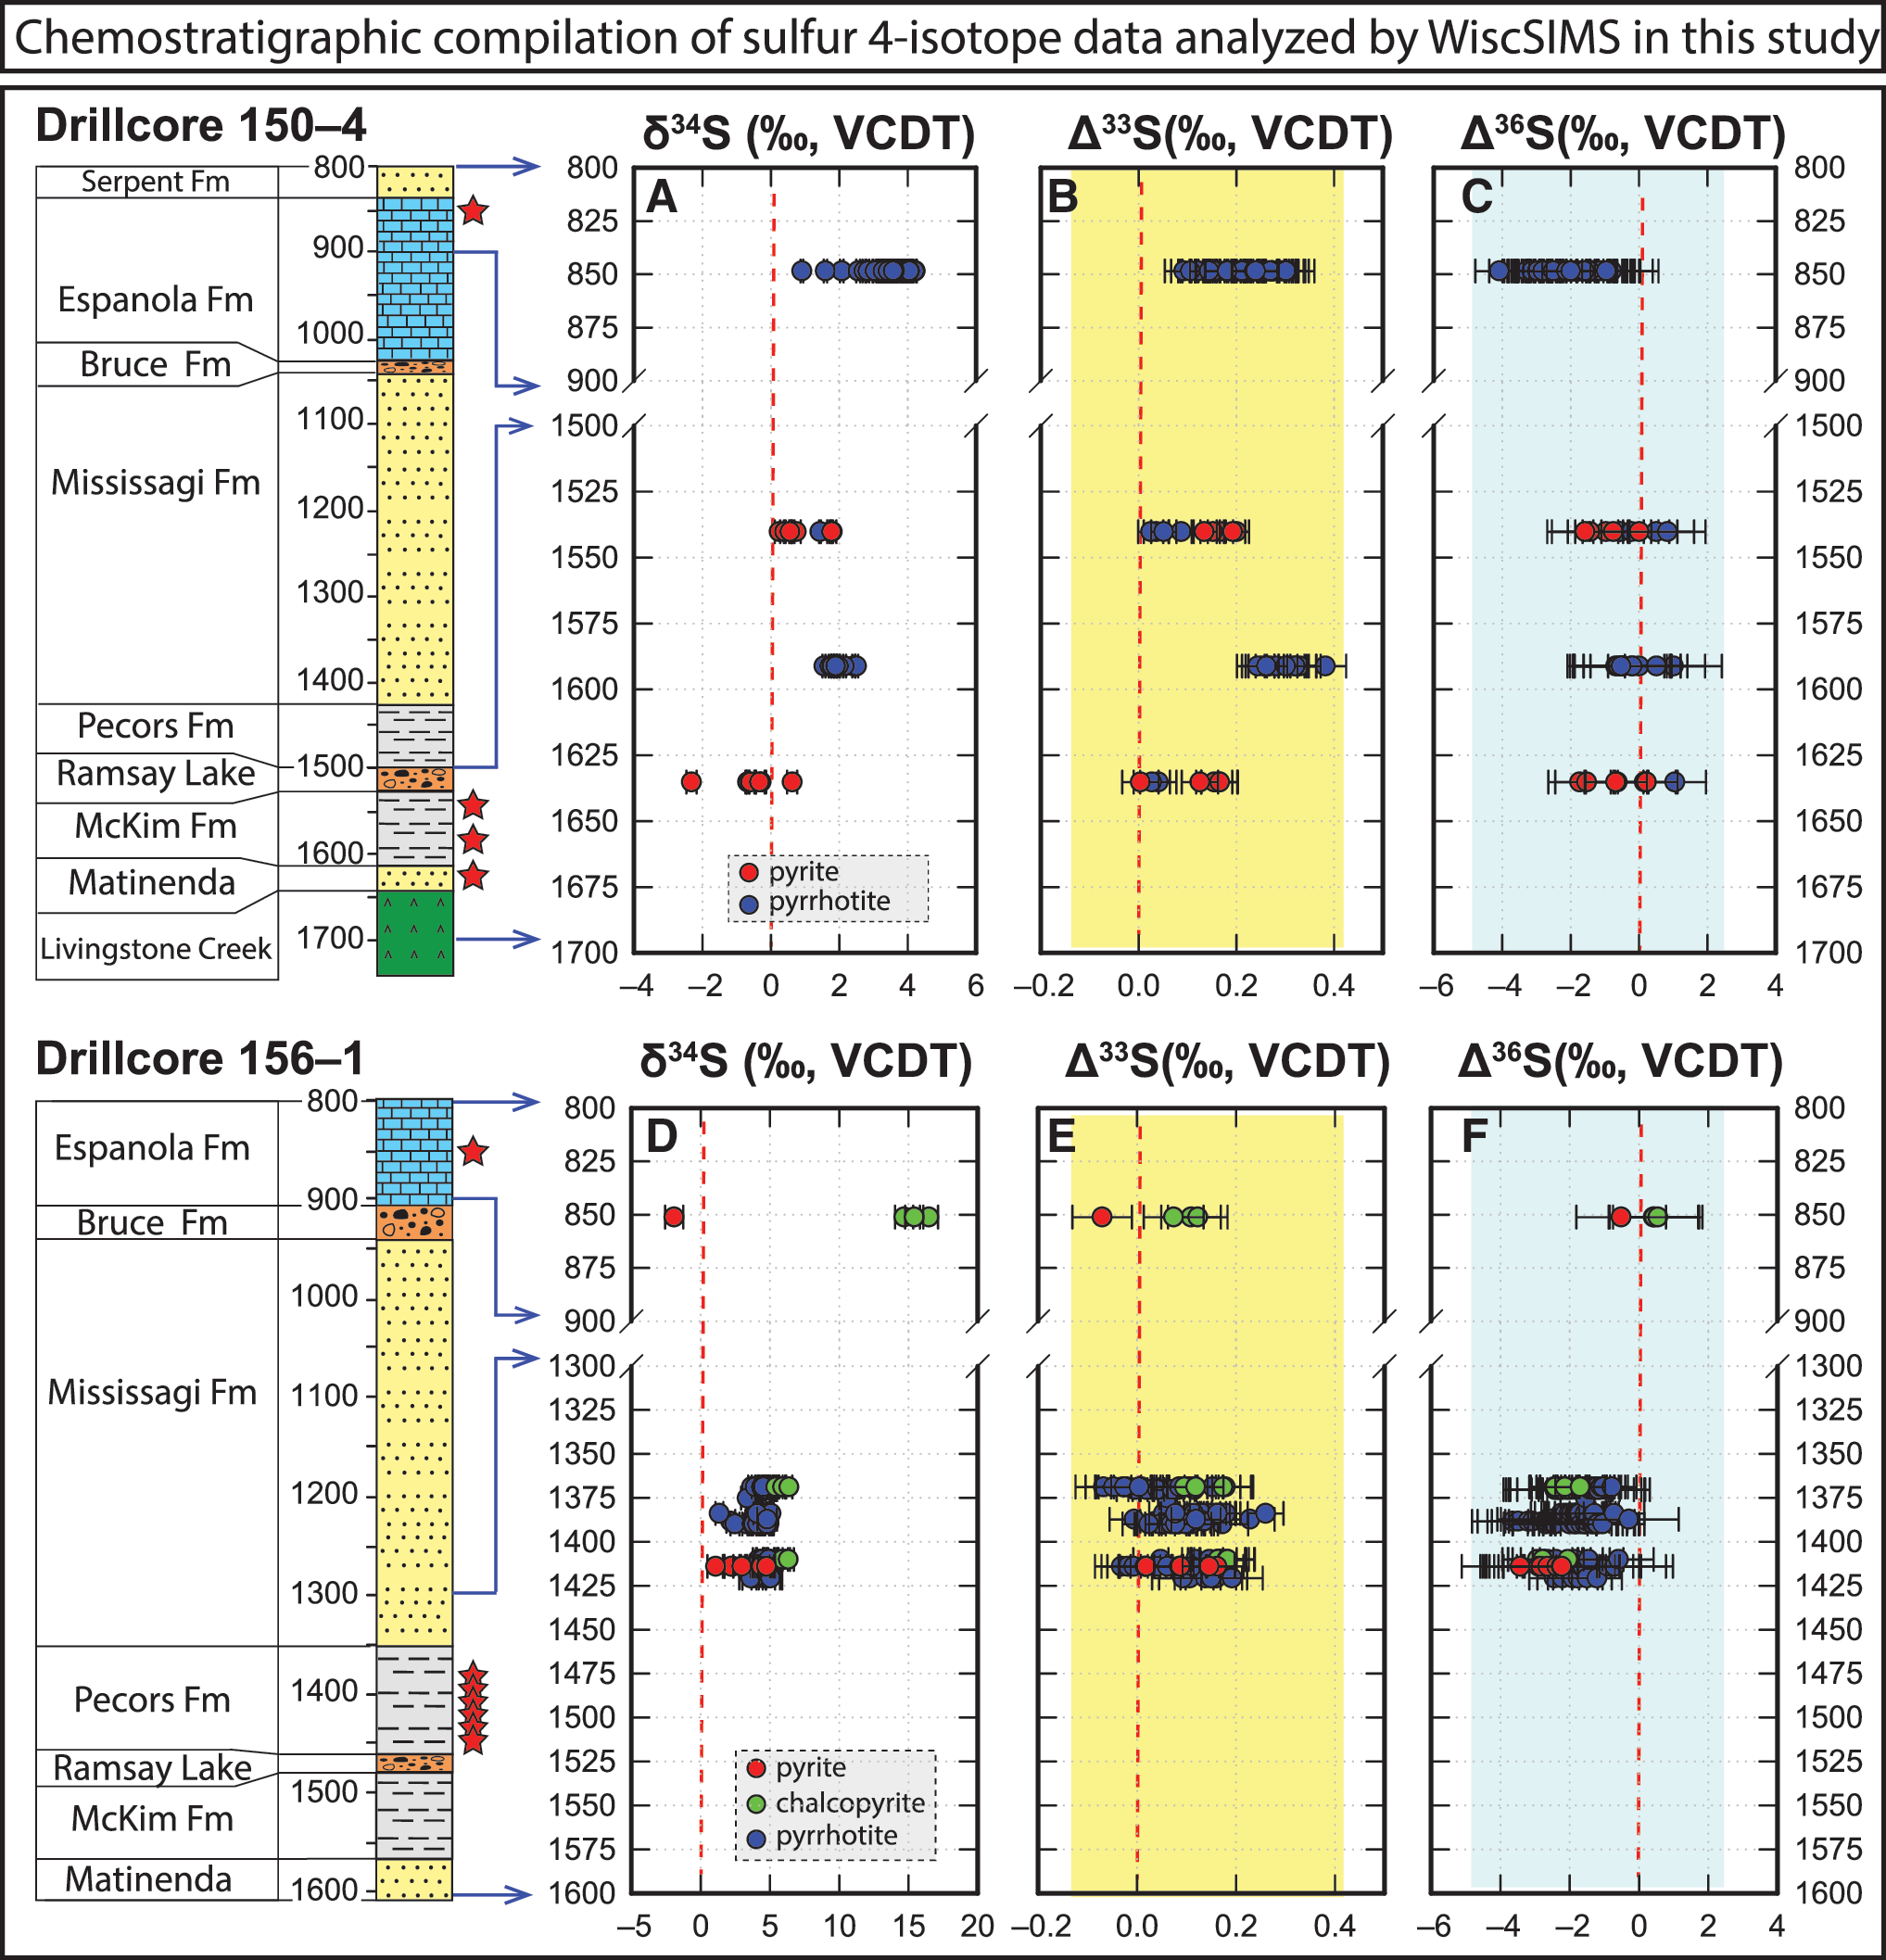
Compiled multiple S isotope chemostratigraphy of the two studied drill cores in the Huronian Supergroup. All the sulfur four-isotope data were measured at WiscSIMS with improved methods (Ushikubo et al., 2014) from this study. The highlighted color bands are the range for Δ33S and Δ36S. Analytical uncertainty is the measured 2SD reproducibility on the UWPy-1 pyrite standard. Red stars alongside the lithology column mark the stratigraphic position of analyzed samples in this study.
Cross-plots of δ34S versus Δ33S and Δ33S versus Δ36S are tightly clustered and do not show clear correlations or Δ36S versus Δ33S slopes (Fig. 10). Values of δ34S from pyrrhotite and chalcopyrite are generally higher than pyrite in both drill cores 150–4 and 156–1. These δ34S fractionations are reversed and do not represent equilibration during deposition or metamorphism (Ohmoto and Rye, 1979; Ohmoto, 1986; Seal, 2006). Chalcopyrite grains reveal the most positive δ34S values among all sulfides.
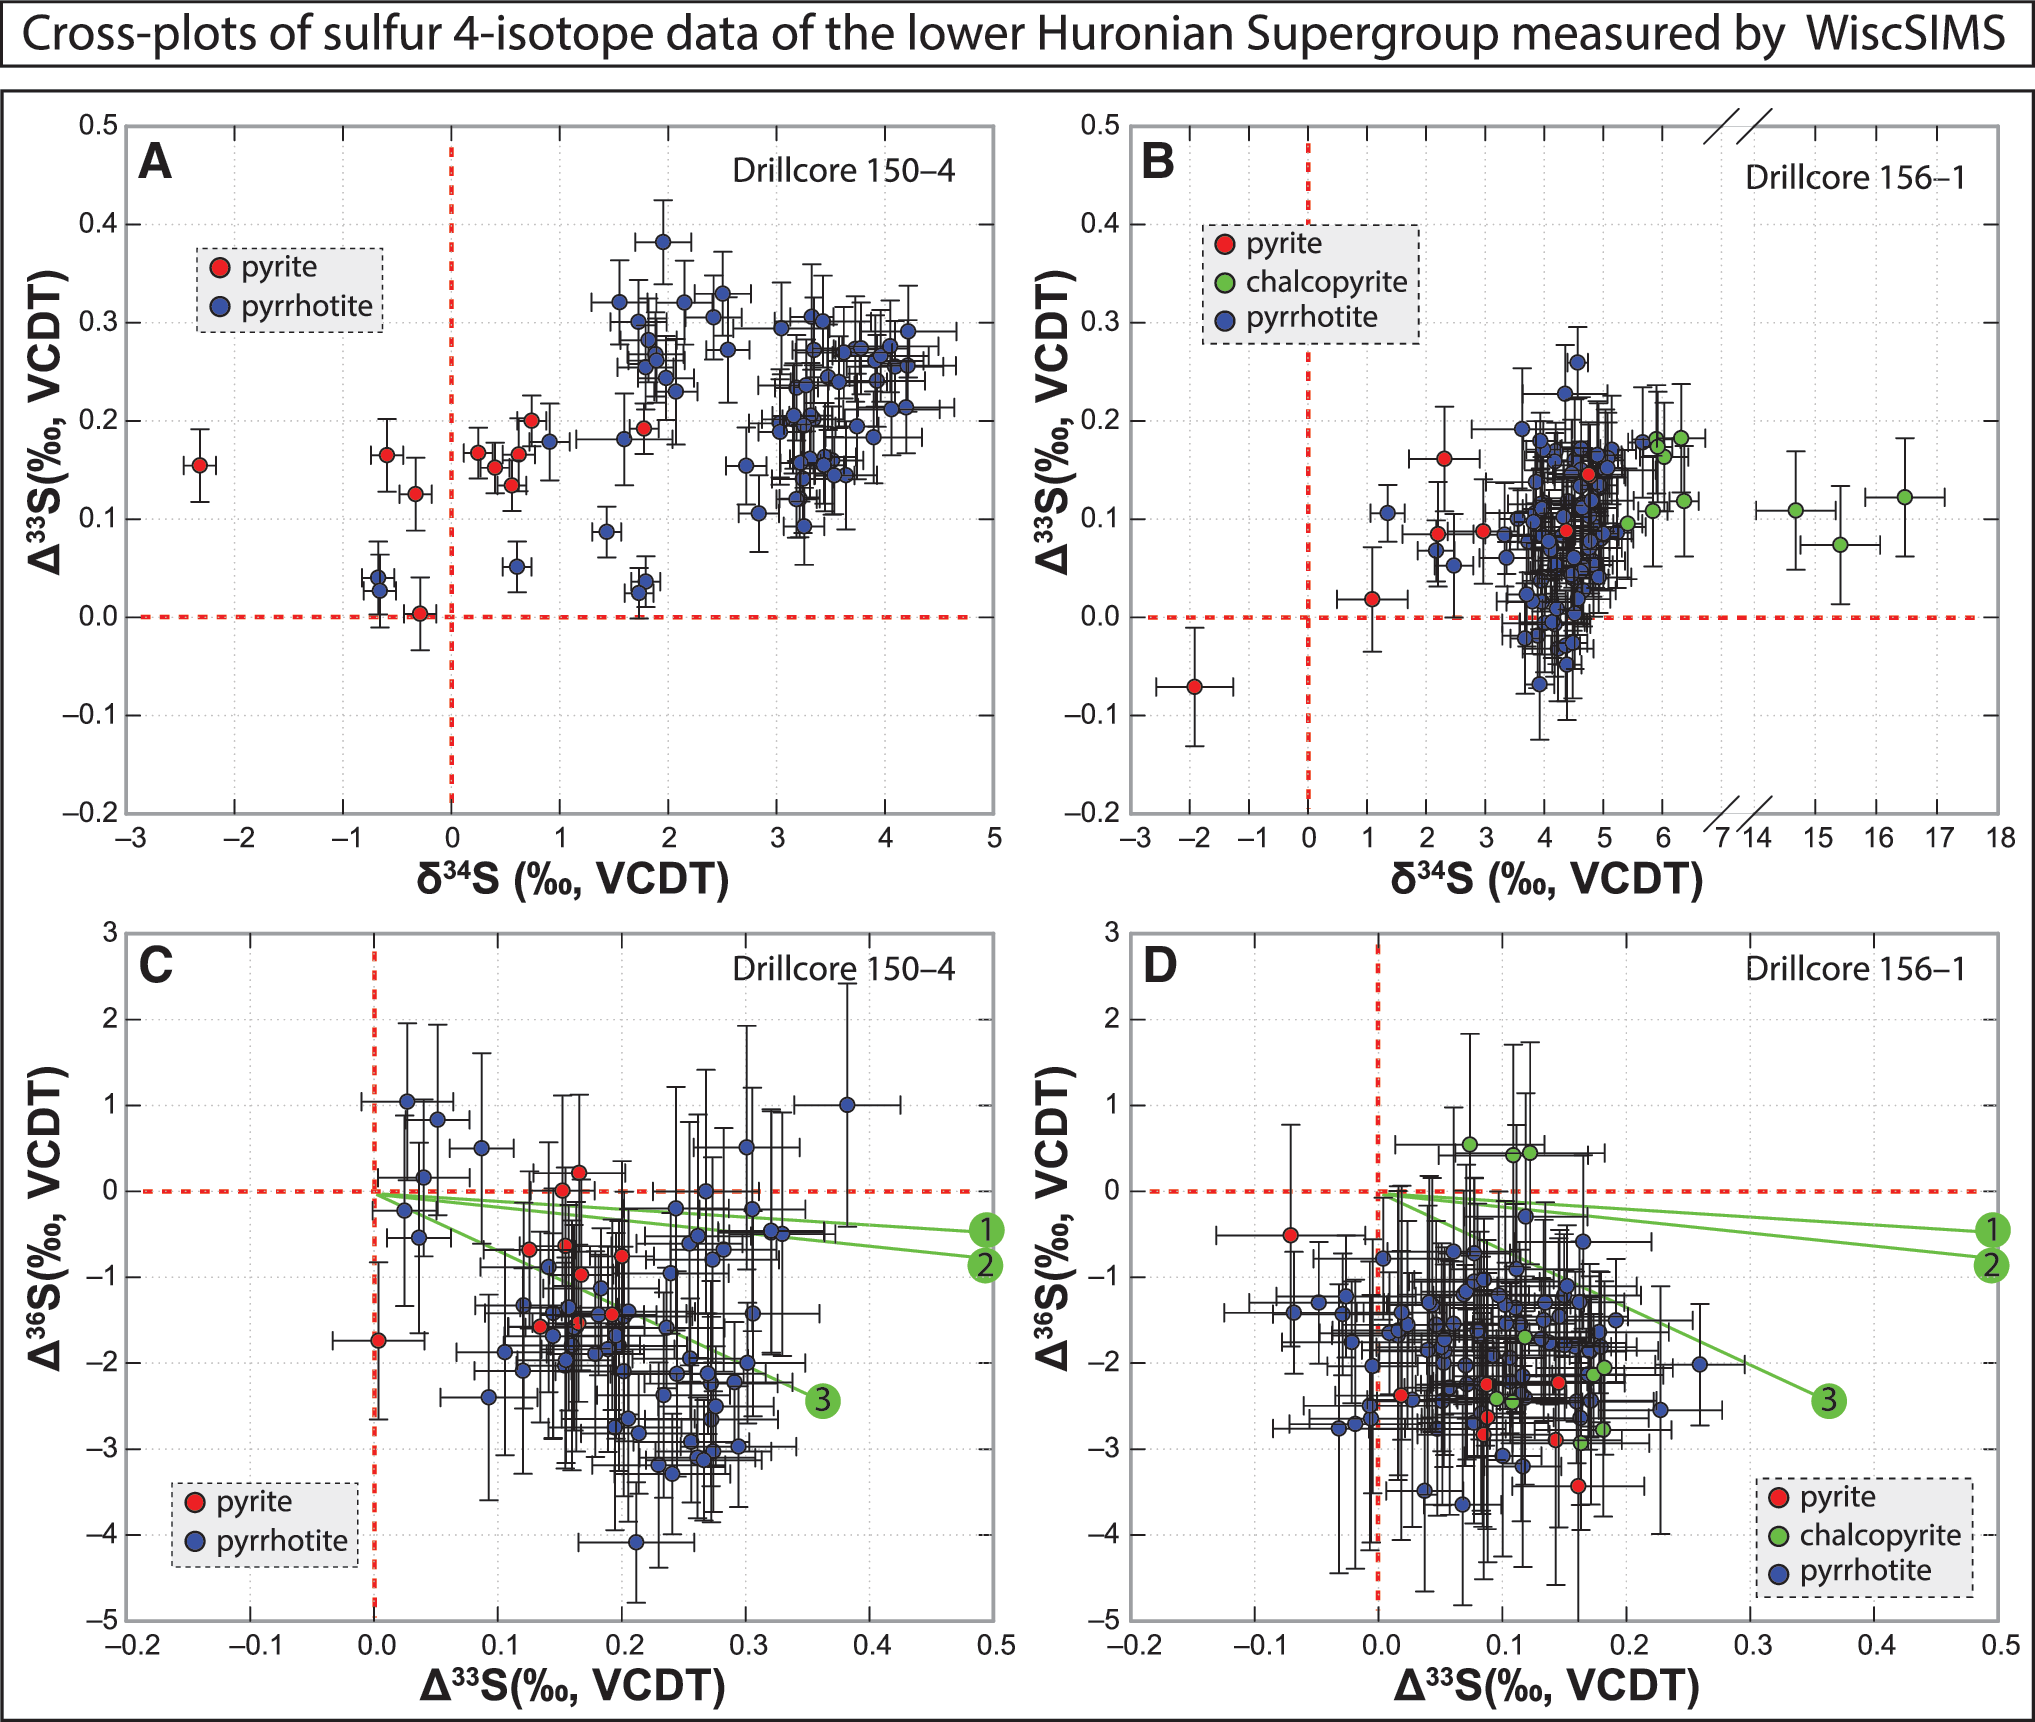
Cross-plots of δ34S versus Δ33S and Δ33S versus Δ36S for SIMS analysis of sulfides in drill cores 150–4 and 156–1 of the Huronian Supergroup. The green lines 1, 2, 3 in panels C and D represent the Neoarchean–Paleoproterozoic slope (Δ36S/Δ33S = ca. −0.9), the Mesoarchean slope (Δ36S/Δ33S = ca. −1.5), and the theoretical MDF slope (Δ36S/Δ33S = ca. −6.85), respectively (Farquhar et al., 2000; Ono et al., 2006).
To assess the published and new Δ33S data sets, a close evaluation of the point-to-point precision is necessary. It should be noted that the published uncertainties for the Δ33S data by Papineau et al. (2005) are an integration of both internal error and external error calculated using a York-based regression technique (Papineau et al., 2005, 2007), while the reported 2SD of SIMS data in our study is the measured reproducibility of the bracketing UWPy-1 standard that were measured throughout our analysis sessions (n = 157) (Supplement S4). Thus a direct comparison of the published precisions of these two data sets may be misleading. Therefore, we have made a direct comparison of the reproducibility of analyzed sulfur isotope data for homogeneous standard material (Balmat pyrite, UWPy-1) in both data sets. The 2SD values calculated from repeated analyses of the UWPy-1 standard (n = 157) in this study are ±0.39‰ (δ34S), ±0.04‰ (Δ33S), and ±1.13‰ (Δ36S). The 2SD values of δ34S and Δ33S data are systematically 2–3 times smaller than the ones calculated from a Balmat pyrite standard (not UWPy-1, n = 11) in the work of Papineau et al. (2005) that show precisions of ±0.69‰ (δ34S), ±0.14‰ (Δ33S).
5. Discussion
5.1. Origin of the pyrrhotite in the Huronian
A distinct feature of the studied intervals in the Huronian Supergroup is the dominance of pyrrhotite among all sulfide minerals. This is in strong contrast with other roughly equivalent Paleoproterozoic successions with pyrite as the dominant sulfide mineral (e.g., Guo et al., 2009; Williford et al., 2011; Luo et al., 2016). Therefore, interpretation of S isotope profiles of the Huronian Supergroup requires understanding on the genesis of the Huronian pyrrhotite.
Pyrrhotite has been reported from both ancient strata (Reynolds et al., 1990; Reuschel et al., 2012; Asael et al., 2013; Minguez et al., 2016) and modern marine sediments (Horng and Roberts, 2006; Larrasoaña et al., 2007; Kars and Kodama, 2015; Honsho et al., 2016). However, pyrrhotite is rare in modern marine sediments and is often detrital in origin resulting from rapid weathering and short distances of transport (Horng and Roberts, 2006). In other cases, pyrrhotite has been found associated with gas hydrates (Kars and Kodama, 2015) or hydrocarbon seepage (Reynolds et al., 1990). Pyrrhotite has also been reported in ancient sedimentary records such as the ca. 2.0 Ga Pilgujärvi Sedimentary Formation in northwest Russia (Reuschel et al., 2012) and ca. 2.0 Ga Zaonega Formation in Karelia (Asael et al., 2013), which have both been interpreted to result from the decomposition of pyrite during low-grade metamorphism.
Previously, pyrrhotite in the Huronian was interpreted as early authigenic (Papineau et al., 2007). Based on this interpretation, the measured S isotope values from these pyrrhotites have been used to infer secular variation in atmospheric oxygen and marine sulfur cycle (Papineau et al., 2007) and global correlations of the GOE-bearing sections (Hoffman, 2013; Gumsley et al., 2017).
However, in this study, multiple lines of evidence suggest that pyrrhotite in the studied samples actually formed during regional metamorphism. The evidence includes
(1) Irregular/anhedral shape and large grain size. Most of the pyrrhotite grains show irregular/anhedral shapes, remarkably large (up to several hundred micrometers) in size (Figs. 3 –8; Supplements S2 and S3), which look unlikely to be formed in a water column or shallow marine sediment.
(2) Diverse mineral assemblages. We found that many pyrrhotite grains are parallel with metamorphic foliation and intimately associated with chlorite, pentlandite, and chalcopyrite (Figs. 3 and 4; Supplements S2 and S3), which suggest metamorphism.
(3) Homogeneous compositions. All the studied pyrrhotites have remarkably homogeneous compositions of sulfur isotope ratios and elemental abundances at micrometer scales (Figs. 5 –9; Supplements S2 and S3), which is in contrast with early marine sulfides that typically show strong heterogeneity in composition due to a biogenic nature of microbial sulfate reduction (Kohn et al., 1998; McLoughlin et al., 2012; Wacey et al., 2015; Simpson et al., 2017) and Rayleigh distillation in restricted pore-water environments (e.g., Ferrini et al., 2010; Williford et al., 2011; Fischer et al., 2014; Zhelezinskaia et al., 2014; Lin et al., 2016; Magnall et al., 2016). The above observations suggest that the Huronian pyrrhotites formed post-deposition, likely during low-grade regional metamorphism.
5.2. Reevaluating the “MIF–MDF transition” in the Huronian
The sedimentological transition in the Huronian reveals the existence of detrital pyrite and uraninite in the lower Huronian and of red beds in the upper Huronian, which has been widely accepted to bracket the rise in atmospheric oxygen (Roscoe, 1969, 1973). If correct, one would expect to see a corresponding MIF–MDF transition in both Δ33S and Δ36S profiles of the Huronian Supergroup. The MIF–MDF transition has been proposed based on small MIF(Δ33S) signals that were interpreted to exist in strata below the Bruce diamictite versus MDF(Δ33S) signals in the Espanola carbonates above the Bruce diamictite (Papineau et al., 2007) (Fig. 11D, 11H).
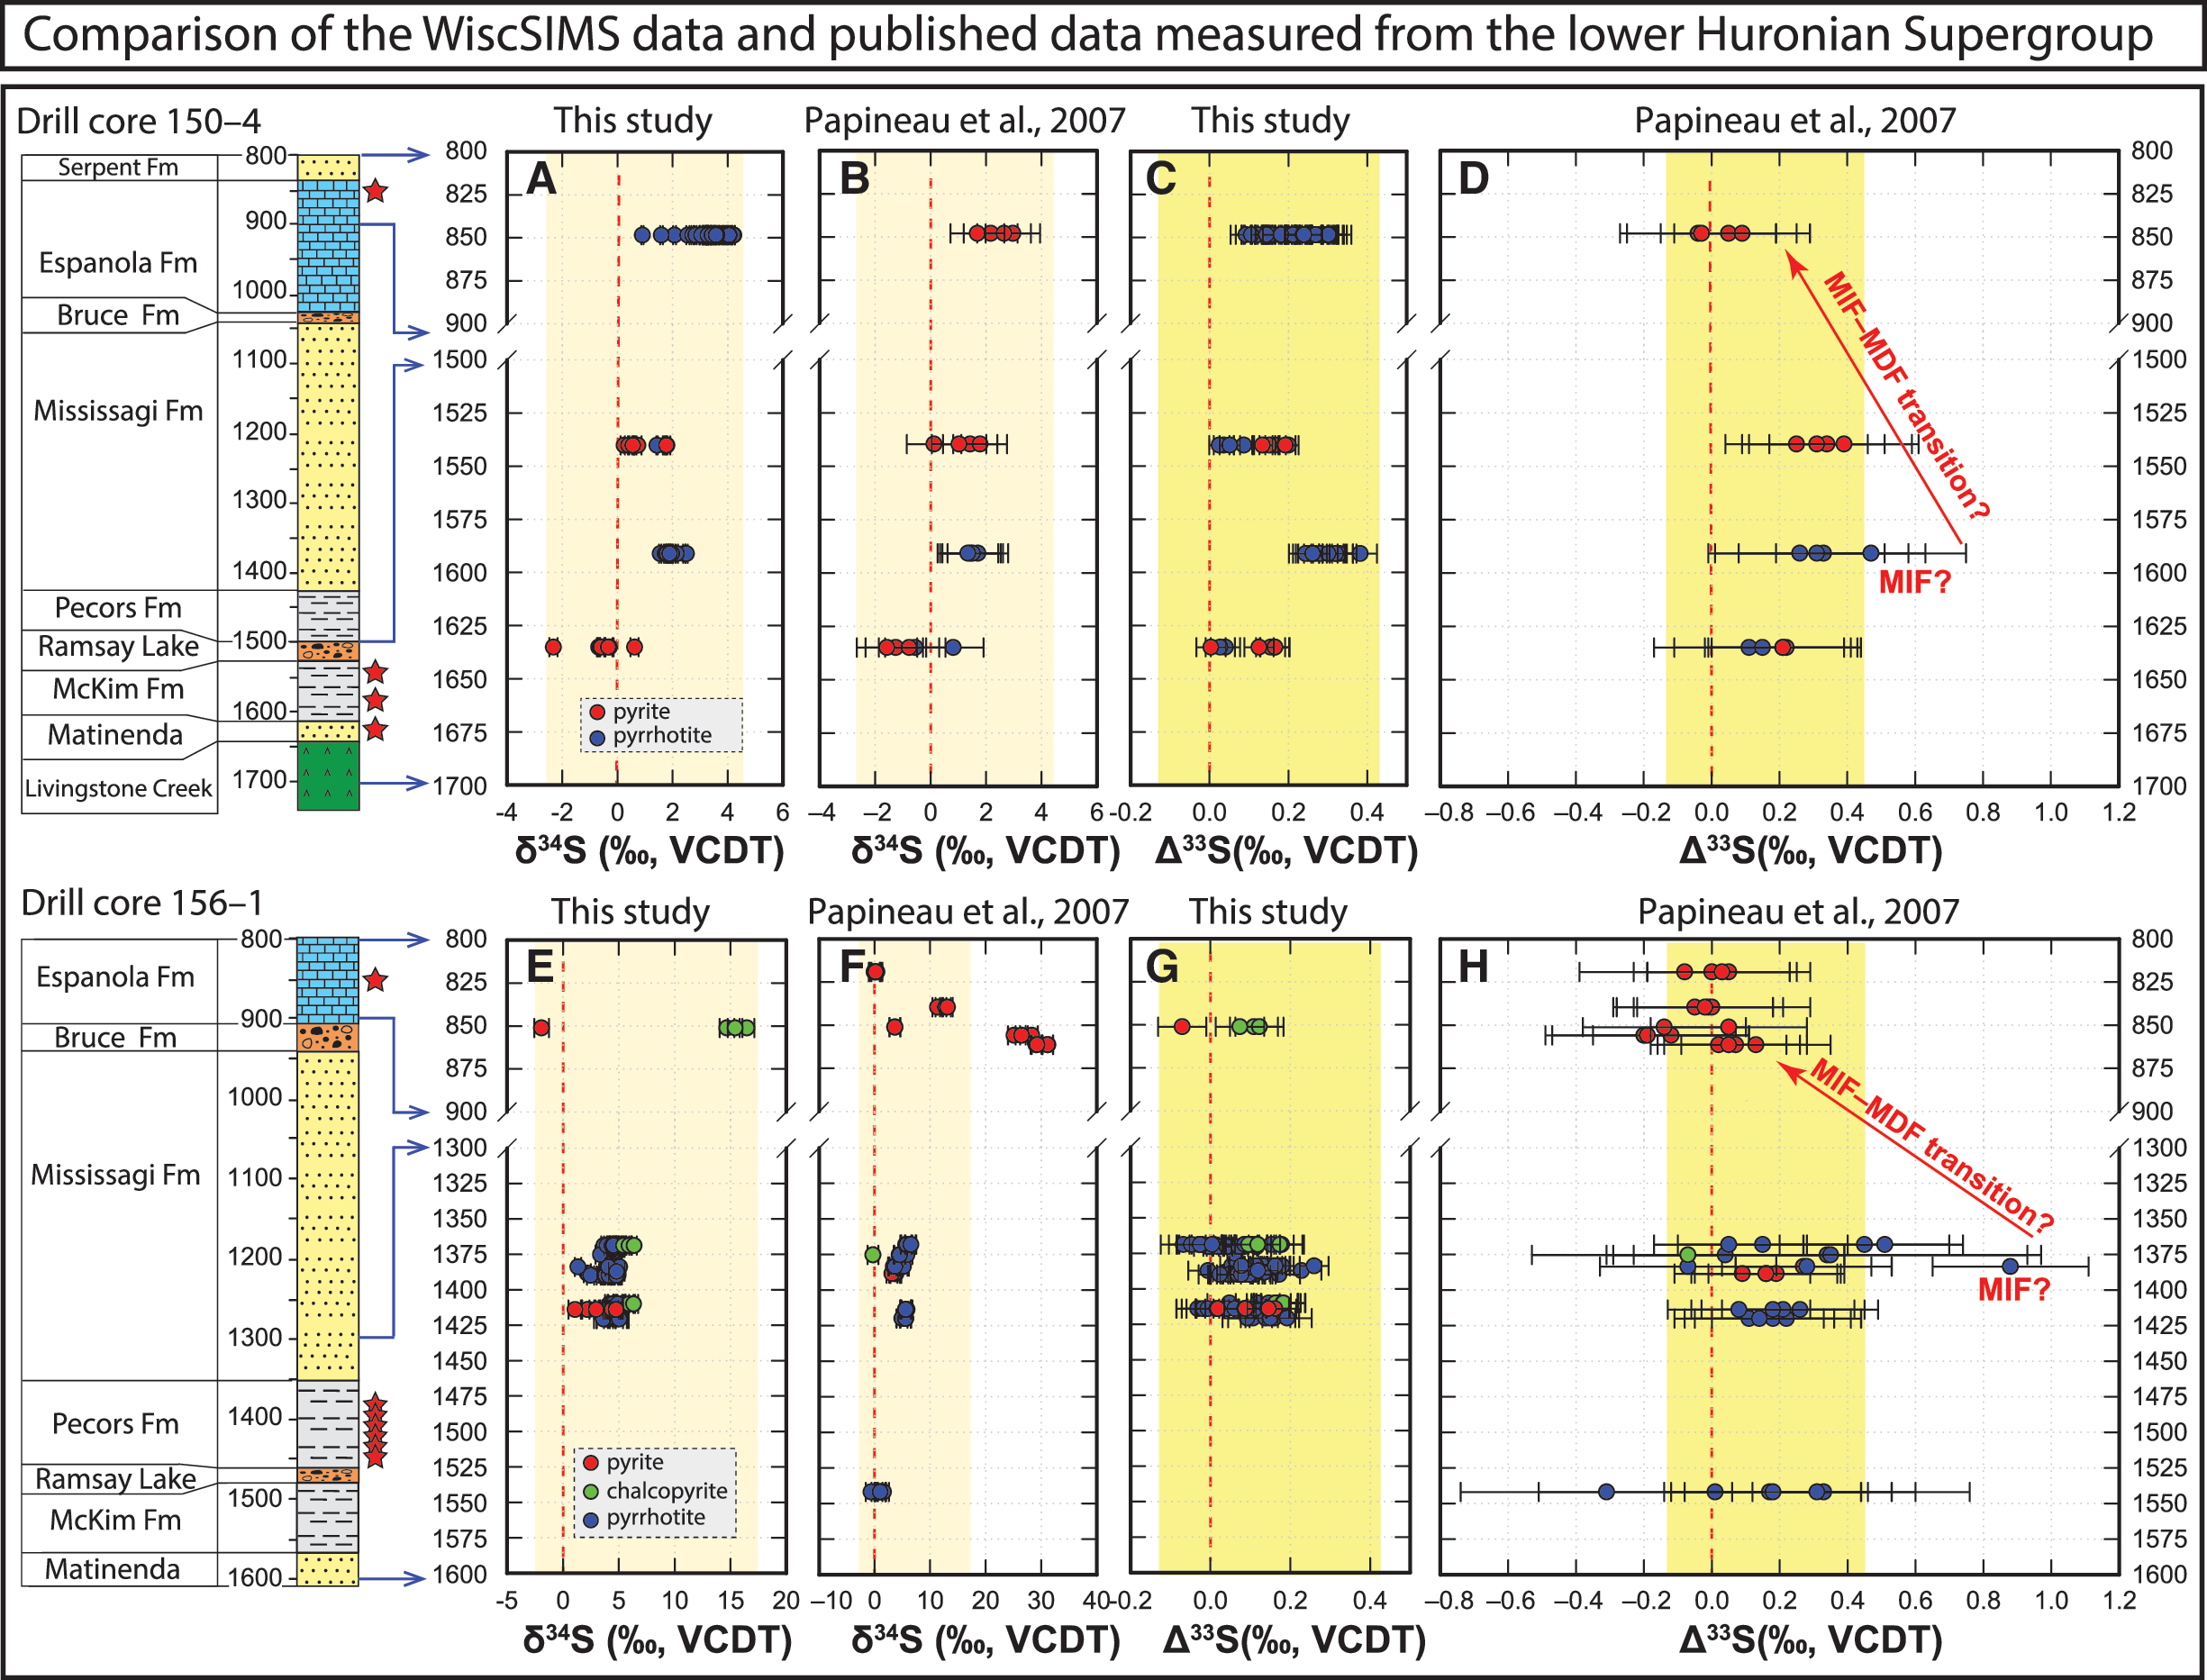
A comparison between the data published in an early study (Papineau et al., 2007) and the new data set analyzed by WiscSIMS in this study. Highlighted color bands mark the data ranges of the lower Huronian Supergroup from this study. See the main text for detailed discussion.
However, the new Δ33S data with improved precision suggest a different view. Our Δ33S data all fall within a very narrow range. Small nonzero Δ33S values persist throughout the lower Huronian including the Espanola. Neither pronounced MIF-S signals nor a MIF–MDF transition are seen in this study (Fig. 11C, 11G).
The newly analyzed Δ36S data further show nonzero signals in the lower Huronian. In contrast with the proposed “MDF-S” interval for the Espanola Formation that is based on Δ33S data (Papineau et al., 2007), the Δ36S data analyzed from the same Huronian samples range from −4.1‰ to +1.0‰ in drill core 150–4 (Fig. 9C) and from −3.6‰ to +0.5‰ in drill core 156–1 (Fig. 9F), which show that nonzero Δ36S signals also persist throughout the lower Huronian, including the Espanola.
In summary, although the entire studied interval in the lower Huronian shows a narrow range, the nonzero Δ33S and Δ36S signals are still distinguishable. These small but analytically resolvable nonzero signals exist before and after both glaciations of the lower Huronian Supergroup and therefore cannot be used to locate the GOE.
5.3. Origin of the small nonzero Δ33S and Δ36S signals in the Huronian
Multiple hypotheses may be able to explain the measured S isotope values in the Huronian pyrrhotites. Below, we explore these possibilities.
5.3.1. Homogenization of MIF signals by regional metamorphism
It is likely that the pyrrhotite in the studied drill cores formed by reaction of sedimentary pyrite during low-grade metamorphism. Theoretically, two general processes can lead to the transformation from pyrite (FeS2) to pyrrhotite (Fe0.8–1S): (1) gaining iron via reactions with Fe oxide or Fe-bearing silicates or (2) losing sulfur via metamorphic breakdown of pyrite into hydrogen sulfide or sulfur dioxide (Reuschel et al., 2012; Asael et al., 2013).
In the first scenario, although very few Fe oxide minerals are found surrounding the sulfide minerals (Fig. 4B, 4C) and are probably late alteration in origin, it is unlikely that iron oxide is a sufficient source of iron given the rarity of Fe oxide minerals in the studied interval (below the red beds in the Lorrain Formation). However, chlorite exists in close association with pyrrhotite (Fig. 3) and may have been a source of iron during pyrite–pyrrhotite transformation.
In the second scenario, metamorphic desulfidation reactions of pyrite can evolve either SO2 (via reaction FeS2 + O2 = FeS + SO2) or H2S (via the reaction FeS2 + H2 = FeS + H2S), depending on the redox conditions of metamorphism. If the former occurred, the δ34S value of pyrrhotite would decrease compared with preexisting pyrite due to liberation of high-δ34S SO2. If the latter occurred, the δ34S value of pyrrhotite would increase compared with preexisting pyrite due to liberation of low-δ34S H2S (Ohmoto, 1986). However, if no external source of MIF-bearing sulfur was involved in the formation of the Huronian sulfides, these mass-dependent processes would neither create new MIF-S signatures nor destroy the original bulk MIF-S signatures. The dominant effect of regional metamorphism on Δ33S or Δ36S would be to homogenize and mute the variability of any preexisting MIF signals.
Although the Huronian sulfides may have experienced postdepositional desulfidation reactions and homogenization in chemical composition, we regard that the measured Δ33S values may not deviate far from the average (whole rock) primary values. Given the rarity of very negative Δ33S values in pyrite at that time, to achieve a homogenized Δ33S near 0 value, it is unlikely that the Δ33S values of the primary Huronian sulfides can be significantly positive before homogenization by regional metamorphism. Supporting evidence for this view also comes from published bulk rock data of the McKim and Pecors formations (Wing et al., 2002, 2004). The bulk Δ33S values of these two formations ranges from +0.22‰ to 0‰, which show similarly small and nonzero values compared with the SIMS data in this study.
5.3.2. Recycling of older MIF signals
It is also possible that fluids with preexisting MIF-S signals that are derived from recycled detrital pyrite may have overprinted the studied Huronian samples, resulting in the overall small MIF-S signals in the measured sections. A similar scenario has been used to explain the existence of small MIF-S signals during or shortly after the GOE when they were still not yet eliminated by chemical weathering and sediment dilution (Reinhard et al., 2013).
In this study, although only samples that were deposited in marine facies were investigated in an effort to avoid detrital pyrite (see Section 3.1), the clearest evidence—rounded detrital grains—would be destroyed by metamorphic recrystallization. It is thus possible that MIF-S signals from older sediments may have been remobilized. It is also possible that MIF signals can be mobilized by fluids from these detrital grains or from older rocks. For example, an independent study of S three-isotopes of detrital pyrite and pyrite overgrowths in the fluvial-deltaic Mississagi Formation of the Huronian Supergroup shows Δ33S values ranging from ca. −2‰ to ca. +1‰ (Ulrich et al., 2011). These detrital pyrites can be a potential source of the measured MIF-S signals in this study. More studies are suggested to further evaluate the contribution of recycled MIF-S signals from late fluids in this region.
5.3.3. Dilution of MIF signals by magmatic fluids
Hypothetically, the overall small Δ33S or Δ36S signals can also result from the dilution of MIF signals by a magmatic reservoir with MDF signals. This process has been used to explain the general near-zero Δ33S values in the Archean gold deposits in Western Australia (Xue et al., 2013). Notably, the Huronian Supergroup was intruded by multiple dikes (Fig. 1), including the Nipissing diabase at ca. 2.22 Ga (Fig. 2) (Corfu and Andrews, 1986; Mossman et al., 1993), which may have indeed caused a significant dilution of the primary MIF-S signals. If true, potentially primary large MIF-S signals of the Huronian Supergroup may have been significantly erased by a large volume of MDF-bearing magmatic fluids.
Based on a mass balance perspective, if the primary MIF signal in the Huronian is pronounced, the MDF-bearing magmatic fluids should be very large in volume in order to achieve near-zero values. However, in light of the overall small Δ33S or Δ36S values analyzed from the remaining pyrite grains, the magmatic fluids that are needed to achieve overall near-zero values can be relatively small in volume. More studies are suggested to further evaluate the overall influence of late magmatic fluids in this region.
5.3.4. Small Δ33S or Δ36S signals produced by MDF
The small Δ33S or Δ36S signals in the Huronian can also be explained by the occurrence of MDF. Lab experiments of post-Archean samples show small magnitude of Δ33S (from 0‰ to ca. 0.4‰) or Δ36S (from −2.5‰ to 0‰) signals in sedimentary sulfides, which have been explained by the occurrence of MDF (Ono et al., 2006).
It was revealed that these small MDF-produced Δ33S and Δ36S signals have a distinctive Δ36S/Δ33S slope of −6.85, which can be used as a tool to distinguish the origin of small Δ36S and Δ33S signals (Ono et al., 2006). However, due to the small range of values and larger uncertainty of data generated by SIMS compared with the conventional gas source mass spectrometer, it is not feasible to extract a reliable Δ36S/Δ33S slope based on the current SIMS data set (Fig. 10). Therefore, conventional analysis of larger samples by gas source mass spectrometry may yield better precision and reveal subtle correlation even though the range of values is so small.
In summary, we propose a metamorphic origin for the Huronian pyrrhotite based on detailed investigation of petrography and mineral assemblages. Metamorphism tends to homogenize and mute variability but not create or destroy the MIF-S signals. Recycled older MIF signals, dilution by magmatic fluids, or the occurrence of MDF may have also contributed to the generation of the overall small MIF signals in the studied samples. Therefore, in contrast to the previous study on the same successions (Papineau et al., 2007), we argue that the precise location of the MIF–MDF transition in the Huronian remains unsolved. This putative MIF–MDF transition may have already been erased by postdepositional processes in the lower Huronian supergroup or may be located in the upper Huronian Supergroup.
5.4. Implications on the GOE
5.4.1. An evolving concept of the GOE
Although the existence of the GOE is indicated by sedimentological observations, the placement of the GOE in the Huronian stratigraphy is still ambiguous. Before discussing the GOE in the Huronian, it should be noted that the criteria to identify the GOE may vary among different authors.
Largely based on sedimentological observations, the GOE has been interpreted as a long time interval between ∼2.4 and ∼2.0 Ga, which is characterized by a gradual transition from reducing atmosphere to weakly oxygenated redox conditions in atmosphere and shallow oceans (Holland, 2002, 2006; Bekker, 2014; Gumsley et al., 2017). The discovery of the intimate response of time-series S four-isotopes (i.e., MIF–MDF transition) to the rise of atmospheric oxygen makes it possible to pinpoint the timing of this putative event to be ca. 2.45 Ga (Farquhar et al., 2000; Farquhar and Wing, 2003, 2005). Thus, the GOE has been identified in two ways. In a broader sense, the GOE refers to a long-term sedimentological transition in the Paleoproterozoic with possible oscillations in atmospheric oxygen levels (Holland, 2006; Gumsley et al., 2017). In a narrower sense, the GOE is defined by the S isotope transition from MIF to MDF. The latter has been increasingly adopted in studies of individual sections of the Paleoproterozoic (Guo et al., 2009; Williford et al., 2011; Luo et al., 2016).
The threshold Δ33S value that marks the MIF–MDF transition and the GOE is uncertain. For example, chemostratigraphic studies from South Africa reveal a profound sulfur isotope transition from large MIF signals (Δ33S up to ca. +7‰, Δ36S down to ca. –7‰) and overall positive δ34S, to the onset of MDF with large MDF negative excursions in δ34S (down to ca. −30‰) based on bulk S isotope analysis (Fig. 12) (Cameron, 1982; Bekker et al., 2004; Luo et al., 2016). By defining the GOE as a transition to |Δ33S| values <0.5‰ followed by a sharp negative δ34S shift, the GOE was thereby pinpointed at ca. 3 m below the stratigraphic boundary between the Duitschland/Rooihoogte Formation and the Timeball Hill Formation in South Africa (Fig. 12) (Luo et al., 2016). Similarly, a detailed study of the Meteorite Bore Member of the Kungarra Formation (Turee Creek Group) from Western Australia reveals MIF signals with nonzero Δ33S values ranging from −0.83‰ to 0.96‰ (± 0.09‰, 2SD), which have been interpreted to represent the final stage of the GOE (Williford et al., 2011). In this case, the threshold value of |Δ33S| = ca. 0.9‰ has been used to define the MIF–MDF transition and the GOE. Regardless of different threshold |Δ33S| values in different studies, the approach of defining the GOE by MIF–MDF transition is practical in detailed chemostratigraphic studies of individual geological sections.
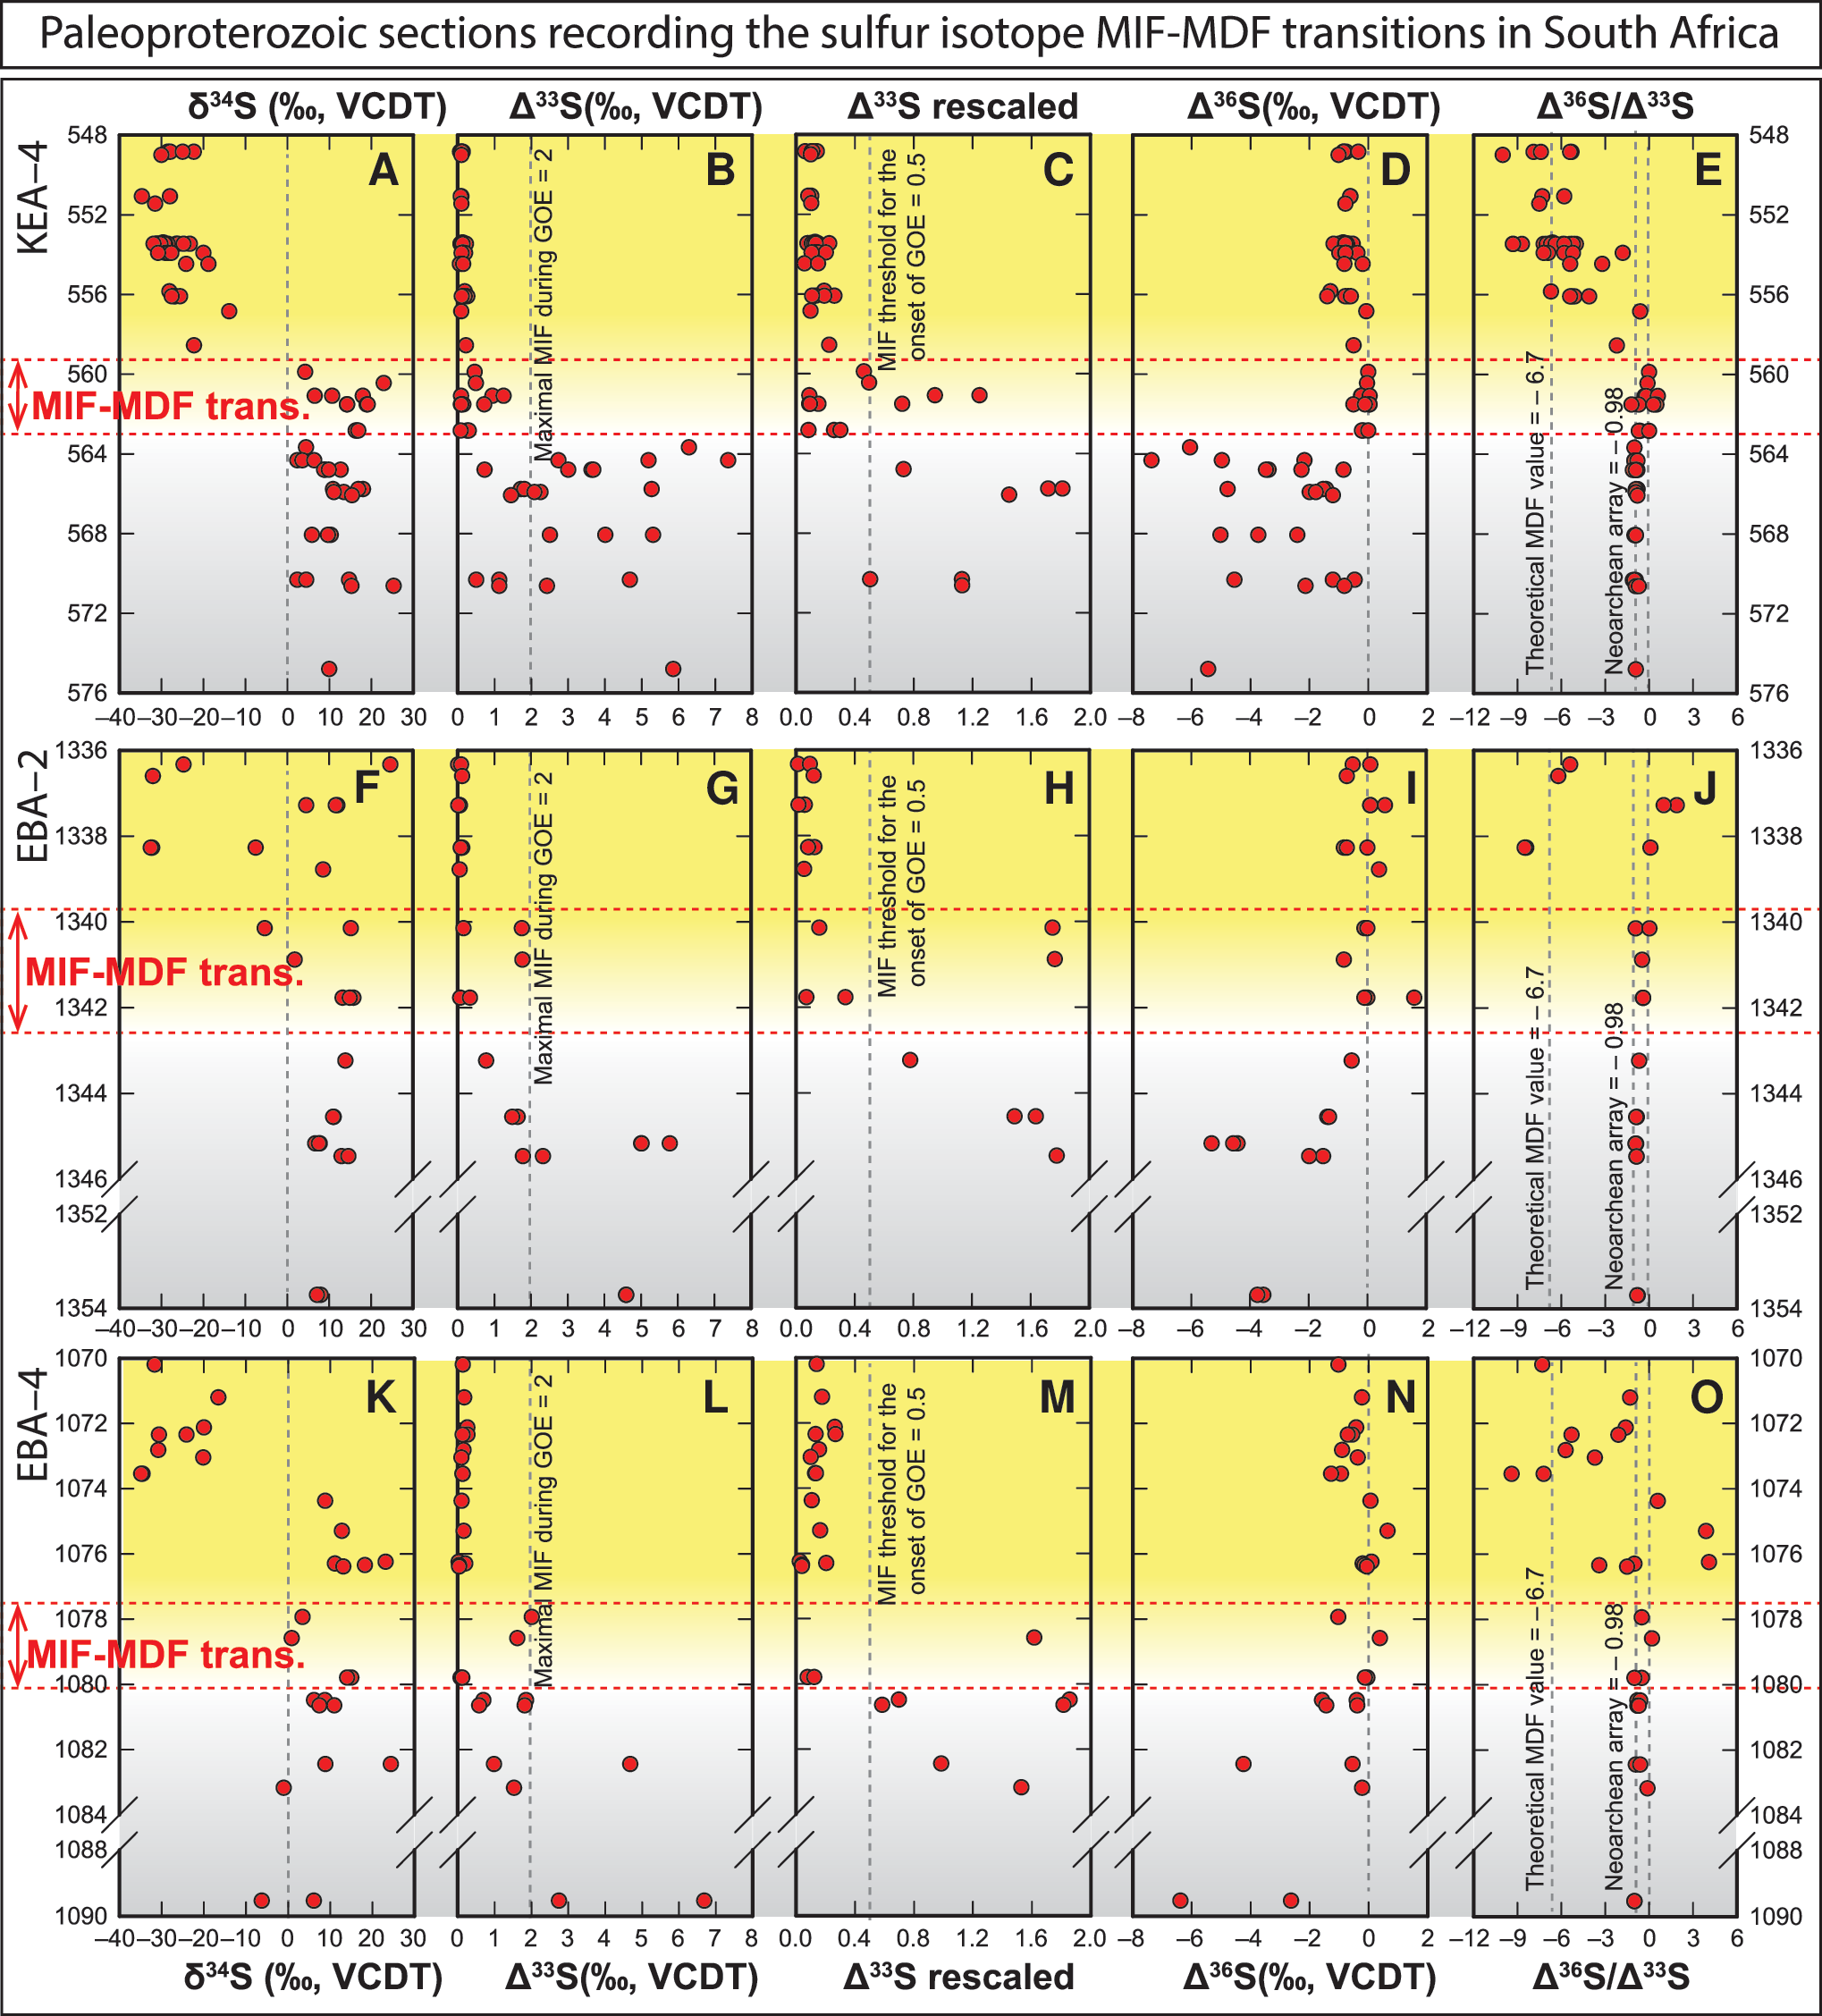
Multiple-S isotope profiles of Paleoproterozoic strata spanning the GOE in South Africa. Data in the y axis represent stratigraphic depth (in meters) of the drill cores. Source from the work of Luo et al. (2016). By defining the GOE as a transition to |Δ33S| values <0.5‰, the GOE was pinpointed at ca. 3 m below the stratigraphic boundary between the Duitschland/Rooihoogte Formation and the Timeball Hill Formation in South Africa. For detailed information on stratigraphy, please refer to the work of Luo et al. (2016).
5.4.2. Differences of the S isotope patterns of the GOE sections
The published and new S isotope data show different features among the GOE sections in South Africa (Guo et al., 2009; Luo et al., 2016; Gumsley et al., 2017), Western Australia (Williford et al., 2011), and North America (this study). We propose that the differences among these sections may result from the difference in analytical methods (bulk vs. SIMS) and the postdepositional history (early authigenic vs. late-stage metamorphism) of different basins. If the samples are well preserved, the integrated scanning electron microscopy (SEM) and secondary ion mass spectrometry (SIMS) techniques have the capability to distinguish and target small domains in different types of sulfide and to distinguish sulfur isotope signals that would otherwise be lost by bulk analysis. Therefore, a data set measured by SIMS provides more complexities compared with data analyzed from bulk samples (e.g., Williford et al., 2011).
In addition to analytical methods, various postdepositional history may also have contributed to the different patterns in S isotope profiles. In the studied Huronian Supergroup, low-grade metamorphism or late fluid activities may have influenced the S isotope values. Therefore, caution is needed when conducting direct stratigraphic correlations among these sections (Hoffman, 2013; Gumsley et al., 2017).
The accuracy of geochronological data of the Paleoproterozoic successions is also critical to our understanding of the detailed dynamics of the GOE (Rasmussen et al., 2013; Gumsley et al., 2017). A recent compilation suggests that MIF-S could potentially be lost from the record and reappear (Gumsley et al., 2017), either due to a fluctuating atmospheric composition (Gumsley et al., 2017) or due to geological reworking of older anomalous MIF-S sources (Reinhard et al., 2013). Therefore, the reconstruction of the GOE by chemostratigraphy of multiple S-isotopes should be based on an accurate geochronological framework.
6. Conclusions
(1) In this study, two drill cores of the Huronian Supergroup were revisited and analyzed for S four-isotopes in pyrite, chalcopyrite, and pyrrhotite. Based on the mineral assemblages and S isotopic compositions, it is proposed that the dominance of pyrrhotite in the studied drill cores results from regional metamorphism, instead of early authigenesis.
(2) The new Δ33S and Δ36S data in this study show homogeneous values at micrometer and millimeter scales. They all fall within a narrow range. The new Δ33S data have improved precision compared to earlier studies. Small but analytically resolvable nonzero signals of Δ33S (from −0.07‰ to +0.38‰) and Δ36S (from −4.1‰ to +1.0‰) persist throughout the entire lower Huronian Supergroup. Neither pronounced MIF-S signals nor a MIF–MDF transition are seen in this study (Figs. 9 and 11).
(3) Four scenarios were discussed on the origin of small nonzero Δ33S and Δ36S signals: muted variability by regional metamorphism, recycling of older pyrite, dilution by magmatic fluids, and the genesis by MDF. Metamorphic recrystallization homogenized any isotope zoning in original sediments, and would have muted S isotope variability, but did not create or destroy the MIF-S signals. The involvement of recycled older MIF signals, magmatic fluids with MDF signals, or small nonzero signals produced by MDF may have also contributed to the overall muted signals. Therefore, we argue that the precise location of the MIF–MDF transition remains unsolved and may have been erased by postdepositional processes in the lower Huronian Supergroup, or may be located in the upper Huronian Supergroup. The previously proposed MIF–MDF transition in the Huronian (Papineau et al., 2007) is not supported in this study and cannot be used to infer the GOE in North America.
(4) This study demonstrates that the SEM–SIMS technique provides fresh insight for unraveling the complexities of the GOE-bearing strata. The differences among Paleoproterozoic sections may result from differences in analytical methods (bulk vs. SIMS) and the postdepositional history (early authigenic vs. late-stage metamorphism) of different basins.
Footnotes
Acknowledgments
This study is supported by the NASA Astrobiology Institute (NNA13AA94A). The WiscSIMS Lab is supported by NSF (EAR–1355590, –1658823) and UW–Madison. The authors acknowledge Phillip Gopon, Tina Hill, and Bil Schneider for the assistance in the SEM lab; Brian Hess, James Kern, and Maciej Śliwiński for assistance in sample preparation; and Noriko Kita for the assistance in the WiscSIMS lab at UW–Madison. We also thank James Farquhar and Genming Luo for helpful comments, Dominic Papineau for sharing the spreadsheet of the published data, and John Walmsley, Dan Farrow, and Anthony Pace from the Ontario Geological Survey at Sault Ste. Marie for the access of the studied drill cores. This manuscript has been improved by constructive comments from two anonymous reviewers.
Author Disclosure Statement
No competing financial interests exist.
Abbreviations Used
References
Supplementary Material
Please find the following supplemental material available below.
For Open Access articles published under a Creative Commons License, all supplemental material carries the same license as the article it is associated with.
For non-Open Access articles published, all supplemental material carries a non-exclusive license, and permission requests for re-use of supplemental material or any part of supplemental material shall be sent directly to the copyright owner as specified in the copyright notice associated with the article.