
Abstract
The recognition of biosignatures on planetary bodies requires the analysis of the putative microfossil with a set of complementary analytical techniques. This includes localized elemental and isotopic analysis of both the putative microfossil and its surrounding host matrix. If the analysis can be performed with spatial resolution at the micrometer level and part-per-million detection sensitivities, valuable information on the (bio)chemical and physical processes that influenced the sample material can be gained. Our miniaturized laser ablation ionization mass spectrometry (LIMS)-time-of-flight mass spectrometer instrument is a valid candidate for performing the required chemical analysis in situ. However, up until now it was limited by the spatial accuracy of the sampling. In this contribution, we introduce a newly developed microscope system with micrometer accuracy for ultra high vacuum application, which allows a significant increase in the measurement capabilities of our miniature LIMS system. The new enhancement allows identification and efficient and accurate sampling of features of micrometer-sized fossils in a host matrix. The performance of our system is demonstrated by the identification and chemical analysis of signatures of micrometer-sized fossil structures in the 1.9 billion-year-old Gunflint chert.
1. Introduction
I
Microorganisms, including bacteria, archaea, and eukaryotes, can be found as single entities, but more often aggregate to micrometer-sized colonies that need to be identified and distinguished from their host and other impurities and inclusions for further chemical investigation. Their analysis includes the determination of isotope ratios and fractionation of biorelevant stable elements such as C, H, N, S, Fe, and Ni (Monster et al., 1979; Ohmoto et al., 1993; Beard et al., 1999; Shen et al., 2001; Ono, 2008; Cameron et al., 2009; Vago et al., 2017). Redfield (1934) and more recently Managadze et al., (2017) and Marshall (2017) also proposed the detection of elements and analysis of their ratios for the identification of biosignatures.
The microorganisms conserved in the 1.9 billion-year-old Gunflint chert serve as a Mars analogue in our study. With reference to this sample, we introduce our recently developed optical microscope that serves as a complement to the already existing, highly sensitive miniature flight prototype of a laser ablation mass spectrometer. Together, these two instruments form an instrument suite capable of performing the required chemical and optical analysis.
2. Current State-of-the-Art of Miniature Laser Ablation Ionization Mass Spectrometry Instruments and Rationale for a Microscope
In recent years, laser ablation ionization mass spectrometry (LIMS) has been proven to be a successful measurement technique for quantitative mapping of chemical composition of solid samples with high spatial resolution (Grimaudo et al., 2017) down to the nanometer level (Kuznetsov et al., 2015). However, this could only be achieved with the effort of many groups contributing to this field (Brinckerhoff et al., 2000; Huang et al., 2010; Cui et al., 2012; Riedo et al., 2013b, 2013c; Zhang et al., 2013; Kuznetsov et al., 2015).
Our miniature (ø60 mm, l = 160 mm) laser ablation ionization time-of-flight mass spectrometer (LA-TOF-MS) designed and built at the University of Bern was originally developed for in situ elemental and isotope analysis of solids on planetary bodies (Rohner et al., 2003). A detailed description of the working principle of the instrument can be found in the studies of Riedo et al. (2013a, 2013c, 2017). Only a brief description is given here. The right side of Figure 1 depicts the LIMS-TOF-MS part of the instrument suite. The sample is positioned a fraction of a millimeter away from the entrance aperture of the mass spectrometer using a xyz translation stage with 100 × 50 × 50 mm travel range. An ultrashort laser pulse (λ = 775 nm, ∼180 fs, 1 kHz repetition rate, intensity ≤1 mJ/pulse) is sent to the instrument through optical path 1 (OP1) and focused on the sample with a lens placed at the back of the mass spectrometer. The positive ions created during the ablation process are accelerated and focused into the instrument through a series of dedicated electrodes. A reflectron type ion mirror focuses the ion beam onto a highly sensitive four-channel MCP detector with a dynamic range of up to 108 (Riedo et al., 2017). The signal is acquired with a dedicated PC using two high speed ADC cards (8 bit, 2 channels each, with a sampling rate of up to 4 GS/s).
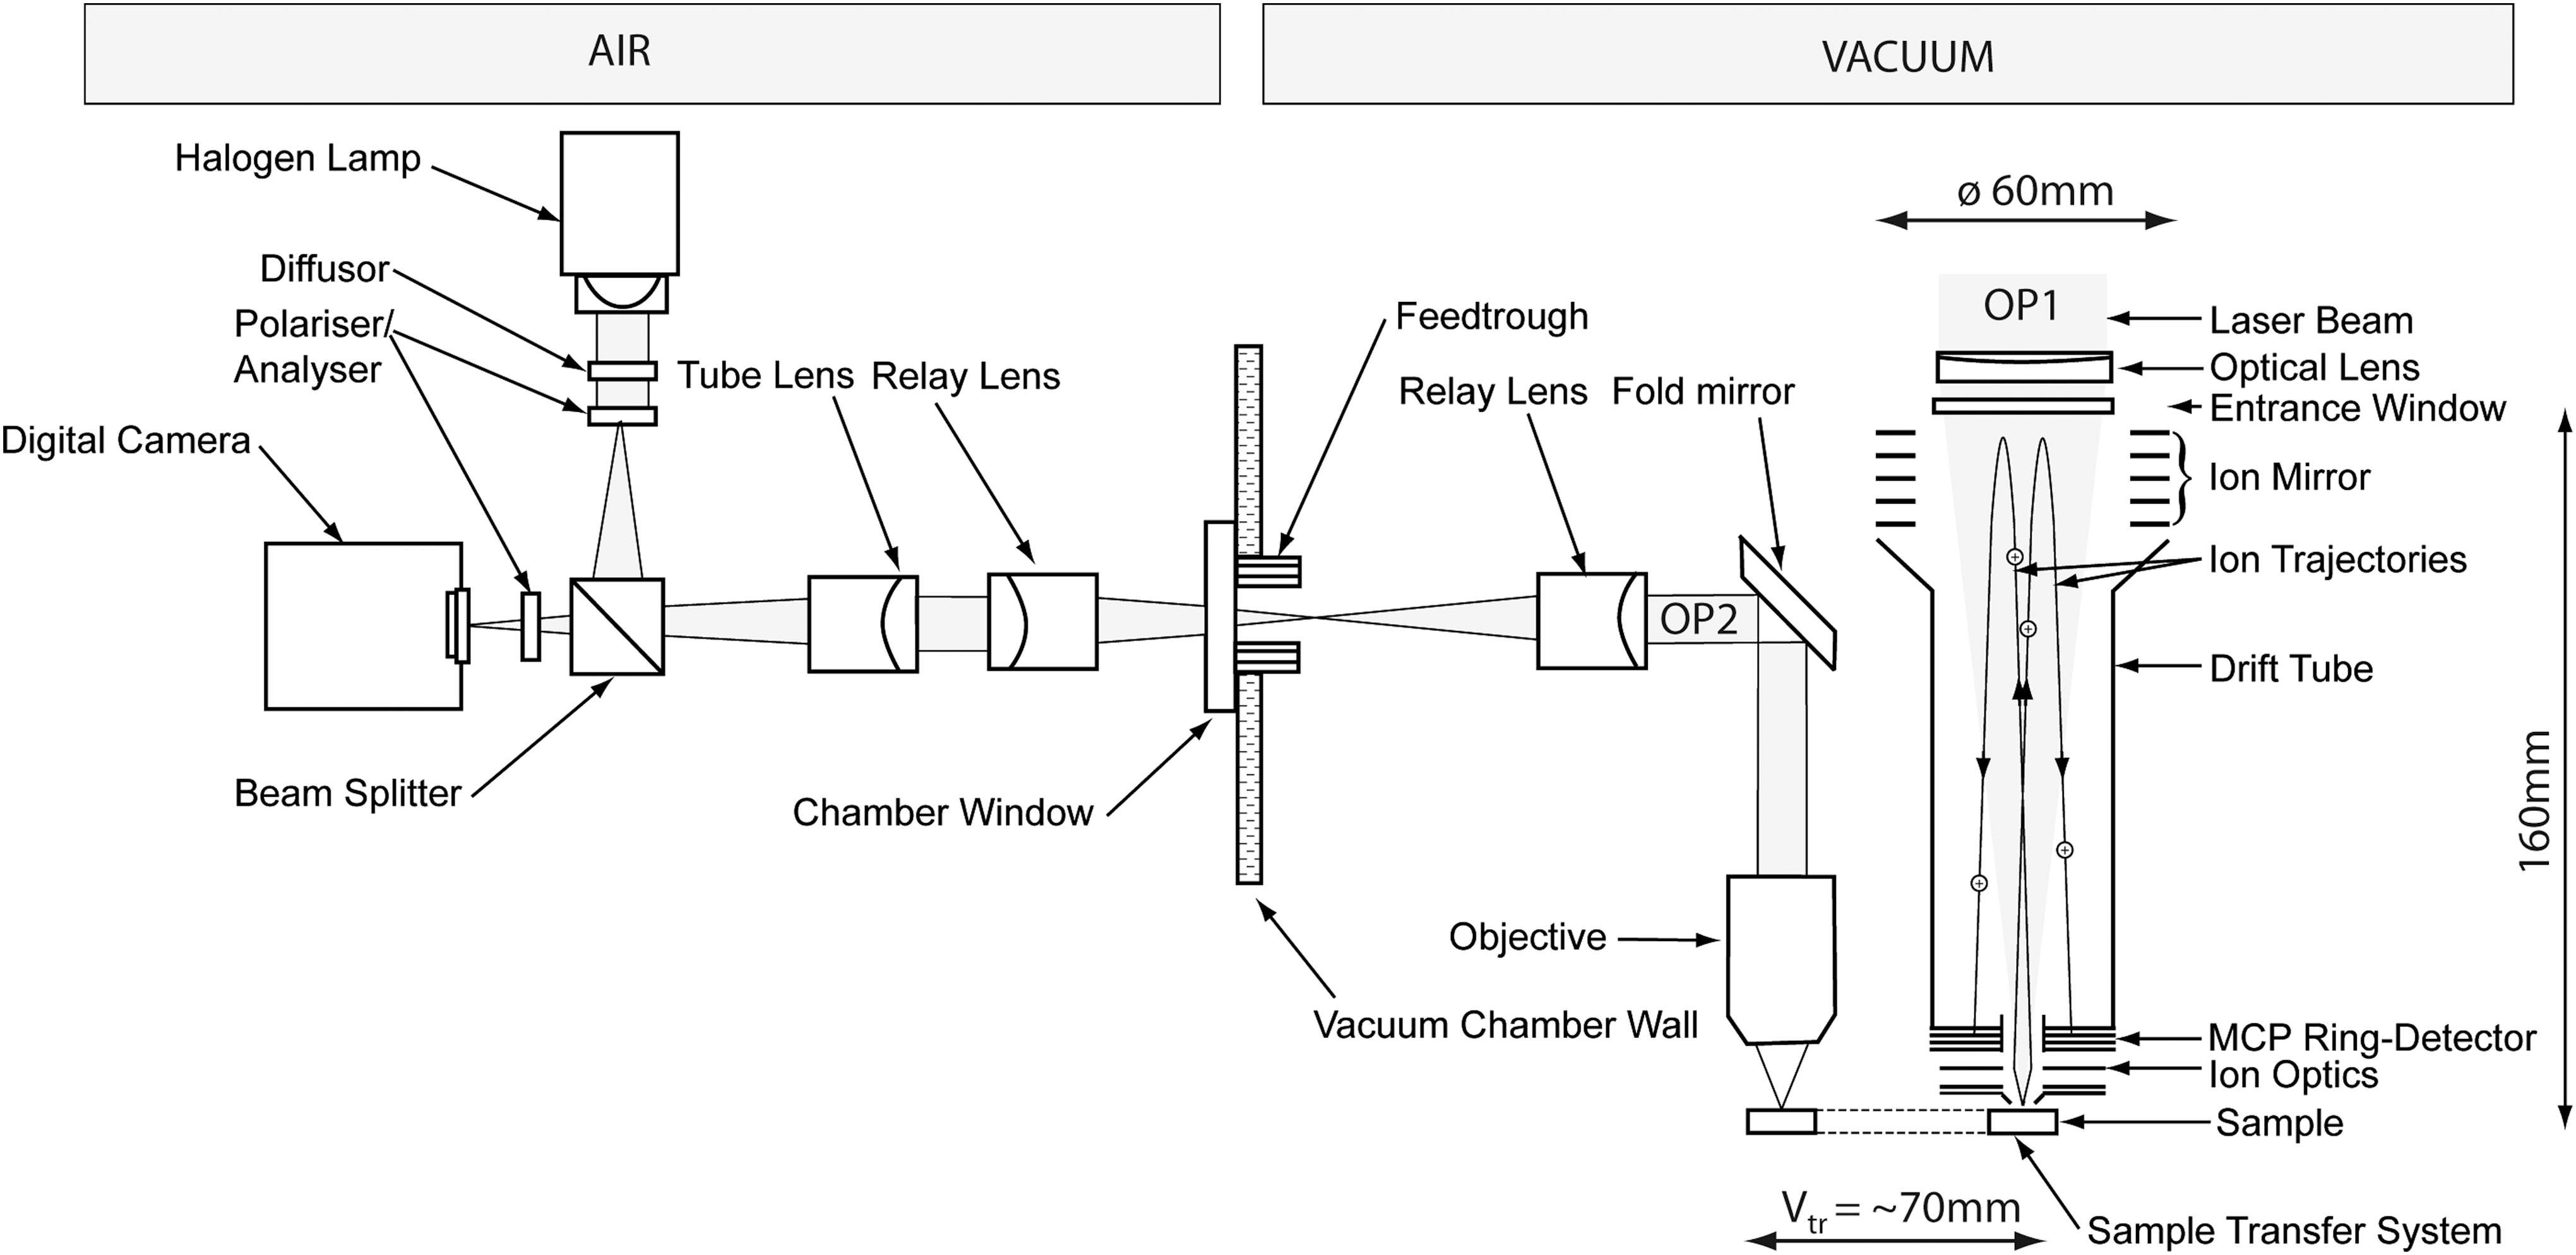
Drawing of the ultra high vacuum-compatible microscope that was recently added to our miniature laser ablation ionization mass spectrometry system. Details can be found in the text. OP1, optical path 1; OP2, optical path 2.
With the experience gained over more than a decade by investigating a wide series of samples, spanning different scientific fields ranging from astrobiology (Tulej et al., 2015) to the semiconductor industry (Moreno-Garcia et al., 2016), the measurement capabilities and performance parameters of the instrument have been continuously improved. Today, the system allows the study of heterogeneous materials with a depth resolution in the nanometer range, lateral resolutions of about 15–20 μm (Neuland et al., 2014; Grimaudo et al., 2015, 2017; Riedo et al., 2015), with a sensitivity down to sub-ppm level (Riedo et al., 2013a, 2013b; Riedo et al., 2013c; Wiesendanger et al., 2017). In these previous measurement campaigns, we performed sampling of large rectangular areas (sometimes several hundred spots) with a pitch between sampling locations close to the ablation spot diameter. This approach, later on called “rastering,” is a useful technique for obtaining two-dimensional and three-dimensional (3D) chemical maps (Neuland et al., 2014; Grimaudo et al., 2017). However, during our previous work, it became clear that this method is too time consuming and inefficient when sampling of micrometer-sized fossils is required (Tulej et al., 2015).
Figure 2 illustrates the reasons why a microscope is a mandatory complement to the LIMS-TOF-MS, which enables the localization of putative microfossils and the acquisition of their mass spectra at the highest possible quality. The fossils are often embedded in a matrix, with dimensions close to, or below, the ablation laser spot diameter and with a possibly irregular distribution and shape. To minimize chemical contributions from the surrounding matrix to the acquired mass spectrum from the fossil, precise targeting of the object of interest is required. This can only be achieved with a precise visual feedback of the sampled region.
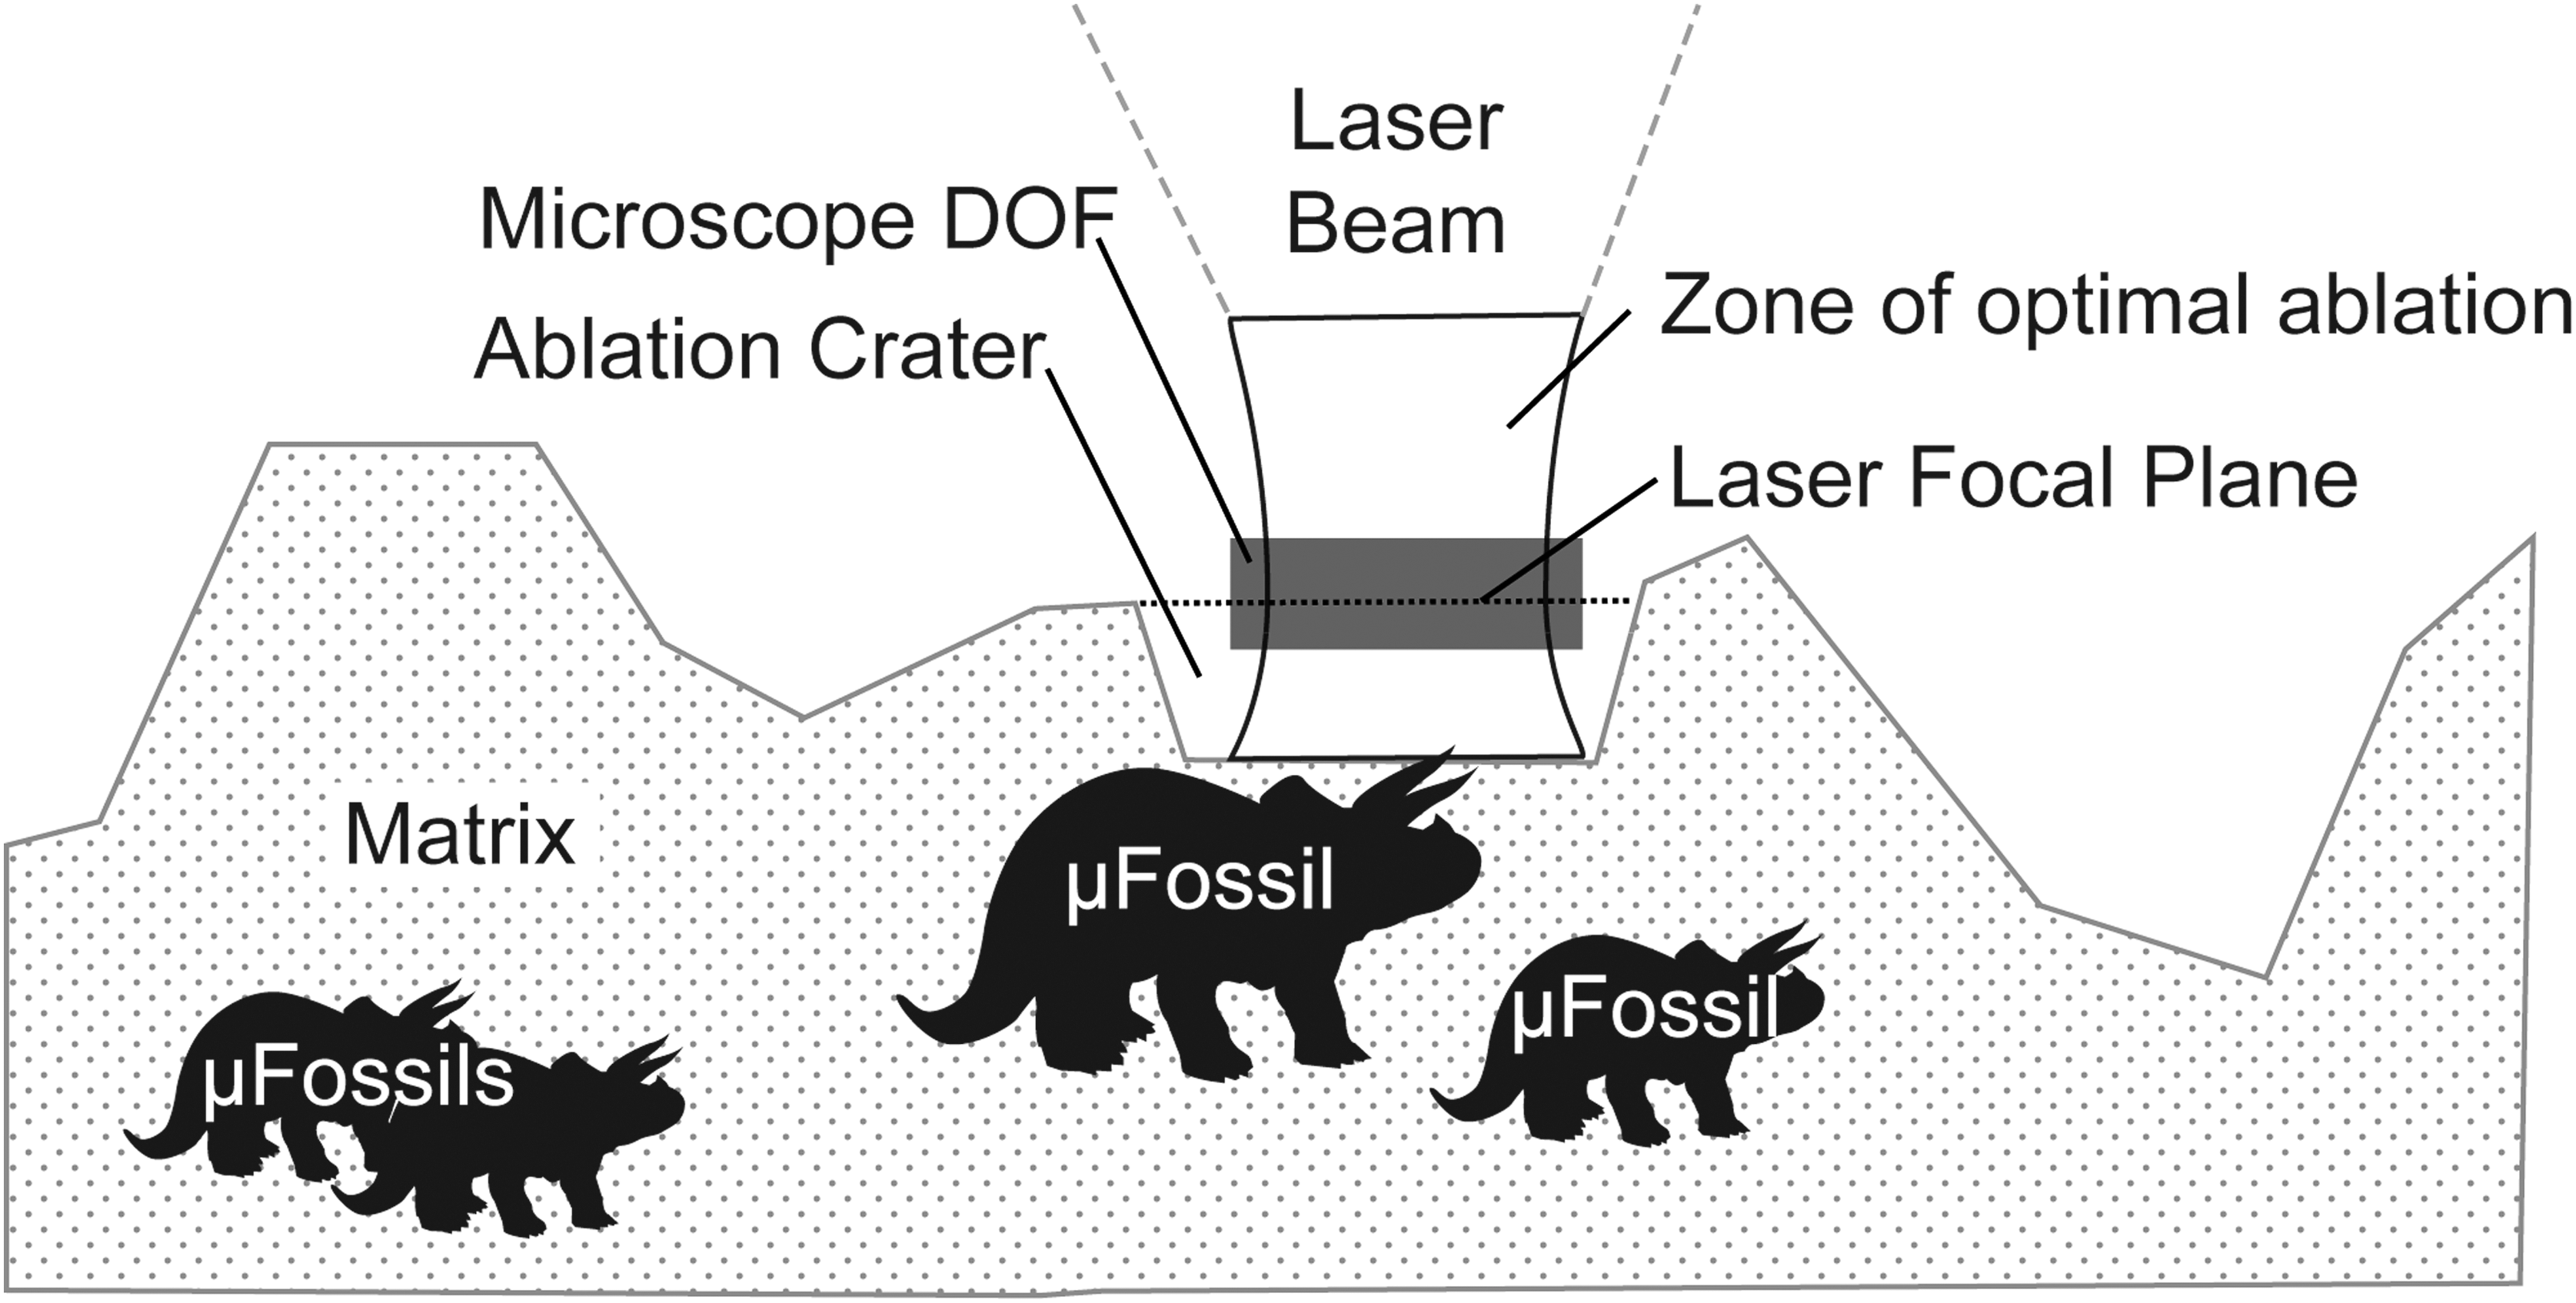
Schematic representation of a sample with an uneven surface structure and containing microfossils inside a transparent matrix. DOF, depth of focus.
Extensive sample preparation, such as polishing or thin section preparation before the mass spectrometric analysis on board of a lander or rover, is not likely to be possible, and hence samples investigated on planetary surfaces are likely to exhibit an uneven surface. The height inhomogeneities can easily be >100 μm and thereby depart from the region of optimal laser ablation. In the case of our instrument, this optimal region is ∼±50 μm above or below the laser focus. A precise compensation of the uneven surface with the sample translation stage is, therefore, highly desirable for optimal spectral quality and comparability between different locations on the sample. A microscope system with a sufficiently small depth of focus (DOF) would permit the creation of a 3D profile of the sample surface. Calibrating the focus of the microscope to the focal point of the ablation laser would then enable the sample surface to be precisely positioned in the laser focus at any time.
Using the microscope for an optical feedback would also allow the control of the ablation process and the determination of the optimal ablation parameters for different materials, especially the laser fluence that has a major impact on the quality of the mass spectrum.
3. Microscope System
Different research groups and commercial TOF-MS manufacturers have already implemented microscopes in their instruments (Heinen et al., 1983; Guest, 1984; Ma et al., 1995; Zonnevylle et al., 2013; Hornung et al., 2014; Tulej et al., 2014), and several microscopes and close up imagers were built and flown to Mars. These instruments have a resolving power between 122 and ∼3 μm. However, a resolution of ∼1 μm is desirable to resolve individual microbial cells (Thomas et al., 2004; Hofmann, 2008; Vago et al., 2017).
In the case of the LMS Instrument, direct visualization of the sample during the ablation process could be realized by using the optical path of the laser also for the microscope (OP1 on Fig. 1). However, this optical path does not offer enough numerical aperture (NA) to see the sample with 1 μm resolution. Therefore, we developed and built a solution with a secondary optical path (OP2 on Fig. 1), in which the microscope optical axis is placed parallel and offset by ∼70 mm to the instrument axis. Using this configuration, (shown in Fig. 1), we were able to place a Nikon infinity corrected bright field microscope objective with an NA of 0.3 next to the mass spectrometer. This objective has a resolving power of 1 μm, which is sufficient to clearly resolve our ablation spots and the microbial fossils. The DOF is ∼3 μm, which allows us to place the sample in the zone of optimal laser ablation as shown in Figure 2.
The image is focused onto an image sensor of a camera with a readily available Nikon 200 mm tube lens. Both the objective and the tube lens were disassembled and modified in-house to improve their vacuum compatibility. For ease of use, the image should be situated outside the vacuum chamber, so that the camera can be placed and operated in air. This is achieved by placing a fold mirror to transport the image through a window on a lateral side of the vacuum chamber. A relay lens system consisting of two additional Nikon 200 mm tube lenses transports the image far enough from the chamber wall to allow the installation of the camera (Allied Vision, Manta G201 with 1624 × 1234 pixel resolution) and the illumination system. The two relay lenses are placed on axially adjustable mounts so they can be focused to the intermediate image and the focal plane. The objective is mounted on an in-house made adjustable holder that allows the operator to shift its working plane and to align this plane with the axis of the mass analyzer.
The illumination of the sample is provided by a diffused image of a tungsten–halogen lamp that is coupled into the optical path using a broadband beam splitter (Thorlabs, BSW27) near the camera. If a reduction of the specular reflection is desired, polarizers can be introduced into the optical paths, and the same mechanism can also be used to introduce other filters.
Mechanically, the air side and vacuum side of the microscope are two independent assemblies. A custom-made vacuum feedthrough allows the user to maintain precise mechanical alignment of the optical axis of the air side and vacuum side sections.
The live image of the microscope is displayed on a computer screen and covers an area of ∼600 × 600 μm on the sample. A calibrated crosshair on the screen allows targeting of locations of interest within the sample.
4. Microscope Performance
We tested the resolution of the microscope using a U.S. Air Force 1951 standard test target. It contains several groups of horizontal and vertical lines with decreasing width up to 228 lines/mm, which corresponds to a line width of 2.19 μm. Figure 3 shows that these features are well resolved, even though some chromatic aberration is present. However, this resolution was found to be sufficient to resolve targets of interest and ablation craters, both at micrometer dimensions. We have not observed any degradation of the optical performance due to the high vacuum even when pressures <10−8 mbar are achieved.
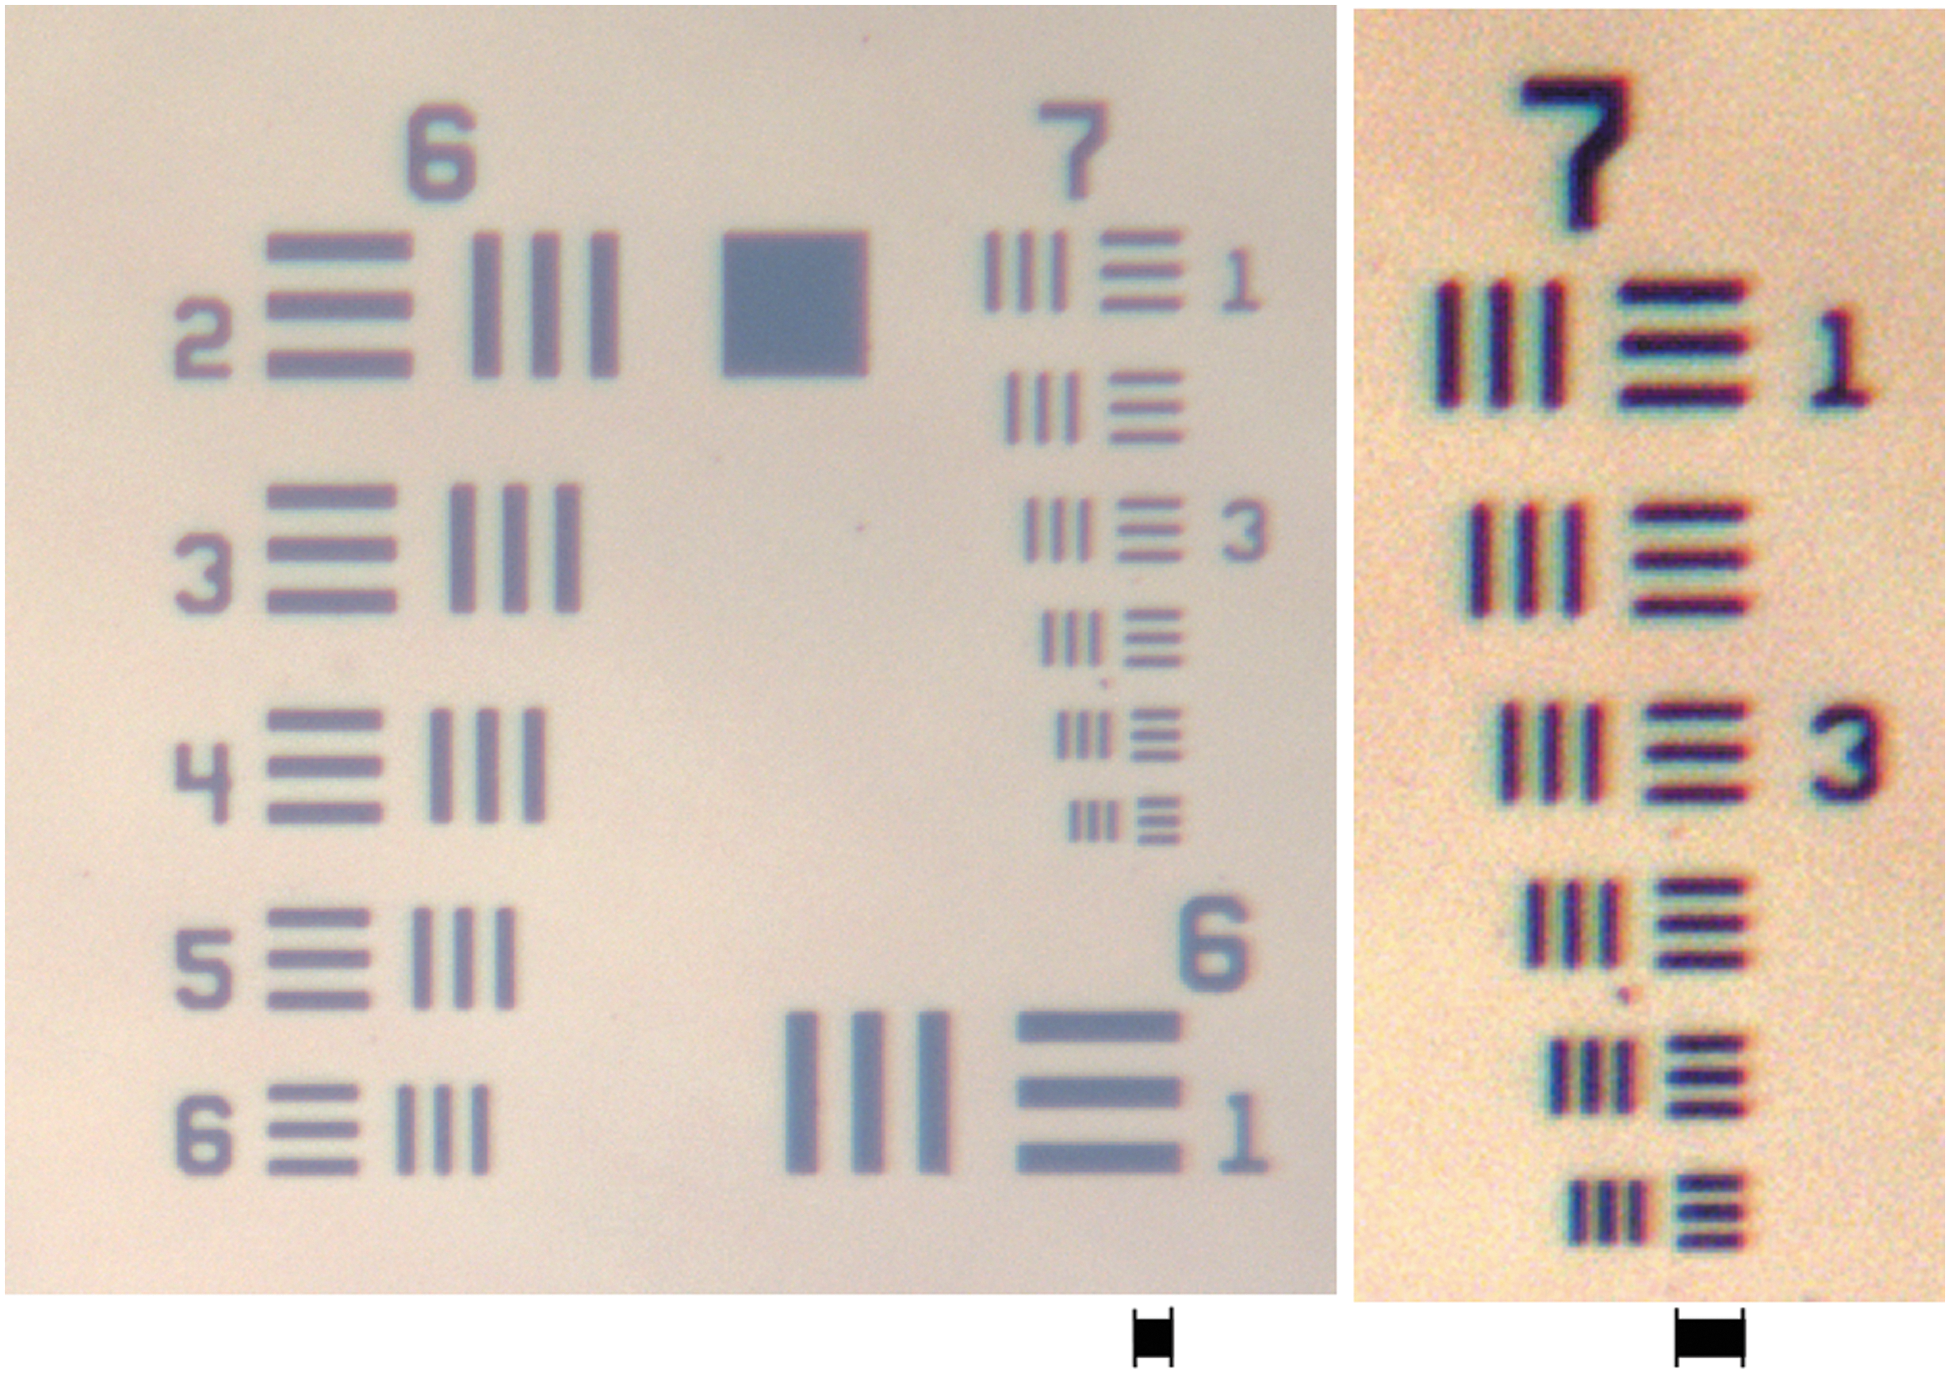
Detail of the U.S. Air Force 1951 resolution test target recorded with the microscope system (left panel: real contrast; right panel: corrected contrast). The smallest line grid has a spacing of 2.19 μm and can be clearly resolved.
For sampling microscopic features of interest, the translation vector Vtr (Fig. 1) between the laser focus and the microscope optical axis needs to be determined with high precision and reproducibility. Vtr was determined by shooting a crater into the sample surface and subsequent displacement of this crater into the center of the microscope image. One can then directly determine the Vtr from the stage coordinates. The reproducibility was assessed by moving the sample back by -Vtr and generating a second crater on the same coordinates (Fig. 4). This was repeated 10 time and a mean distance between the craters from the first and the second shot campaign of 2.7 μm with a standard deviation of σ = 1.2 μm was determined. This is well below the mean crater diameter of 14.1 (σ = 2.1) μm and guarantees a sufficient overlap of the coordinates after translation to the microscope and back. This calibration method was found to work reliably during the subsequent measurement campaigns.

Repeatability test of the translation from the mass spectrometer to the microscope in X and Y.
5. Mass Spectrometric Analysis of 1.9 Ga Old Microfossils in the Gunflint Chert
The Gunflint chert is an excellent case study for the combined use of the microscope and the mass spectrometer to detect traces of ancient life. The chert contains 1.9 Ga old micrometer-sized carbonaceous fossils in a dominantly SiO2 matrix at different depth locations. The microfossils were described in detail in a series of articles in the 1960s and 1970s (Barghoorn and Tyler, 1965; Awramik and Barghoorn, 1977; Knoll et al., 1978) and more recently have been studied and catalogued in terms of morphology, chemistry, and crystallography using modern techniques, including secondary ion mass spectrometry, focused ion beam, laser Raman, transmission electron microscopy, and scanning transmission X-ray microscopy (Moreau and Sharp, 2004; Wacey et al., 2012, 2013; Alleon et al., 2016; Lepot et al., 2017). Our case study sample comes from the classic Schreiber Channel locality of the Gunflint chert on the north shore of Lake Superior (Wacey et al., 2013). The Gunflint chert has also been suggested as an effective analogue to extraterrestrial rock formations that may contain microfossils (Brasier and Wacey, 2012). Thus, it is well suited to test and validate our recently improved measurement techniques and protocols for in situ detection of microfossils with our LIMS system.
For in situ detection of markers of present and past life, an elemental and isotopic mass spectrometric analysis at their precise location is required. In addition, sampling of the matrix as a reference in the vicinity, but not within a microfossil, is highly desirable (Brasier and Wacey, 2012). Sampling of the silica matrix is a challenging task for our LIMS system, because the sample matrix is nearly transparent at the wavelength of our IR laser (775 nm). Therefore, higher laser fluences of ∼10 TW/cm2 are required, whereas good spectral quality and protection of the sample from excessive damage tend to drive the laser fluence down. Thanks to the direct optical feedback provided by the microscope, we were able to find optimal laser ablation parameters and sample the material with high spatial precision and sufficient spectral quality for elemental analysis.
Before sampling with the laser, the area of interest was mapped with the microscope. The map, composed of individual pictures of three adjacent areas, is displayed in Figure 5a, b, and d. Figure 5c shows a spot similar to that shown in Figure 5b in terms of color and shape, but ∼3 mm away. The crosshairs represent the locations that were selected for sampling. Spot a is located in the silica matrix; the brown features at spots b to d are the clusters of small spheroidal, star-shaped, and filamentous fossils reported in many previous studies (e.g., Barghoorn and Tyler, 1965; Knoll et al., 1978; Lepot et al., 2017). With the installed microscope, we can directly sample all these features with high position accuracy, since it provides the necessary in situ imaging capabilities and the possibility to control and possibly correct instrument and laser parameter settings. After sampling, the area was mapped again with the microscope to verify the ablation crater position and quality (Fig. 5, lower panels).

Microscope picture of the colonies of microorganisms before and after sampling. The ablation craters as well as the surrounding affected zone are clearly visible. The scale is valid for all panels. Spots a, b, and c were sampled with 300,000 laser shots, d was sampled with 100,000 shots.
6. Results and Discussion
Figure 5, lower panels, shows the ablation craters and confirms that the desired features were successfully sampled. All craters show two distinct regions: a very dark inner area, which represents the actual crater (ø10–15 μm), and an outer rim with slightly lighter color (ø20–25 μm) called the “affected zone.” Detailed studies of the crater formation process were recently published by our group (Cedeño López et al., 2018; Grimaudo et al., 2018) and show that the sampled material actually originates only from the central crater region. The affected zone around the crater originates from redeposited material and altered surface properties due to the laser irradiation (e.g., weak wings of laser radiation).
The mass spectra were analyzed using our in-house developed analysis software (Meyer et al., 2017), and no relative sensitivity coefficients were applied to the measured element abundances. We observed that the signal-to-noise ratio (SNR) of the acquired signals is sufficient for the identification of many elements and isotopes of major elements. Despite the high laser fluence, the SNR of the recorded spectra was not sufficient to perform accurate isotopic analysis. In fact, many of the minor isotopes are still below the detection limit. Thus, an improvement of the SNR is desirable for future campaigns to perform isotopic analysis.
6.1 Spot a (300,000 laser shots, 10 TW/cm2)
Figure 6 shows the mass spectra that were recorded at locations shown in Figure 5. The reference spectrum from the matrix acquired at location a shows dominant 28Si+ and 16O+ peaks. Also, the SiO+ cluster is clearly present at m/q 44–46 as well as the Si2 + at m/q 56–58. Larger Si and O compounds can be found at m/q 60 (SiO2 +), 72 (Si2O+), and 88 (Si2O2 +). 23Na+, 27Al+, 39K+, and 41K+, as well as 40Ca+ can also readily be identified in the mass spectrum, along with low levels of 12C+. Also at m/q 32 a peak can be observed. Although S may be present in the matrix in small quantities, both as micropyrite grains (Petrash et al., 2016; Lepot et al., 2017) and within finely disseminated organic material (Moreau and Sharp, 2004; Alleon et al., 2016), it cannot be conclusively determined whether this peak originates from 32S+, O2 +, or a combination of both. To resolve this issue, an improvement of the SNR is required in further measurements, to raise the intensity of the corresponding 34S peak above the detection limit, which would allow us to confirm or exclude the presence of S. At present, attributing the m/q 32 peak in this matrix spectrum to O2 + is the most likely explanation.
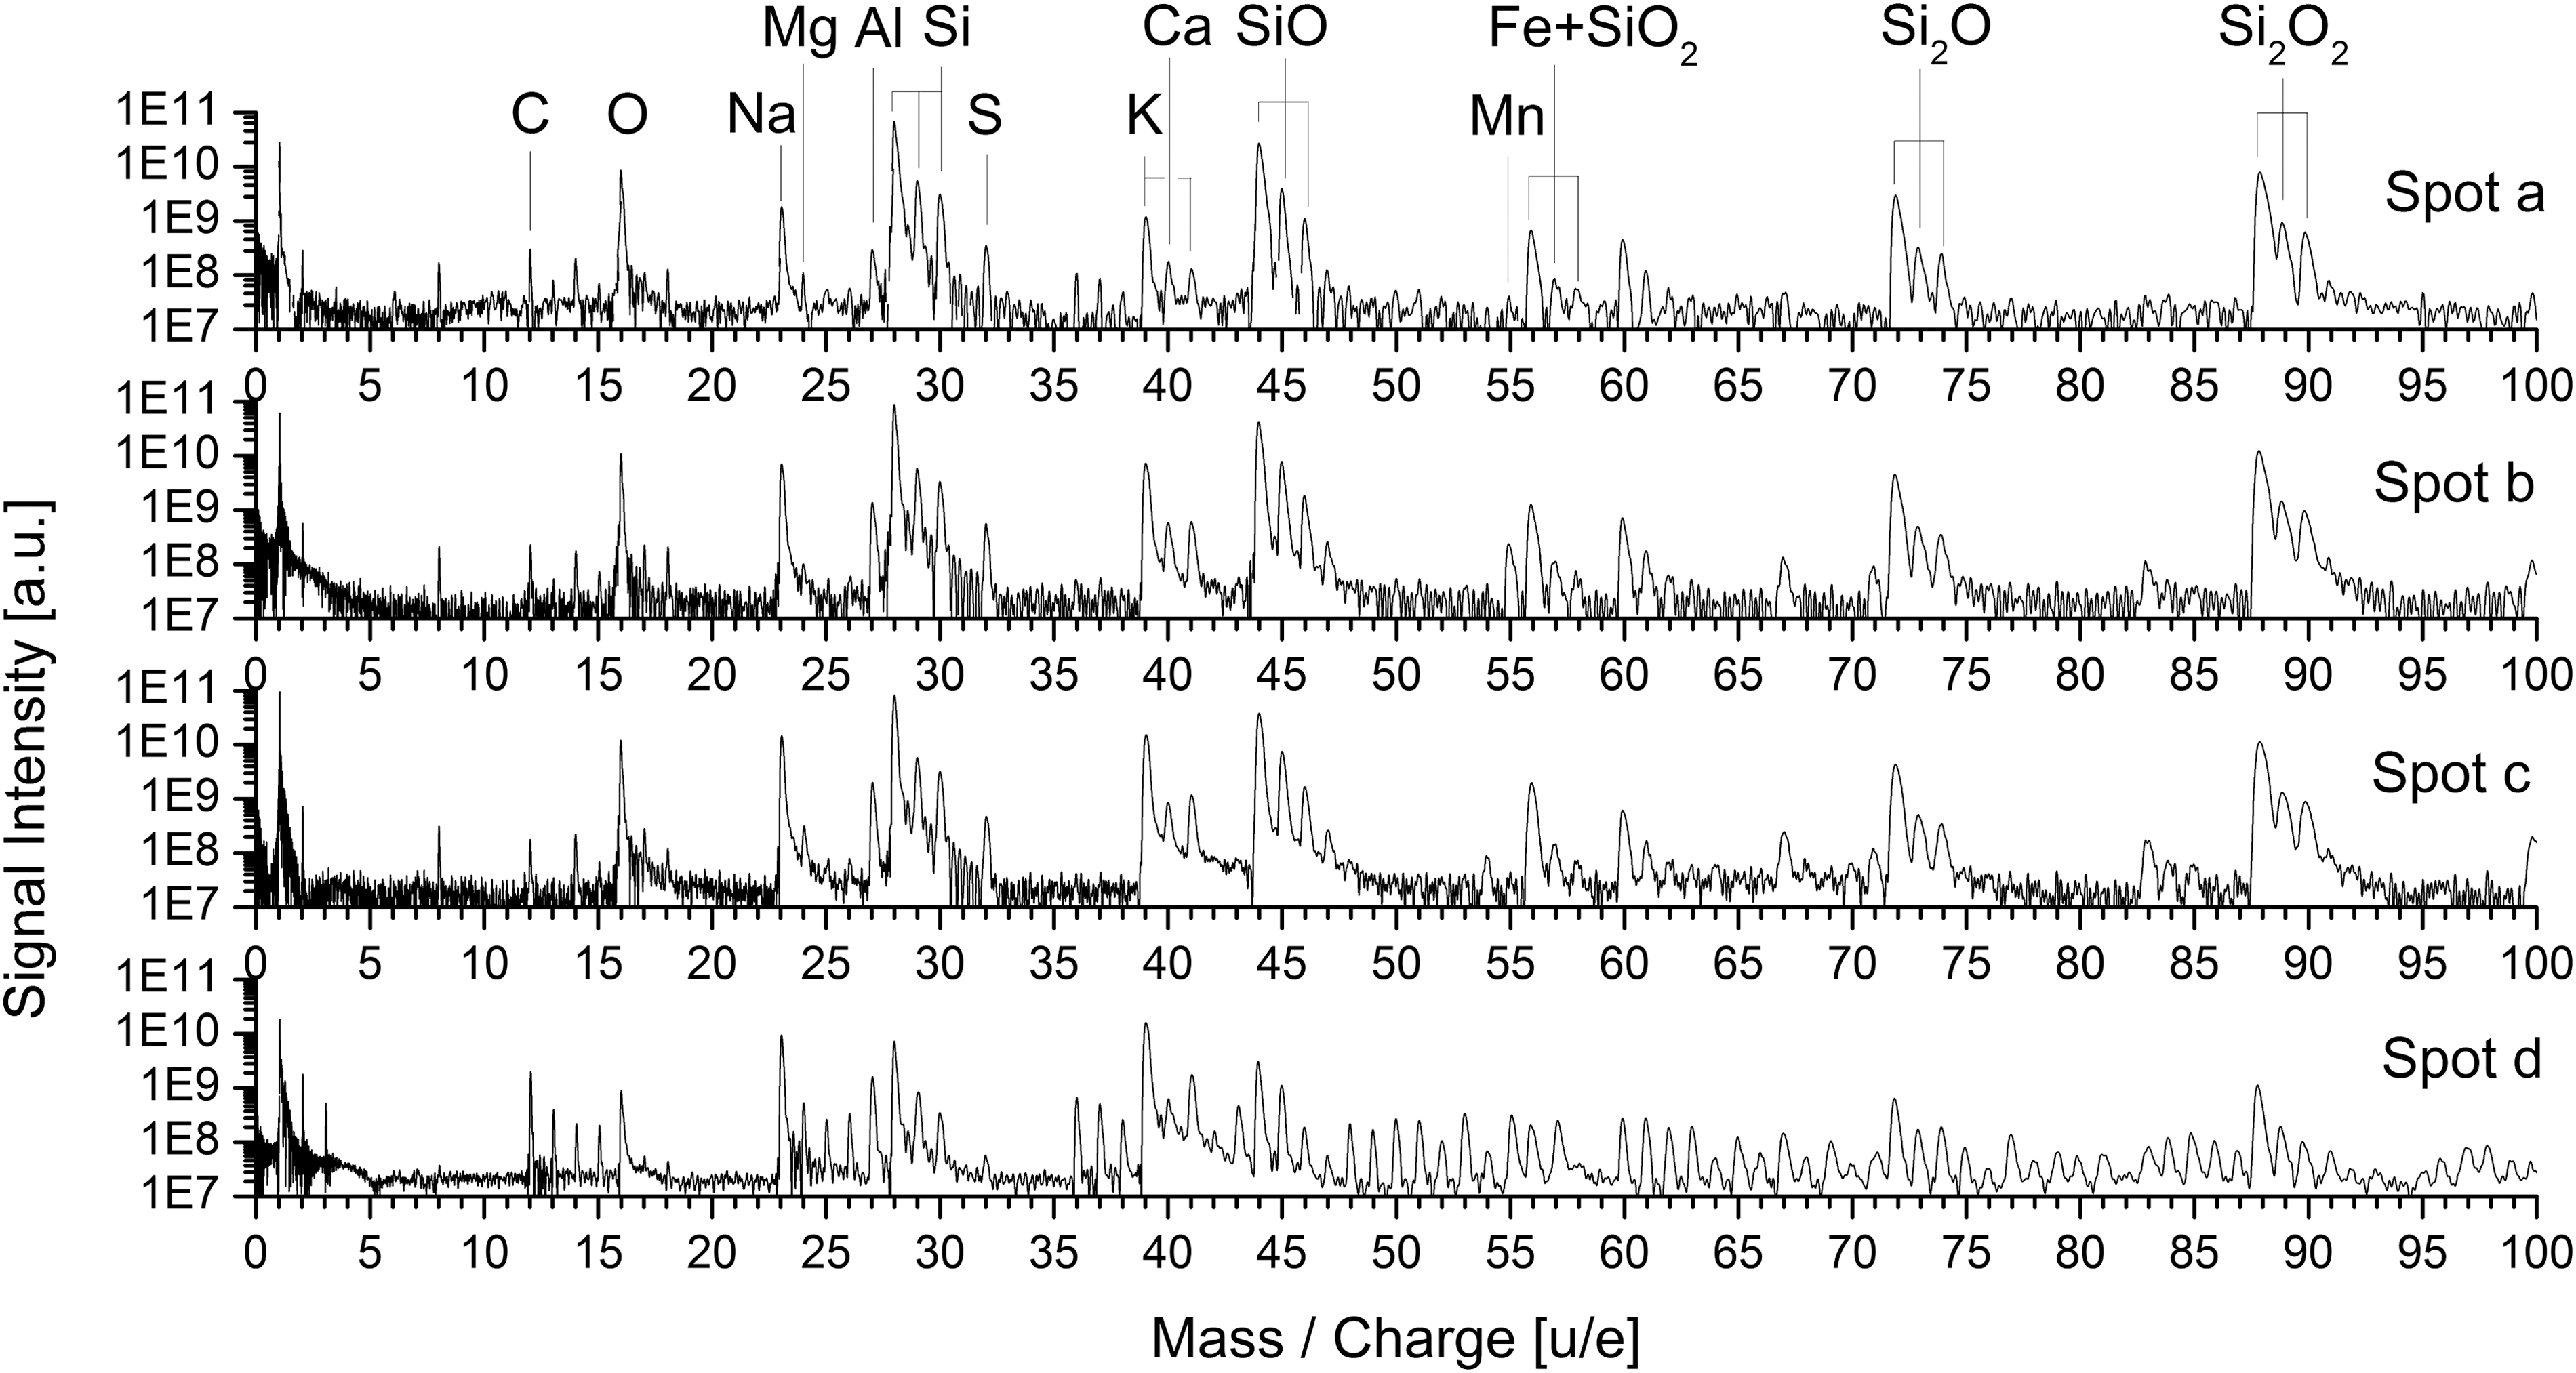
Accumulated mass spectra from the four spots shown in Figure 5.
If we assume this spectrum to be a background mineral spectrum, an explanation must then be sought for those elements that are present in the spectrum but do not occur in the known dominant SiO2 quartz matrix mineral phase. Na and K can have a number of sources; they are present in significant quantities in seawater, so may be incorporated into mineral salts (e.g., chlorides and sulfates) as seawater evaporates in restricted environments. It is notable that silicified casts of cubic minerals interpreted as hopper halite (NaCl) have been reported from stromatolitic Gunflint samples (Petrash et al., 2016), so the Na may be a remnant signal from these halite crystals. Na and K may also be incorporated into authigenic clay minerals or be brought into the system as detrital silicate minerals (e.g., feldspars and clays). Little detrital input has previously been reported in these samples, but there have been reports of small volumes of (presumably authigenic) stilpnomelane in fossiliferous Gunflint samples (Schelble et al., 2004), which would be a logical source for both the K and Al signals in our matrix spectrum.
The presence of Ca could also be explained by incorporation into evaporite minerals such as calcium sulfate (gypsum) or some types of aluminosilicate clay minerals, but such minerals have yet to be reported from fossiliferous members of the Gunflint Formation. Instead, a more logical explanation is that the Ca is contained within a carbonate mineral. A number of calcium-rich carbonates including calcite, dolomite, and ankerite have been reported from Gunflint sediments (Sommers et al., 2000; Moreau and Sharp, 2004; Shapiro and Konhauser, 2015; Alleon et al., 2016; Petrash et al., 2016; Lepot et al., 2017), and aragonite has been inferred to be the primary mineralizing phase of Gunflint stromatolites (Petrash et al., 2016). Although much of this carbonate has subsequently been replaced by silica, large rhombic carbonate crystals still persist (Petrash et al., 2016), and nanocarbonates are found sporadically within the silica matrix (e.g., Lepot et al., 2017). Hence, small volumes of calcite may explain both the Ca and small carbon signal from spot a. Alternatively, the carbon signal could arise from organic material dispersed in the matrix. We suggest this is less likely based on the optical images showing a clean mineral matrix at spot a.
6.2 Spot b (300,000 laser shots, 10 TW/cm2)
On the microorganisms at spot b, the differences to the reference spectra found from spot a are rather subtle. One of the most striking differences is the presence of a peak at m/q = 55 (the Mn peak). Mn has previously been detected in a trace element study of stromatolites from the Schreiber Channel locality (Petrash et al., 2016), and ankerite (a Mn-containing carbonate) rhombs are relatively common across Gunflint sediments (e.g., Alleon et al., 2016), so Mn was clearly present within Gunflint waters. Mn has been suggested as a possible metabolite for some of the star-shaped microorganisms preserved in the Gunflint chert (Cloud, 1965; John and Nudds, 2008). Thus, the detection of Mn may support the presence of a fossilized microbial community on this spot. The same microorganisms, plus some filamentous Gunflint forms, have also been suggested to oxidize Fe (Planavsky et al., 2009) although other authors have a different view (Shapiro and Konhauser, 2015). Hence, this element might be expected to be found at the same location. Unfortunately, in the current measurement, the main 56Fe+ peak overlaps with the Si2 + cluster, and the signal of 54Fe+ is not strong enough to be detected above the background. However, by comparing the signal intensities between the peaks at m/q = 28 (28Si+) and 56(28Sis + + 56Fe+), we can infer the presence of Fe.
Table 1 presents the ratios between the peaks at m/q = 56 and 28 (third column). The peak intensity ratio is 10.6 × 10⁻³ and 19.32 × 10⁻³ for spots a and b, respectively, which indicates a clear enhancement of the signal at spot b. This supports the enrichment of Fe in position b. To verify that the enhancement actually originates from a 28Si2 +/56Fe+ isobar and not from a random change in instrument or measurement parameters, we also investigated surrounding peaks that should not be affected by the presence of iron. We chose the Si2+ and the SiO2 + peak at m/q = 14 and 60, respectively, as a reference, since they do not interfere with a Fe or Fe-cluster peak and are only dependent on highly abundant elements of the matrix. The results are listed in the second and fourth columns, respectively, of Table 1.
Enhancement of the isobaric peak at m/q = 56 compared with the surrounding clusters confirms the presence of Fe at location b.
Within error bars the reference peak intensities stay constant between spots a and b, indicating that the laser ablation took place at very similar conditions on both spots. Thus, it can be concluded that this enhancement of the 56 peak at spot b is really due to the contribution of Fe.
Compared with the reference on the matrix spot a, the abundance of 40Ca is enhanced by a factor of 5, supporting the increased presence of Ca carbonates at spot b. However, the interference by the neighboring peaks renders the measurement of the abundance less certain. Also, the second most important isotope 44Ca cannot be measured because of the interference with the SiO+ cluster. Nonetheless, an increased abundance of Ca associated with the organics of spot b would be consistent with previous observations of nanoscale mixing of cellular organic material and carbonates in the Gunflint Formation (Alleon et al., 2016).
The peak at m/q = 24 suggests the presence of Mg on this spot that would be consistent with a dolomitic composition for the aforementioned carbonate (cf. Petrash et al., 2016), but since C is also present in the spectrum, it could also result from a C2 + cluster. The C content at this spot is rather low, so that the formation of Cx and CxHy clusters appears to be a less likely interpretation of this peak. Unfortunately, the SNR of this peak is insufficient to be detected by the peak-finding algorithm (Meyer et al., 2017) and no abundance could be determined for this peak (hence it is missing in Fig. 7).
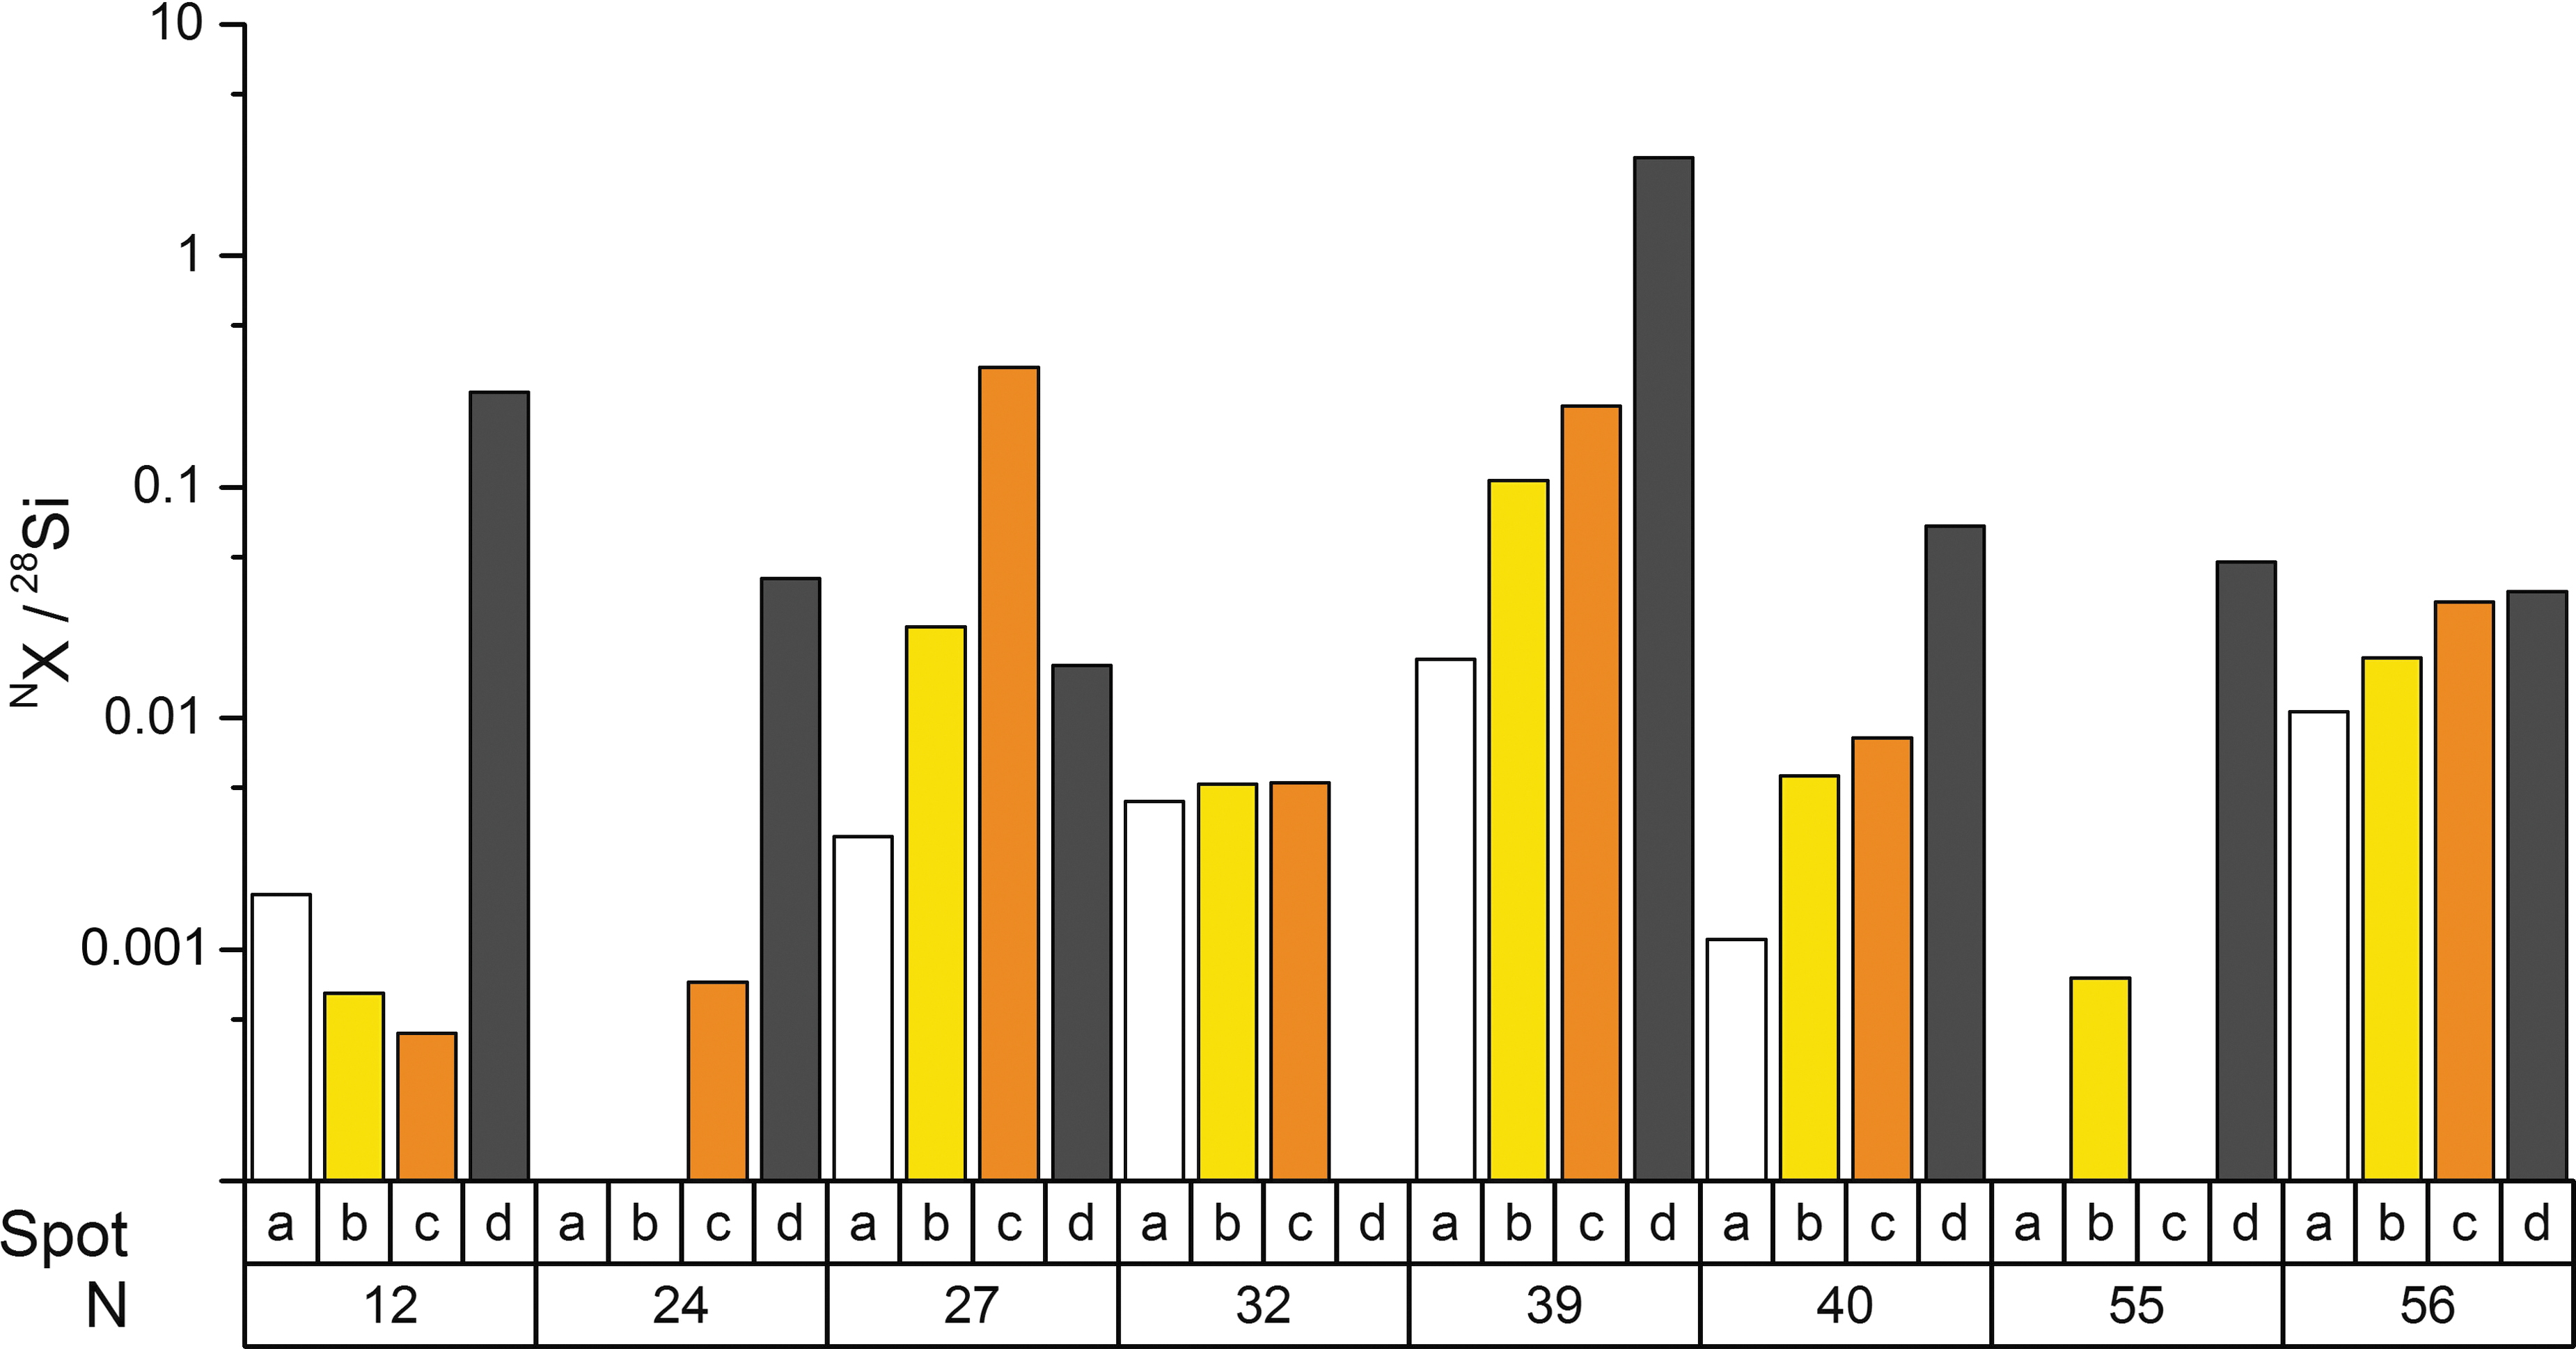
Relative abundances of selected isotopes and clusters 12C+, 24Mg+, 27Al+, 32S+/O2 +, 39K+, 40Ca+, 55Mn+, and 56(Fe+ + Si2 +) on the four sampled spots shown in Figure 5. Missing bars mean that the peak integration failed due to insufficient signal-to-noise ratio. The 32S+/O2 + abundance is similar for the measured spots a, b, and c. The measured abundance of K, Ca, and Fe correlates for spots b and c, suggesting that similar types of microorganisms were present on both spots, but with a larger population on spot c. This is supported by the microscope images. The chemical analysis of d shows a rather different composition to the other spots, which is also supported by the microscope pictures.
We further observed an enhancement of the 27Al abundance on the potential cluster of fossils by a factor of 18, accompanied by significant increases in the 23Na+, 39K+, and 41K+ peaks, suggesting an elevated presence of aluminosilicates. This is consistent with data from other Precambrian microfossil sites where organisms can be partially permineralized by aluminosilicates (Wacey et al., 2014), with evidence from modern settings showing that biofilms may trap detrital clay minerals on their “sticky” extracellular polymeric substances (Riding, 2000) and with evidence for aluminosilicates associated with other Gunflint microfossils (Schelble et al., 2004)
6.3 Spot c (300,000 laser shots, 10 TW/cm2)
The microscope pictures of spots b and c are very similar in terms of color and shapes. The main difference between the two microbial colonies is their size and density. The colony at spot c is >100 μm long, whereas the colony at spot c is only 10–20 μm in length.
The comparison of the mass spectra (Figs. 6 and 7) shows that they are also chemically similar, although not the same. The peak at m/q = 24 is more intense at spot c. This could suggest a higher Mg abundance, presumably from a Ca–Mg carbonate (dolomite) mineral on this spot. However, a contribution from the C2 + cluster seems a more plausible explanation for spot b, since a series of potential CxHy + clusters are also visible in the higher mass range.
The Al/Si ratio is enhanced by a factor of 107 compared with the reference spot a, again consistent with an association of aluminosilicates (probably clay minerals) with microfossils (cf. Wacey et al., 2014). The peak at m/q = 54 can be attributed to a 54Al2 + cluster. A stronger Fe contribution and the presence of 54Fe+ are unlikely since the intensities for the 56Fe+ peaks are comparable with those of spots a and b. The 55Mn+ peak observed at location b is completely absent on this spot, suggesting that only spheroidal and filamentous microorganisms, not the putative Mn-metabolizing star-shaped organisms (cf. Cloud, 1965), are present here.
6.4 Spot d (100,000 laser shots, 10 TW/cm2)
The cluster of microorganisms on spot d has a chemical composition that is significantly different to the reference spot a and subtly different to the microorganism clusters at spots b and c. The measured Na and K abundances are almost as large as the O abundance, and 12C is very abundant. The high abundance of carbon leads to the formation of the typical Cx and CxHy series of clusters at m/q = 24 (Tulej et al., 2015). For this reason, it is not possible to clearly identify minor elements in some parts of the mass spectrum on this spot. However, we do once again note the presence of 55Mn+, and this signal is more intense than at spot b, plus elevated Al, Ca, and Fe (summarized in Fig. 7). Elevated Na, K, Mn, Al, Ca, and Fe are all consistent with the intimate association of organic material with nanograins of carbonates and clay minerals as previously observed with fossiliferous domains of the Gunflint chert (Alleon et al., 2016; Lepot et al., 2017). Of course, the high 12C signal, plus the presence of Cx and CxHy clusters, provides by far the strongest evidence for the detection of microbial fossils at this spot, since 12C is not only commonly preserved within ancient fossilized cell walls (Wacey et al., 2012; Lepot et al., 2017) but can also be retained in fossilized extracellular envelopes (Wacey et al., 2010).
7. Conclusion
In this article we introduce the design of our high vacuum compatible microscope combined with our miniature LIMS system, and its significance for the optical and chemical detection of fossils at micrometer dimensions. We discuss its performance, including the resolving power of 1 μm, and its capability to map samples and acquire mass spectra with a spatial precision of ∼2 μm. The method of targeting samples at precisely defined locations maximizes the scientific output of the measurement campaign. Compared with the traditional rastering method, it also represents a vast increase in measuring efficiency since only regions of interest are sampled. Using the Gunflint chert, serving as a potential Mars analog sample we showed the importance of a system combining mass spectrometry and microscopy for the in situ analysis of fossilized microbes.
We distinguished and sampled four different regions of interest on the Gunflint chert and found a number of potential indicators for the presence of the fossilized microorganisms, based on comparisons of these spectra. These included elevated levels of carbon plus Cx and CxHy clusters, together with elevated levels of elements that the microorganisms could have metabolized (e.g., Mn and Fe). A number of other elements showed higher concentrations in the vicinity of clusters of microbes, but further work is required to understand whether these were concentrated by biological activity or merely passively accumulated in these regions. However, a tentative assignment of the regions to different types of microorganisms including filamentous, spheroidal, and star-shaped specimens was performed.
Footnotes
Acknowledgments
This work is supported by the Swiss National Science Foundation. D.W. is supported by an Australian Research Council Future Fellowship (FT140100321). Prof. Dr. Herbert Shea from EPFL/LMTS is thanked for his support.
Author Disclosure Statement
No competing financial interests exist.